Embed Size (px)
Citation preview
White Paper Analysis of Utility-Managed, On-Site Energy Storage in MinnesotaPresentation Prepared for the Minnesota Department of Commerce, Division of Energy Resources
Presented By:Giovanni Damato, Strategen Consulting
Analysis Support Presented By:Ben Kaun, EPRI
Solar Powering Minnesota at the University of St. ThomasMarch 7, 2014

2
Strategen Core Team
Partners
Technology Specialists
Structured Finance
Controls & Smart Grid
Project Developers
Tariff & Rate Specialists
Corporations / Campuses Exploring Clean Energy Opportunities
Private Equity / VC Firms Investing in Clean Tech
Clean Tech Manufacturers / Service Providers
A sampling of our clients:
We combine strategic thinking with deep industry expertise to create profitable businesses
Strategen Consulting Overview
U.S. Department of Energy
3
● Independent, non-profit, collaborative research institute, with full spectrum industry coverage
○ Nuclear
○ Generation
○ Power Delivery & Utilization
○ Environment & Renewables
● Major offices in Palo Alto, CA; Charlotte, NC; and Knoxville, TN
The Electric Power Research Institute (EPRI)
4
1. Executive Summary
2. Scope of Analysis
3. Results
4. Key Barriers
5. Conclustions & Recommendations
6. Q&A
Agenda
Executive Summary
6
» Climate change has spurred increased societal and political interest to investigate energy efficiency and renewables in Minnesota
» Distributed PV generation is one of the potential renewable options for further investigation
» Storage co-located with PV on the distribution system may have the potential to optimize economic, societal, and environmental impacts to achieve future Minnesota energy goals
» Minnesota currently has several distributed energy storage pilot projects, with many already eligible for the Conservation Improvement Program (CIP)
Context: Minnesota
7
» Grid-Level Benefits▪ Improved Economics: avoided generation and T&D
buildout
▪ Increased Reliability: improved flexibility and resiliency by providing fast, distributed reserves
▪ Improved Environmental Performance: reliably integrate higher penetration levels of solar and wind
» Customer-Level Benefits▪ Bill Savings: demand charge reduction (commercial) or
time-of-use energy saving
▪ Backup Power: outage mitigation, standalone or combined with PV
Context: Key Potential Benefits of Distributed Storage
8
Executive Summary: Key Conclusions
» Utility controlled, customer sited storage in Minnesota has the potential to provide benefits to the grid greater than the storage system’s costs
» Utility controlled, customer sited storage systems may need to capture THREE of the FOUR following key benefits to be economic:
a. Distribution upgrade deferral
b. Frequency regulation
c. System capacity
d. Co-located and configured with PV to capture the Federal Investment Tax Credit (FITC)
» Customer controlled, customer sited storage that relies upon customer tariffs alone did not result in economic value without incentives
9
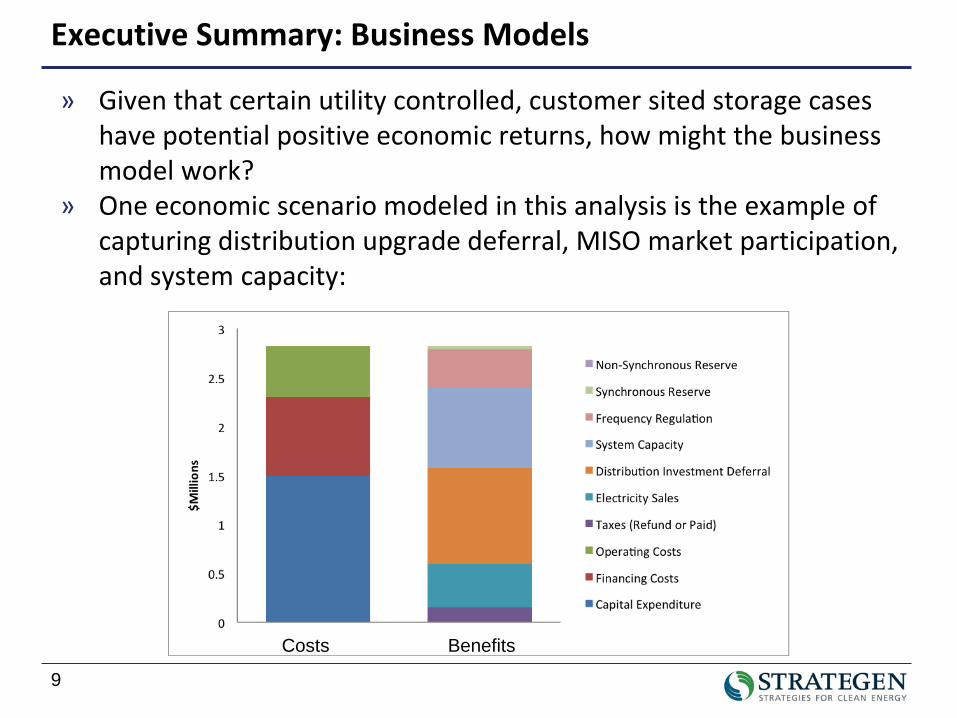
» Given that certain utility controlled, customer sited storage cases have potential positive economic returns, how might the business model work?
» One economic scenario modeled in this analysis is the example of capturing distribution upgrade deferral, MISO market participation, and system capacity:
Executive Summary: Business Models
Costs Benefits
10
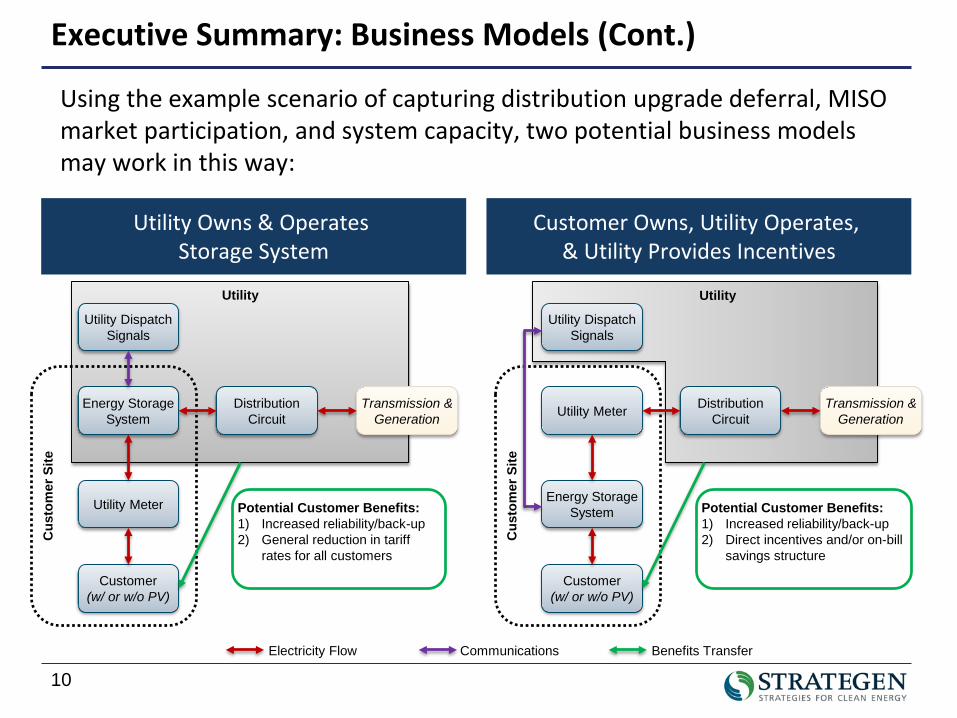
Executive Summary: Business Models (Cont.)
Using the example scenario of capturing distribution upgrade deferral, MISO market participation, and system capacity, two potential business models may work in this way:
Utility Owns & Operates Storage System
Customer Owns, Utility Operates, & Utility Provides Incentives
Electricity Flow Communications Benefits Transfer
Utility
Cus
tom
er S
ite
Customer(w/ or w/o PV)
Utility Meter
Energy Storage System
Utility Dispatch Signals
Distribution Circuit
Transmission & Generation
Potential Customer Benefits:1) Increased reliability/back-up2) General reduction in tariff
rates for all customers
Cus
tom
er S
ite
Customer(w/ or w/o PV)
Energy Storage System
Utility Meter
Utility Dispatch Signals
Distribution Circuit
Transmission & Generation
Potential Customer Benefits:1) Increased reliability/back-up2) Direct incentives and/or on-bill
savings structure
Utility
11
» System-wide operational improvements
» Future grid services such as ramping and flexible capacity
» Improving utility reliability metrics (SAIDI/SAIFI, etc)
» Reducing GHGs
» Job creation
Additional Potential Benefits Outside Study Scope

Scope of Analysis
13
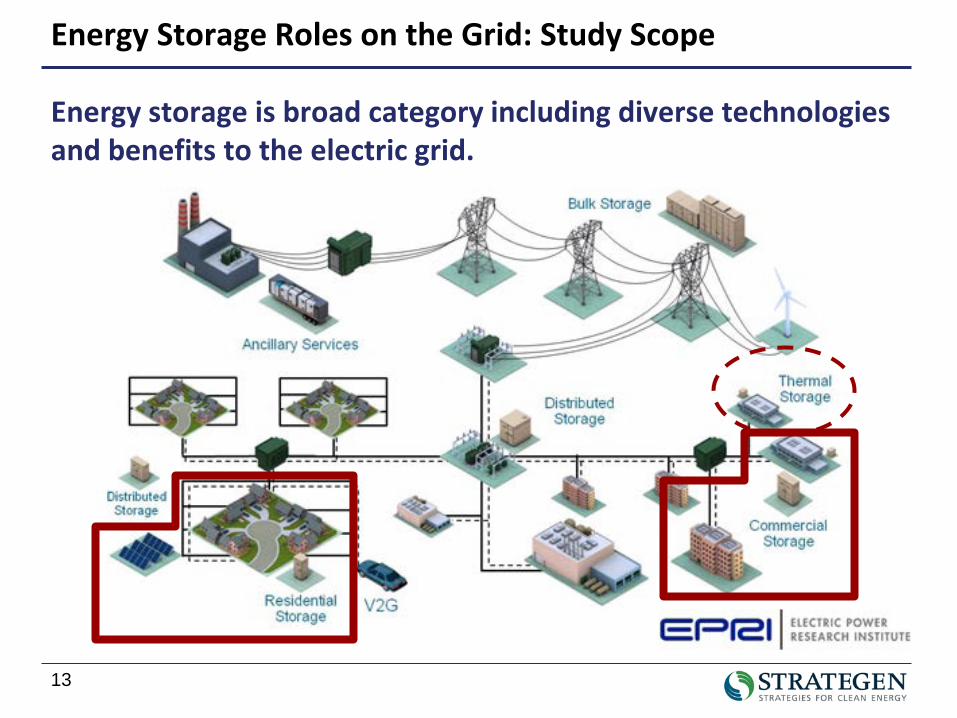
Energy Storage Roles on the Grid: Study Scope
Energy storage is broad category including diverse technologies and benefits to the electric grid.
14
» Does a customer sited energy storage scenario exist that is economical or nearly economical over the project lifetime from the customer or utility perspective, in the 1-3 year time frame?
» If the answer is ‘yes’, what are some of the key factors that affect the cost-effectiveness in those cases?
Pursuant to legislation passed in 2013 (Value of On-Site Energy Storage: MN Laws 2013, Chapter 85 HF 729, Article 12, Section 5),[1] the Minnesota Department of Commerce is required to contract with a qualified contractor to produce a white paper analysis of the potential costs and benefits of installing utility-managed, grid-connected energy storage devices in residential and commercial buildings in Minnesota.
[1] https://www.revisor.leg.state.mn.us/laws/?id=85&doctype=Chapter&year=2013&type=0
Key Analytical Research Questions
15
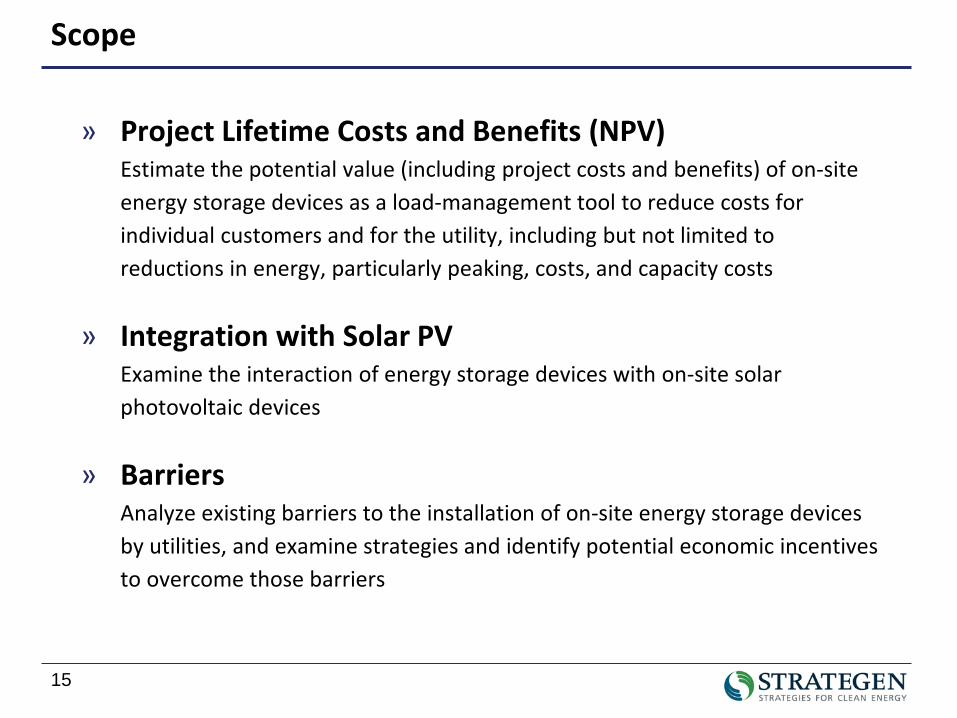
» Project Lifetime Costs and Benefits (NPV)Estimate the potential value (including project costs and benefits) of on-site energy storage devices as a load-management tool to reduce costs for individual customers and for the utility, including but not limited to reductions in energy, particularly peaking, costs, and capacity costs
» Integration with Solar PVExamine the interaction of energy storage devices with on-site solar photovoltaic devices
» BarriersAnalyze existing barriers to the installation of on-site energy storage devices by utilities, and examine strategies and identify potential economic incentives to overcome those barriers
Scope
16
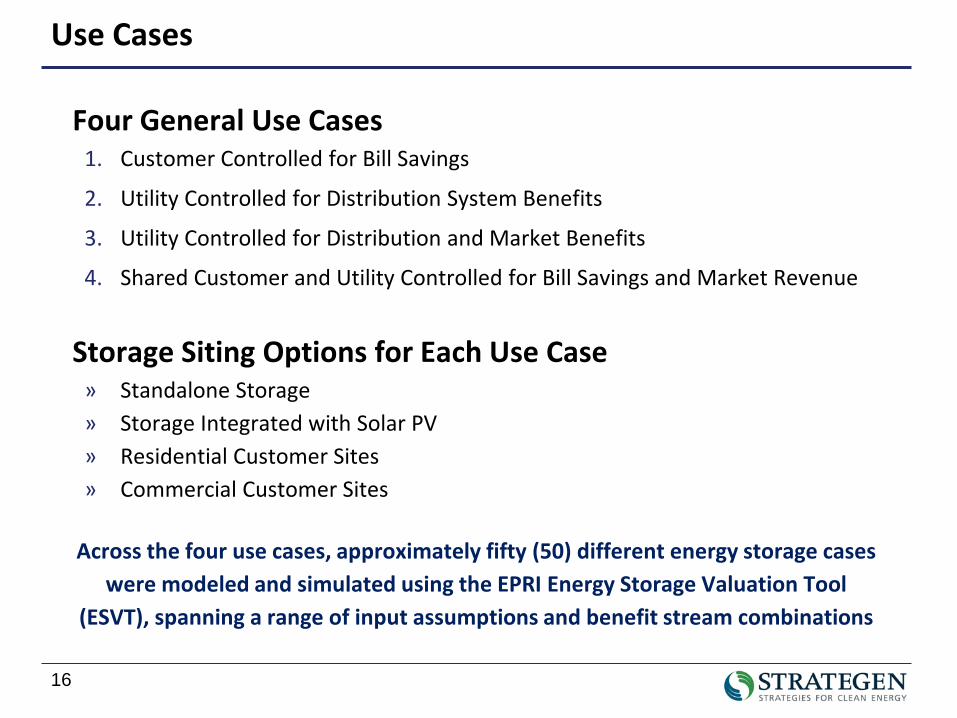
Four General Use Cases1. Customer Controlled for Bill Savings
2. Utility Controlled for Distribution System Benefits
3. Utility Controlled for Distribution and Market Benefits
4. Shared Customer and Utility Controlled for Bill Savings and Market Revenue
Storage Siting Options for Each Use Case» Standalone Storage» Storage Integrated with Solar PV» Residential Customer Sites» Commercial Customer Sites
Across the four use cases, approximately fifty (50) different energy storage cases were modeled and simulated using the EPRI Energy Storage Valuation Tool
(ESVT), spanning a range of input assumptions and benefit stream combinations
Use Cases
17
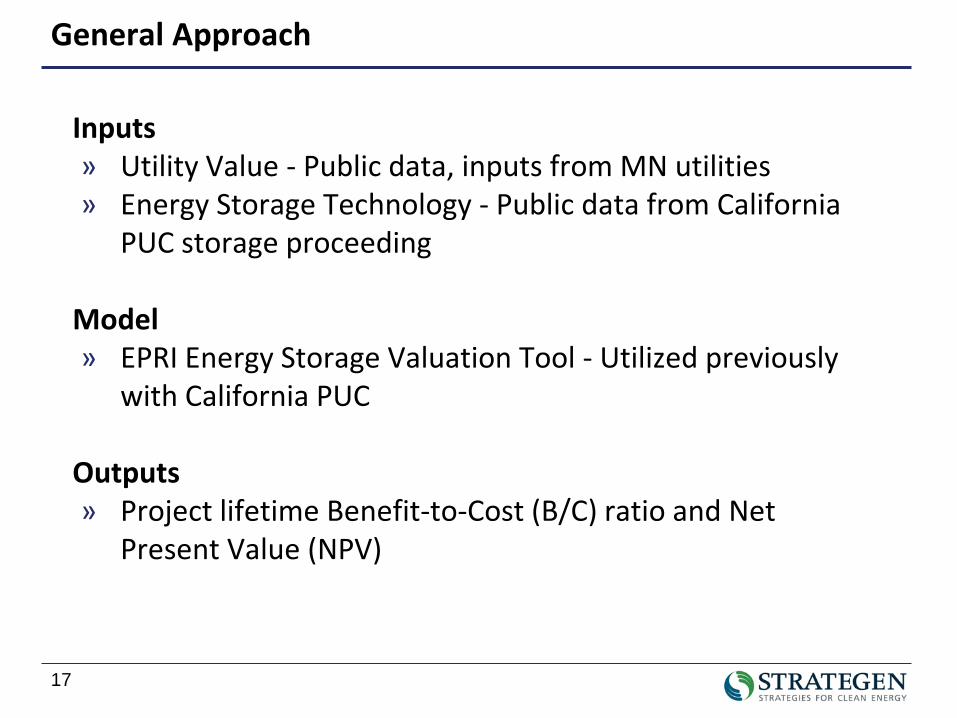
Inputs» Utility Value - Public data, inputs from MN utilities» Energy Storage Technology - Public data from California
PUC storage proceeding
Model» EPRI Energy Storage Valuation Tool - Utilized previously
with California PUC
Outputs» Project lifetime Benefit-to-Cost (B/C) ratio and Net
Present Value (NPV)
General Approach
18
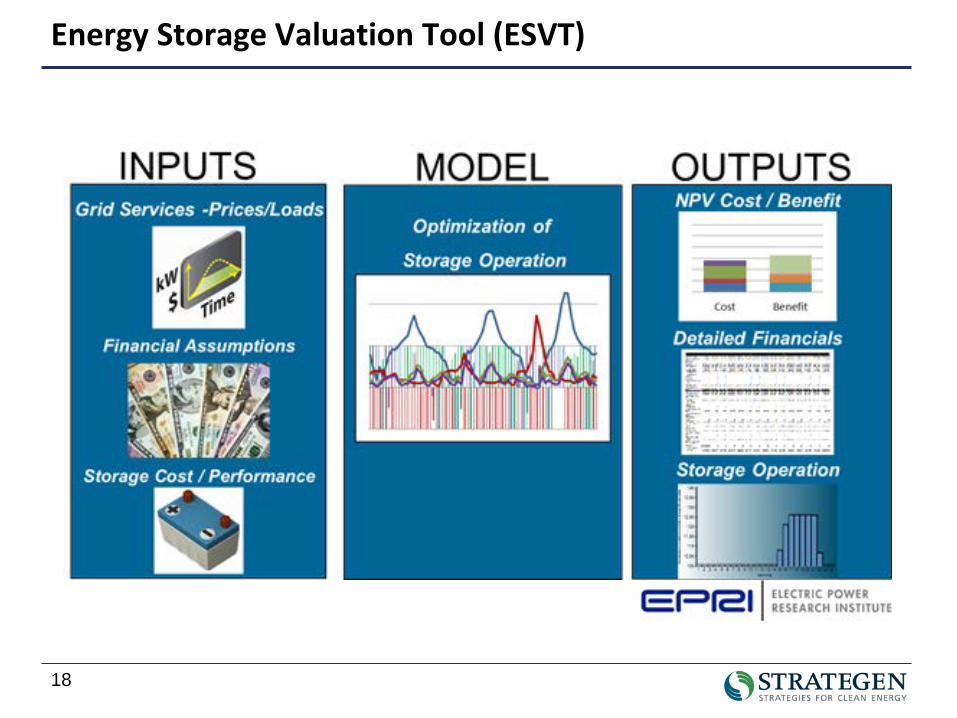
Energy Storage Valuation Tool (ESVT)
19
» Your employer would like you to perform an economic evaluation of new technology
» How would you determine the cost-effectiveness of new cell phone technology?
Answer: Avoided cost and incremental profit(We know now that there is much more…)
1984 Cell Phone Thought Experiment

Results
21
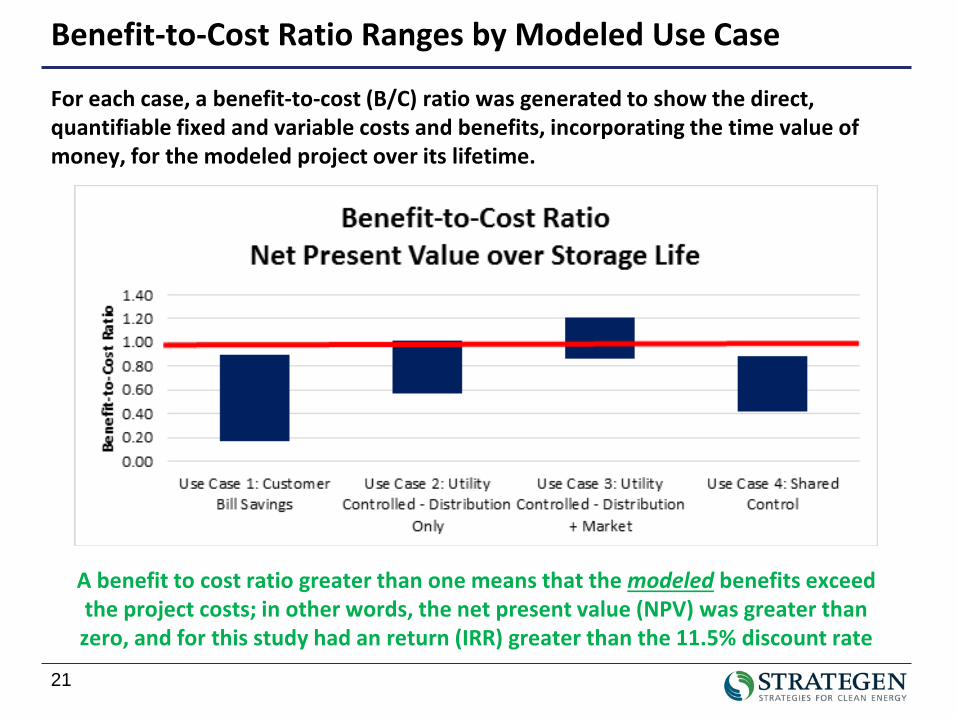
Benefit-to-Cost Ratio Ranges by Modeled Use Case
For each case, a benefit-to-cost (B/C) ratio was generated to show the direct, quantifiable fixed and variable costs and benefits, incorporating the time value of money, for the modeled project over its lifetime.
A benefit to cost ratio greater than one means that the modeled benefits exceed the project costs; in other words, the net present value (NPV) was greater than zero, and for this study had an return (IRR) greater than the 11.5% discount rate
22
» Storage can shift usage (from utility’s perspective) from on-peak (day) to off-peak night▪ Some customers pay varying electric rates by time-of-day
» Storage can “shave peaks” of usage to reduce demand charges▪ Many commercial customers pay a demand charge levied proportional
to peak instantaneous monthly power draw (kW)
» Storage may be available to provide back-up power if configured as a uninterruptible power supply (UPS)
Use Case 1 - Customer-Controlled Storage for Bill Savings
23
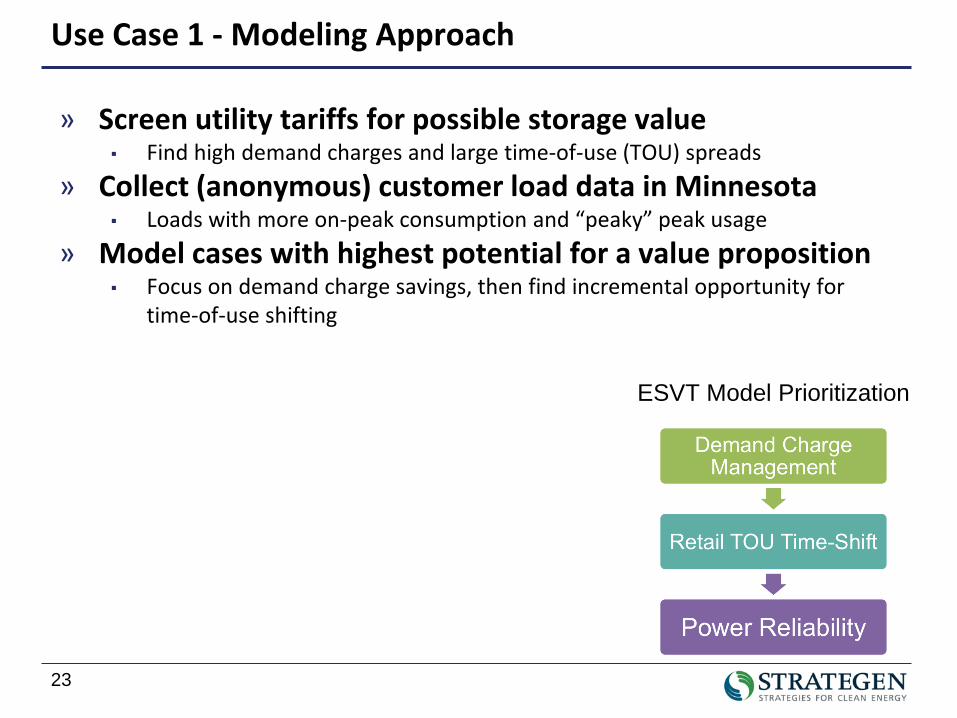
» Screen utility tariffs for possible storage value▪ Find high demand charges and large time-of-use (TOU) spreads
» Collect (anonymous) customer load data in Minnesota▪ Loads with more on-peak consumption and “peaky” peak usage
» Model cases with highest potential for a value proposition▪ Focus on demand charge savings, then find incremental opportunity for
time-of-use shifting
Use Case 1 - Modeling Approach
ESVT Model Prioritization
24
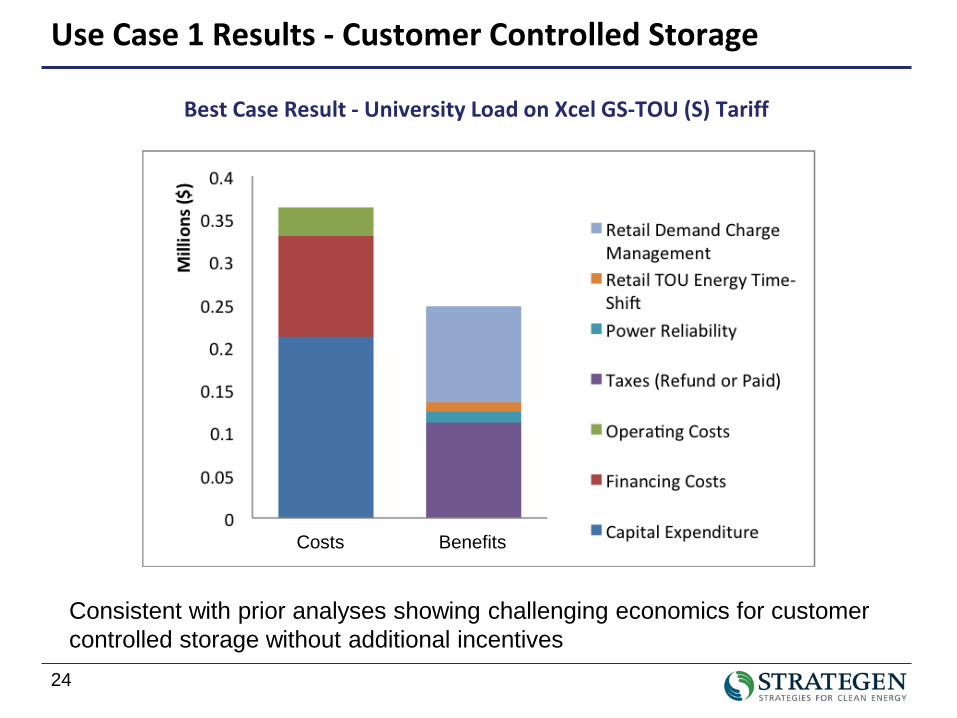
Use Case 1 Results - Customer Controlled Storage
Best Case Result - University Load on Xcel GS-TOU (S) Tariff
Costs Benefits
Consistent with prior analyses showing challenging economics for customer controlled storage without additional incentives
25
» Storage can “shave peaks” from circuit loads to defer or avoid new capital expenditure▪ Substation transformer upgrades can be expensive
» Storage may also provide both real power and reactive power (VARs) to manage high penetration solar▪ Quantification of this benefit not included -- subject of significant research
» Storage may be available to provide utility supplied back-up power if configured as a uninterruptible power supply (UPS)
Use Case 2 - Utility Controlled for Distribution Benefits
26
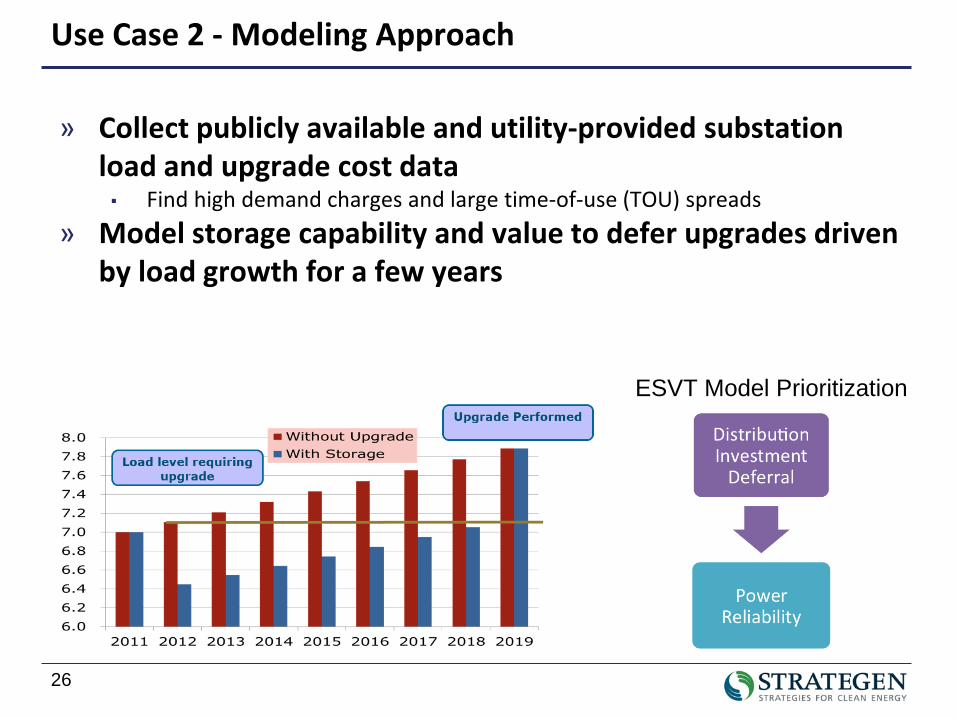
» Collect publicly available and utility-provided substation load and upgrade cost data▪ Find high demand charges and large time-of-use (TOU) spreads
» Model storage capability and value to defer upgrades driven by load growth for a few years
Use Case 2 - Modeling Approach
ESVT Model Prioritization
27
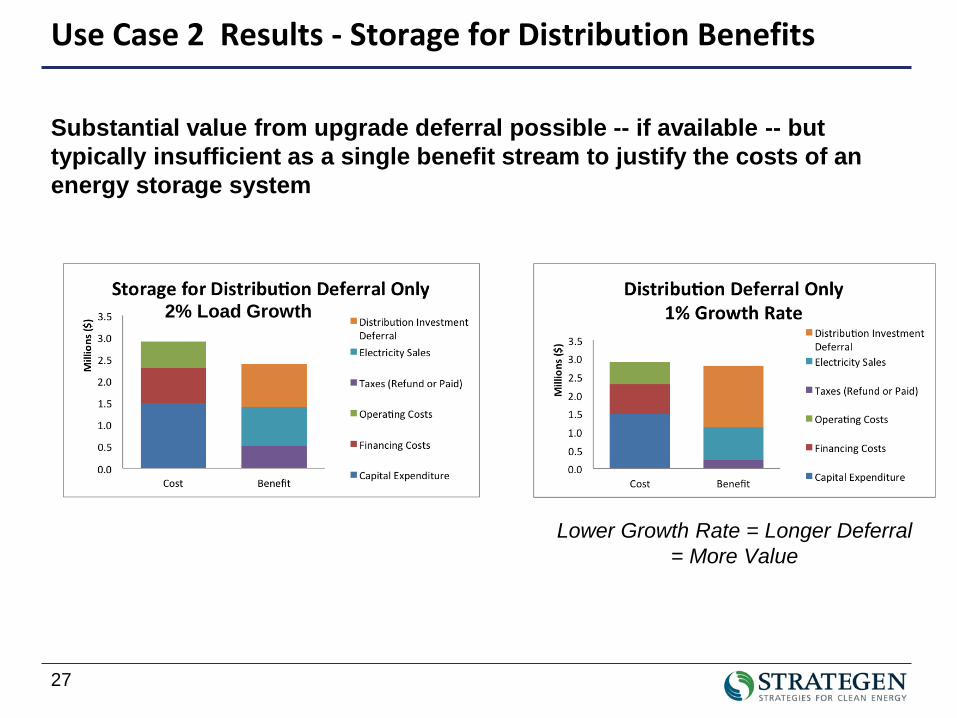
Use Case 2 Results - Storage for Distribution Benefits
Substantial value from upgrade deferral possible -- if available -- but typically insufficient as a single benefit stream to justify the costs of an energy storage system
2% Load Growth
Lower Growth Rate = Longer Deferral = More Value
28
» Builds on prior case with distribution upgrade deferral
» Similar “peak shaving” operation of storage may also offset the buildout of new generation
» Wholesale energy and ancillary services markets provide additional revenue▪ day-ahead energy market
▪ frequency regulation
▪ spinning & non-spinning reserve
Use Case 3 - Storage for Distribution + Market Benefits
29
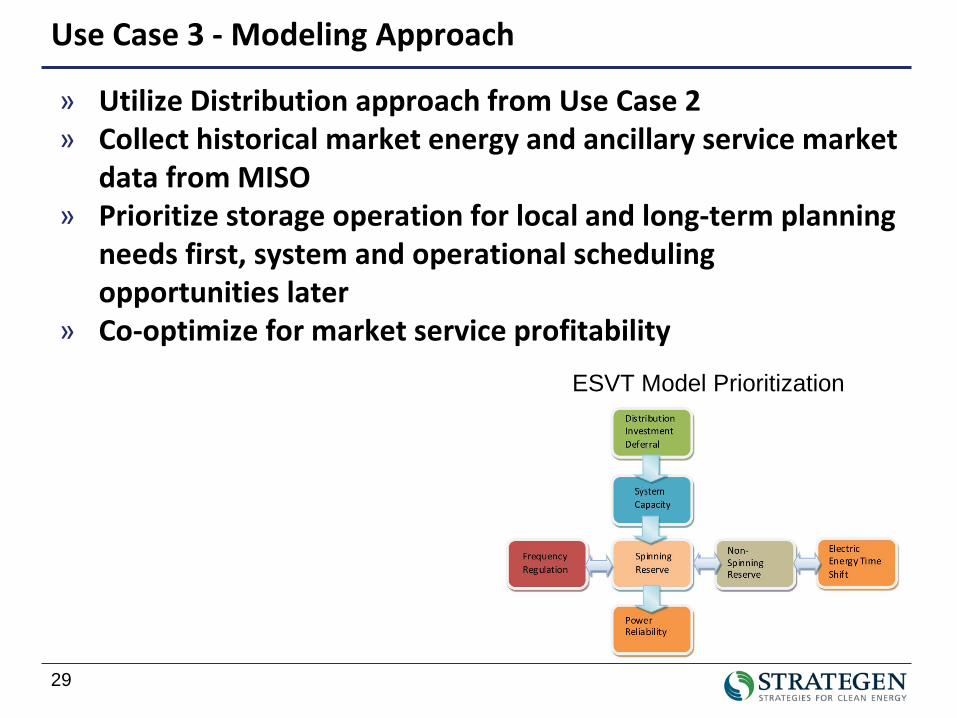
» Utilize Distribution approach from Use Case 2» Collect historical market energy and ancillary service market
data from MISO» Prioritize storage operation for local and long-term planning
needs first, system and operational scheduling opportunities later
» Co-optimize for market service profitability
Use Case 3 - Modeling Approach
ESVT Model Prioritization
30
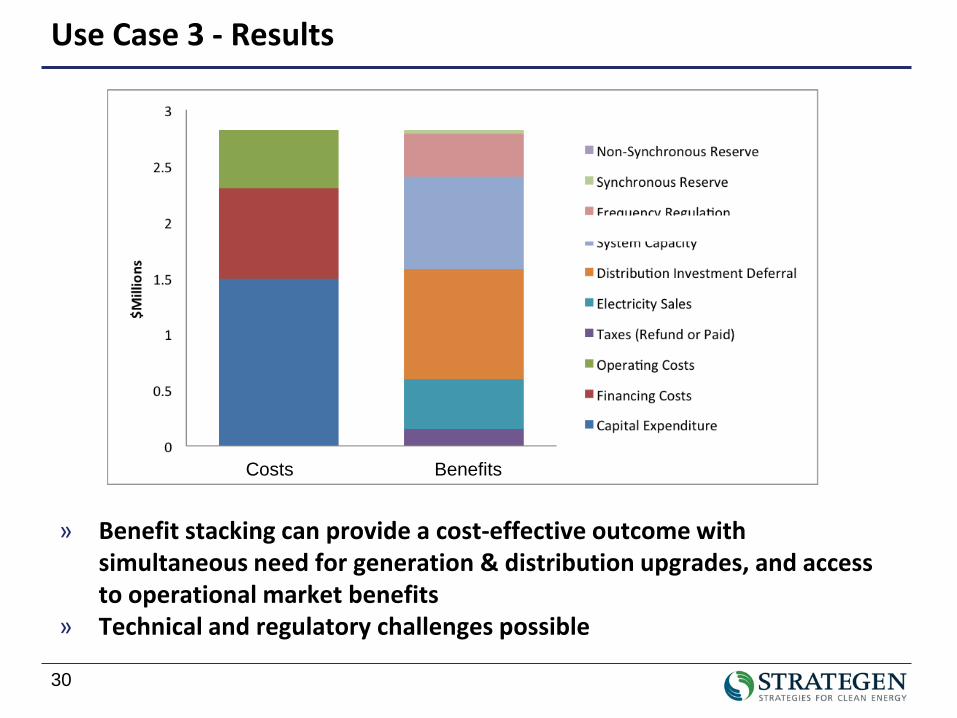
Use Case 3 - Results
Costs Benefits
» Benefit stacking can provide a cost-effective outcome with simultaneous need for generation & distribution upgrades, and access to operational market benefits
» Technical and regulatory challenges possible
31
» Customer demand bill savings top priority » Potential to capture FITC when properly co-located and
configured with a PV system» Market ancillary service value off-peak when customer
isn’t using it
Use Case 4 - Customer + Utility Shared Control
32
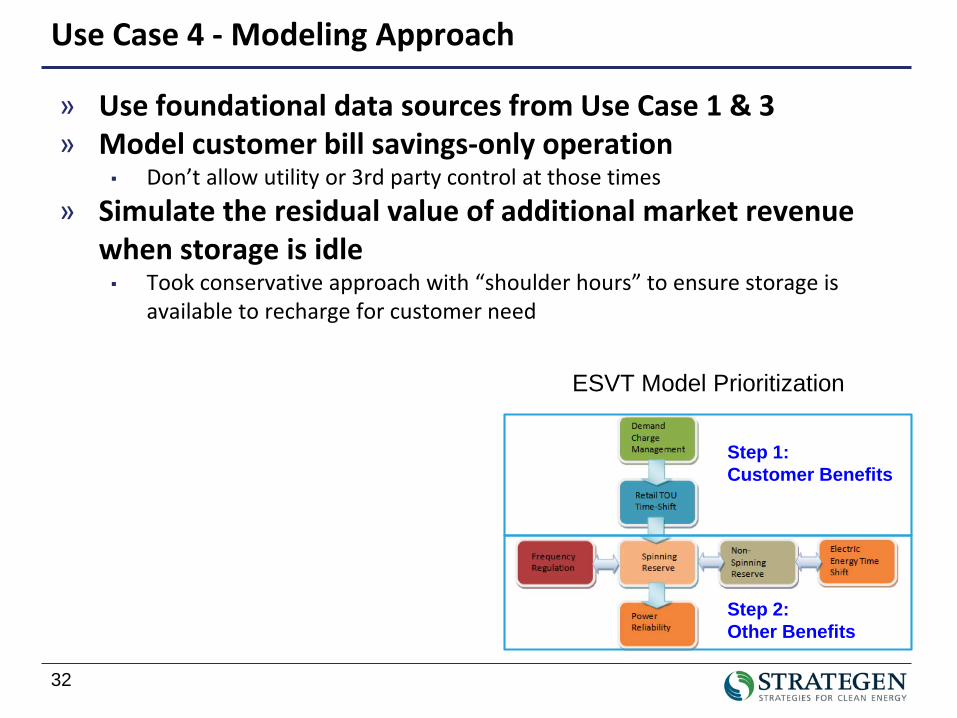
» Use foundational data sources from Use Case 1 & 3» Model customer bill savings-only operation
▪ Don’t allow utility or 3rd party control at those times» Simulate the residual value of additional market revenue
when storage is idle▪ Took conservative approach with “shoulder hours” to ensure storage is
available to recharge for customer need
Use Case 4 - Modeling Approach
Step 1:Customer Benefits
Step 2:Other Benefits
ESVT Model Prioritization
33
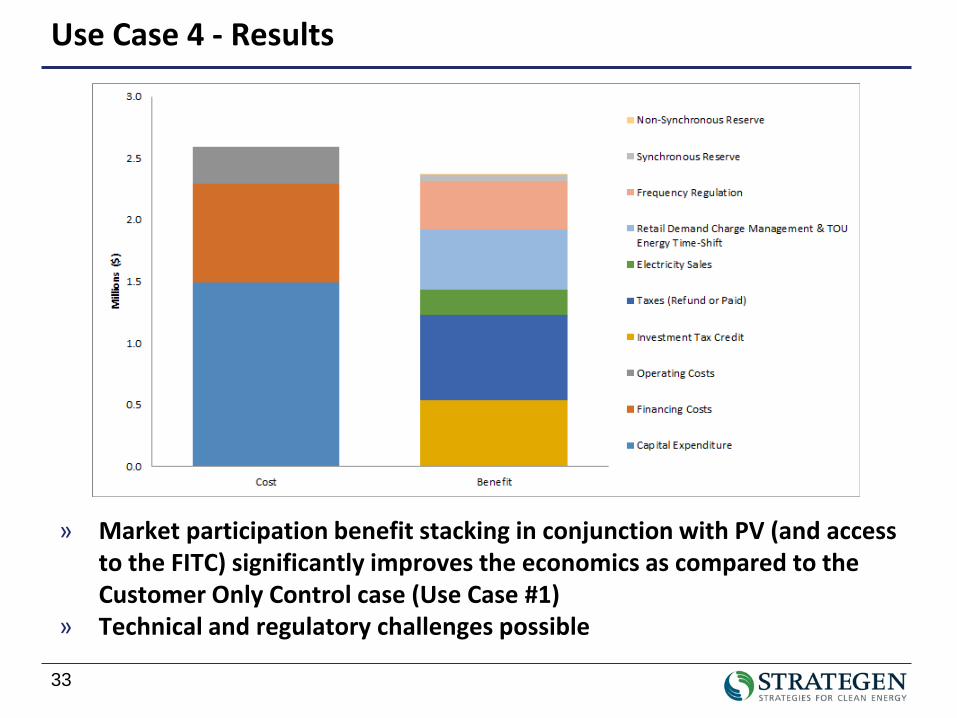
Use Case 4 - Results
» Market participation benefit stacking in conjunction with PV (and access to the FITC) significantly improves the economics as compared to the Customer Only Control case (Use Case #1)
» Technical and regulatory challenges possible
34
» Current tariffs in Minnesota do not show clear customer ownership benefit
» Cost-effective cases stacked multiple major benefits, including distribution deferral, system capacity, frequency regulation, and solar investment tax credit▪ Benefit stacking may have near-term technical and regulatory challenges
» Existence of distribution deferral and system capacity is limited by “need”, defined in utility IRP and distribution planning processes▪ Typically requires load growth
» New storage “need” may emerge when new flexibility constraints arise from large penetrations of wind & solar▪ California is working to develop new tools and methods to plan for flexibility
need and assess resources
Overall Modeling Conclusions
35
Scope Limitations
1. Investigated a subset of possible battery storage technology configurations. Did NOT include:▪ Flow batteries▪ Flywheels▪ Traditional lead acid batteries▪ Modular compressed air energy storage (CAES)
2. Modeling was not exhaustive of all potential uses or scenarios
3. Excluded modeling of thermal energy storage (e.g. electric water heaters)
4. Excluded indirect or societal benefits (e.g. GHG reductions, job creation, improved grid operations, etc.)
5. Excluded conventional Uninterruptible Power Supply (UPS) case
6. Excluded secondary impacts of energy storage deployments to market prices (e.g. price suppression from competition)
36
» Over 50 cases investigated across the 4 use cases
» Links to White Paper & Appendices:▪ http://mn.gov/commerce/energy/images/MNStorageStu
dy-2014-01-03-final.pdf
▪ http://mn.gov/commerce/energy/images/MNStorage-Study-Model-Inputs-2013-12-27.xls
▪ http://mn.gov/commerce/energy/images/MNStorage-Study-Model-Outputs-2013-12-27.xls
Full Results in Minnesota Dept of Commerce Report

Key Barriers
38
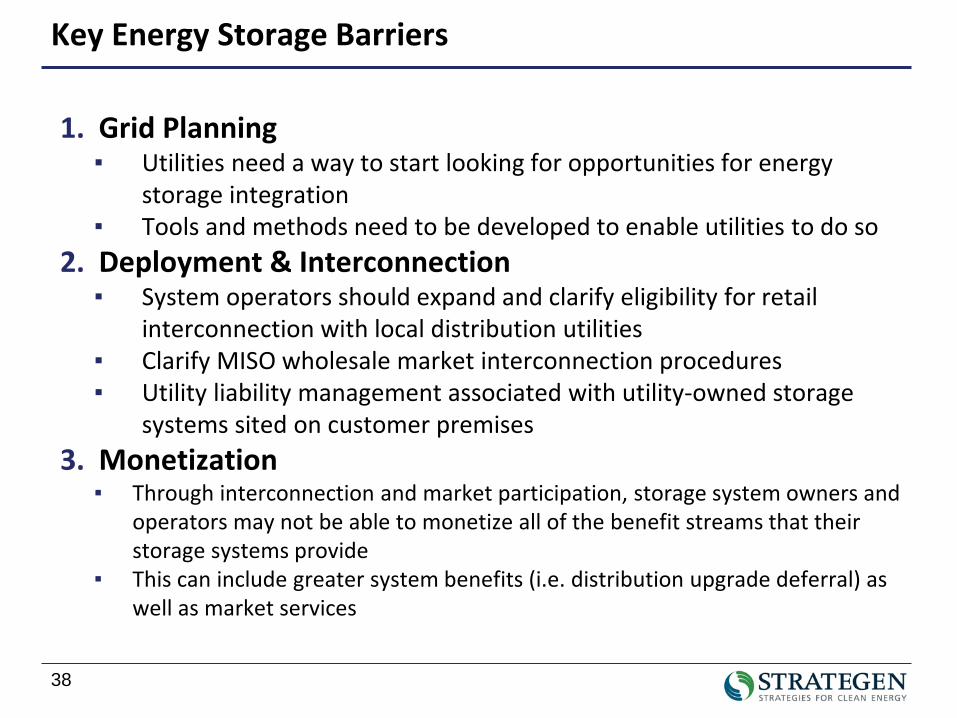
Key Energy Storage Barriers
1. Grid Planning▪ Utilities need a way to start looking for opportunities for energy
storage integration▪ Tools and methods need to be developed to enable utilities to do so
2. Deployment & Interconnection▪ System operators should expand and clarify eligibility for retail
interconnection with local distribution utilities▪ Clarify MISO wholesale market interconnection procedures ▪ Utility liability management associated with utility-owned storage
systems sited on customer premises3. Monetization
▪ Through interconnection and market participation, storage system owners and operators may not be able to monetize all of the benefit streams that their storage systems provide
▪ This can include greater system benefits (i.e. distribution upgrade deferral) as well as market services
39
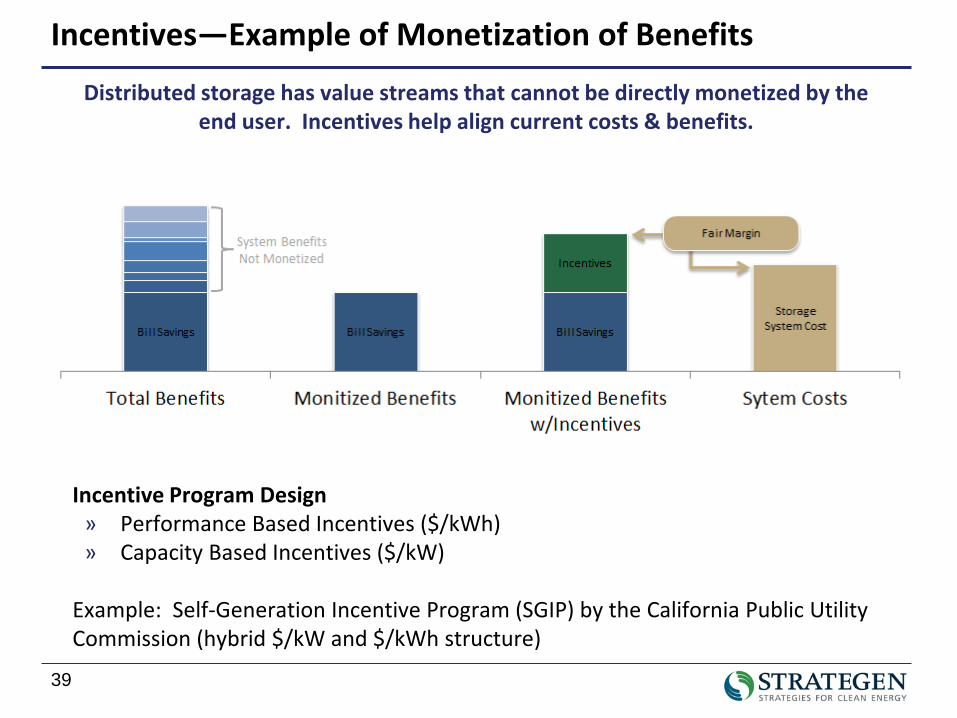
Incentives—Example of Monetization of Benefits
Distributed storage has value streams that cannot be directly monetized by the end user. Incentives help align current costs & benefits.
Incentive Program Design» Performance Based Incentives ($/kWh)» Capacity Based Incentives ($/kW)
Example: Self-Generation Incentive Program (SGIP) by the California Public Utility Commission (hybrid $/kW and $/kWh structure)

Conclusions & Recommendations
41
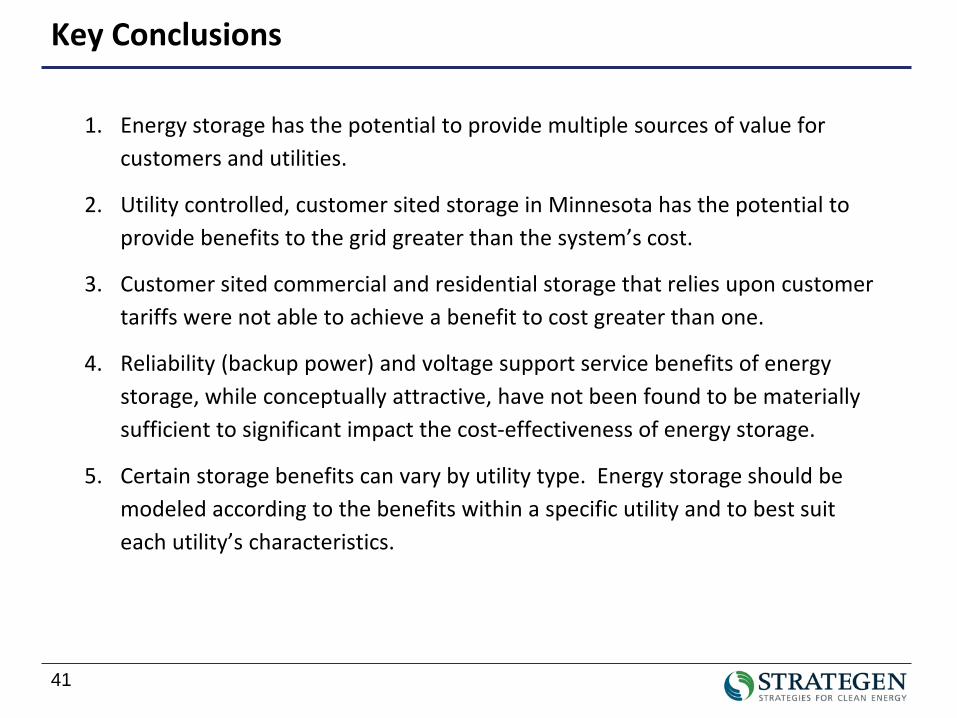
Key Conclusions
1. Energy storage has the potential to provide multiple sources of value for customers and utilities.
2. Utility controlled, customer sited storage in Minnesota has the potential to provide benefits to the grid greater than the system’s cost.
3. Customer sited commercial and residential storage that relies upon customer tariffs were not able to achieve a benefit to cost greater than one.
4. Reliability (backup power) and voltage support service benefits of energy storage, while conceptually attractive, have not been found to be materially sufficient to significant impact the cost-effectiveness of energy storage.
5. Certain storage benefits can vary by utility type. Energy storage should be modeled according to the benefits within a specific utility and to best suit each utility’s characteristics.
42
Recommendations
1. Conduct Further Studies
2. Establish Utility Planning Procedures
3. Establish Pilot Projects
4. Perform Financial Due Diligence
5. Establish Clear MISO Processes
6. Consider Alternative Rate Structures
7. Define System Ownership/Control
8. Further Evaluate Standalone Energy Storage Located at Distribution Substations
Questions?
2150 Allston Way, Suite 210Berkeley, CA 94704
(510) 665-7811www.strategen.com
Links to White Paper & Appendices:
▪ http://mn.gov/commerce/energy/images/MNStorageStudy-2014-01-03-final.pdf
▪ http://mn.gov/commerce/energy/images/MNStorage-Study-Model-Inputs-2013-12-27.xls
▪ http://mn.gov/commerce/energy/images/MNStorage-Study-Model-Outputs-2013-12-27.xls

Appendix

Appendix I: About Strategen & EPRI
46
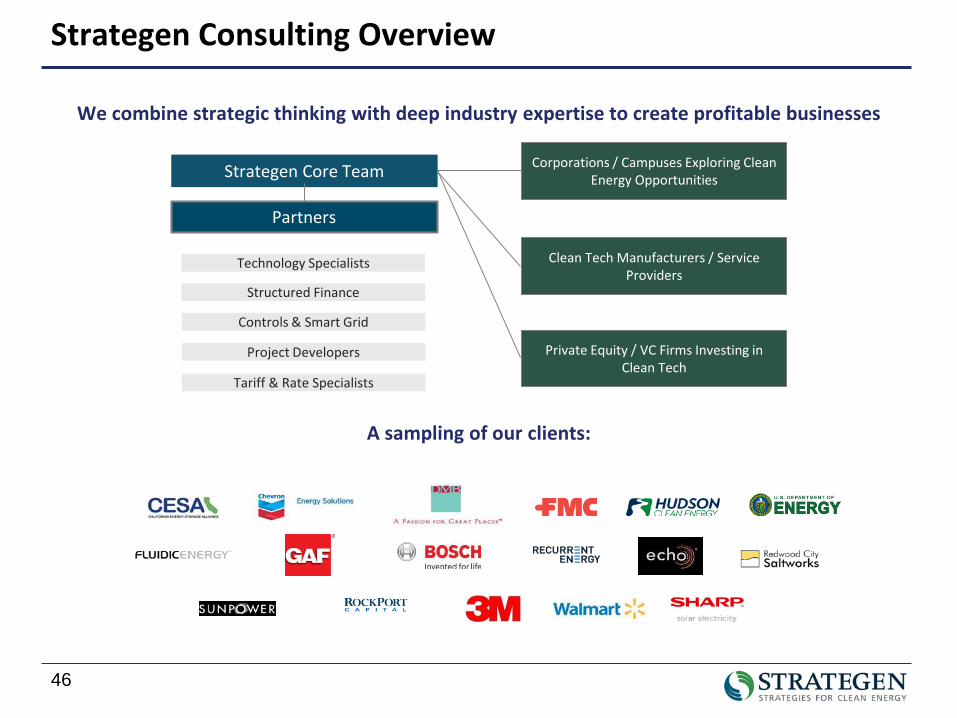
Strategen Core Team
Partners
Technology Specialists
Structured Finance
Controls & Smart Grid
Project Developers
Tariff & Rate Specialists
Corporations / Campuses Exploring Clean Energy Opportunities
Private Equity / VC Firms Investing in Clean Tech
Clean Tech Manufacturers / Service Providers
A sampling of our clients:
We combine strategic thinking with deep industry expertise to create profitable businesses
Strategen Consulting Overview
47
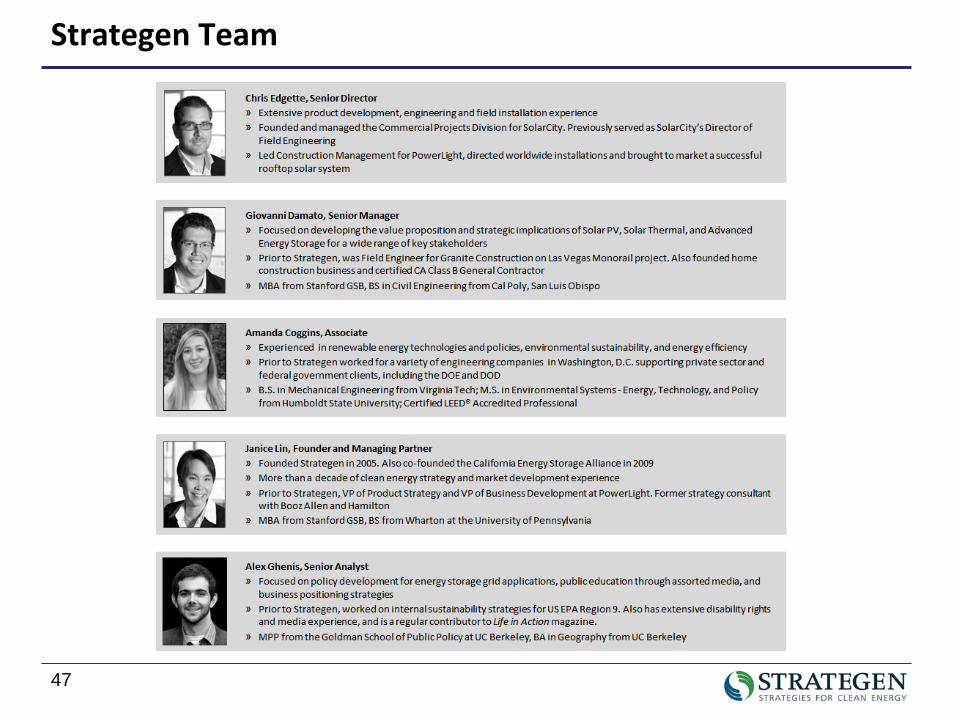
Strategen Team
48
● Independent, non-profit, collaborative research institute, with full spectrum industry coverage
○ Nuclear
○ Generation
○ Power Delivery & Utilization
○ Environment & Renewables
● Major offices in Palo Alto, CA; Charlotte, NC; and Knoxville, TN
The Electric Power Research Institute (EPRI)
49
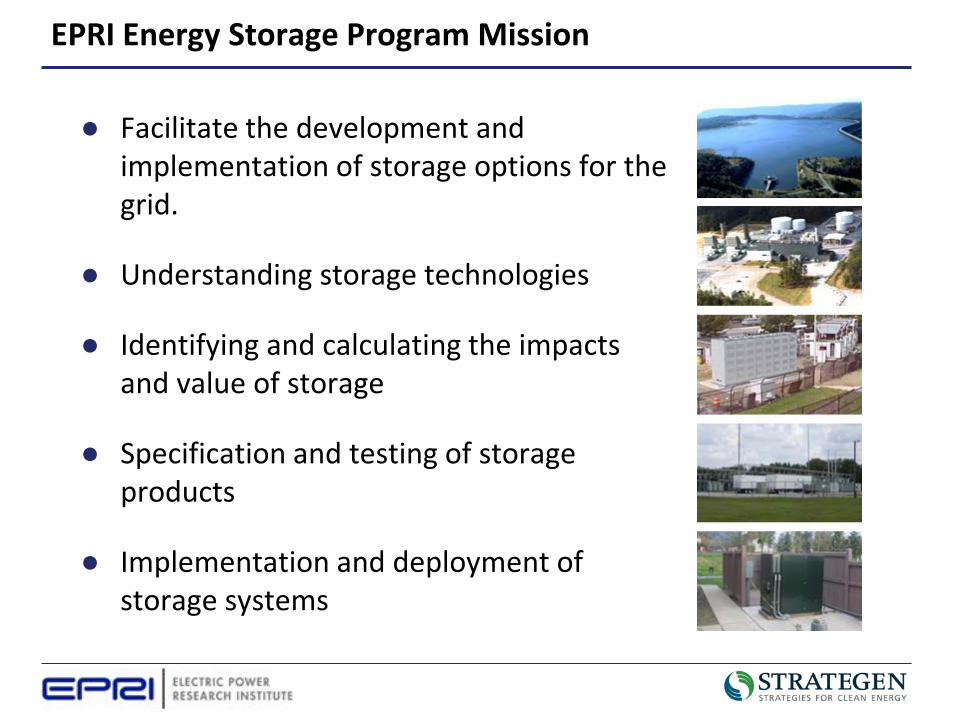
● Facilitate the development and implementation of storage options for the grid.
● Understanding storage technologies
● Identifying and calculating the impacts and value of storage
● Specification and testing of storage products
● Implementation and deployment of storage systems
EPRI Energy Storage Program Mission
50
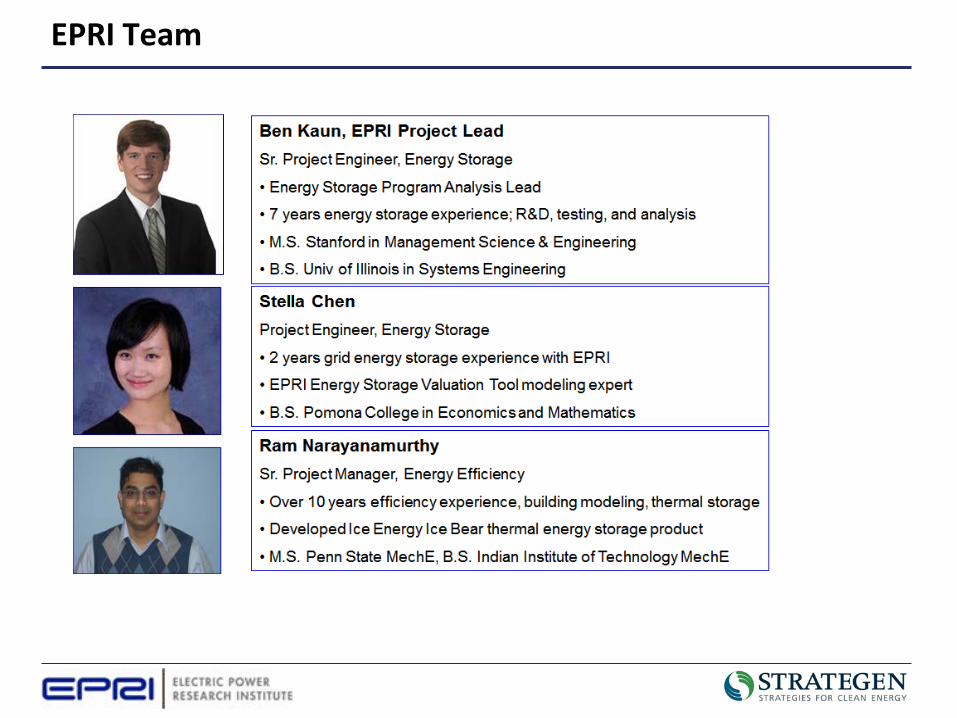
EPRI Team
Appendix II: Energy Storage Background
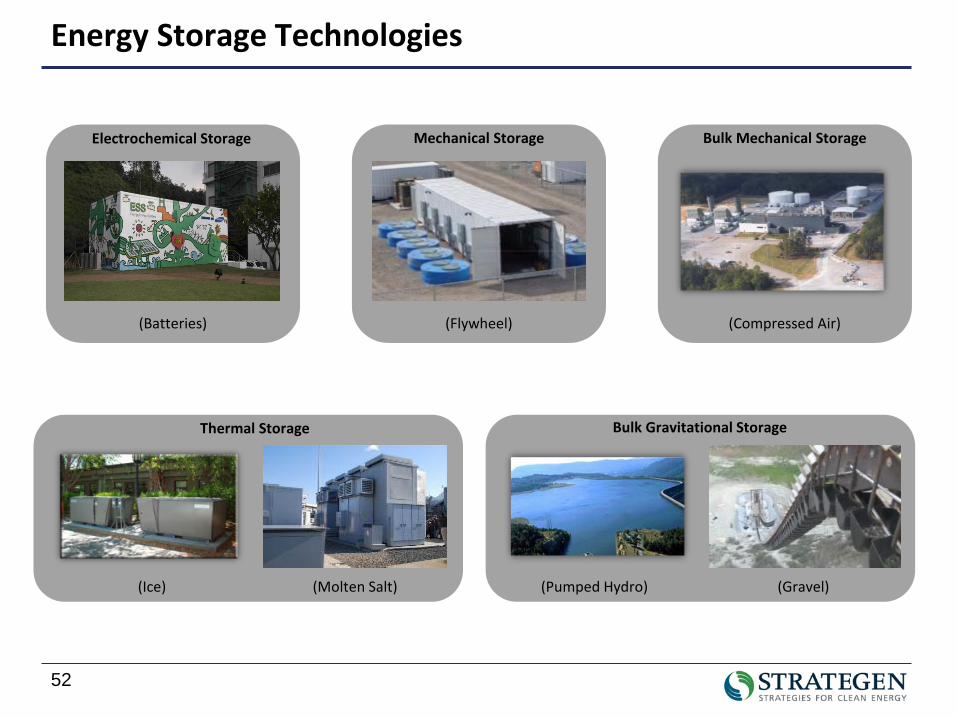
52
Electrochemical Storage
(Batteries)
Mechanical Storage
(Flywheel)
Bulk Mechanical Storage
(Compressed Air)
Thermal Storage
(Ice) (Molten Salt)
Bulk Gravitational Storage
(Pumped Hydro) (Gravel)
Energy Storage Technologies
53
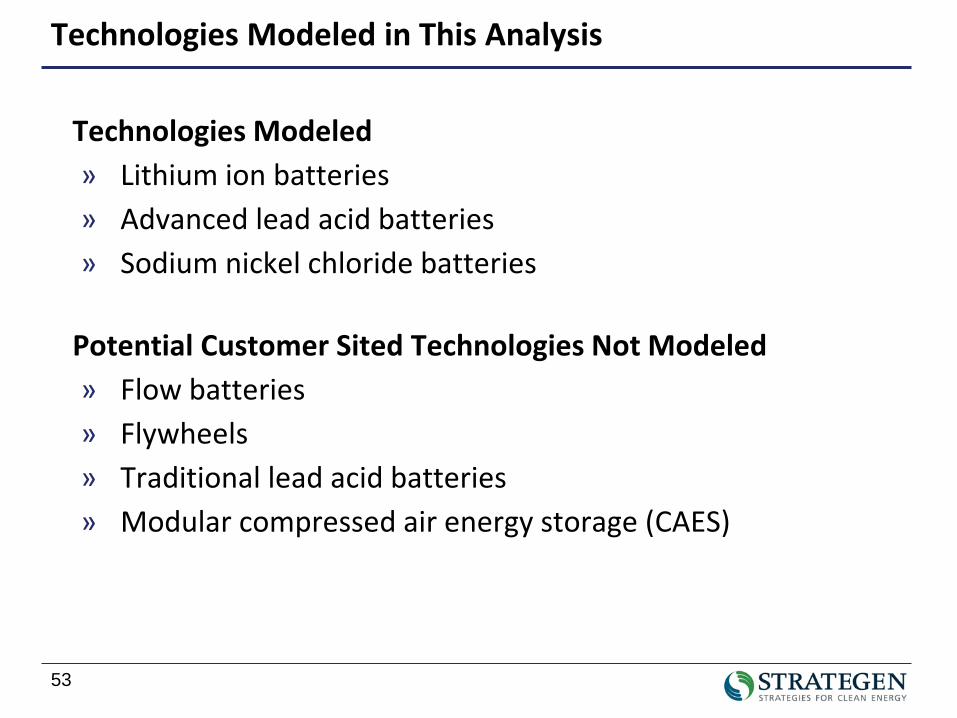
Technologies Modeled in This Analysis
Technologies Modeled» Lithium ion batteries» Advanced lead acid batteries» Sodium nickel chloride batteries
Potential Customer Sited Technologies Not Modeled» Flow batteries» Flywheels» Traditional lead acid batteries» Modular compressed air energy storage (CAES)
54
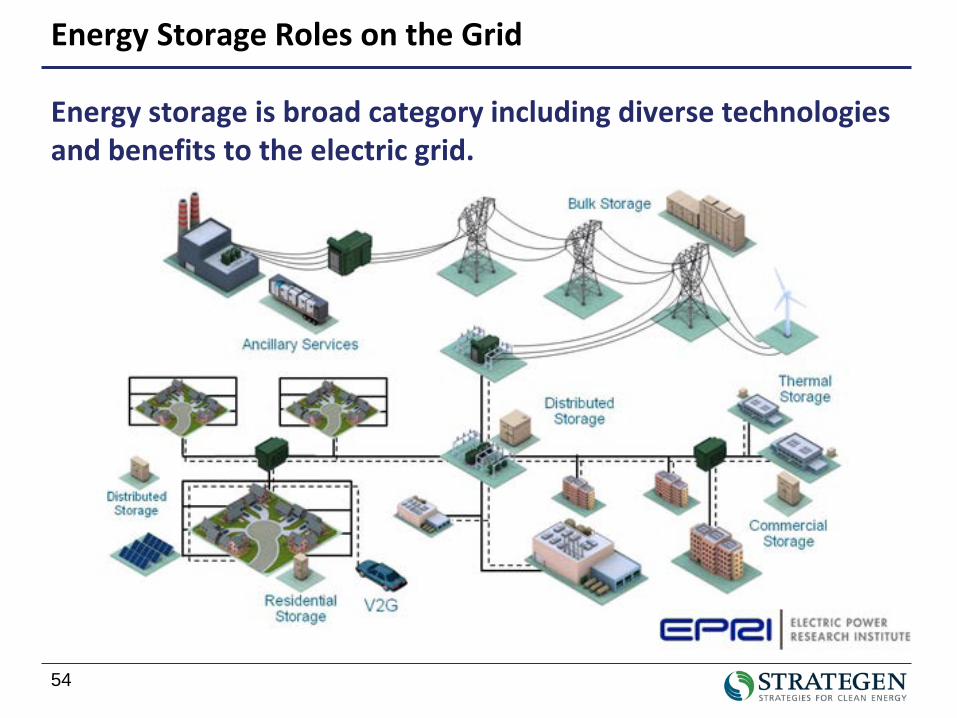
Energy Storage Roles on the Grid
Energy storage is broad category including diverse technologies and benefits to the electric grid.
55
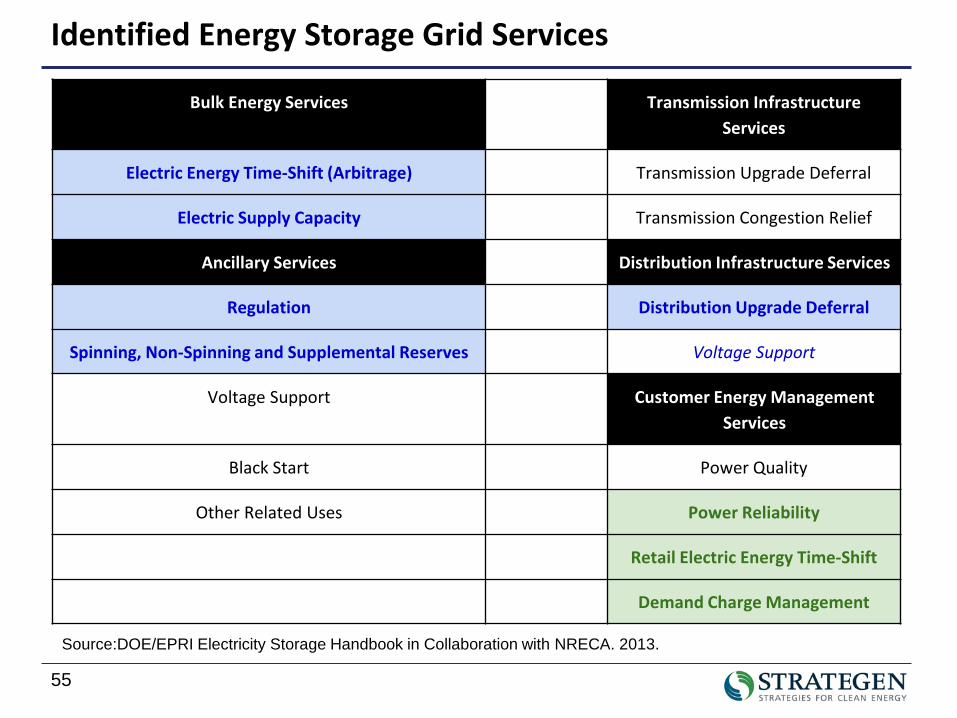
Identified Energy Storage Grid Services
Bulk Energy Services Transmission Infrastructure Services
Electric Energy Time-Shift (Arbitrage) Transmission Upgrade Deferral
Electric Supply Capacity Transmission Congestion Relief
Ancillary Services Distribution Infrastructure Services
Regulation Distribution Upgrade Deferral
Spinning, Non-Spinning and Supplemental Reserves Voltage Support
Voltage Support Customer Energy Management Services
Black Start Power Quality
Other Related Uses Power Reliability
Retail Electric Energy Time-Shift
Demand Charge Management
Source:DOE/EPRI Electricity Storage Handbook in Collaboration with NRECA. 2013.

Appendix III: Results Details
57
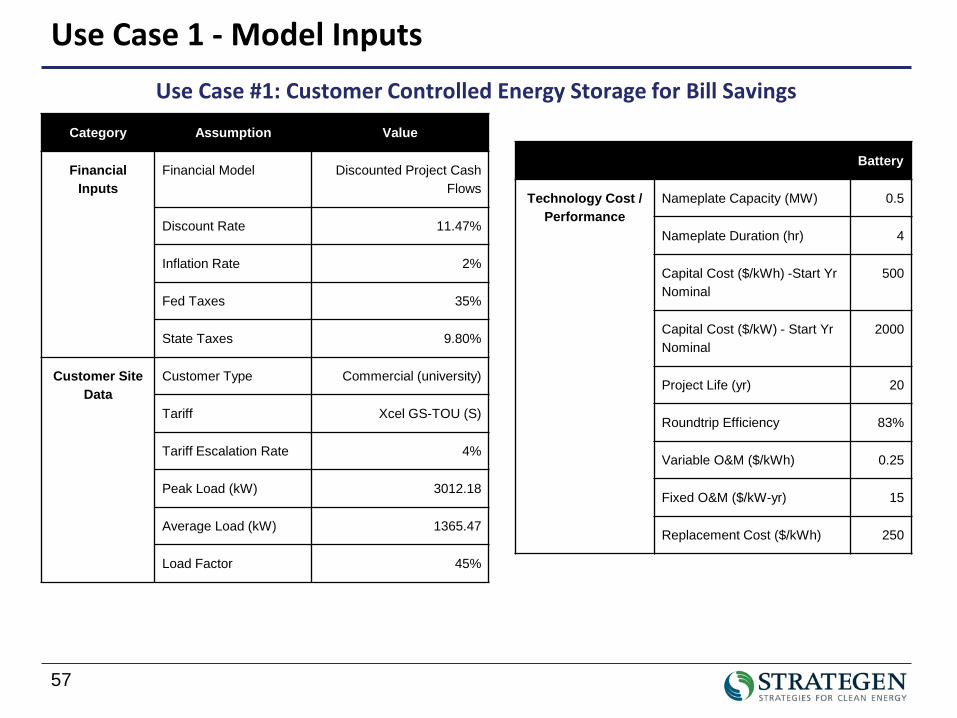
Use Case 1 - Model Inputs
Category Assumption Value
Financial Inputs
Financial Model Discounted Project Cash Flows
Discount Rate 11.47%
Inflation Rate 2%
Fed Taxes 35%
State Taxes 9.80%
Customer Site Data
Customer Type Commercial (university)
Tariff Xcel GS-TOU (S)
Tariff Escalation Rate 4%
Peak Load (kW) 3012.18
Average Load (kW) 1365.47
Load Factor 45%
Battery
Technology Cost / Performance
Nameplate Capacity (MW) 0.5
Nameplate Duration (hr) 4
Capital Cost ($/kWh) -Start Yr Nominal
500
Capital Cost ($/kW) - Start Yr Nominal
2000
Project Life (yr) 20
Roundtrip Efficiency 83%
Variable O&M ($/kWh) 0.25
Fixed O&M ($/kW-yr) 15
Replacement Cost ($/kWh) 250
Use Case #1: Customer Controlled Energy Storage for Bill Savings
58
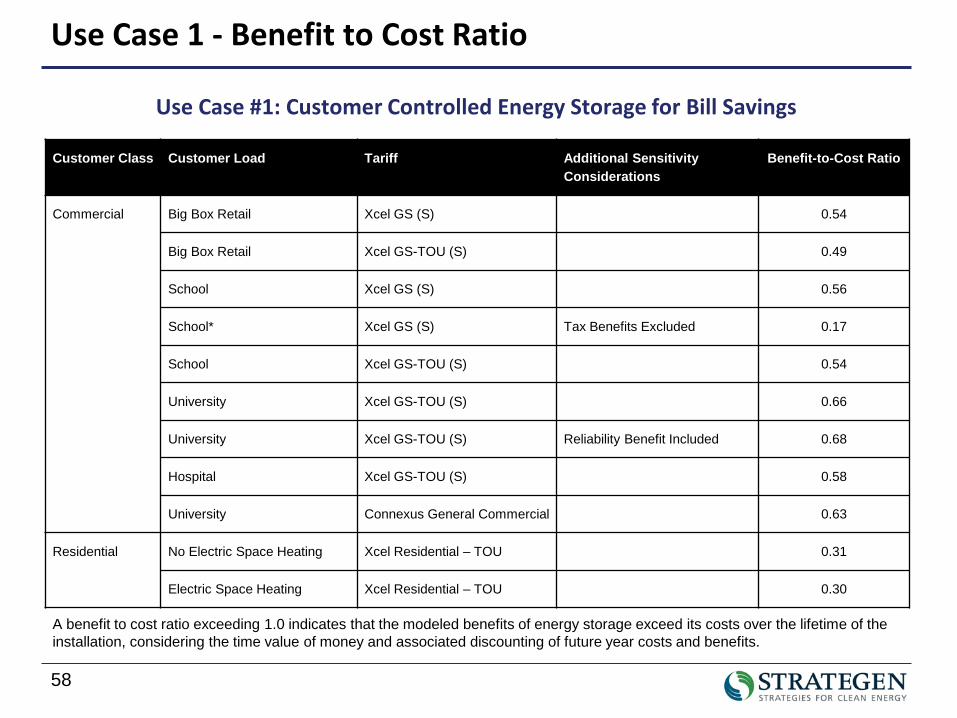
Use Case 1 - Benefit to Cost Ratio
Customer Class Customer Load Tariff Additional Sensitivity Considerations
Benefit-to-Cost Ratio
Commercial Big Box Retail Xcel GS (S) 0.54
Big Box Retail Xcel GS-TOU (S) 0.49
School Xcel GS (S) 0.56
School* Xcel GS (S) Tax Benefits Excluded 0.17
School Xcel GS-TOU (S) 0.54
University Xcel GS-TOU (S) 0.66
University Xcel GS-TOU (S) Reliability Benefit Included 0.68
Hospital Xcel GS-TOU (S) 0.58
University Connexus General Commercial 0.63
Residential No Electric Space Heating Xcel Residential – TOU 0.31
Electric Space Heating Xcel Residential – TOU 0.30
A benefit to cost ratio exceeding 1.0 indicates that the modeled benefits of energy storage exceed its costs over the lifetime of the installation, considering the time value of money and associated discounting of future year costs and benefits.
Use Case #1: Customer Controlled Energy Storage for Bill Savings
59
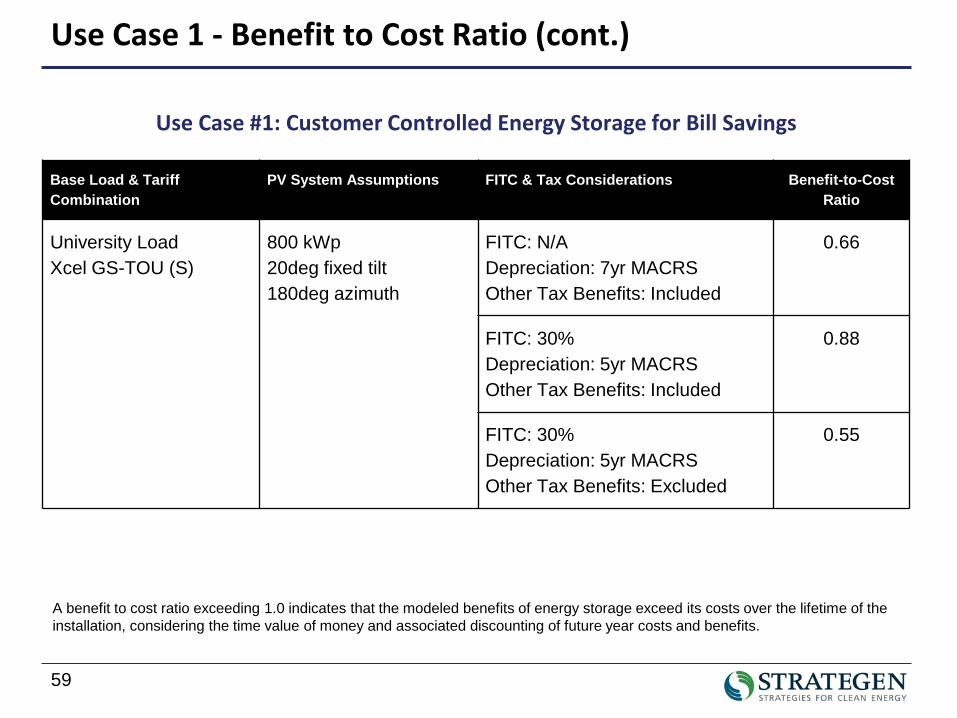
Use Case 1 - Benefit to Cost Ratio (cont.)
Base Load & Tariff Combination
PV System Assumptions FITC & Tax Considerations Benefit-to-Cost Ratio
University LoadXcel GS-TOU (S)
800 kWp20deg fixed tilt180deg azimuth
FITC: N/ADepreciation: 7yr MACRSOther Tax Benefits: Included
0.66
FITC: 30%Depreciation: 5yr MACRSOther Tax Benefits: Included
0.88
FITC: 30%Depreciation: 5yr MACRSOther Tax Benefits: Excluded
0.55
A benefit to cost ratio exceeding 1.0 indicates that the modeled benefits of energy storage exceed its costs over the lifetime of the installation, considering the time value of money and associated discounting of future year costs and benefits.
Use Case #1: Customer Controlled Energy Storage for Bill Savings
60
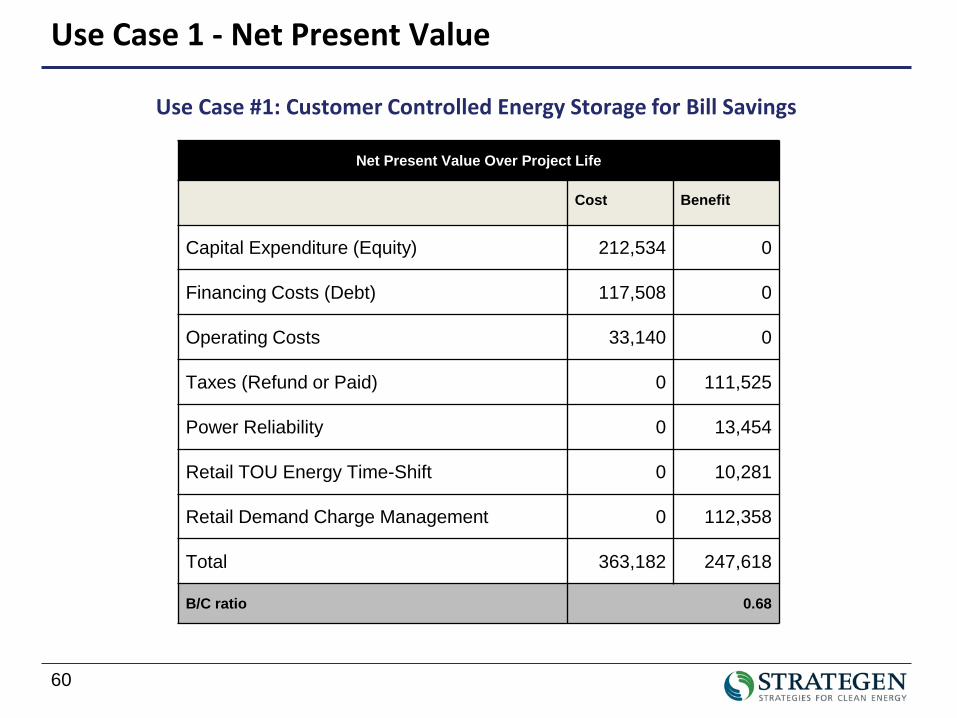
Use Case 1 - Net Present Value
Net Present Value Over Project Life
Cost Benefit
Capital Expenditure (Equity) 212,534 0
Financing Costs (Debt) 117,508 0
Operating Costs 33,140 0
Taxes (Refund or Paid) 0 111,525
Power Reliability 0 13,454
Retail TOU Energy Time-Shift 0 10,281
Retail Demand Charge Management 0 112,358
Total 363,182 247,618
B/C ratio 0.68
Use Case #1: Customer Controlled Energy Storage for Bill Savings
61
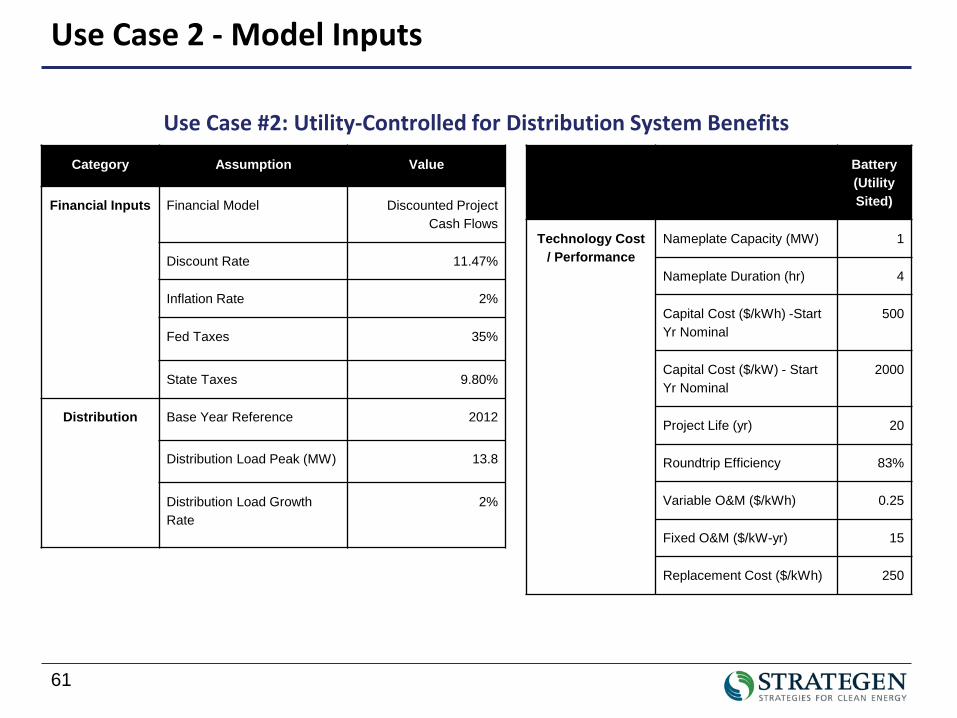
Use Case 2 - Model Inputs
Use Case #2: Utility-Controlled for Distribution System Benefits
Category Assumption Value
Financial Inputs Financial Model Discounted Project Cash Flows
Discount Rate 11.47%
Inflation Rate 2%
Fed Taxes 35%
State Taxes 9.80%
Distribution Base Year Reference 2012
Distribution Load Peak (MW) 13.8
Distribution Load Growth Rate
2%
Battery (Utility Sited)
Technology Cost / Performance
Nameplate Capacity (MW) 1
Nameplate Duration (hr) 4
Capital Cost ($/kWh) -Start Yr Nominal
500
Capital Cost ($/kW) - Start Yr Nominal
2000
Project Life (yr) 20
Roundtrip Efficiency 83%
Variable O&M ($/kWh) 0.25
Fixed O&M ($/kW-yr) 15
Replacement Cost ($/kWh) 250
62
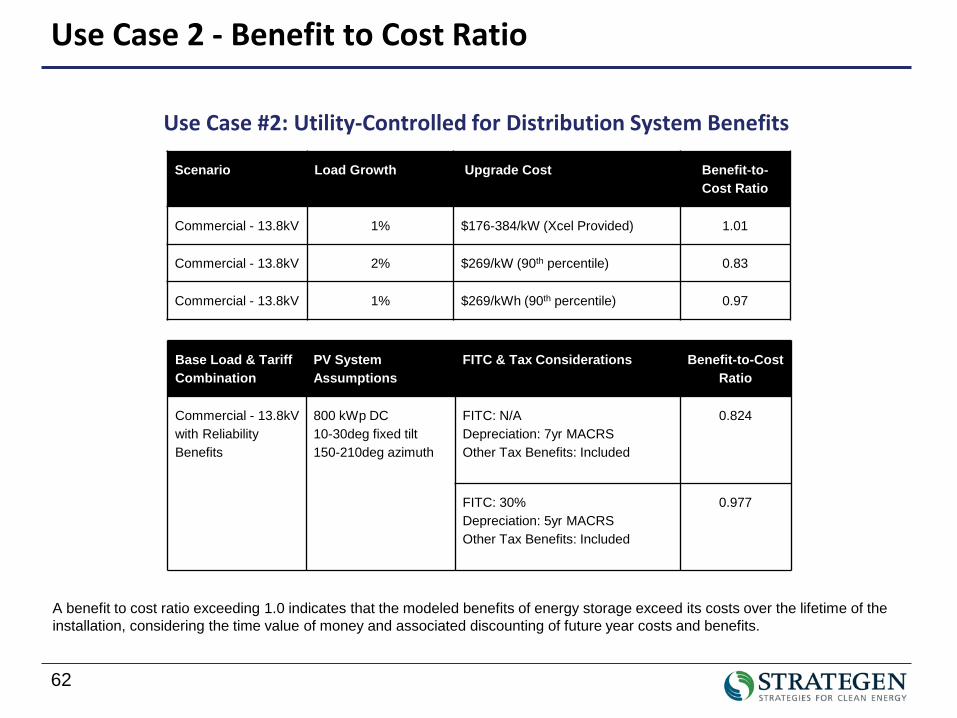
Use Case 2 - Benefit to Cost Ratio
Use Case #2: Utility-Controlled for Distribution System Benefits
Scenario Load Growth Upgrade Cost Benefit-to-Cost Ratio
Commercial - 13.8kV 1% $176-384/kW (Xcel Provided) 1.01
Commercial - 13.8kV 2% $269/kW (90th percentile) 0.83
Commercial - 13.8kV 1% $269/kWh (90th percentile) 0.97
Base Load & Tariff Combination
PV System Assumptions
FITC & Tax Considerations Benefit-to-Cost Ratio
Commercial - 13.8kV with Reliability Benefits
800 kWp DC10-30deg fixed tilt150-210deg azimuth
FITC: N/ADepreciation: 7yr MACRSOther Tax Benefits: Included
0.824
FITC: 30%Depreciation: 5yr MACRSOther Tax Benefits: Included
0.977
A benefit to cost ratio exceeding 1.0 indicates that the modeled benefits of energy storage exceed its costs over the lifetime of the installation, considering the time value of money and associated discounting of future year costs and benefits.
63
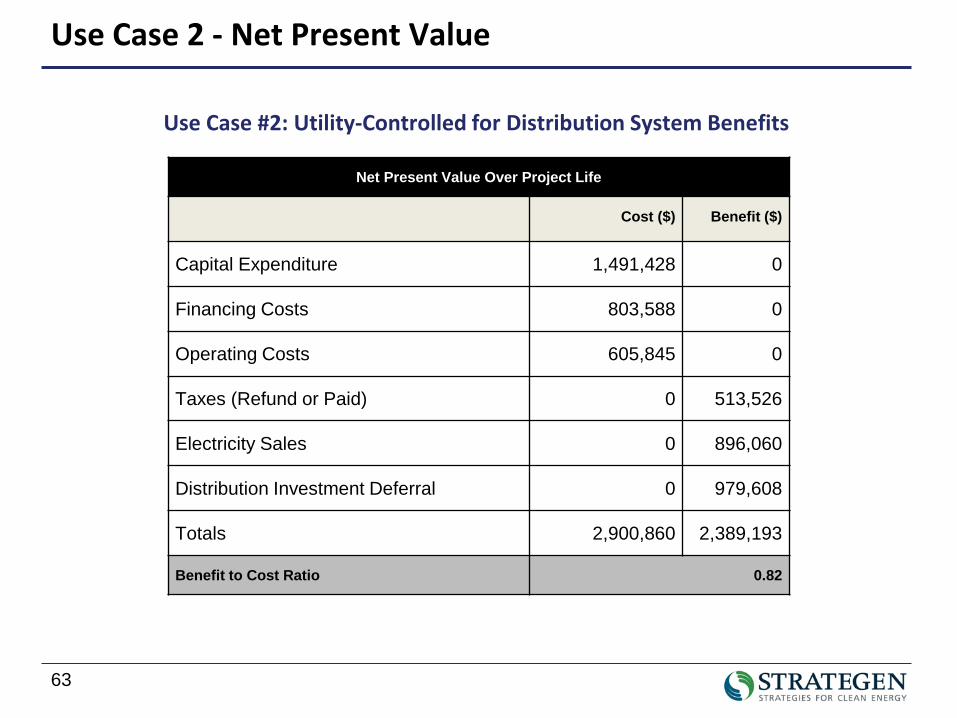
Use Case 2 - Net Present Value
Use Case #2: Utility-Controlled for Distribution System Benefits
Net Present Value Over Project Life
Cost ($) Benefit ($)
Capital Expenditure 1,491,428 0
Financing Costs 803,588 0
Operating Costs 605,845 0
Taxes (Refund or Paid) 0 513,526
Electricity Sales 0 896,060
Distribution Investment Deferral 0 979,608
Totals 2,900,860 2,389,193
Benefit to Cost Ratio 0.82
64
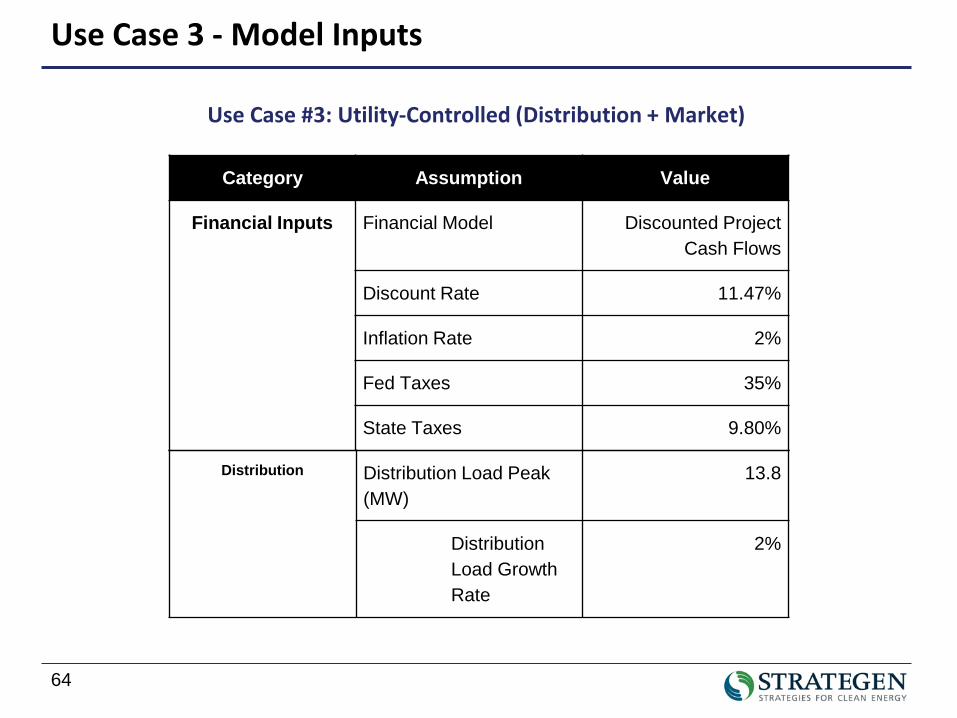
Use Case 3 - Model Inputs
Use Case #3: Utility-Controlled (Distribution + Market)
Category Assumption Value
Financial Inputs Financial Model Discounted Project Cash Flows
Discount Rate 11.47%
Inflation Rate 2%
Fed Taxes 35%
State Taxes 9.80%
Distribution Distribution Load Peak (MW)
13.8
Distribution Load Growth Rate
2%
65
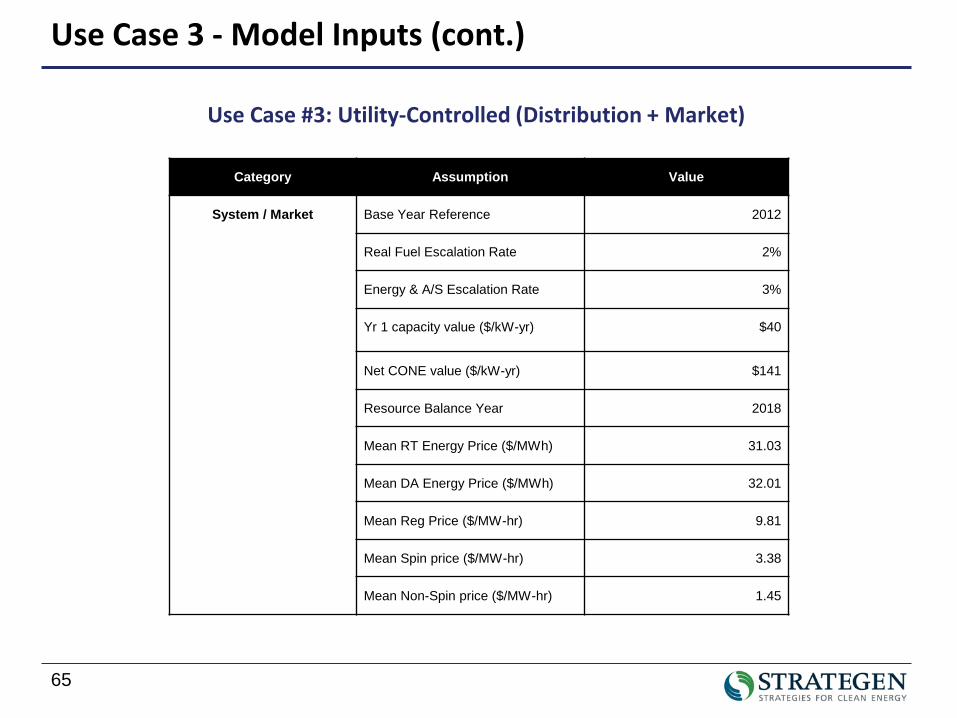
Use Case 3 - Model Inputs (cont.)
Use Case #3: Utility-Controlled (Distribution + Market)
Category Assumption Value
System / Market Base Year Reference 2012
Real Fuel Escalation Rate 2%
Energy & A/S Escalation Rate 3%
Yr 1 capacity value ($/kW-yr) $40
Net CONE value ($/kW-yr) $141
Resource Balance Year 2018
Mean RT Energy Price ($/MWh) 31.03
Mean DA Energy Price ($/MWh) 32.01
Mean Reg Price ($/MW-hr) 9.81
Mean Spin price ($/MW-hr) 3.38
Mean Non-Spin price ($/MW-hr) 1.45
66
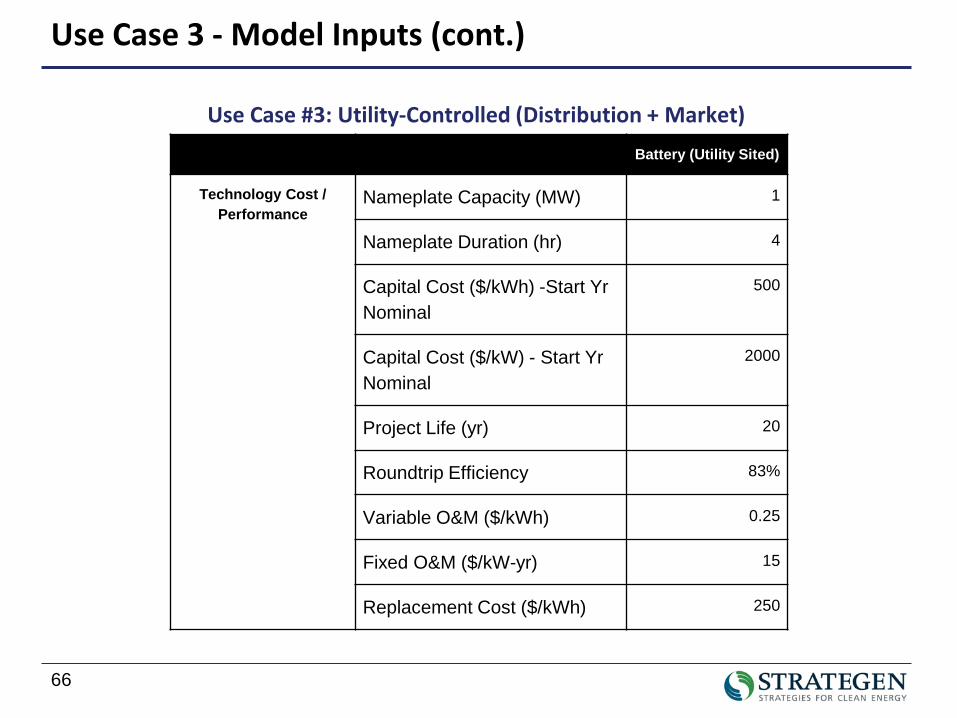
Use Case 3 - Model Inputs (cont.)
Use Case #3: Utility-Controlled (Distribution + Market)Battery (Utility Sited)
Technology Cost / Performance
Nameplate Capacity (MW) 1
Nameplate Duration (hr) 4
Capital Cost ($/kWh) -Start Yr Nominal
500
Capital Cost ($/kW) - Start Yr Nominal
2000
Project Life (yr) 20
Roundtrip Efficiency 83%
Variable O&M ($/kWh) 0.25
Fixed O&M ($/kW-yr) 15
Replacement Cost ($/kWh) 250
67
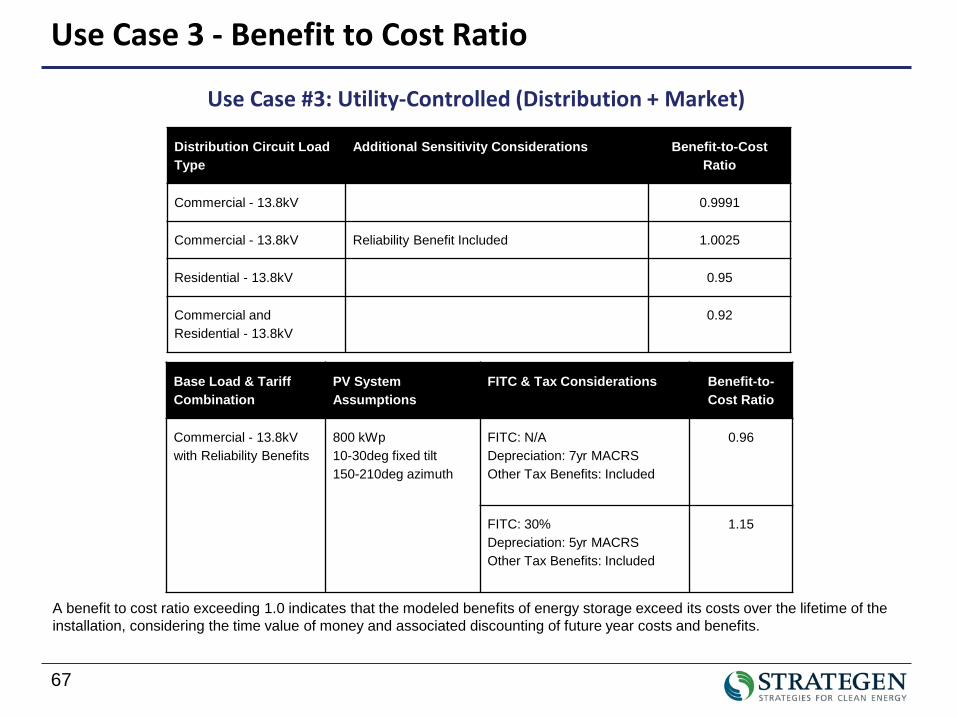
Use Case 3 - Benefit to Cost Ratio
Use Case #3: Utility-Controlled (Distribution + Market)
A benefit to cost ratio exceeding 1.0 indicates that the modeled benefits of energy storage exceed its costs over the lifetime of the installation, considering the time value of money and associated discounting of future year costs and benefits.
Distribution Circuit Load Type
Additional Sensitivity Considerations Benefit-to-Cost Ratio
Commercial - 13.8kV 0.9991
Commercial - 13.8kV Reliability Benefit Included 1.0025
Residential - 13.8kV 0.95
Commercial and Residential - 13.8kV
0.92
Base Load & Tariff Combination
PV System Assumptions
FITC & Tax Considerations Benefit-to-Cost Ratio
Commercial - 13.8kV with Reliability Benefits
800 kWp10-30deg fixed tilt150-210deg azimuth
FITC: N/ADepreciation: 7yr MACRSOther Tax Benefits: Included
0.96
FITC: 30%Depreciation: 5yr MACRSOther Tax Benefits: Included
1.15
68
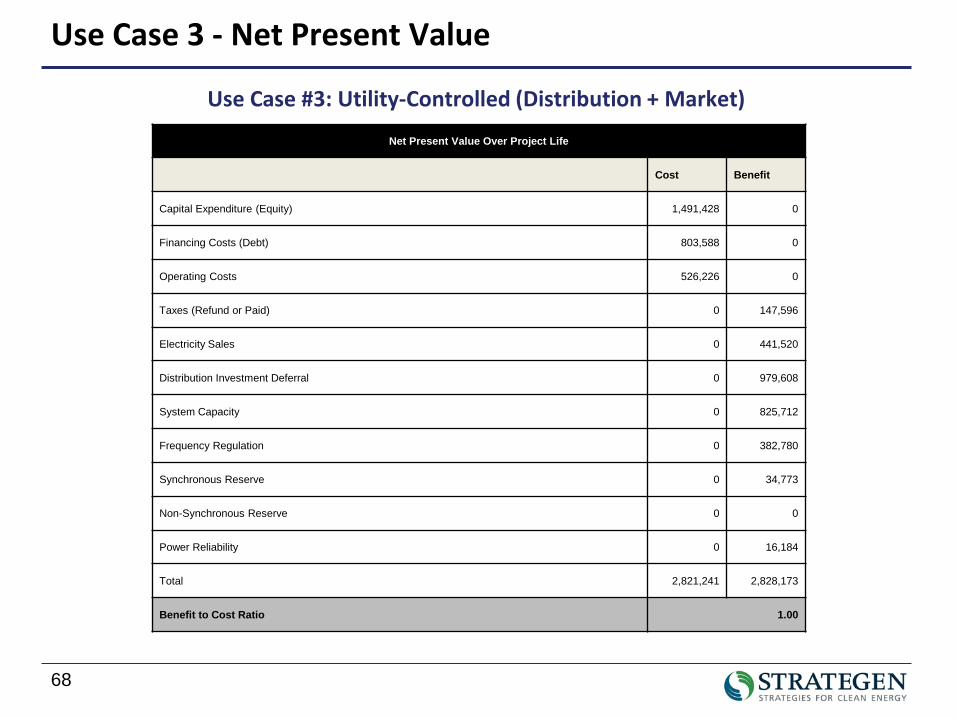
Use Case 3 - Net Present Value
Use Case #3: Utility-Controlled (Distribution + Market)
Net Present Value Over Project Life
Cost Benefit
Capital Expenditure (Equity) 1,491,428 0
Financing Costs (Debt) 803,588 0
Operating Costs 526,226 0
Taxes (Refund or Paid) 0 147,596
Electricity Sales 0 441,520
Distribution Investment Deferral 0 979,608
System Capacity 0 825,712
Frequency Regulation 0 382,780
Synchronous Reserve 0 34,773
Non-Synchronous Reserve 0 0
Power Reliability 0 16,184
Total 2,821,241 2,828,173
Benefit to Cost Ratio 1.00
69
Use Case 4 – Model Inputs
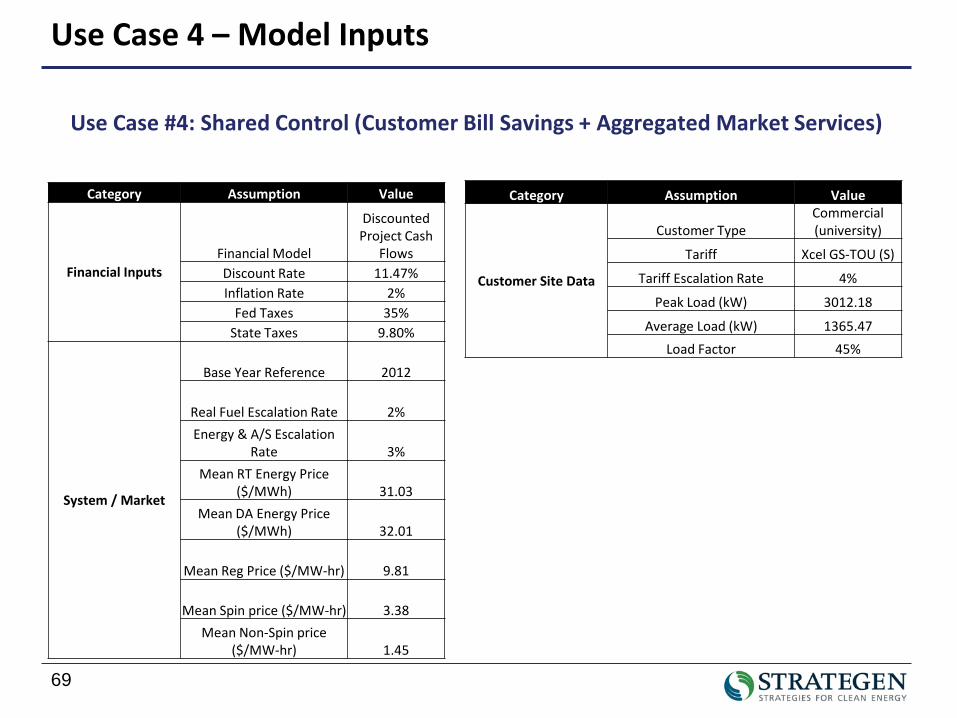
Use Case #4: Shared Control (Customer Bill Savings + Aggregated Market Services)
Category Assumption Value
Financial InputsFinancial Model
Discounted Project Cash
FlowsDiscount Rate 11.47%Inflation Rate 2%
Fed Taxes 35%State Taxes 9.80%
System / Market
Base Year Reference 2012
Real Fuel Escalation Rate 2%Energy & A/S Escalation
Rate 3%Mean RT Energy Price
($/MWh) 31.03Mean DA Energy Price
($/MWh) 32.01
Mean Reg Price ($/MW-hr) 9.81
Mean Spin price ($/MW-hr) 3.38Mean Non-Spin price
($/MW-hr) 1.45
Category Assumption Value
Customer Site Data
Customer TypeCommercial (university)
Tariff Xcel GS-TOU (S)
Tariff Escalation Rate 4%
Peak Load (kW) 3012.18
Average Load (kW) 1365.47Load Factor 45%
70
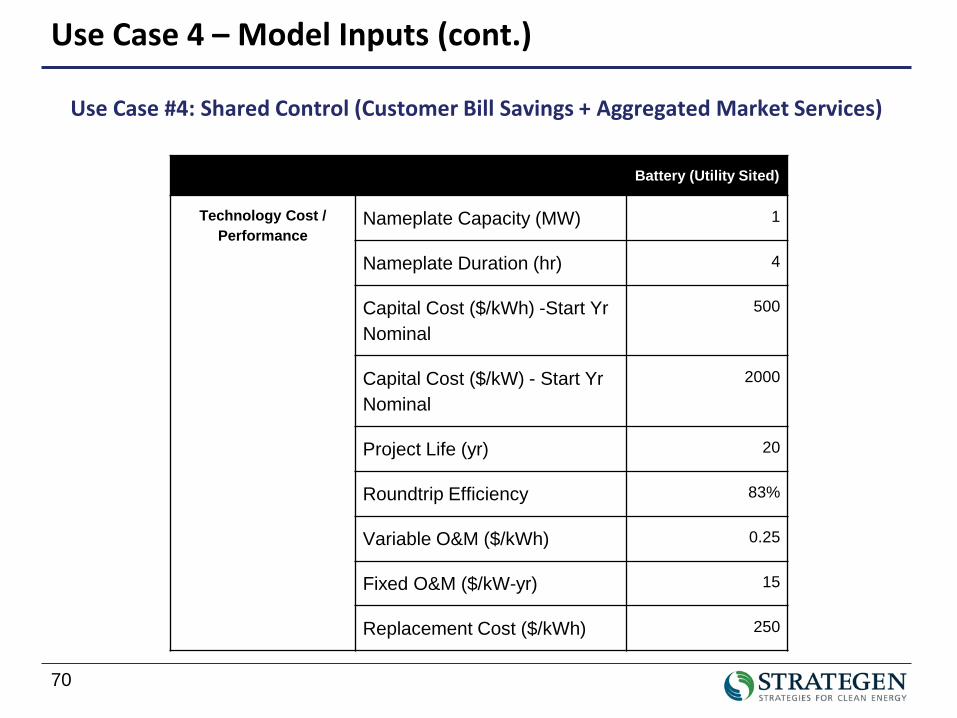
Use Case 4 – Model Inputs (cont.)
Battery (Utility Sited)
Technology Cost / Performance
Nameplate Capacity (MW) 1
Nameplate Duration (hr) 4
Capital Cost ($/kWh) -Start Yr Nominal
500
Capital Cost ($/kW) - Start Yr Nominal
2000
Project Life (yr) 20
Roundtrip Efficiency 83%
Variable O&M ($/kWh) 0.25
Fixed O&M ($/kW-yr) 15
Replacement Cost ($/kWh) 250
Use Case #4: Shared Control (Customer Bill Savings + Aggregated Market Services)
71
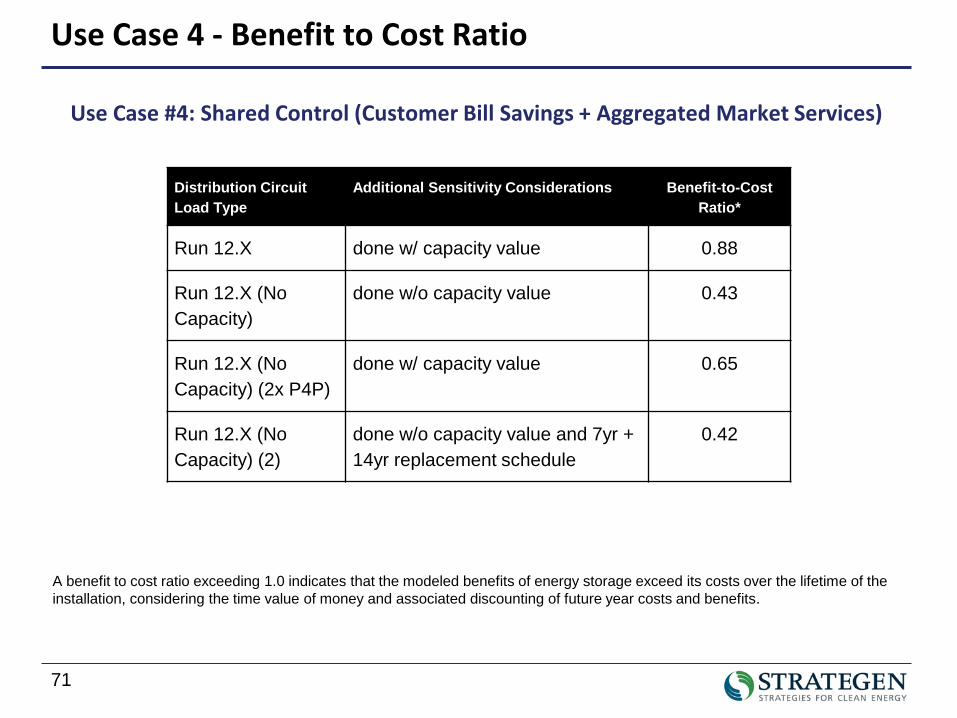
Use Case 4 - Benefit to Cost Ratio
A benefit to cost ratio exceeding 1.0 indicates that the modeled benefits of energy storage exceed its costs over the lifetime of the installation, considering the time value of money and associated discounting of future year costs and benefits.
Distribution Circuit Load Type
Additional Sensitivity Considerations Benefit-to-Cost Ratio*
Run 12.X done w/ capacity value 0.88
Run 12.X (No Capacity)
done w/o capacity value 0.43
Run 12.X (No Capacity) (2x P4P)
done w/ capacity value 0.65
Run 12.X (No Capacity) (2)
done w/o capacity value and 7yr + 14yr replacement schedule
0.42
Use Case #4: Shared Control (Customer Bill Savings + Aggregated Market Services)
72
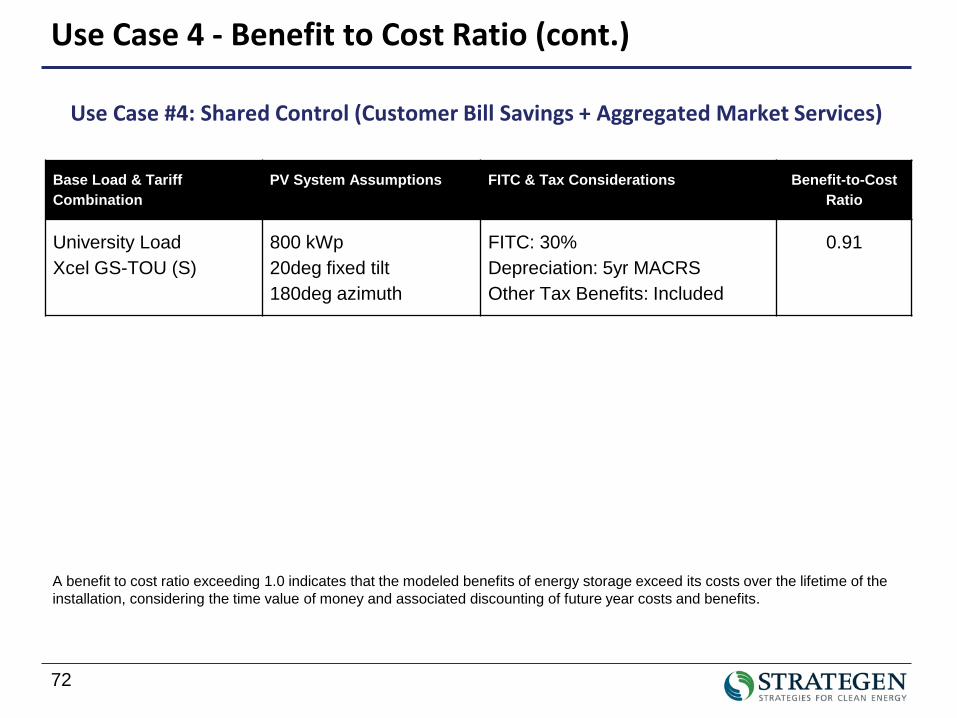
Use Case 4 - Benefit to Cost Ratio (cont.)
A benefit to cost ratio exceeding 1.0 indicates that the modeled benefits of energy storage exceed its costs over the lifetime of the installation, considering the time value of money and associated discounting of future year costs and benefits.
Use Case #4: Shared Control (Customer Bill Savings + Aggregated Market Services)
Base Load & Tariff Combination
PV System Assumptions FITC & Tax Considerations Benefit-to-Cost Ratio
University LoadXcel GS-TOU (S)
800 kWp20deg fixed tilt180deg azimuth
FITC: 30%Depreciation: 5yr MACRSOther Tax Benefits: Included
0.91
73
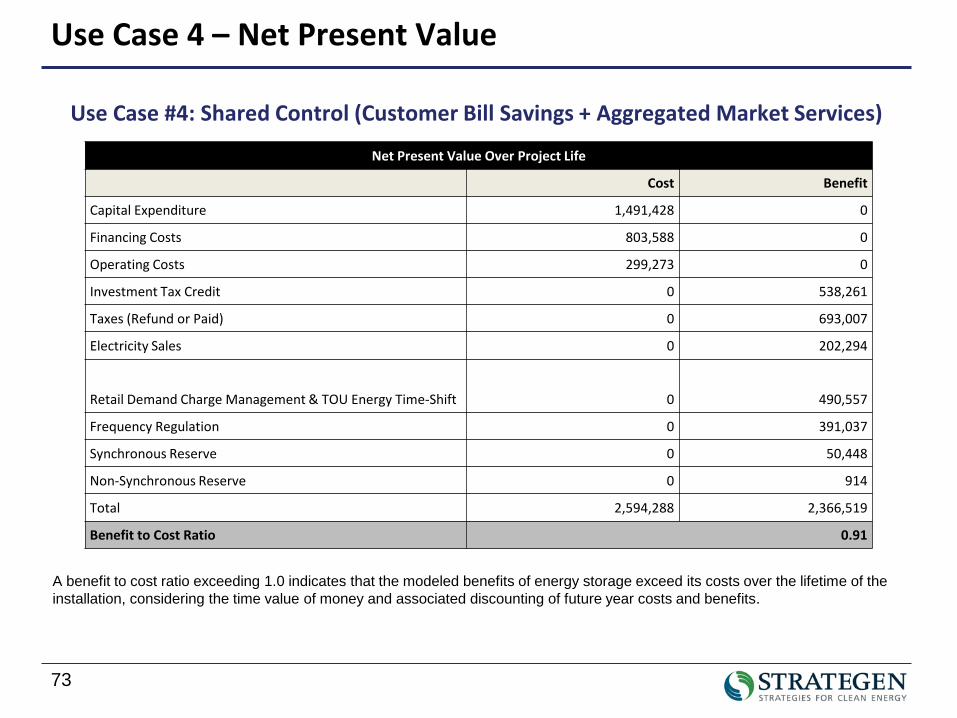
Use Case 4 – Net Present Value
A benefit to cost ratio exceeding 1.0 indicates that the modeled benefits of energy storage exceed its costs over the lifetime of the installation, considering the time value of money and associated discounting of future year costs and benefits.
Use Case #4: Shared Control (Customer Bill Savings + Aggregated Market Services)
Net Present Value Over Project Life
Cost Benefit
Capital Expenditure 1,491,428 0
Financing Costs 803,588 0
Operating Costs 299,273 0
Investment Tax Credit 0 538,261
Taxes (Refund or Paid) 0 693,007
Electricity Sales 0 202,294
Retail Demand Charge Management & TOU Energy Time-Shift 0 490,557
Frequency Regulation 0 391,037
Synchronous Reserve 0 50,448
Non-Synchronous Reserve 0 914
Total 2,594,288 2,366,519
Benefit to Cost Ratio 0.91
74
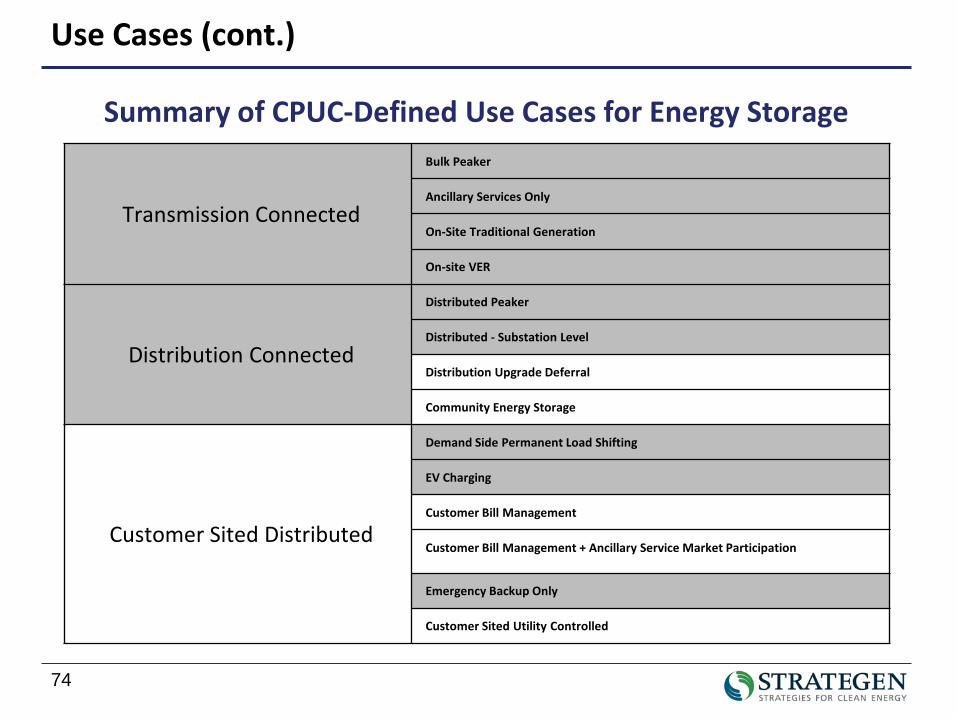
Use Cases (cont.)
Summary of CPUC-Defined Use Cases for Energy Storage
Transmission Connected
Bulk Peaker
Ancillary Services Only
On-Site Traditional Generation
On-site VER
Distribution Connected
Distributed Peaker
Distributed - Substation Level
Distribution Upgrade Deferral
Community Energy Storage
Customer Sited Distributed
Demand Side Permanent Load Shifting
EV Charging
Customer Bill Management
Customer Bill Management + Ancillary Service Market Participation
Emergency Backup Only
Customer Sited Utility Controlled
75
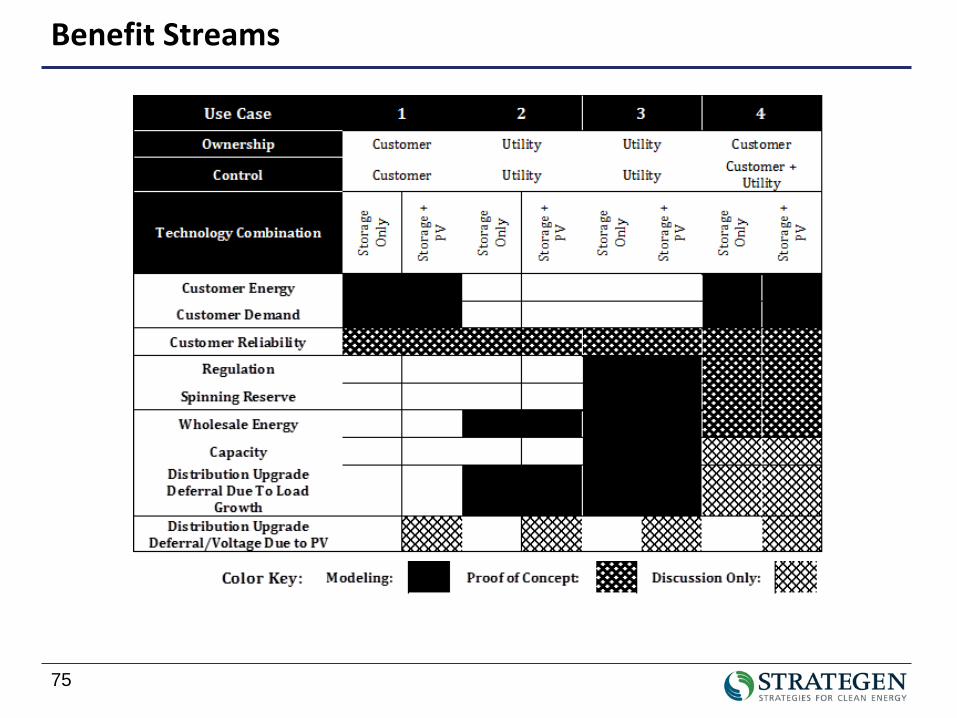
Benefit Streams

Appendix IV: Barriers & Recommendations
Details
77
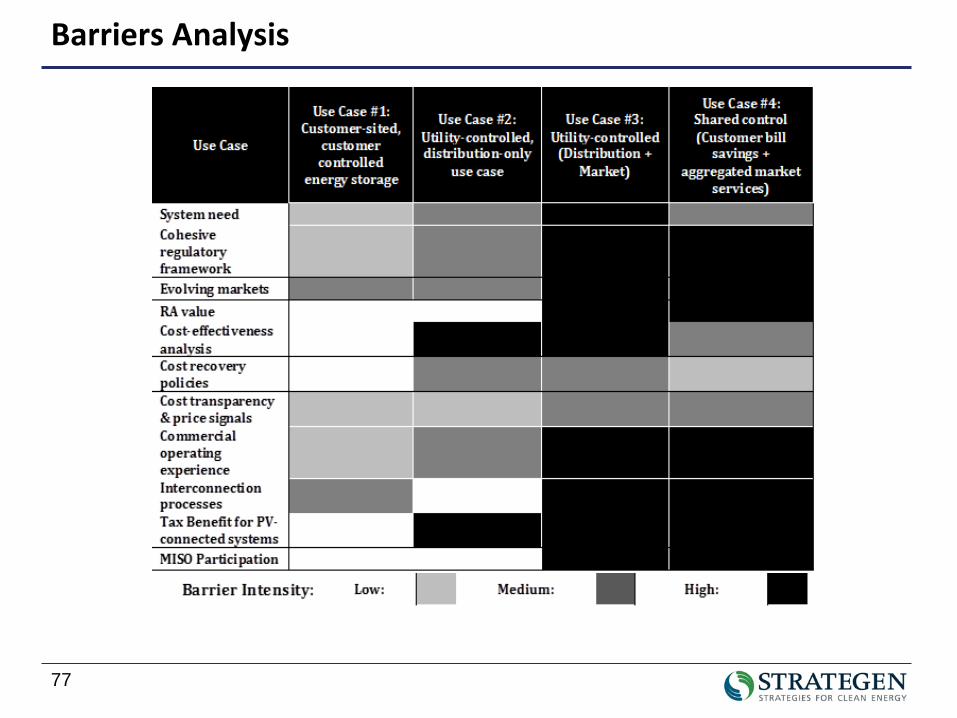
Barriers Analysis
78
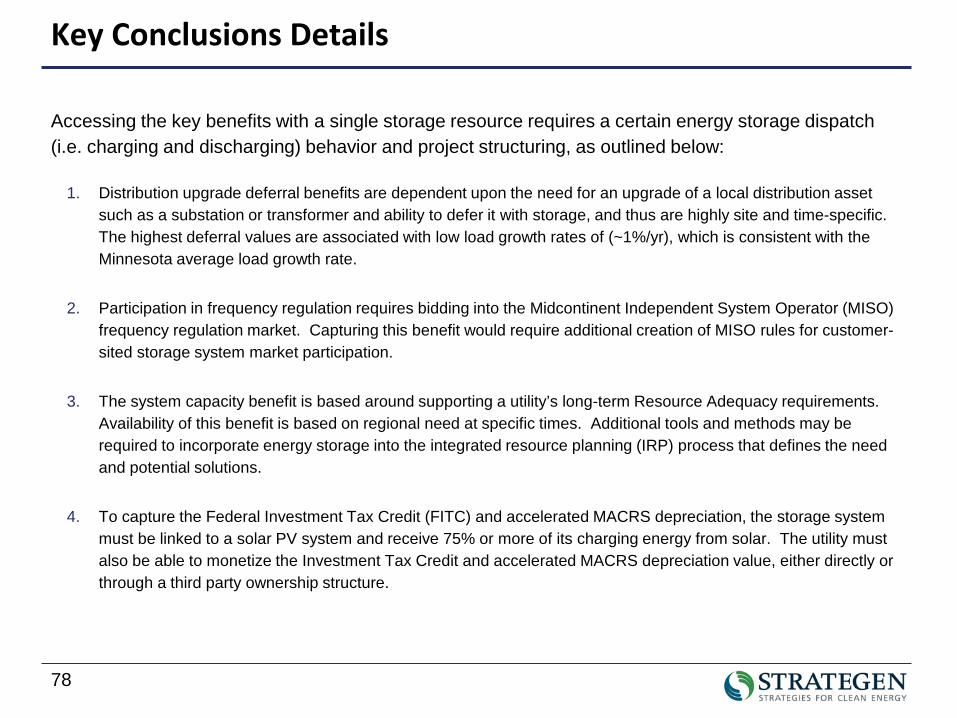
Key Conclusions Details
Accessing the key benefits with a single storage resource requires a certain energy storage dispatch (i.e. charging and discharging) behavior and project structuring, as outlined below:
1. Distribution upgrade deferral benefits are dependent upon the need for an upgrade of a local distribution asset such as a substation or transformer and ability to defer it with storage, and thus are highly site and time-specific. The highest deferral values are associated with low load growth rates of (~1%/yr), which is consistent with the Minnesota average load growth rate.
2. Participation in frequency regulation requires bidding into the Midcontinent Independent System Operator (MISO) frequency regulation market. Capturing this benefit would require additional creation of MISO rules for customer-sited storage system market participation.
3. The system capacity benefit is based around supporting a utility’s long-term Resource Adequacy requirements. Availability of this benefit is based on regional need at specific times. Additional tools and methods may be required to incorporate energy storage into the integrated resource planning (IRP) process that defines the need and potential solutions.
4. To capture the Federal Investment Tax Credit (FITC) and accelerated MACRS depreciation, the storage system must be linked to a solar PV system and receive 75% or more of its charging energy from solar. The utility must also be able to monetize the Investment Tax Credit and accelerated MACRS depreciation value, either directly or through a third party ownership structure.
79
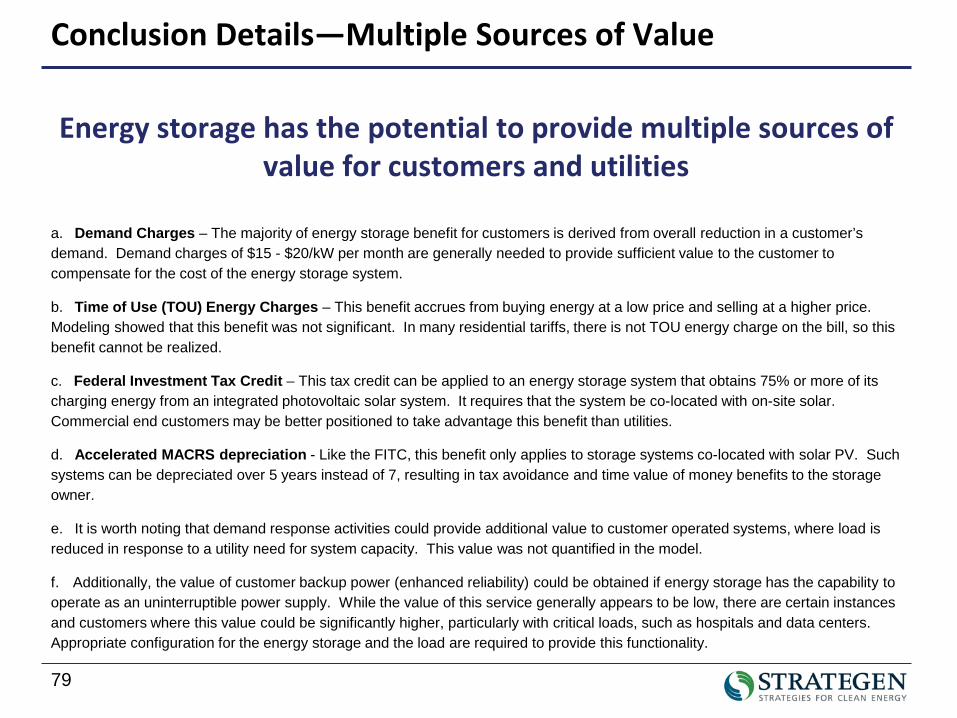
Energy storage has the potential to provide multiple sources of value for customers and utilities
a. Demand Charges – The majority of energy storage benefit for customers is derived from overall reduction in a customer’s demand. Demand charges of $15 - $20/kW per month are generally needed to provide sufficient value to the customer to compensate for the cost of the energy storage system.
b. Time of Use (TOU) Energy Charges – This benefit accrues from buying energy at a low price and selling at a higher price. Modeling showed that this benefit was not significant. In many residential tariffs, there is not TOU energy charge on the bill, so this benefit cannot be realized.
c. Federal Investment Tax Credit – This tax credit can be applied to an energy storage system that obtains 75% or more of its charging energy from an integrated photovoltaic solar system. It requires that the system be co-located with on-site solar. Commercial end customers may be better positioned to take advantage this benefit than utilities.
d. Accelerated MACRS depreciation - Like the FITC, this benefit only applies to storage systems co-located with solar PV. Such systems can be depreciated over 5 years instead of 7, resulting in tax avoidance and time value of money benefits to the storageowner.
e. It is worth noting that demand response activities could provide additional value to customer operated systems, where load isreduced in response to a utility need for system capacity. This value was not quantified in the model.
f. Additionally, the value of customer backup power (enhanced reliability) could be obtained if energy storage has the capability to operate as an uninterruptible power supply. While the value of this service generally appears to be low, there are certain instances and customers where this value could be significantly higher, particularly with critical loads, such as hospitals and data centers. Appropriate configuration for the energy storage and the load are required to provide this functionality.
Conclusion Details—Multiple Sources of Value
80
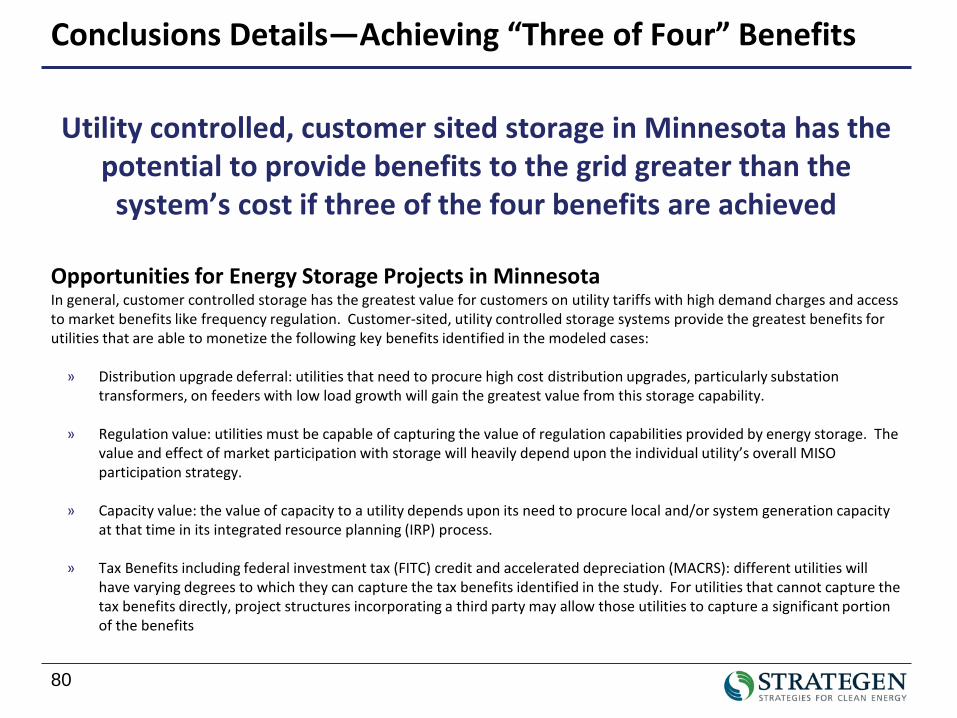
Utility controlled, customer sited storage in Minnesota has the potential to provide benefits to the grid greater than the
system’s cost if three of the four benefits are achieved
Opportunities for Energy Storage Projects in MinnesotaIn general, customer controlled storage has the greatest value for customers on utility tariffs with high demand charges and accessto market benefits like frequency regulation. Customer-sited, utility controlled storage systems provide the greatest benefits for utilities that are able to monetize the following key benefits identified in the modeled cases:
» Distribution upgrade deferral: utilities that need to procure high cost distribution upgrades, particularly substation transformers, on feeders with low load growth will gain the greatest value from this storage capability.
» Regulation value: utilities must be capable of capturing the value of regulation capabilities provided by energy storage. The value and effect of market participation with storage will heavily depend upon the individual utility’s overall MISO participation strategy.
» Capacity value: the value of capacity to a utility depends upon its need to procure local and/or system generation capacity at that time in its integrated resource planning (IRP) process.
» Tax Benefits including federal investment tax (FITC) credit and accelerated depreciation (MACRS): different utilities will have varying degrees to which they can capture the tax benefits identified in the study. For utilities that cannot capture the tax benefits directly, project structures incorporating a third party may allow those utilities to capture a significant portionof the benefits
Conclusions Details—Achieving “Three of Four” Benefits
81
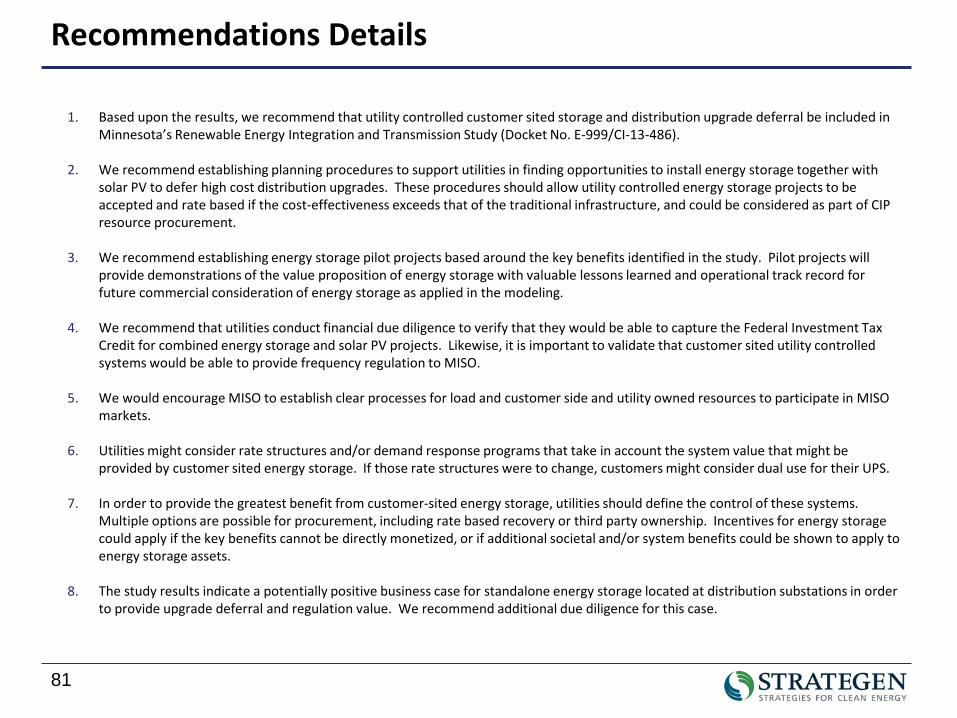
Recommendations Details
1. Based upon the results, we recommend that utility controlled customer sited storage and distribution upgrade deferral be included in Minnesota’s Renewable Energy Integration and Transmission Study (Docket No. E-999/CI-13-486).
2. We recommend establishing planning procedures to support utilities in finding opportunities to install energy storage together with solar PV to defer high cost distribution upgrades. These procedures should allow utility controlled energy storage projects to be accepted and rate based if the cost-effectiveness exceeds that of the traditional infrastructure, and could be considered as part of CIP resource procurement.
3. We recommend establishing energy storage pilot projects based around the key benefits identified in the study. Pilot projects will provide demonstrations of the value proposition of energy storage with valuable lessons learned and operational track record forfuture commercial consideration of energy storage as applied in the modeling.
4. We recommend that utilities conduct financial due diligence to verify that they would be able to capture the Federal Investment Tax Credit for combined energy storage and solar PV projects. Likewise, it is important to validate that customer sited utility controlled systems would be able to provide frequency regulation to MISO.
5. We would encourage MISO to establish clear processes for load and customer side and utility owned resources to participate in MISO markets.
6. Utilities might consider rate structures and/or demand response programs that take in account the system value that might be provided by customer sited energy storage. If those rate structures were to change, customers might consider dual use for their UPS.
7. In order to provide the greatest benefit from customer-sited energy storage, utilities should define the control of these systems. Multiple options are possible for procurement, including rate based recovery or third party ownership. Incentives for energy storage could apply if the key benefits cannot be directly monetized, or if additional societal and/or system benefits could be shown to apply to energy storage assets.
8. The study results indicate a potentially positive business case for standalone energy storage located at distribution substations in order to provide upgrade deferral and regulation value. We recommend additional due diligence for this case.

Appendix V: Minnesota Electric Grid
Background Data
83
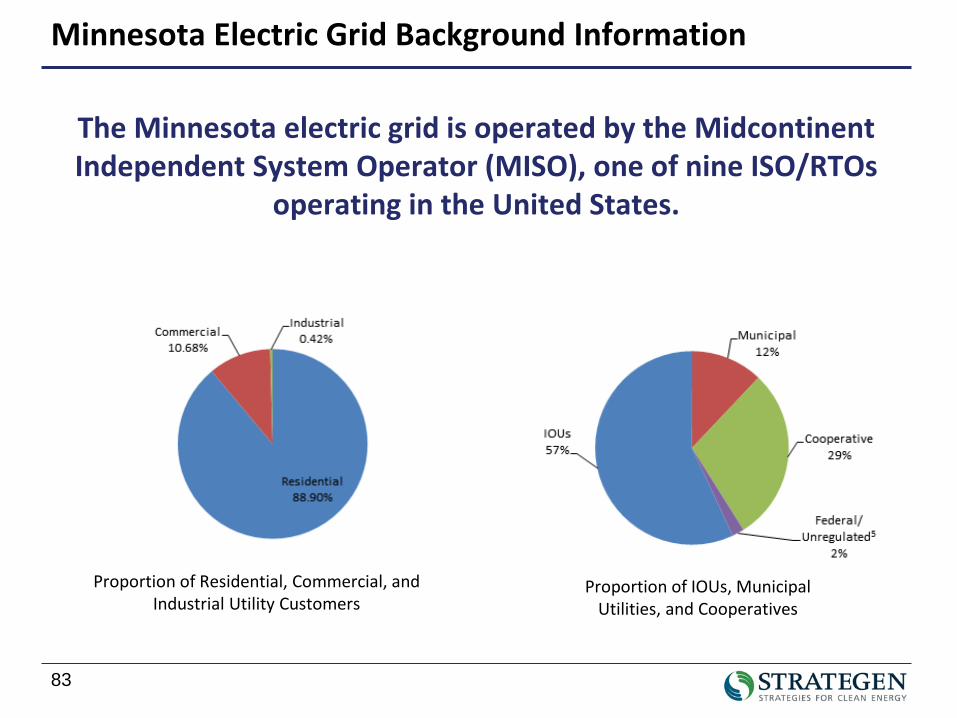
Minnesota Electric Grid Background Information
The Minnesota electric grid is operated by the Midcontinent Independent System Operator (MISO), one of nine ISO/RTOs
operating in the United States.
Proportion of Residential, Commercial, and Industrial Utility Customers
Proportion of IOUs, Municipal Utilities, and Cooperatives
84
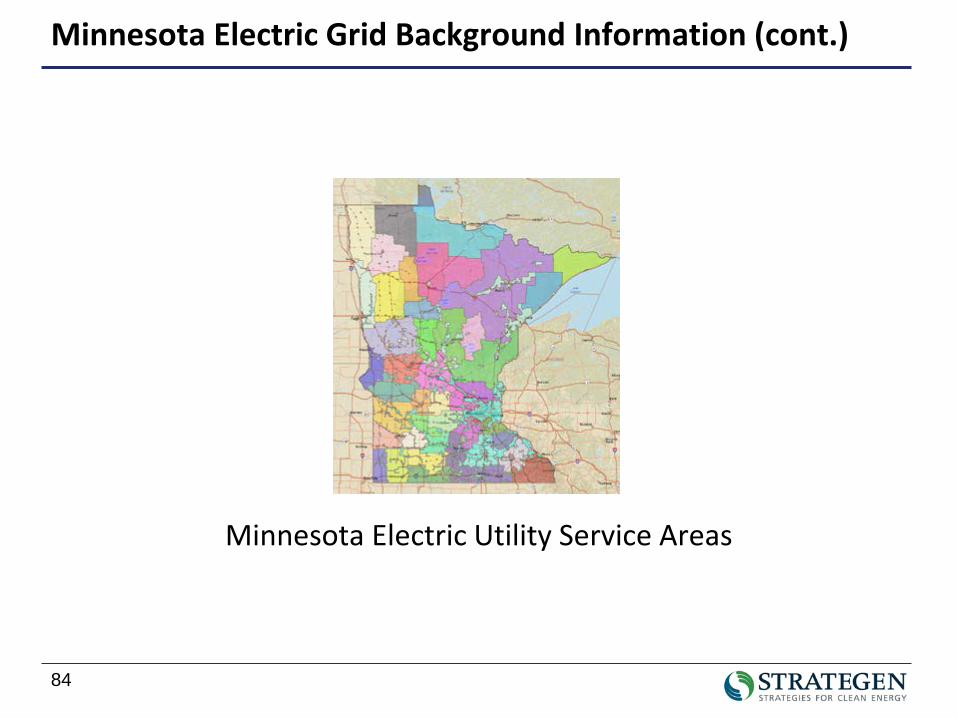
Minnesota Electric Utility Service Areas
Minnesota Electric Grid Background Information (cont.)
85
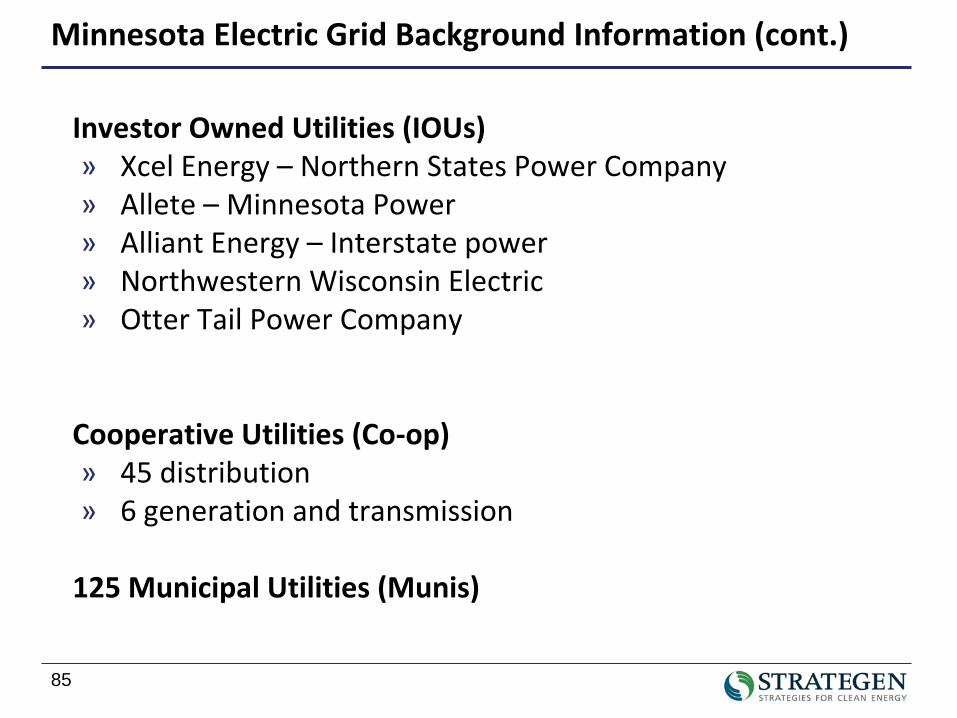
Investor Owned Utilities (IOUs)» Xcel Energy – Northern States Power Company» Allete – Minnesota Power» Alliant Energy – Interstate power» Northwestern Wisconsin Electric» Otter Tail Power Company
Cooperative Utilities (Co-op)» 45 distribution» 6 generation and transmission
125 Municipal Utilities (Munis)
Minnesota Electric Grid Background Information (cont.)


![Utility Sector Energy Efficiency in Minnesota [ACEEE]](https://img.pdfslide.us/doc/110x75/577ce0111a28ab9e78b29fbb/utility-sector-energy-efficiency-in-minnesota-aceee.jpg)