Embed Size (px)
DESCRIPTION
excellent
Citation preview
Experimental Study of Elongational Flow and Failure of Polymer Melts
YOSHIAKI IDE* and JAMES L. WHITE, Department of Chemical, Metallurgical and Polymer Engineering, The University of Tennessee,
Knoxville, Tennessee 37916
Synopsis
A new and simple instrument for measurement of elongational flow response of polymer melts in constant uniaxial extension rate experiments is described. Quantitative stress development data are presented for a series of low-density polyethylene (LDPE), high-density polyethylene (HDPE), polystyrene (PS), polypropylene (PP), and poly(methy1 methacrylate) (PMMA) melts. For small elongation rate E, linear viscoelastic behavior was observed; while for large E, LDPE and PS showed exponential stress growth, while HDPE and PP showed only linear stress growth. Stress relaxation experiments were carried out for several of the same melts in the instrument. Elongation to break and mechaniims of f i i e n t failure were studied. HDPE and PP have a tendency to neck and exhibit ductile failure, while a t high E, LDPE and PS seem to show cohesive fracture. The elongational flow stress response data were compared to predictions of nonlinear viscoelastic fluid theory, spe- cifically the Bogue-White formulation. The qualitative differences in responses of the melts studied were explained in terms of different dependences of the effective relaxation times on deformation rate and, more specifically, on values of the a parameter in the theory.
INTRODUCTION
Industrial polymer fabrication operations have led through the years to con- siderable interest in the rheological characterization of polymer melts. Most studies have involved investigations of the stress response to shearing flows, and methods of investigation have become well established. and review articles3 describe the various shear flow measurements. The evaluation of shear stress and normal stress components which arise in such flows have been reported by numerous investigators. We give as examples two investigations from our own laboratories which possess extensive data, show the consistency of results from various instruments4v5 and contain the evaluation of all three independent stress functions.5
In this paper, we consider the response of polymer melts in uniaxial elonga- tional flow (Fig. 1) with constant elongation rate. Rheological characterization' of materials such as pitch, tar-pitch blends, and shoemaker's wax in elongational flow was carried out in 1906 by Trouton who represented the response in terms of an elongational viscosity x. It was shown to be three times the shear viscosity r). Though there were some theoretical papers unpublished on elongational flow during the 1940s and 1950~,7-~ it was not until the 1960s that experimental studies on polymer melts were carried out. Many of these papers were on the melt spinning of fibers1@-18 and related the local rate of elongation to the stress using an elongational viscosity x. This approach has been criticized because the polymer melts are viscoelastic and remember their deformation history. In the
* Present address: Celanese Research Company, Summit, New Jersey 07901.
Journal of Applied Polymer Science, Vol. 22,1061-1079 (1978) 0 1978 John Wiley & Sons, Inc. 0021-8995/78/0022-1061$01.00
1062 IDE AND WHITE
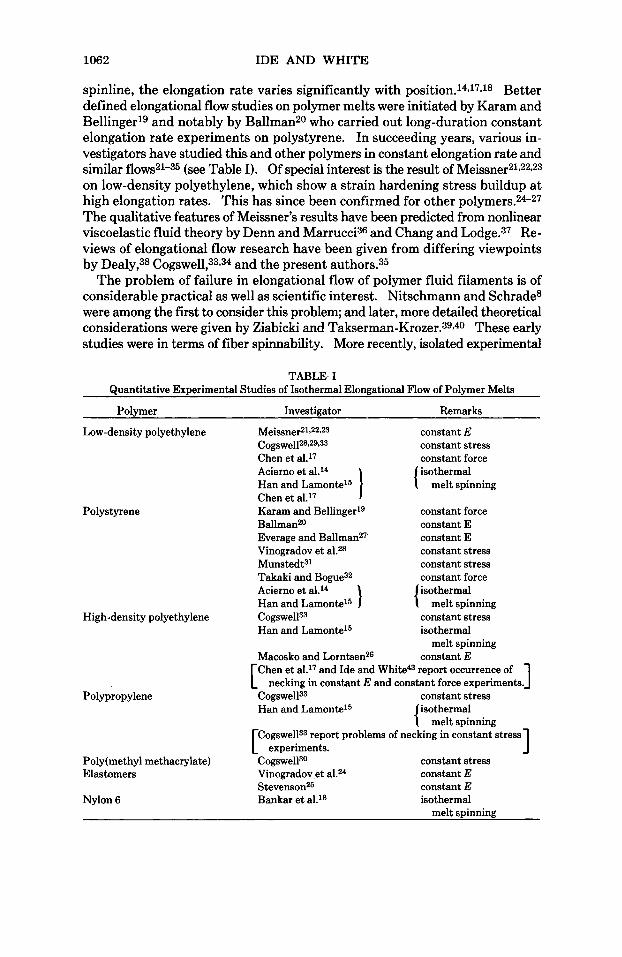
spinline, the elongation rate varies significantly with position.14J7J8 Better defined elongational flow studies on polymer melts were initiated by Karam and Bellingerlg and notably by Ballman20 who carried out long-duration constant elongation rate experiments on polystyrene. In succeeding years, various in- vestigators have studied this and other polymers in constant elongation rate and similar (see Table I). Of special interest is the result of M e i s ~ n e r ~ l ~ ~ ~ . ~ ~ on low-density polyethylene, which show a strain hardening stress buildup at high elongation rates. This has since been confirmed for other polymers.2P27 The qualitative features of Meissner's results have been predicted from nonlinear viscoelastic fluid theory by Denn and Marr~cc i3~ and Chang and L0dge.3~ Re- views of elongational flow research have been given from differing viewpoints by Dealy,38 Cogswe11,33J4 and the present authors.35
The problem of failure in elongational flow of polymer fluid filaments is of considerable practical as well as scientific interest. Nitschmann and Schrade8 were among the first to consider this problem; and later, more detailed theoretical considerations were given by Ziabicki and Takserman-Kro~er.3~9~~ These early studies were in terms of fiber spinnability. More recently, isolated experimental
TABLE I Quantitative Experimental Studies of Isothermal Elongational Flow of Polymer Melts
Polymer Investigator Remarks
Low-density polyethylene Meissner21~22.23 Cogswe112S.29,33 Chen et al.17 Acierno et al.14 Han and Lamonte15 Chen et al.17 Karam and BellingerIg Ballman20 Everage and Ballman2'
Polystyrene
constant E constant stress constant force isothermal { melt spinning
constant force constant E constant E
Vinogradov et al.2s constant stress Munstedt31 constant stress Takaki and B0gue3~ constant force Acierno et al.14 Han and Lamonte15
isothermal { melt spinning High-density polyethylene
Polypropylene
Cogswell33 constant stress Han and Lamonte15 isothermal
[,,,ko and Lorntsen26 constant E Chen et al." and Ide and White43 report occurrence of
Cogswell33 constant stress Han and Lamonte15 isothermal
melt spinning
1
1
necking in constant E and constant force experiments.
{ melt spinning report problems of necking in constant stress
experiments. CogswelPo constant stress
constant E Poly(methy1 methacrylate) Elastomers Vinogradov et al.24
Stevenson25 constant E Nvlon 6 Bankar et a1.lS isothermal
melt spinning
1063
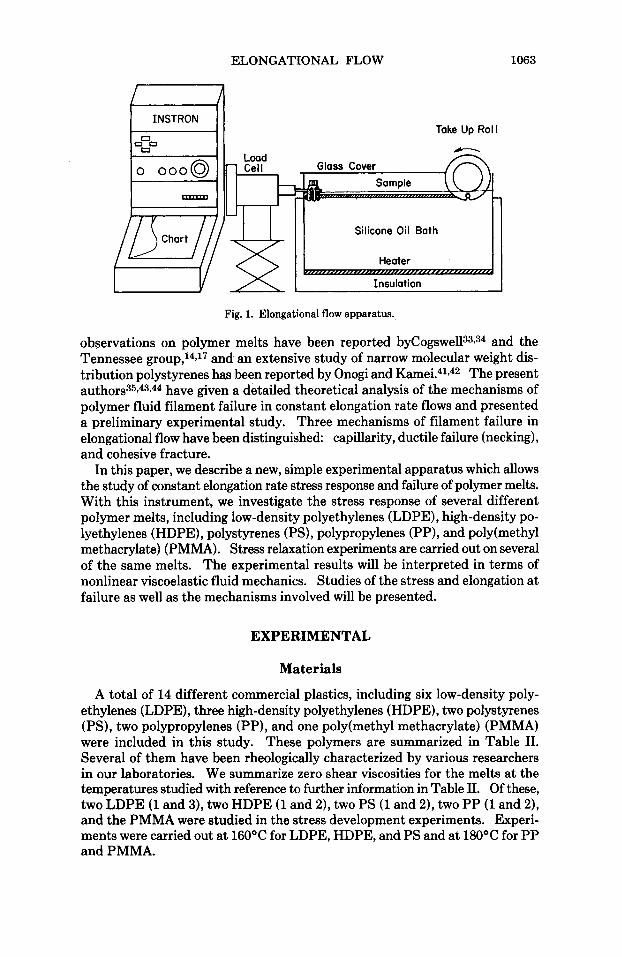
Fig. 1. Elongational flow apparatus.
observations on polymer melts have been reported b y C o g s ~ e 1 1 ~ ~ ~ ~ ~ and the Tennessee group,14J7 and an extensive study of narrow molecular weight dis- tribution polystyrenes has been reported by Onogi and The present a ~ t h o r s ~ ~ p ~ ~ 3 ~ 4 have given a detailed theoretical analysis of the mechanisms of polymer fluid filament failure in constant elongation rate flows and presented a preliminary experimental study. Three mechanisms of filament failure in elongational flow have been distinguished capillarity, ductile failure (necking), and cohesive fracture.
In this paper, we describe a new, simple experimental apparatus which allows the study of constant elongation rate stress response and failure of polymer melts. With this instrument, we investigate the stress response of several different polymer melts, including low-density polyethylenes (LDPE), high-density po- lyethylenes (HDPE), polystyrenes (PS), polypropylenes (PP), and poly(methy1 methacrylate) (PMMA). Stress relaxation experiments are carried out on several of the same melts. The experimental results will be interpreted in terms of nonlinear viscoelastic fluid mechanics. Studies of the stress and elongation at failure as well as the mechanisms involved will be presented.
EXPERIMENTAL
Materials
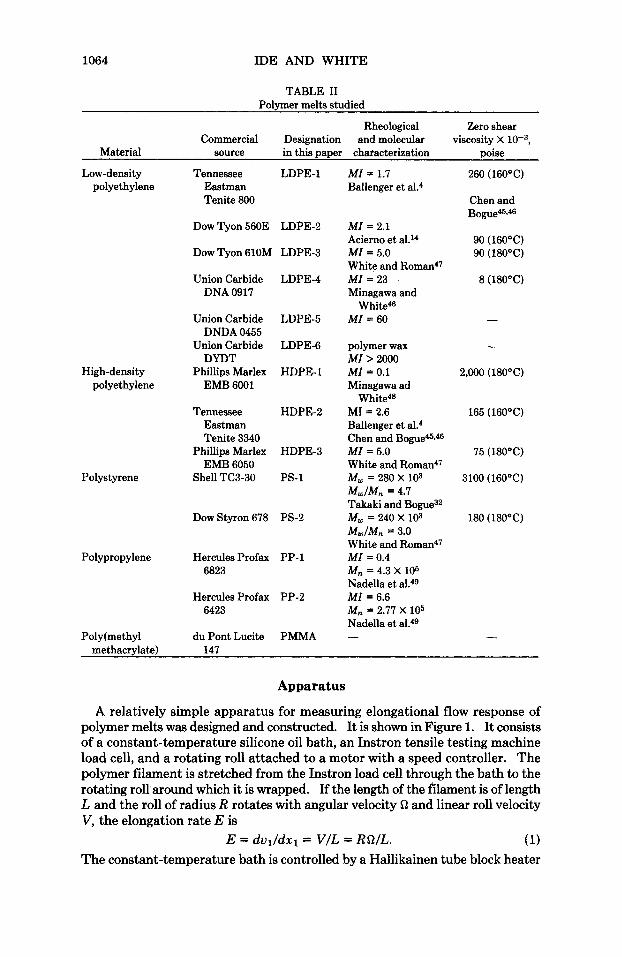
A total of 14 different commercial plastics, including six low-density poly- ethylenes (LDPE), three high-density polyethylenes (HDPE), two polystyrenes (PS), two polypropylenes (PP), and one poly(methy1 methacrylate) (PMMA) were included in this study. These polymers are summarized in Table 11. Several of them have been rheologically characterized by various researchers in our laboratories. We summarize zero shear viscosities for the melts at the temperatures studied with reference to further information in Table 11. Of these, two LDPE (1 and 3), two HDPE (1 and 2), two PS (1 and 2), two PP (1 and Z), and the PMMA were studied in the stress development experiments. Experi- ments were carried out at 16OOC for LDPE, HDPE, and PS and at 180OC for PP and PMMA.
1064 IDE AND WHITE
TABLE I1 Polymer melts studied
Rheological Zero shear Commercial Designation and molecular viscosity X 10-3,
Material source in this paper characterization poise
Low-density Tennessee LDPE-1 polyethylene Eastman
Tenite 800
Dow Tyon 560E LDPE-2
Dow Tyon 610M LDPE-3
Union Carbide LDPE-4 DNA 0917
Union Carbide LDPE-5
Union Carbide LDPE-6
High-density Phillips Marlex HDPE-1
DNDA 0455
DYDT
polyethylene EMB 6001
Tennessee HDPE-2 Eastman Tenite 3340
EMB 6050 Phillips Marlex HDPE-3
Polystyrene Shell TC3-30 PS-1
Dow Styron 678 PS-2
Polypropylene Hercules Profax PP-1 6823
Hercules Profax PP-2 6423
Poly(methy1 du Pont Lucite PMMA
MI = 1.7 Ballenger et al.4
MI = 2.1 Acierno et al.14 MI = 5.0 White and Roman47 MI = 23 Minagawa and
MI = 60 White&
polymer wax MI > 2000 MI = 0.1 Minagawa ad
White48 MI = 2.6 Ballenger et aL4 Chen and BogUee,& MI = 5.0 White and Roman4?
M J M , = 4.7 Takaki and Bowe3*
M,IM,, = 3.0 White and Roman4? MI = 0.4 M , = 4.3 X 10⁵ Nadella et al.49 MI = 6.6
Nadella et al.49
M , = 280 x 103
M , = 240 x 103
M, = 2.77 x 10⁵
-
260 (16OOC)
Chen and Bog~e45~46
90 (16OOC) 90 (18OOC)
8 (18OOC)
-
-
2,000 (18OOC)
165 (160OC)
75 (18OOC)
3100 (160°C)
180 (180OC)
- methacrylate) 147
Apparatus
A relatively simple apparatus for measuring elongational flow response of polymer melts was designed and constructed. It is shown in Figure 1. It consists of a constant-temperature silicone oil bath, an Instron tensile testing machine load cell, and a rotating roll attached to a motor with a speed controller. The polymer filament is stretched from the Instron load cell through the bath to the rotating roll around which it is wrapped. If the length of the filament is of length L and the roll of radius R rotates with angular velocity fl and linear roll velocity V, the elongation rate E is
E = duJdx l= V/L = Rfl/L. (1) The constant-temperature bath is controlled by a Hallikainen tube block heater
ELONGATIONAL FLOW 1065
(Model 100) and a Variac within H"C. The filament length between the clamps was 21.5 cm. The rotation speed of the take-up roll could be continuously varied giving a wide range of E. Two motors were used in the study: a l/15 horsepower B and B motor with 12 rpm maximum allowed E of 0.005-0.2 sec-l with a 6.35-cm-diameter roll; and a Bodine Electric Company motor with 173 rpm maximum yielded E as high as 1.5 sec-l with a 3.18-cm-diameter roll. The motor speed was controlled by a B and B controller (Type ST-12).
Procedure
The filaments were prepared by extrusion through an Instron capillary rheometer using a die of diameter 0.083 in. and LID of 30. Different extrusion temperatures were used for the various polymers studied. The polymer fila- ments were wound up at low take-up velocities on a take-up roll and were later remelted in the hot silicone oil before beginning the experiment. The filaments exhibited shrinkage in the bath, were then removed, and their diameters mea- sured. The filaments were then replaced in the bath and equilibrated before the beginning of the experiment. Density-temperature corrections to the cross-sectional area were made. These ranged from about 16% for HDPE and PP to 12% for LDPE and 5% for PS and PMMA. An estimate frictional drag on the filament was made using the theory of B a t ~ h e l o r . ~ ~ There would seem to be 2% to 3% variation in tension along the filament for the lower viscosity filaments if we take the viscosity of the silicone oil to be 0.1 poise. This was neglected.
Stress relaxation experiments were carried out by stretching the filament 50-100% and allowing the stress to decay. A Type A 2000-gram Instron load cell attached to the console of the Instron table model tensile tester was used in these experiments. A 10-gram scale was used in the experiments. For PMMA and PS-1, a 100-gram full scale was used in some cases. The Instron load cell was calibrated in the same apparatus setup before use.
RESULTS
Stress Development
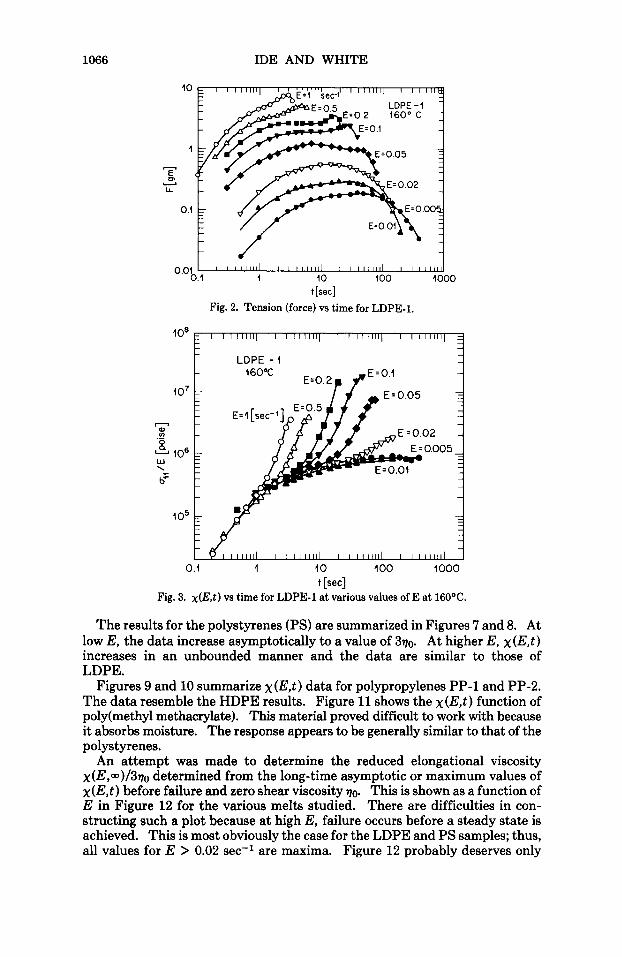
3, the elongation rate reduced stress development In Figure 2, we show tension (total force) F as a function of time, and in Figure
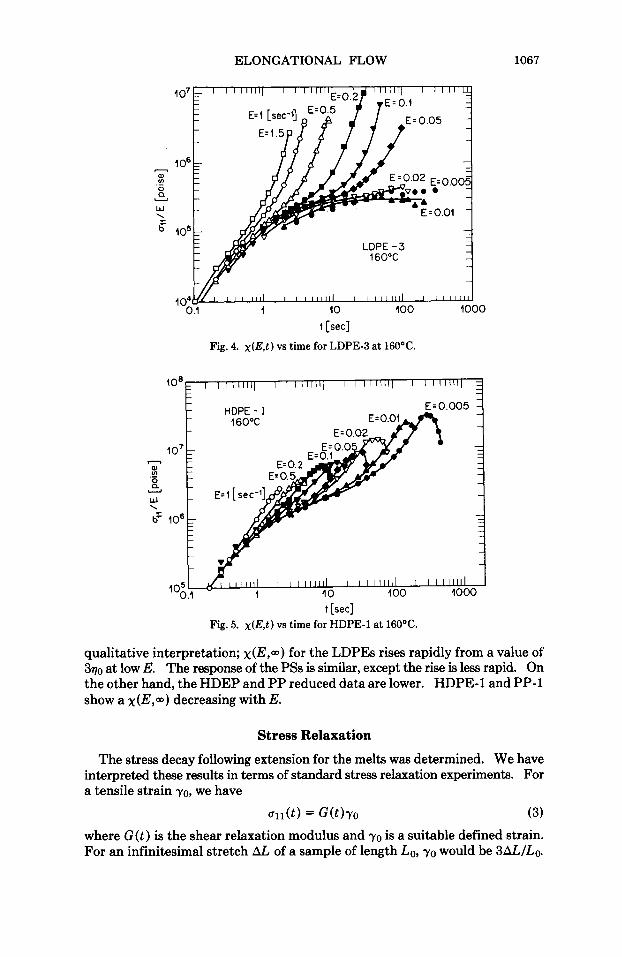
for a low-density polyethylene LDPE-1 filament. Figure 4 contains stress de- velopment data for the LDPE-3 sample. In each case for small values of E, x (E, t ) increases to an asymptotic value close to 370, where 70 is the zero shear viscosity. At higher E, x(E,t) increases in an unbounded manner.
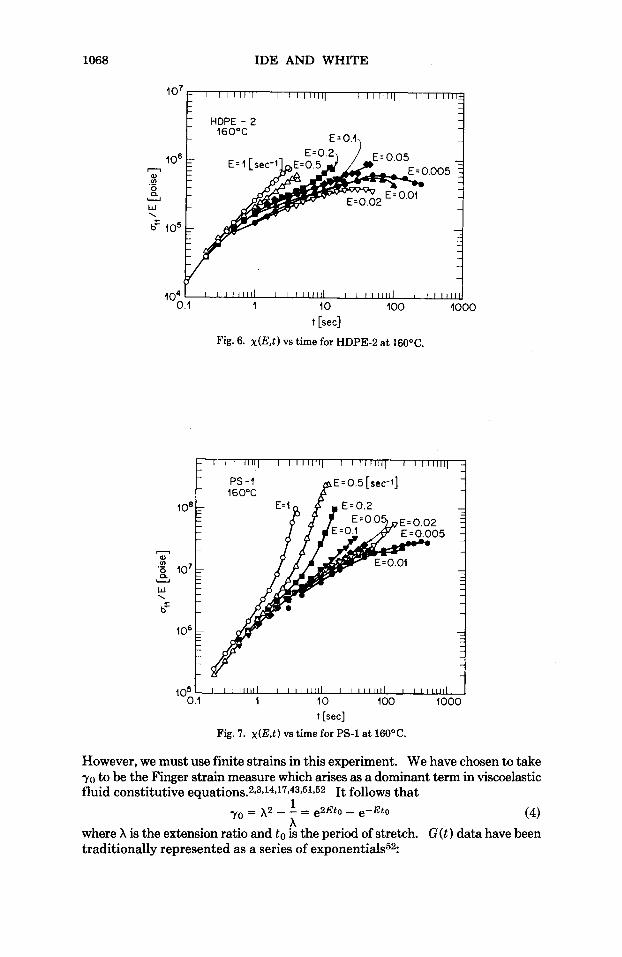
Figures 5 and 6 show x(E,t) for HDPE-1 and HDPE-3. For small E the curves are qualitatively similar to the LDPE results. At higher E, x(E,t) increases with time. However, the rate of increase is never as abrupt as the almost exponential character of the LDPE response. The magnitude of the stresses at failure is less.
1066 IDE AND WHITE
10
1
0.011 I 1 1 1 1 1 1 1 1 I 1 1 1 1 1 1 1 1 I 1 1 1 1 1 1 1 1 I ~ l l l J 0.1 1 10 100 4000
t [sec]
Fig. 2. Tension (force) vs time for LDPE-1.
108
10'
rn 0 u)
0
w
.- 106
'- b-
1 o5
0.1 1 10 100 1000 t [sec]
Fig. 3. x(E, t ) vs time for LDPE-1 at various values of E at 160OC.
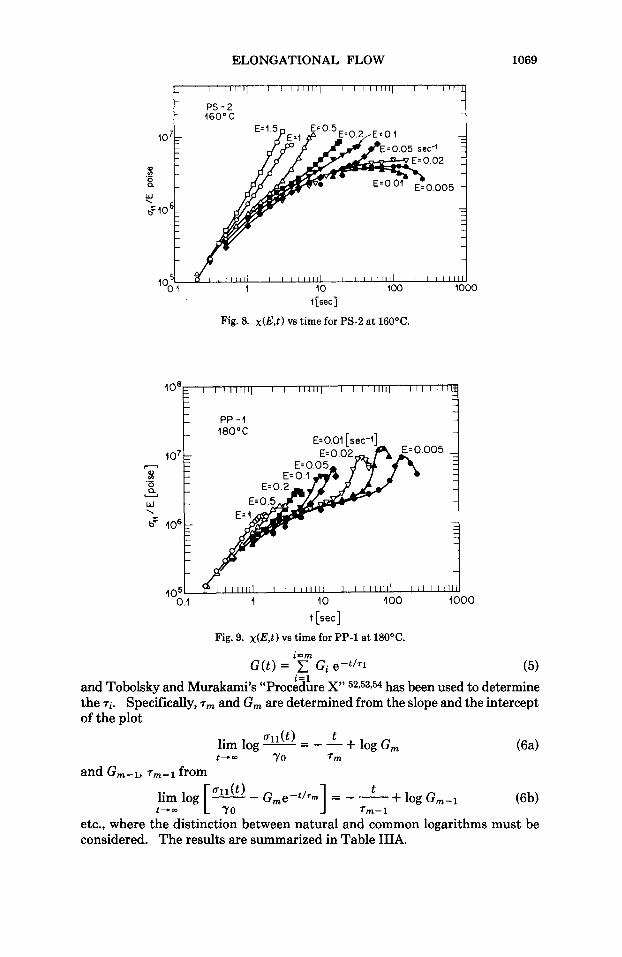
The results for the polystyrenes (PS) are summarized in Figures 7 and 8. At low E, the data increase asymptotically to a value of 370. At higher E, x ( E , t ) increases in an unbounded manner and the data are similar to those of LDPE.
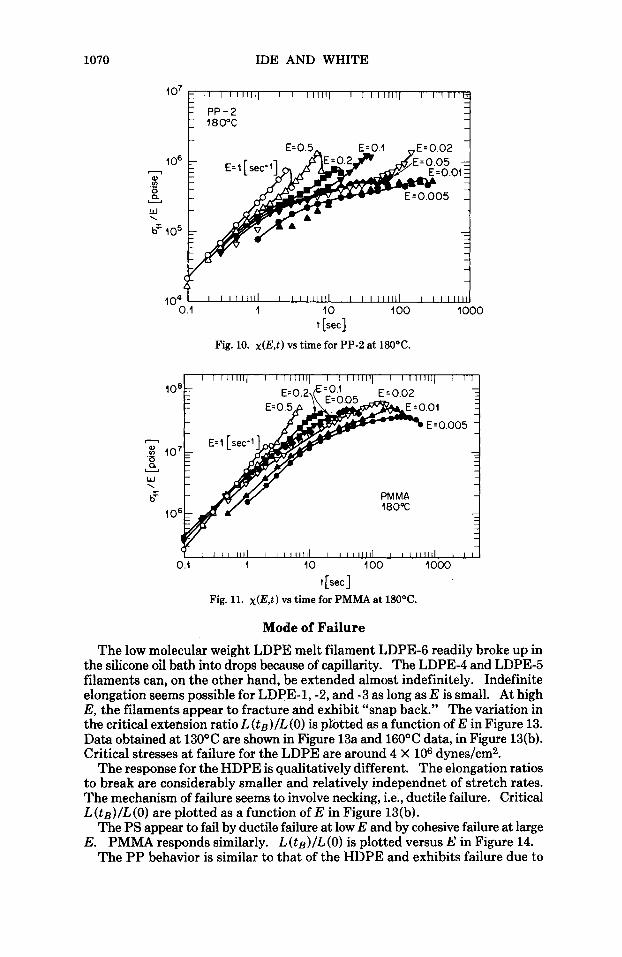
Figures 9 and 10 summarize x ( E , t ) data for polypropylenes PP-1 and PP-2. The data resemble the HDPE results. Figure 11 shows the x ( E , t ) function of poly(methy1 methacrylate). This material proved difficult to work with because it absorbs moisture. The response appears to be generally similar to that of the polystyrenes.
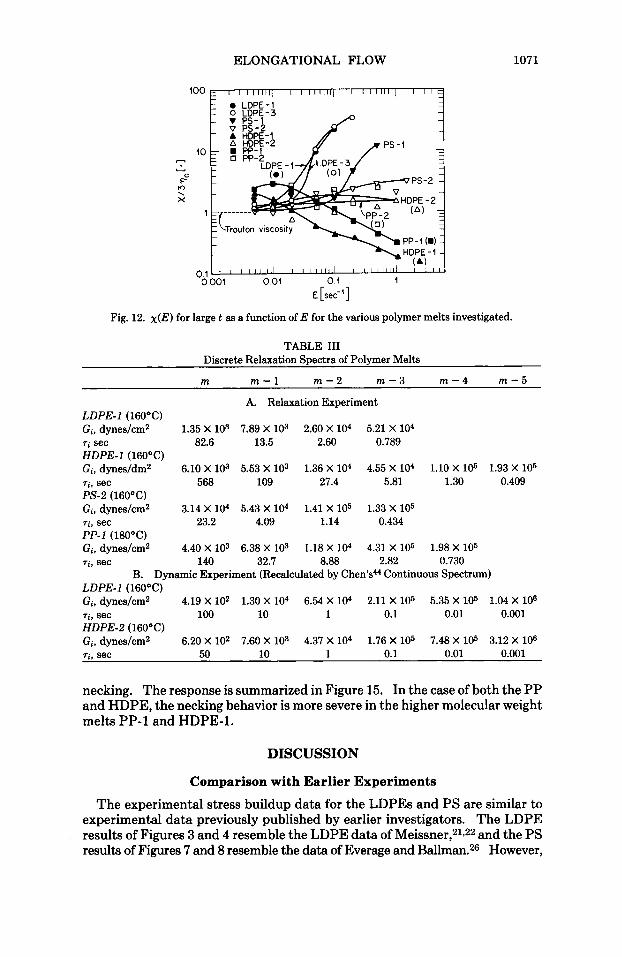
An attempt was made to determine the reduced elongational viscosity x(E,m)/3so determined from the long-time asymptotic or maximum values of x ( E , t ) before failure and zero shear viscosity 70. This is shown as a function of E in Figure 12 for the various melts studied. There are difficulties in con- structing such a plot because at high E, failure occurs before a steady state is achieved. This is most obviously the case for the LDPE and PS samples; thus, all values for E > 0.02 sec-l are maxima. Figure 12 probably deserves only
ELONGATIONAL FLOW 1067
t [sec]
Fig. 4. x ( E , t ) vs time for LDPE-3 at 160OC.
i Fig. 5. x ( E , t ) vs time for HDPE-1 at 16OoC.
qualitative interpretation; x(E,-) for the LDPEs rises rapidly from a value of 3 ~ 0 at low E. The response of the PSs is similar, except the rise is less rapid. On the other hand, the HDEP and PP reduced data are lower. HDPE-1 and PP-1 show a x(E,a) decreasing with E.
Stress Relaxation
The stress decay following extension for the melts was determined. We have interpreted these results in terms of standard stress relaxation experiments. For a tensile strain yo, we have
uii(t) = G ( t h o (3) where G ( t ) is the shear relaxation modulus and yo is a suitable defined strain. For an infinitesimal stretch AL of a sample of length LO, yo would be 3hL/Lo.
1068
108
- al .i 107: Y
W \ c
b'
106
IDE AND WHITE
- I 1 1 1 1 1 ~ 1 I I 1 1 1 1 1 ~ I I I l 1 1 1 1 ~ I I I111111 - - - - -
- -
- -
- - - -
- - - -
- 5 - -
- - -
- -
- - - - - - - - -
- - -
r - - - - - -
- -
- - - - -
- -
Io7
t [sec]
Fig. 6. x(E, t ) vs time for HDPE-2 at 160OC.
HDPE - 2 1 160°C
1 o7
106 n al
0
W \
a u
1°4,!1 I 1 1 1 1 1 1 1 1 1 I 1 1 1 1 1 1 1 ' 10 I I I I I ' I I ' 1 0 0 l l l l l l J 1000
t [sec]
Fig. 6. x(E, t ) vs time for HDPE-2 at 160OC.
ELONGATIONAL FLOW 1069
t [sec]
Fig. 8. x(E, t ) vs time for PS-2 at 160OC.
0 .I
18OOC
1 10 100 1000
t [sec]
Fig. 9. x ( E , t ) vs time for PP-1 at 180OC.
and Tobolsky and Murakami’s “Proc%re X” 52$53954 has been used to determine the q. Specifically, 7, and G , are determined from the slope and the intercept of the plot
t + log G , G l l ( t ) lim log - = - - t-- YO 7,
etc., where the distinction between natural and common logarithms must be considered. The results are summarized in Table IIIA.
1070 IDE AND WHITE
01 I 10 100 1000
t[sec] Fig. 11. x(E, t ) vs time for PMMA at 180’C.
Mode of Failure The low molecular weight LDPE melt filament LDPE-6 readily broke up in
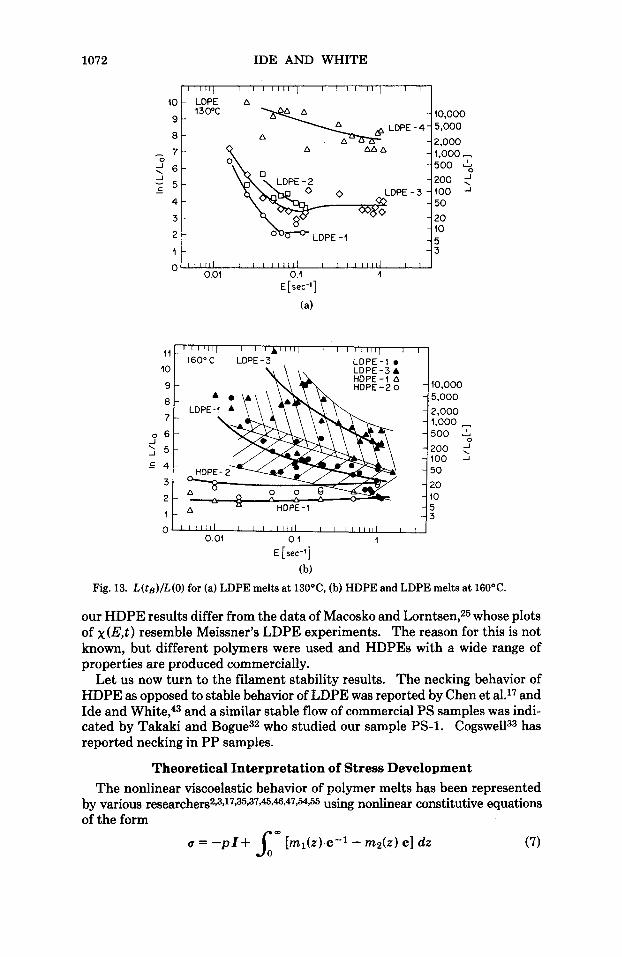
the silicone oil bath into drops because of capillarity. The LDPE-4 and LDPE-5 filaments can, on the other hand, be extended almost indefinitely. Indefinite elongation seems possible for LDPE-1, -2, and -3 as long as E is small. A t high E, the filaments appear to fracture and exhibit “snap back.” The variation in the critical extension ratio L(tg)/L(O) is pbtted as a function of E in Figure 13. Data obtained at 13OOC are shown in Figure 13a and 16OOC data, in Figure 13(b). Critical stresses at failure for the LDPE are around 4 X 10⁶ dynes/cm2.
The response for the HDPE is qualitatively different. The elongation ratios to break are considerably smaller and relatively independnet of stretch rates. The mechanism of failure seems to involve necking, i.e., ductile failure. Critical L(tg)/L(O) are plotted as a function of E in Figure 13(b).
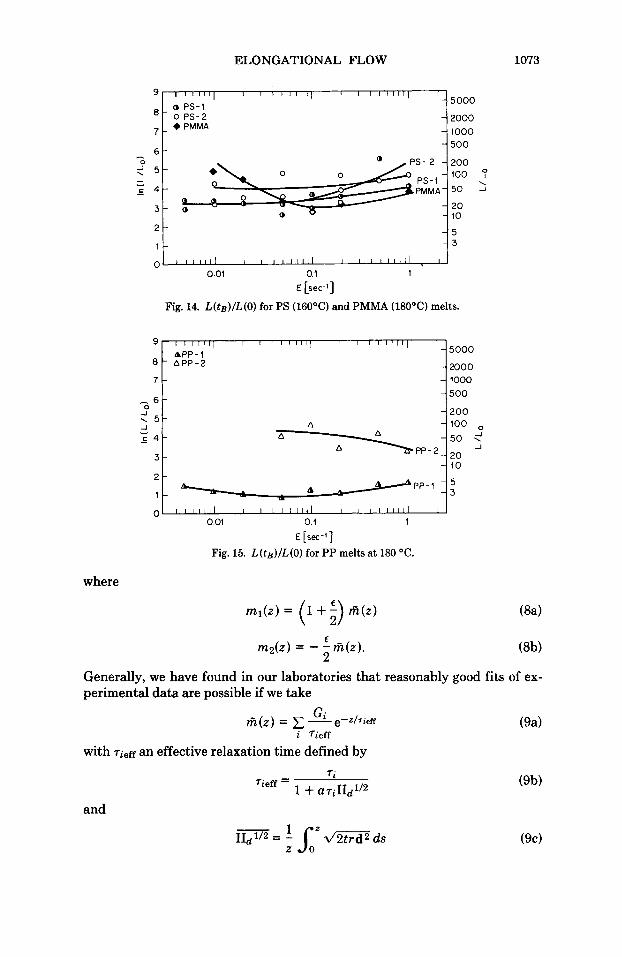
The PS appear to fail by ductile failure at low E and by cohesive failure at large E. PMMA responds similarly. L(tg)/L(O) is plotted versus E in Figure 14.
The PP behavior is similar to that of the HDPE and exhibits failure due to
ELONGATIONAL FLOW 1071
Fig. 12. x(E)
HDPE -2
CTrouton viscosity
0.001 0.01 01 1 0.11. ' 1 1 1 1 1 1 1 ' I 1 1 1 1 1 1 1 ' ' 1 1 1 1 1 1 1 ' I ' I "
E [sec-'1
for large t as a function of E for the various polymer melts investigated.
TABLE I11 Discrete Relaxation Spectra of Polymer Melts
m m - 1 m - 2 m - 3 m - 4 m-5
A. Relaxation Experiment LDPE-1 (16OOC) Gi, dynes/cm2 1.35 X lo3 7.89 X 10³ 2.60 X lo4 5.21 X lo4 si sec 82.6 13.5 2.60 0.789
Gi, dynes/dm2 6.10 X 10³ 5.53 X 10³ 1.36 X lo4 4.55 X lo4 1.10 X 10⁵ 1.93 X lo5 71, sec 568 109 27.4 5.81 1.30 0.409 PS-2 (16OOC) Gi, dynes/cm2 3.14 X lo4 5.43 X 10⁴ 1.41 X lo5 1.33 X lo5 si. sec 23.2 4.09 1.14 0.434
Gi, dynes/cm2 4.40 X 10³ 6.38 X 10³ 1.18 X 10⁴ 4.31 X 10⁵ 1.98 X lo5 si, sec 140 32.7 8.88 2.82 0.730
HDPE-1 (16OOC)
PP-1 (18OOC)
B. Dynamic Experiment (Recalculated by Chen'sU Continuous Spectrum) LDPE-1 (16OOC) Gi, dynes/cm2 4.19 X 10² 1.30 X lo4 6.54 X 10⁴ 2.11 X 10⁵ 5.35 X lo5 1.04 X lo6 si, sec 100 10 1 0.1 0.01 0.001 HDPE-2 (160°C) Gi, dynes/cm2 6.20 X 10² 7.60 X lo3 4.37 X lo4 1.76 X lo5 7.48 X 10⁵ 3.12 X lo6 ~ i , sec 50 10 1 0.1 0.01 0.001
necking. The response is summarized in Figure 15. In the case of both the PP and HDPE, the necking behavior is more severe in the higher molecular weight melts PP-1 and HDPE-1.
DISCUSSION
Comparison with Earlier Experiments
The experimental stress buildup data for the LDPEs and PS are similar to experimental data previously published by earlier investigators. The LDPE results of Figures 3 and 4 resemble the LDPE data of Meissner,21122 and the PS results of Figures 7 and 8 resemble the data of Everage and ball ma^^.^^ However,
1072
- 7 -
c i J - 4 - 6 - 5 -
3 - 2 -
1 -
IDE AND WHITE
A AA A
LDPE - 2 i h LDPE
" - LDPE-1
- "6V
2,000
500 u0
1,000 T;
200 2 3 i 100 A
11
10
9 -
8 -
7 -
o 6 - A : 5 - = 4 -
3 - 2 -
1 -
- - -
I I I I I I I I I I I I O L ' I 0 .b l I I I I 0.1 1
E[ s e r f ] (a)
LDPE -3 A HDPE - 1 A 10.000
5.000
2,000 1,000 - 500 < 200 < 100 J
50
20 10 5 i 3
0' 1 1 1 1 1 ' I I I 1 l l l l I I I I I I I I I I I
0.01 01 1 E [ sec-11
(b) Fig. 13. L(te)/L(O) for (a) LDPE melts at 13OoC, (b) HDPE and LDPE melts at 16OOC.
our HDPE results differ from the data of Macosko and L ~ r n t s e n ? ~ whose plots of x(E , t ) resemble Meissner's LDPE experiments. The reason for this is not known, but different polymers were used and HDPEs with a wide range of properties are produced commercially.
Let us now turn to the filament stability results. The necking behavior of HDPE as opposed to stable behavior of LDPE was reported by Chen et al.17 and Ide and White,43 and a similar stable flow of commercial PS samples was indi- cated by Takaki and Bogue32 who studied our sample PS-1. CogswelP3 has reported necking in PP samples.
Theoretical Interpretation of Stress Development The nonlinear viscoelastic behavior of polymer melts has been represented
by various researche~2'3'17,35137~~1~,47~54~55 using nonlinear constitutive equations of the form
ELONGATIONAL FLOW
9- 1 I I I I I , I 1 I I I I I I I I I 1 I l l 1 1 1 I - * 0 PS-1 - O P S - 2 - - + PMMA -
-
1073
5000
2 0 0 0 1000 500
2 -
1 - - 5 - 3
I I I I I I I I I I I I 1 l 1 1 1 1 I
9 , I I I I I / I I I I l I l 1 1 1 I I I I I I I I I -
APP-1 8 - APP-2
7 - - -
6 -
\ 5 -
- c 4 - 3 -
2 -
-
J -
J 4 - PP-2-
- . /PP-1 A -
1 - - A u
0 I I I 1 I I ' I I I I I I I I I I I I I I I I I I 1
where
5000
2 0 0 0 1000 500
200 -100
- 5 0 < J
2o 10
5 - 3
rnl (2) = (1 + a) A(2) (8a)
(8b) rnZ(2) = - - rn(2).
Generally, we have found in our laboratories that reasonably good fits of ex- perimental data are possible if we take
€
2
with rieff an effective relaxation time defined by
1 + U T ~ I I ~ ~ ' ~ 7i
7ieff =
and
1074 IDE AND WHITE
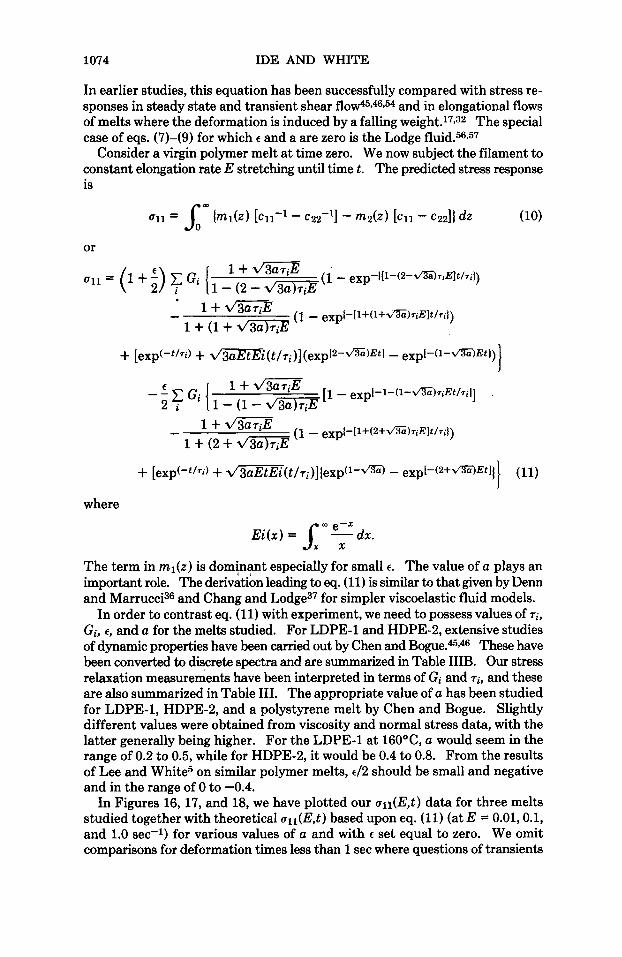
In earlier studies, this equation has been successfully compared with stress re- sponses in steady state and transient shear f l 0 W 4 ~ ~ ~ ~ ~ and in elongational flows of melts where the deformation is induced by a falling weight.17B2 The special case of eqs. (7)-(9) for which E and a are zero is the Lodge
Consider a virgin polymer melt at time zero. We now subject the filament to constant elongation rate E stretching until time t. The predicted stress response is
or
where
The term in rnl(z) is dominant especially for small E . The value of a plays an important role. The derivation leading to eq. (11) is similar to that given by Denn and Marrucci3'j and Chang and Lodge37 for simpler viscoelastic fluid models.
In order to contrast eq. (11) with experiment, we need to possess values of ~ i , Gi, c, and a for the melts studied. For LDPE-1 and HDPE-2, extensive studies of dynamic properties have been carried out by Chen and BogUe.45pa These have been converted to discrete spectra and are summarized in Table IIIB. Our stress relaxation measurements have been interpreted in terms of Gi and ~ i , and these are also summarized in Table 111. The appropriate value of a has been studied for LDPE-1, HDPE-2, and a polystyrene melt by Chen and Bogue. Slightly different values were obtained from viscosity and normal stress data, with the latter generally being higher. For the LDPE-1 at 16OoC, a would seem in the range of 0.2 to 0.5, while for HDPE-2, it would be 0.4 to 0.8. From the results of Lee and White5 on similar polymer melts, 42 should be small and negative and in the range of 0 to -0.4.
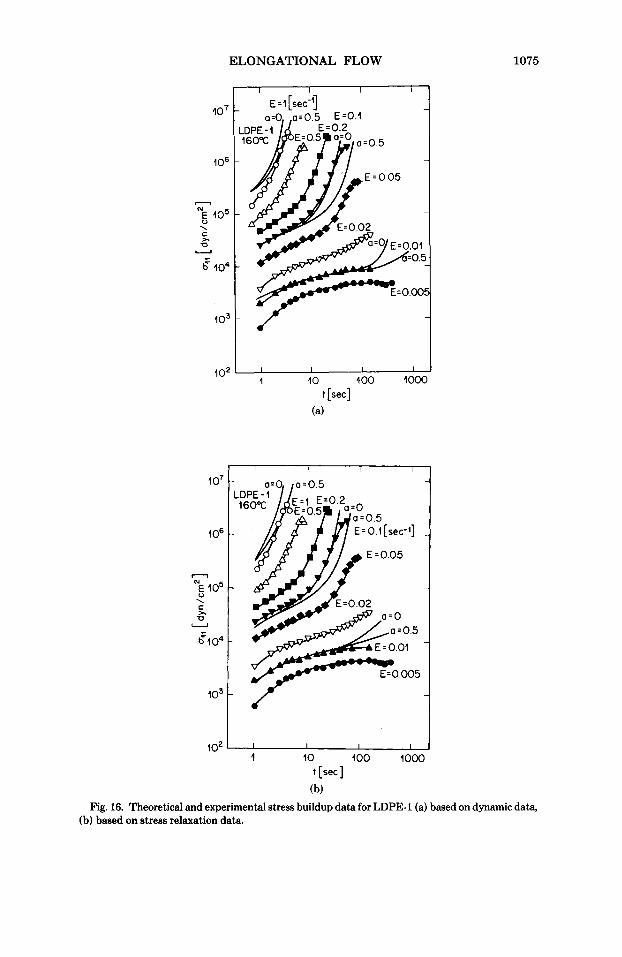
In Figures 16, 17, and 18, we have plotted our ull(E,t) data for three melts studied together with theoretical ql(E,t) based upon eq. (11) (at E = 0.01, 0.1, and 1.0 sec-l) for various values of a and with t set equal to zero. We omit comparisons for deformation times less than 1 sec where questions of transients
ELONGATIONAL FLOW 1075
lo7
106
m N E, lo5 \
C )I 0
U
b= 104
lo3
10'
1 o7
106
n Ns 105
g104
\
C A
0 U
lo3
102
I I I I
1 10 100 1000 t [sec]
(a)
f 1 10 100 1000
t [sec]
(b) Fig. 16. Theoretical and experimental stress buildup data for LDPE-1 (a) based on dynamic data,
(b) based on stress relaxation data.
1076 IDE AND WHITE
106
- 1 0 5 N E u \ C
U U
b= lo4
1 o3
(i;
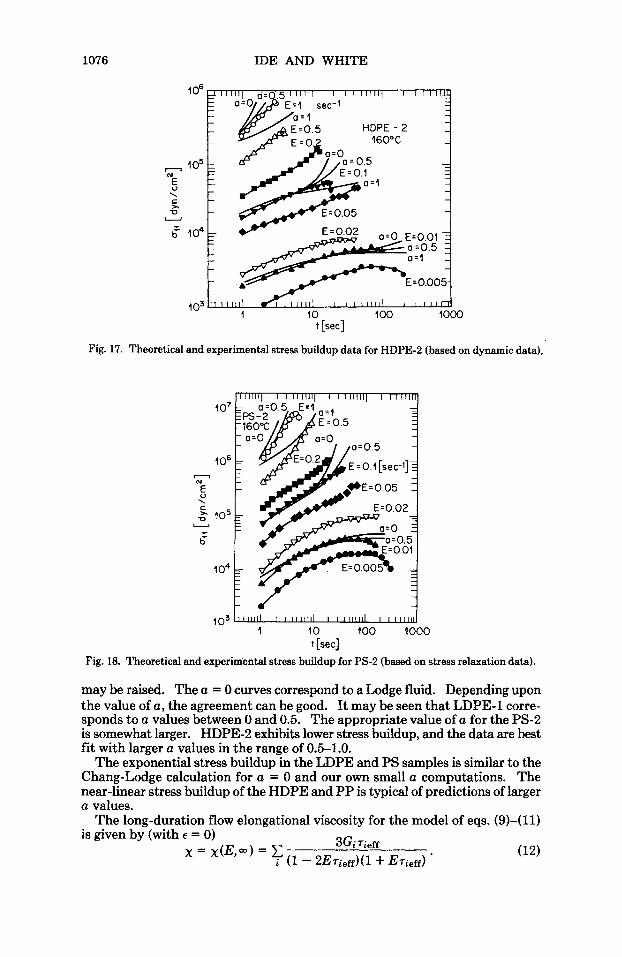
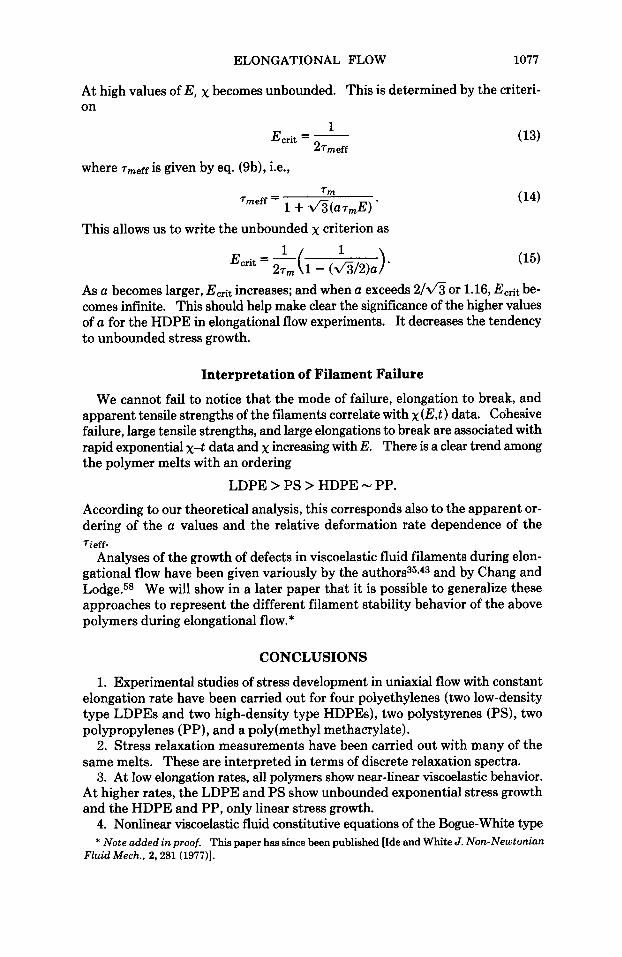
Fig. 17. Theoretical and experimental stress buildup data for HDPE-2 (based on dynamic data).
Fig. 18. Theoretical , relaxation data).
may be raised. The a = 0 curves correspond to a Lodge fluid. Depending upon the value of a, the agreement can be good. It may be seen that LDPE-1 corre- sponds to a values between 0 and 0.5. The appropriate value of a for the PS-2 is somewhat larger. HDPE-2 exhibits lower stress buildup, and the data are best fit with larger a values in the range of 0.5-1.0.
The exponential stress buildup in the LDPE and PS samples is similar to the Chang-Lodge calculation for a = 0 and our own small a computations. The near-linear stress buildup of the HDPE and PP is typical of predictions of larger a values.
The long-duration flow elongational viscosity for the model of eqs. (9)-(11)
ELONGATIONAL FLOW 1077
At high values of E, x becomes unbounded. This is determined by the criteri- on
where rrn,ff is given by eq. (9b), i.e.,
This allows us to write the unbounded x criterion as
> * = 27,(1 - (d3/2)a 1
As a becomes larger, Ecrit increases; and when a exceeds 2/d3 or 1.16, Ecrit be- comes infinite. This should help make clear the significance of the higher values of a for the HDPE in elongational flow experiments. It decreases the tendency to unbounded stress growth.
Interpretation of Filament Failure
We cannot fail to notice that the mode of failure, elongation to break, and apparent tensile strengths of the filaments correlate with x(E , t ) data. Cohesive failure, large tensile strengths, and large elongations to break are associated with rapid exponential X-t data and x increasing with E. There is a clear trend among the polymer melts with an ordering
LDPE > PS > HDPE - PP. According to our theoretical analysis, this corresponds also to the apparent or- dering of the a values and the relative deformation rate dependence of the
Analyses of the growth of defects in viscoelastic fluid filaments during elon- gational flow have been given variously by the a ~ t h o r s ~ ~ y ~ 3 and by Chang and Lodge.58 We will show in a later paper that it is possible to generalize these approaches to represent the different filament stability behavior of the above polymers during elongational flow.*
Tieff.
CONCLUSIONS
1. Experimental studies of stress development in uniaxial flow with constant elongation rate have been carried out for four polyethylenes (two low-density type LDPEs and two high-density type HDPEs), two polystyrenes (PS), two polypropylenes (PP), and a poly(methy1 methacrylate).
2. Stress relaxation measurements have been carried out with many of the same melts. These are interpreted in terms of discrete relaxation spectra.
3. At low elongation rates, all polymers show near-linear viscoelastic behavior. At higher rates, the LDPE and PS show unbounded exponential stress growth and the HDPE and PP, only linear stress growth.
4. Nonlinear viscoelastic fluid constitutive equations of the Bogue-White type * Note added in proof. This paper has since been published [Ide and White J. Non-Newtonian
Fluid Mech., 2,281 (1977)l.
1078 IDE AND WHITE
are able to fit the experimental data for stress buildup if the a parameter in the theory orders
~ L D P E < UPS < ~ P P - ~ H D P E (16) where U L D ~ E is about 0.3 and U H D ~ E between 0.5 and 1.0.
5. Studies of filament failure have been carried out on several LDPE, HDPE, PS, PP, and a PMMA samples. These show that LDPEs fail by cohesive fracture and the HDPEs and PRS by ductile failure (necking), especially in high molecular weight materials. PS appears to show ductile failure at low rates and cohesive fracture at high rates.
6. Low molecular weight LDPEs extend indefinitely, especially at low rates. The elongation to break of LDPEs decrease with increasing elongation rate. The HDPEs and PPs show much smaller elongations to break, especially the higher molecular weight polymers. Generally, for HDPE and PP, the elongation to break is independent of elongation rate.
7. The rate of stress buildup and a parameter correlate with mechanism and elongation to break.
It should be said finally that the results of this paper are consistent with those of earlier investigators.
GK18897. We would like to acknowledge helpful discussions with F. N. Cogswell. This research was supported in part by the National Science Foundation under NSF Grant
References 1. J. R. Van Wazer, J. W. Lyons, K. Y. Kim, and R. E. Colwell, Viscosity and Flow Measurement,
2. S. Middleman, The Flow of High Polymers, Wiley, New York, 1968. 3. J. L. White, in Rubber Science and Technology F. R. Eirich, A. M. Gessler, and E. G. Kontos,
4. T. F. Ballenger, I-J. Chen, J. W. Crowder, G. E. Hagler, D. C. Bogue, and J. L. White, Trans.
5. B. L. Lee and J. L. White, Trans. SOC. Rheol., 18,467 (1974). 6. F. T. Trouton, R o c . R. SOC., A77,426 (1906). 7. M. Reiner, Am. J. Math., 68,672 (1946). 8. H. Nitschmann and J. Schrade, Helv. Chim. Acta, 31,297 (1948). 9. M. Yamamoto, J. Phys. SOC. Jpn., 12,1148 (1957).
Interscience, New York, 1963.
Eds., Academic Press, N.Y.
SOC. Rheol., 15,195 (1971).
10. A. Ziabicki and K. Kedzierska, Kolloid-Z., 171,51 (1960). 11. S. Kase and T. Matsuo, J. Polym. Sci., A3, 2541 (1965); J. Appl. Polym. Sci., 11, 251
12. I. Hamana, M. Matsui, and S. Kato, Melliand Textilber., 5,499 (1969). 13. T. Ishibashi, K. Aoki, and T. Ishii, J. Appl. Polym. Sci., 14,597 (1970). 14. D. Acierno, J. N. Dalton, J. M. Rodriguez, and J. L. White, J. Appl. Polym. Sci., 15,2395
15. C. D. Han and R. R. Lamonte, Trans. SOC. Rheol., 16,447 (1972). 16. R. R. Lamonte and C. D. Han, J. Appl. Polym. Sci., 16,3285 (1972). 17. I-J. Chen, G. E. Hagler, L. E. Abbott, D. C. Bogue, and J. L. White, Trans. SOC. Rheol., 16,
18. V. Bankar, J. E. Spruiell and J. L. White, J. Appl. Polym. Sci., 21,2135 (1977). 19. H. J. Karam and J. C. Bellinger, Trans. SOC. Rheol., 8,61 (1964). 20. R. L. Ballman, Rheol. Acta, 4,137 (1965). 21. J. Meissner, Rheol. Acta, 8,78 (1969). 22. J. Meissner, Rheol. Acta, 10,230 (1971). 23. J. Meissner, Trans. SOC. Rheol., 16,405 (1972). 24. G. V. Vinogradov, B. V. Radushkevich, and V. D. Fikhman, J. Polym. Sci. A-2, 8,1(1970). 25. J. F. Stevenson, A.Z.Ch.E.J., 18,540 (1972).
(1967).
(1971).
473 (1972).
ELONGATIONAL FLOW 1079
26. C. W. Macosko and J. M. Lorntaen, SPE Antec Tech. Papers, 22,461 (1973). 27. A. E. Everage, and R. L. Ballman, J. Appl. Polym. Sci., 20,1137 (1976). 28. F. N. Cogswell, Plast. Polym., 36,109 (1968). 29. F. N. Cogswell, Rheol. Acta, 8,187 (1969). 30. G. V. Vinogradov, V. D. Fikhman, and B. V. Radushkevich, Rheol. Acta, 11,286 (1972). 31. H. Munstedt, Rheol. Acta, 14,1077 (1975). 32. T. Takaki, and D. C. Bogue, J. Appl. Polym. Sci., 19,419 (1975). 33. F. N. Cogswell, Trans. SOC. Rheol., 16,383 (1972). 34. F. N. Cogswell, in Fiber and Yarn Processing, J . L. White, Ed., Appl. Polym. Symp., 27,l
35. J. L. White, and Y. Ide, in Fiber and Yarn Processing, J . L. White, Ed., Appl. Polym. Symp.,
36. M. M. Denn, and G. Marrucci, A.Z.Ch.E.J., 17,101 (1971). 37. H. Chang, and A. S. Lodge, Rheol. Acta, 11,127 (1972). 38. J. M. Dealy, Polym. Eng. Sci., 11,433 (1971). 39. A. Ziabicki, and R. Takserman-Krozer, Kolloid-2. 2. Polym., 198, 60 (1964); ibid., 199,9
40. A. Ziabicki, in Man-Made Fibers, Vol. 1, H. Mark, S. M. Atlas, and E. Cernia, Eds., Wiley,
41. S. T. Onogi, Matsumoto, and E. Kamei, Polym. J., 3,531 (1972). 42. E. Kamei, and S. Onogi, in Fiber and Yarn Processing, J . L. White, Ed., Appl. Polym. Symp.,
43. Y. Ide and J. L. White, J. Appl. Polym. Sci., 20,2511 (1976). 44. Y. Ide, Ph.D. Dissertation, University of Tennessee, Knoxville, 1976. 45. I-J. Chen and D. C. Bogue, Trans. SOC. Rheol., 16,59 (1972). 46. I-J. Chen, Ph.D. Dissertation, University of Tennessee, Knoxville, 1971. 47. J. L. White and J. F. Roman, J. Appl. Polym. Sci., 20,1005 (1976), ibid. 21,869 (1977). 48. N. Minagawa and J. L. White, J. Appl. Polym. Sci., 20,501 (1976). 49. H. P. Nadella, H. M. Henson, J. E. Spruiell, and J. L. White, J. Appl. Polym. Sci., 21,3003
50. G. K. Batchelor, Q. J. Mech. Appl. Math., 7,179 (1954). 51. L. R. G. Treloar, Physics of Rubber Elasticity, ed., 2nd ed, Oxford (1958). 52. A. Tobolsky, Properties and Structure of Polymers, Wiley, New York 1960. 53. A. Tobolsky and K. Murakami, J. Polym. Sci., 40,443 (1959). 54. I. Furuta, V. M. Lobe, and J. L. White, J. Non-Newtonian Fluid Mech., 1,207 (1976). 55. D. C. Bogue and J. L. White, Engineering Analysis of Non-Newtonian Fluids, NATO Agar-
56. A. S. Lodge, Trans. Faraday SOC., 32,120 (1956). 57. A. S. Lodge, Elastic Liquids, Academic Press, New York 1964. 58. H. Chang and A. S. Lodge, Rheol. Acta, 10,448 (1971).
(1975).
27,61 (1975).
(1964).
New York, 1967.
27,19 (1975).
(1977).
cograph # 144,1970.
Received December 6,1976