Embed Size (px)
Citation preview

Which tools to monitor HIV
treatment in resource-limited
settings?
Pierre-Marie Girard
Hôpital St Antoine
Institut de Médecine et d’Epidémiologie Appliquée,
Fondation Internationale Léon Mba
Paris, France
« ARV therapy in sub saharan Africa : • Complicated combination regimens• Expensive and dangerous• Severe side effects• Rapid development of drug resistance in the
community»
Lancet, 2002

There is no excuse for There is no excuse for delay !!!!delay !!!!
IAS Conference, Paris,2003IAS Conference, Paris,2003
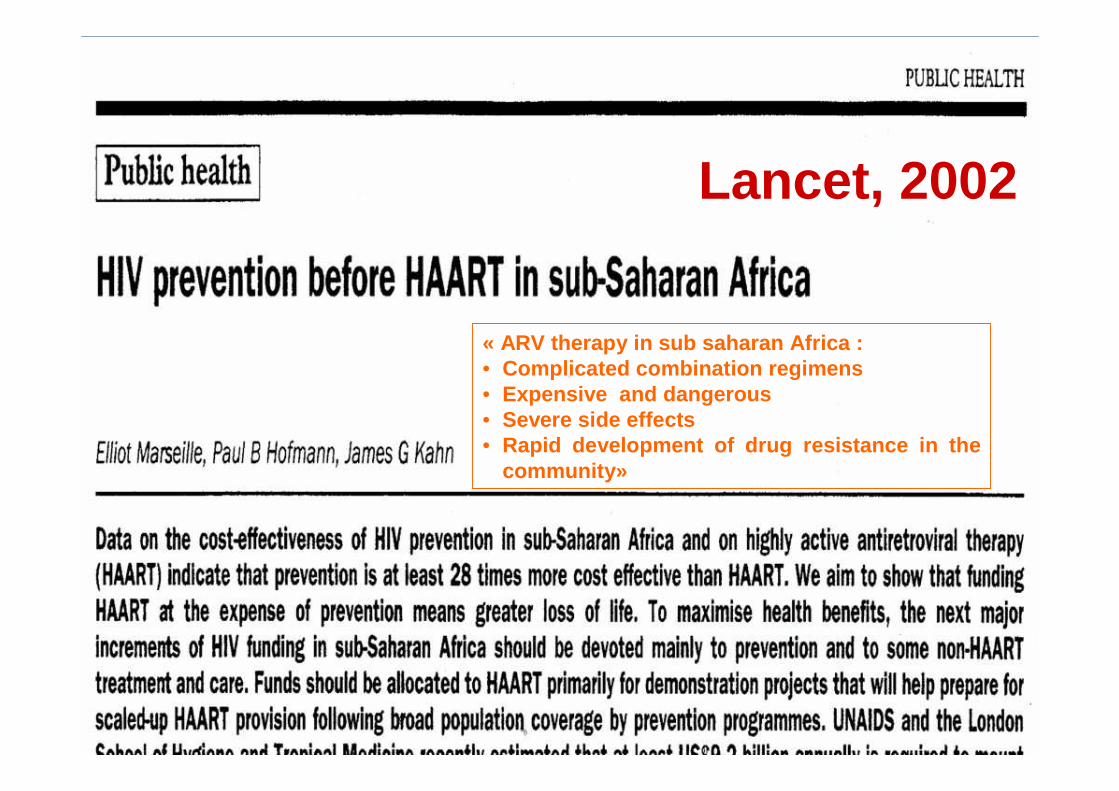
Where are we ?
• Anti retroviral therapy has become a reality in
developing countries
• With SUCCESS, CONSTRAINTS, LIMITATIONS,
and MANY HOT QUESTIONS FOR THE FUTURE
• We have moved from « proof of concept » to
« public health approach »
• Is Universal therapy » for HIV patients (WHO)
in 2010 a realistic target ?
Figure
2008 Report on the global AIDS epidemic
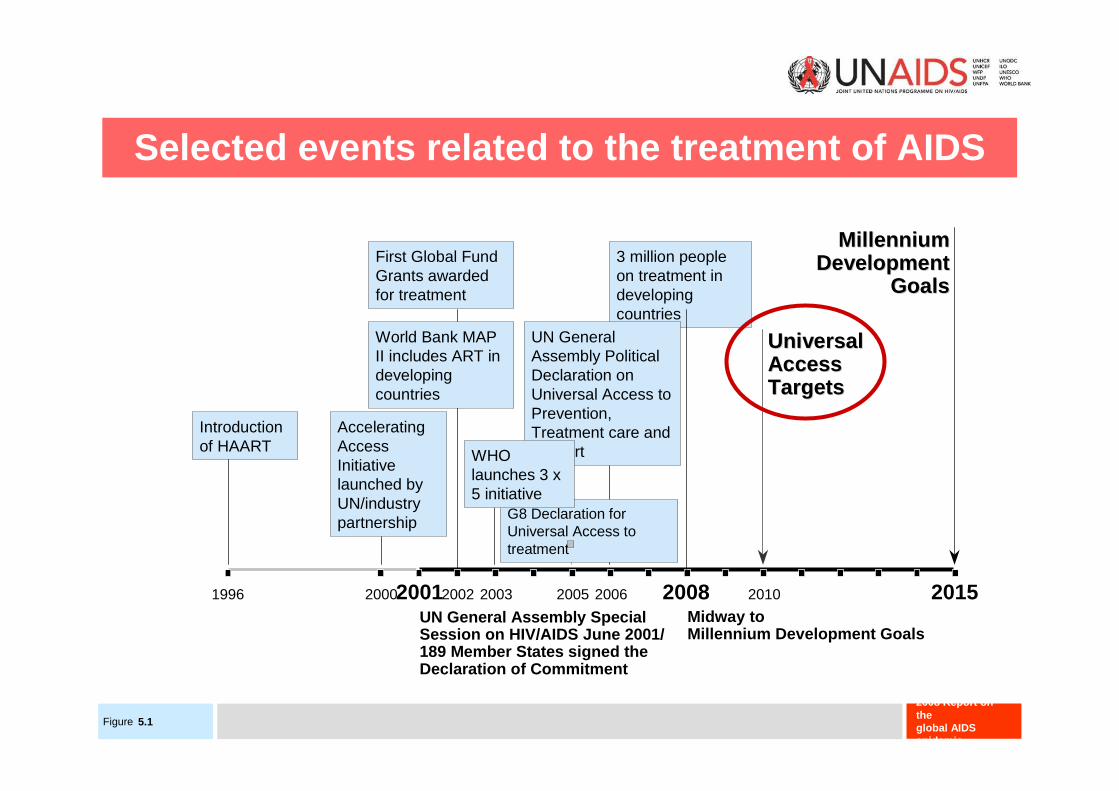
Selected events related to the treatment of AIDS
2000 2005 2006 2010
Accelerating Access Initiative launched by UN/industry partnership
3 million people on treatment in developing countries
UN General Assembly Political Declaration on Universal Access to Prevention, Treatment care and support
1996
Introduction of HAART
World Bank MAP II includes ART in developing countries
G8 Declaration for Universal Access to treatment
First Global Fund Grants awarded for treatment
20032002
WHO launches 3 x 5 initiative
Universal Universal AccessAccessTargetsTargets
MillenniumMillenniumDevelopmentDevelopment
GoalsGoals
Midway toMillennium Development Goals
UN General Assembly Special Session on HIV/AIDS June 2001/189 Member States signed the Declaration of Commitment
2001 2008 2015
5.1
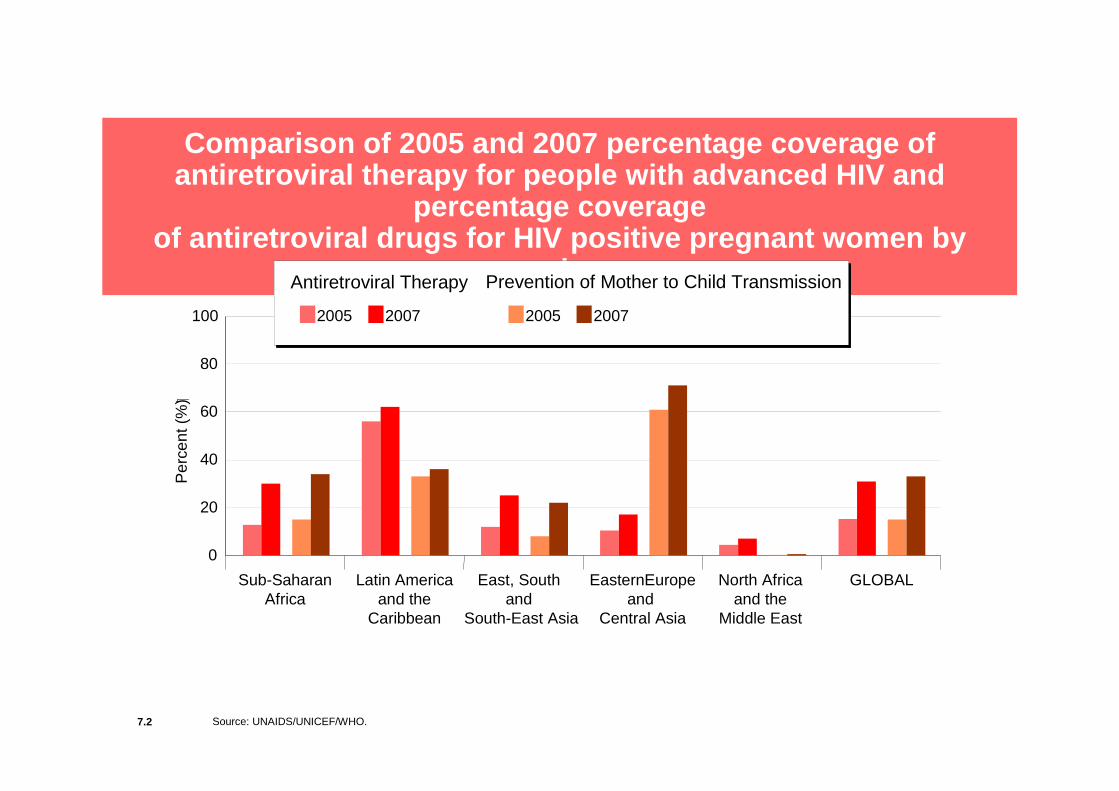
Comparison of 2005 and 2007 percentage coverage of antiretroviral therapy for people with advanced HIV and
percentage coverage of antiretroviral drugs for HIV positive pregnant w omen by
region
7.2 Source: UNAIDS/UNICEF/WHO.
GLOBALEasternEuropeand
Central Asia
Latin Americaand the
Caribbean
North Africaand the
Middle East
East, South and
South-East Asia
Sub-SaharanAfrica
0
20
40
60
80
100
Per
cent
(%
)�
2005 2007 2005 2007
Antiretroviral Therapy Prevention of Mother to Child Transmission

Figure
2008 Report on the global AIDS epidemic
Total annual resources available for AIDS 1986–2007
[i] 1996-2005 data: Extracted from 2006 Report on the Global AIDS Epidemic (UNAIDS, 2006); [ii] 1986-1993 data: Mann.&. Tarantola, 1996
Notes: [1] 1986-2000 figures are for international funds only; [2] Domestic funds are included from 2001 onwards
0
1000
2000
3000
4000
5000
6000
7000
8000
9000
US
$ m
illio
n
2921623
8.3 billion
Signing of Declaration of Commitment on HIV/AIDS,
UNGASS
1996 1997 1998 19992000 20012002 2003 2004 200519861987 1990 19911992 1993
Less than US$ 1 million
59 212
World BankMAP
launch
Global Fund
PEPFAR
257
UNAIDS
Gates Foundation
2006 2007
10 000 8.9 billion
10 billion
7.1 Source: UNAIDS & WHO unpublished estimates, 2007

Huge international fundings are
critical
but are not enough…
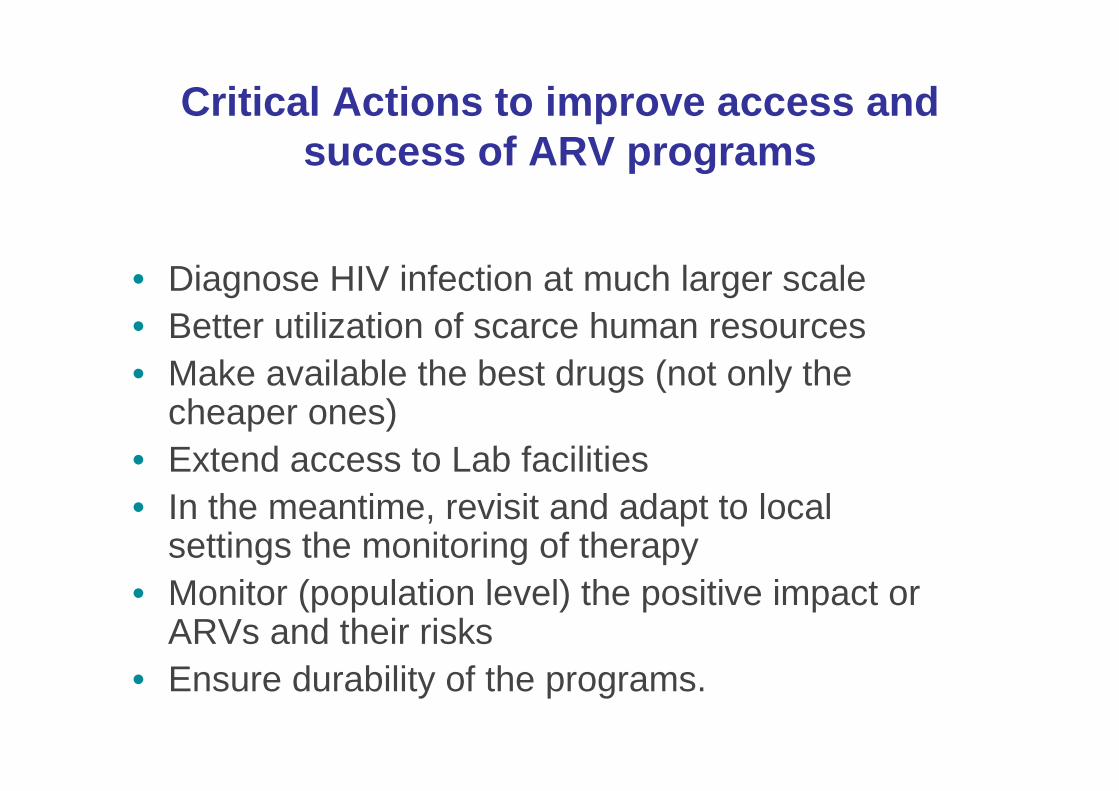
Critical Actions to improve access and success of ARV programs
• Diagnose HIV infection at much larger scale• Better utilization of scarce human resources• Make available the best drugs (not only the
cheaper ones)• Extend access to Lab facilities• In the meantime, revisit and adapt to local
settings the monitoring of therapy• Monitor (population level) the positive impact or
ARVs and their risks• Ensure durability of the programs.

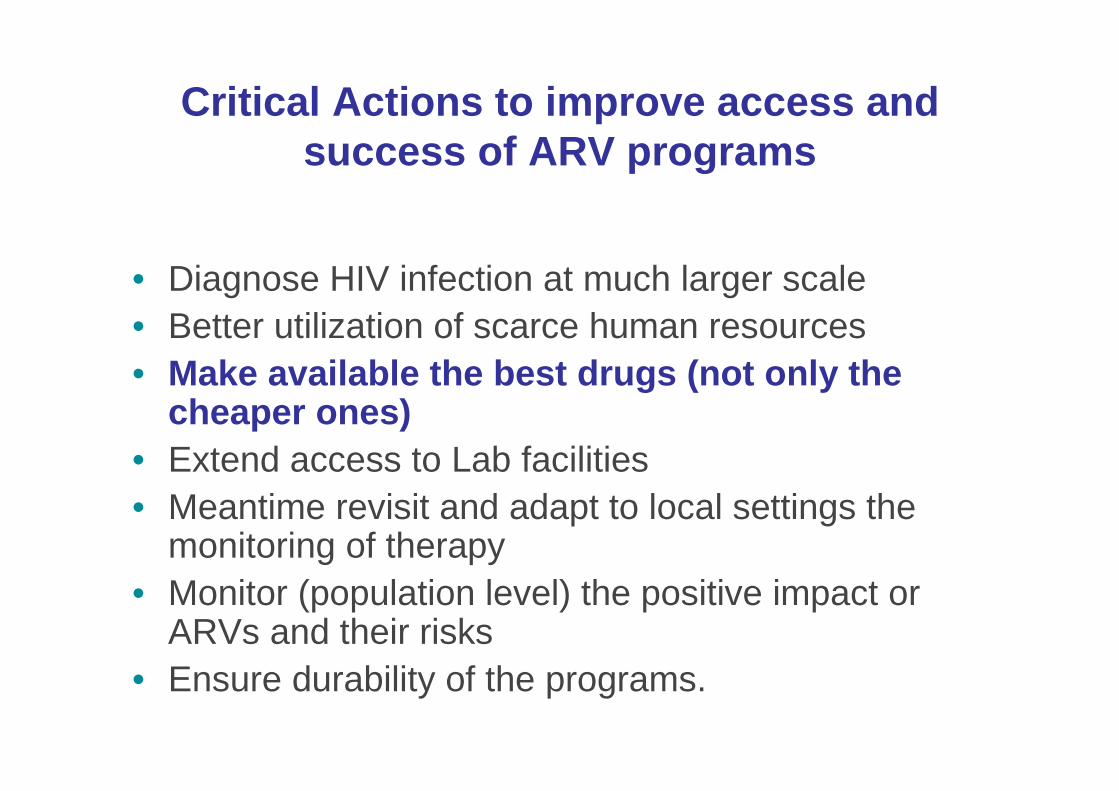
Critical Actions to improve access and success of ARV programs
• Diagnose HIV infection at much larger scale• Better utilization of scarce human resources• Make available the best drugs (not only the
cheaper ones)• Extend access to Lab facilities• Meantime revisit and adapt to local settings
the monitoring of therapy• Monitor (population level) the positive impact or
ARVs and their risks• Ensure durability of the programs.
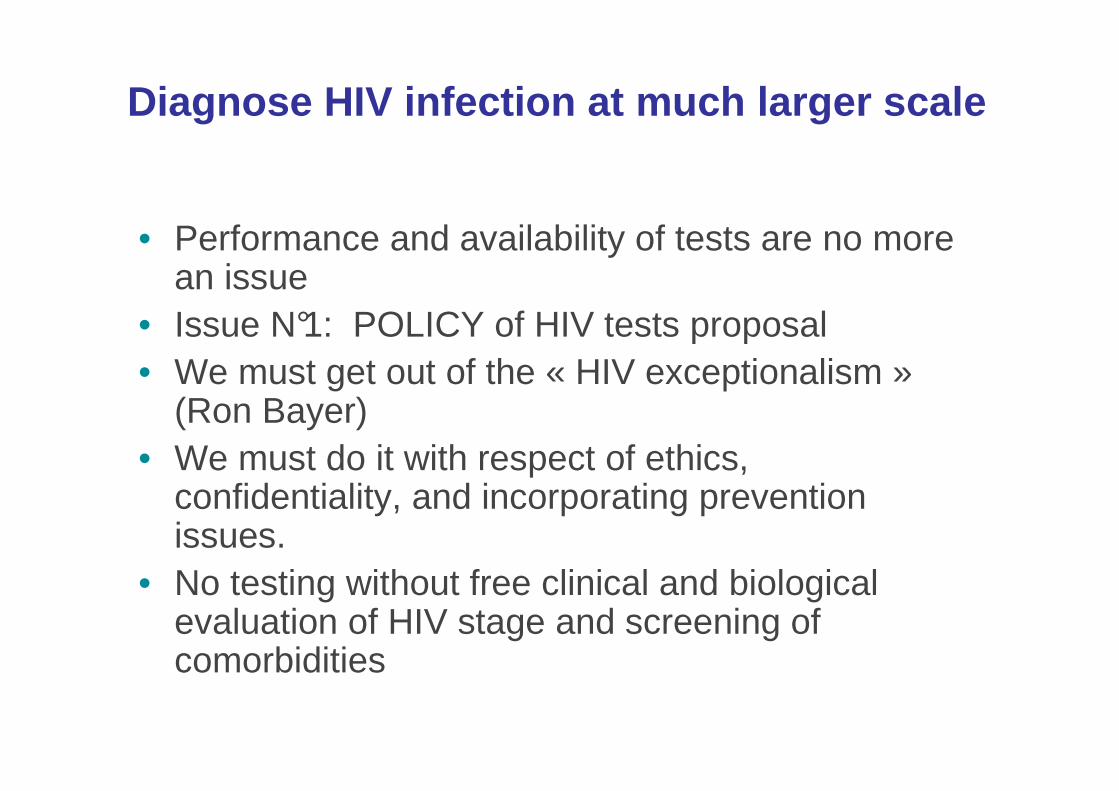
Diagnose HIV infection at much larger scale
• Performance and availability of tests are no more an issue
• Issue N°1: POLICY of HIV tests proposal• We must get out of the « HIV exceptionalism »
(Ron Bayer) • We must do it with respect of ethics,
confidentiality, and incorporating preventionissues.
• No testing without free clinical and biologicalevaluation of HIV stage and screening of comorbidities

Projection for HIV care visits in Western Kenya, Cohen et al, AIDS, 2004
Critical Actions to improve access and success of ARV programs
• Diagnose HIV infection at much larger scale• Better utilization of scarce human resources• Make available the best drugs (not only the
cheaper ones)• Extend access to Lab facilities• Meantime revisit and adapt to local settings the
monitoring of therapy• Monitor (population level) the positive impact or
ARVs and their risks• Ensure durability of the programs.
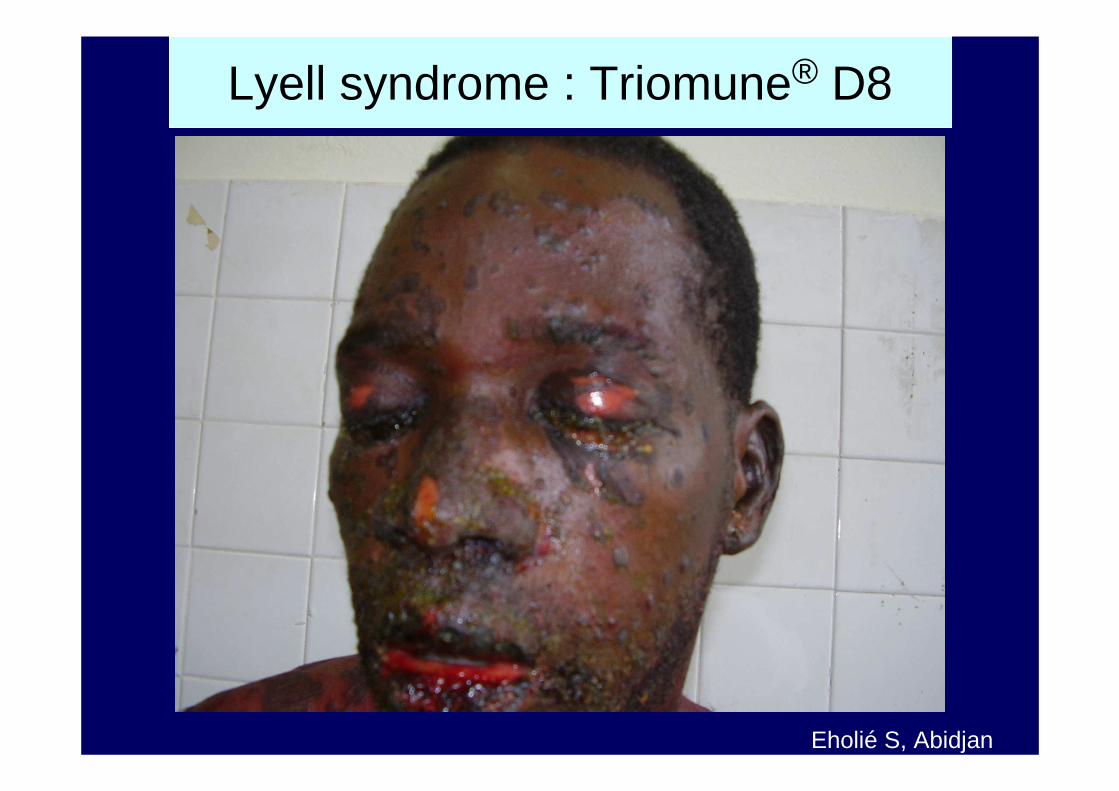
Lyell syndrome : Triomune® D8
Eholié S, Abidjan
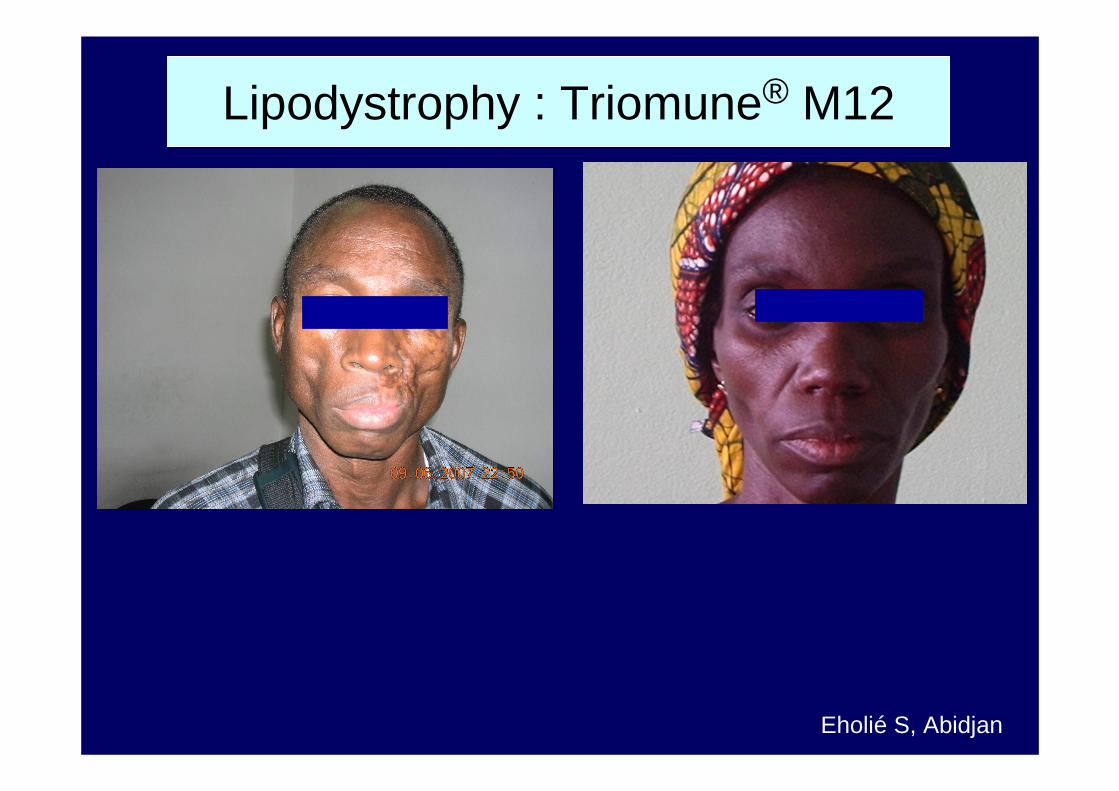
Eholié S, Abidjan
Lipodystrophy : Triomune® M12

t
Egger, 2007
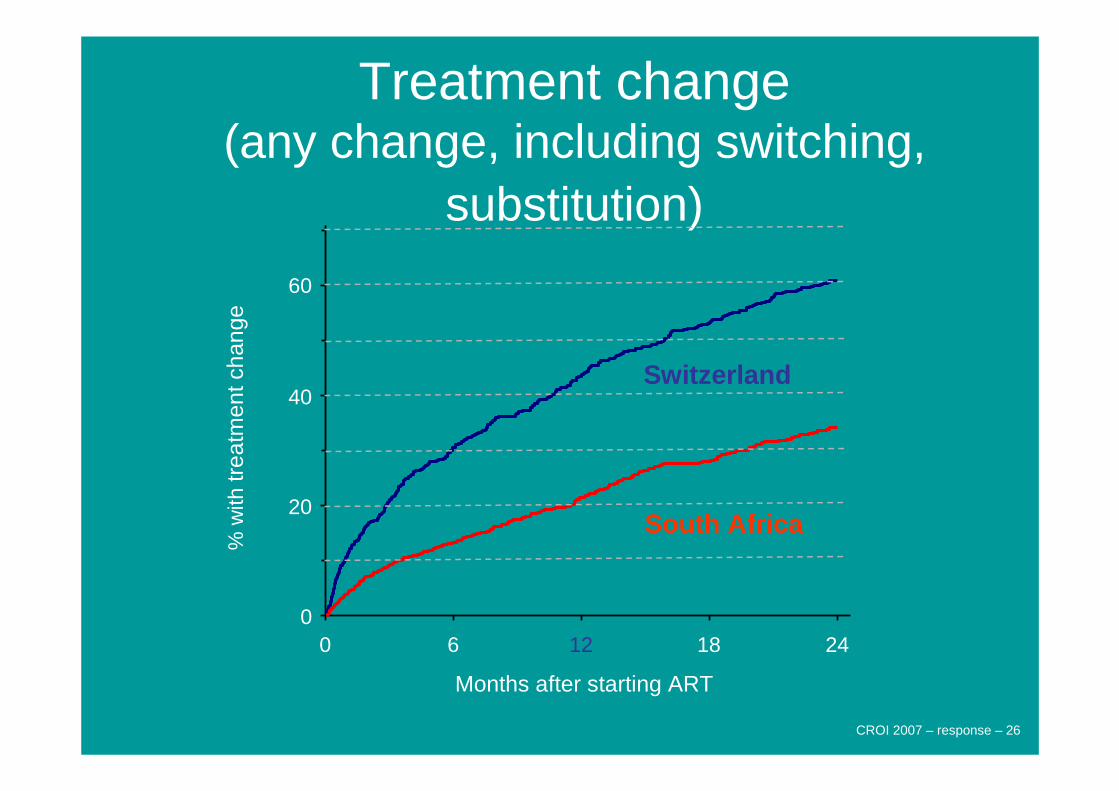
Treatment change(any change, including switching,
substitution)
Months after starting ART
0 6 12 18 24
% w
ithtr
eatm
entc
hang
e
0
20
40
60
Switzerland
South Africa
CROI 2007 – response – 26
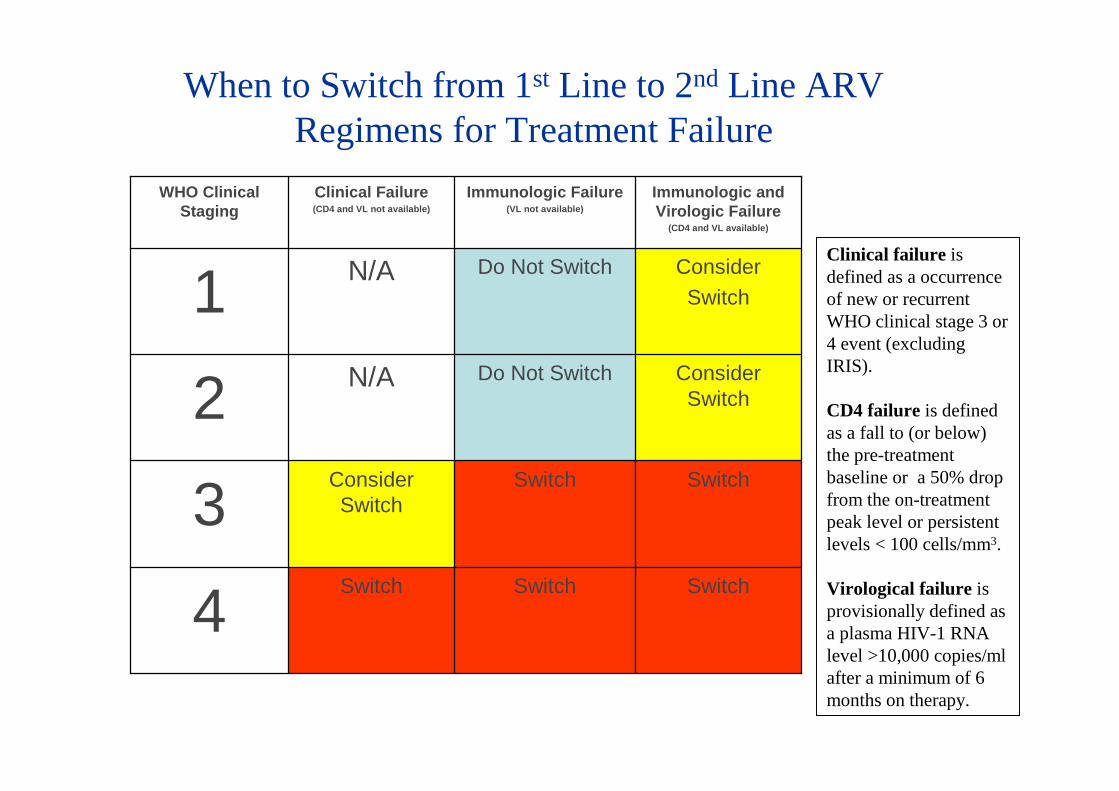
Switch
Switch
Consider Switch
ConsiderSwitch
Immunologic and Virologic Failure
(CD4 and VL available)
Immunologic Failure(VL not available)
Clinical Failure(CD4 and VL not available)
SwitchConsider Switch3
SwitchSwitch
4
Do Not SwitchN/A2
Do Not SwitchN/A1
WHO Clinical Staging
When to Switch from 1st Line to 2nd Line ARV Regimens for Treatment Failure
Clinical failure is defined as a occurrence of new or recurrent WHO clinical stage 3 or 4 event (excluding IRIS).
CD4 failure is defined as a fall to (or below) the pre-treatment baseline or a 50% drop from the on-treatment peak level or persistent levels < 100 cells/mm3.
Virological failure is provisionally defined as a plasma HIV-1 RNA level >10,000 copies/ml after a minimum of 6 months on therapy.
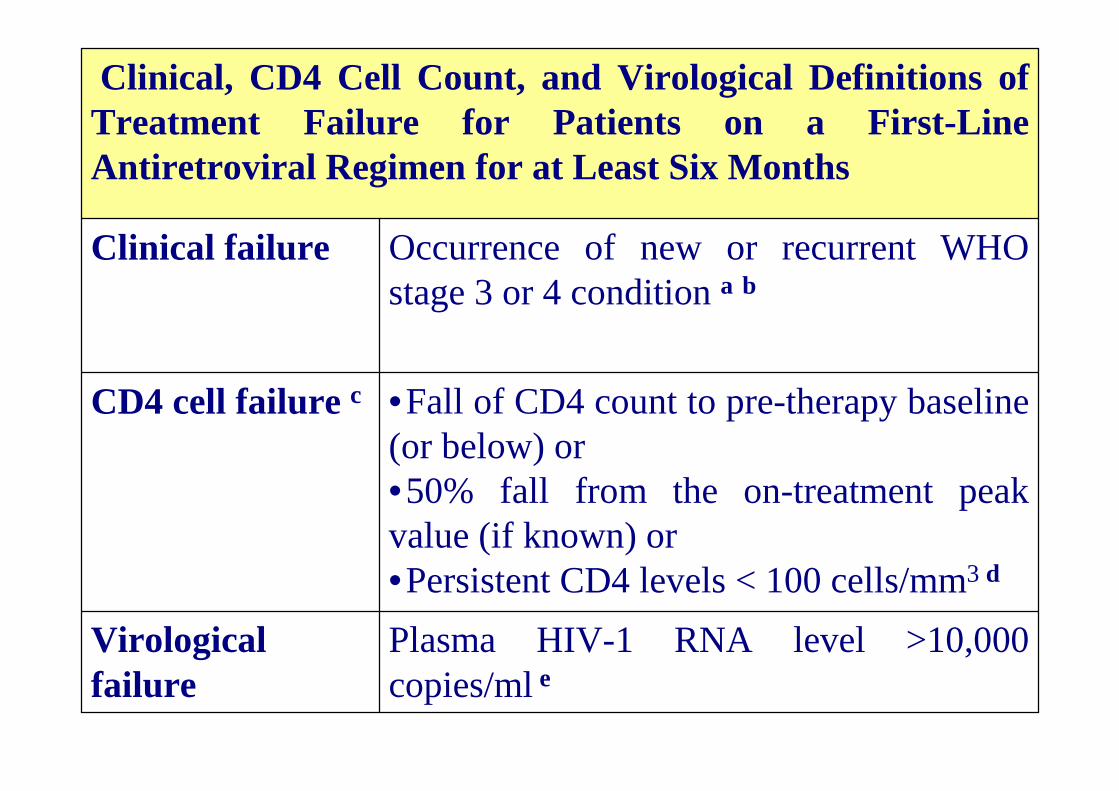
Plasma HIV-1 RNA level >10,000 copies/ml e
Virologicalfailure
•Fall of CD4 count to pre-therapy baseline (or below) or•50% fall from the on-treatment peak value (if known) or•Persistent CD4 levels < 100 cells/mm3 d
CD4 cell failure c
Occurrence of new or recurrent WHO stage 3 or 4 condition a b
Clinical failure
Clinical, CD4 Cell Count, and Virological Definitions of Treatment Failure for Patients on a First-Line Antiretroviral Regimen for at Least Six Months
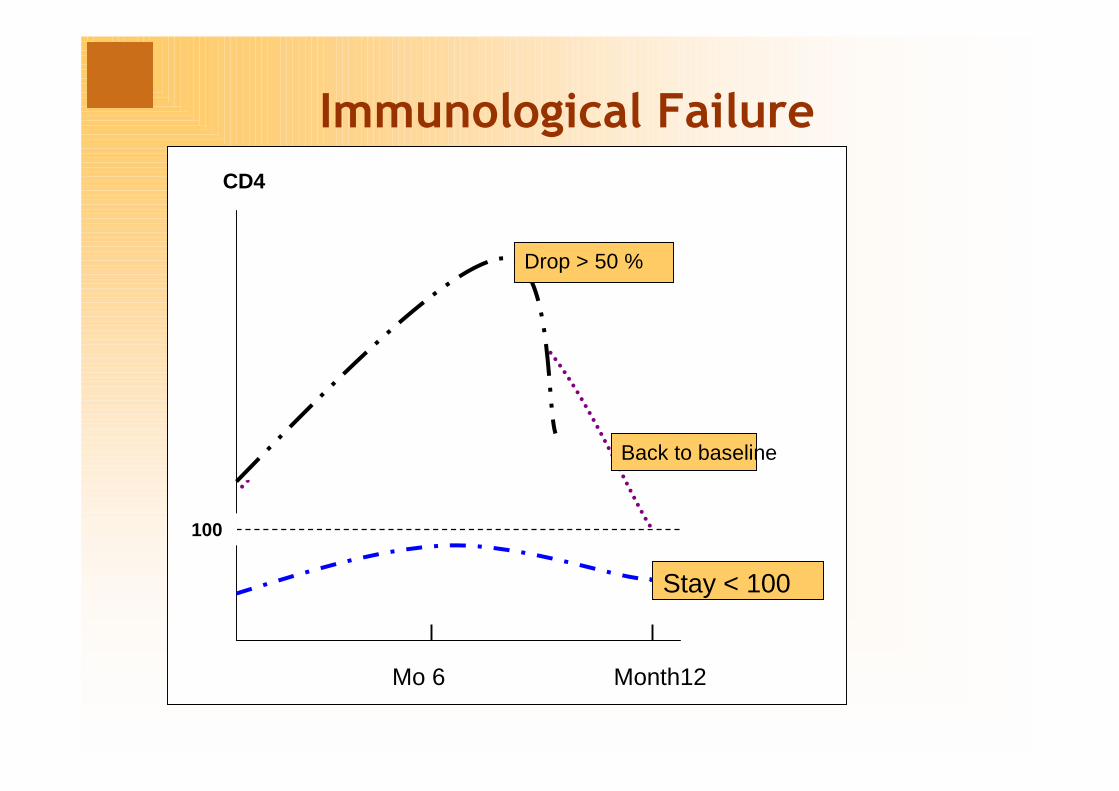
Immunological Failure
CD4
Mo 6 Month12
100
Drop > 50 %
Back to baseline
Stay < 100
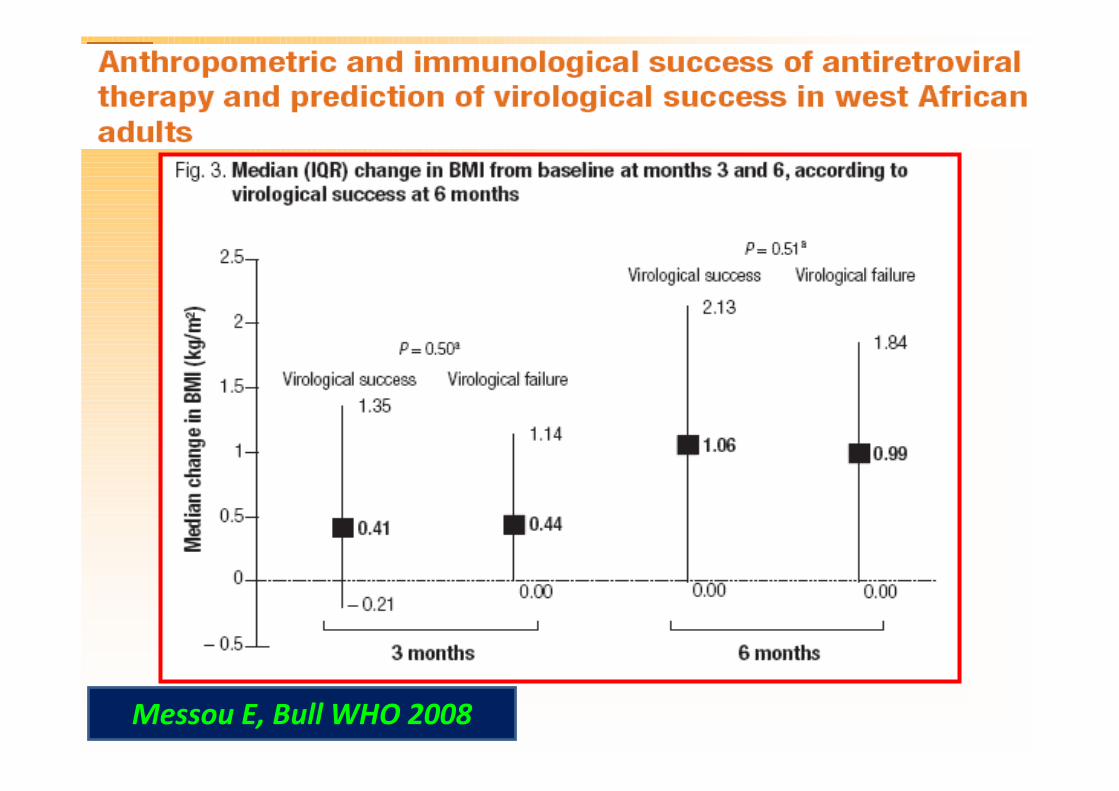
Messou E, Bull WHO 2008
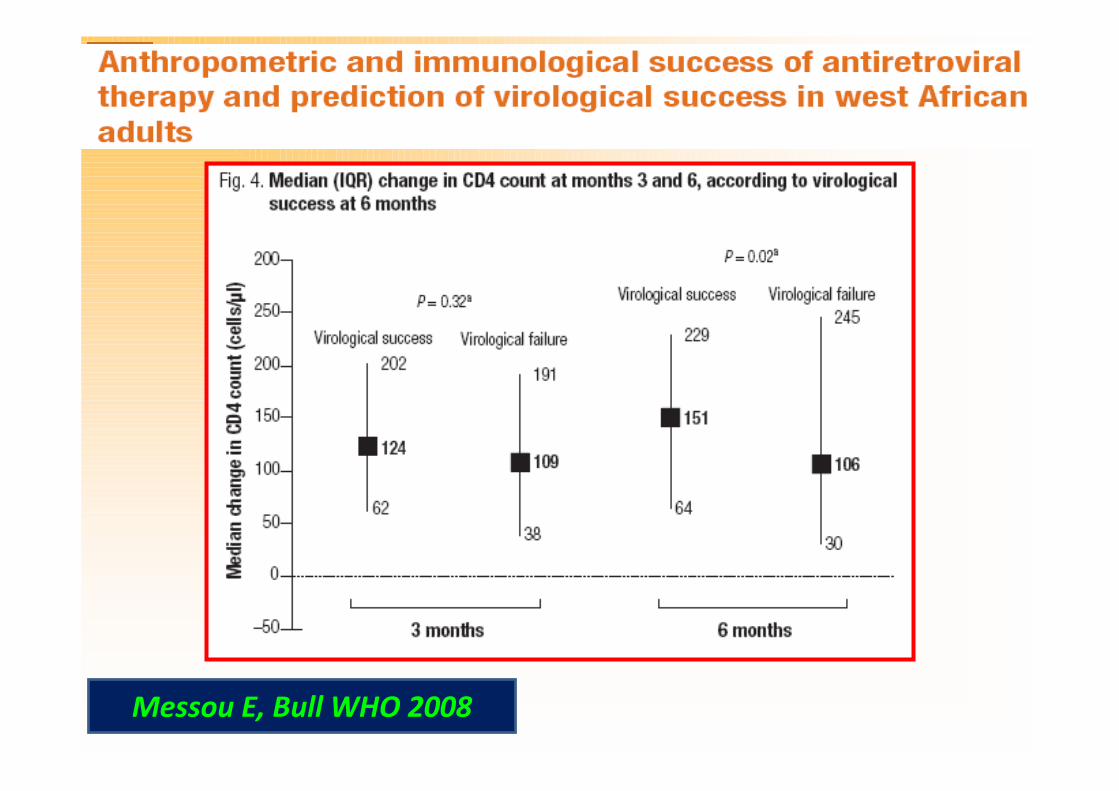
Messou E, Bull WHO 2008
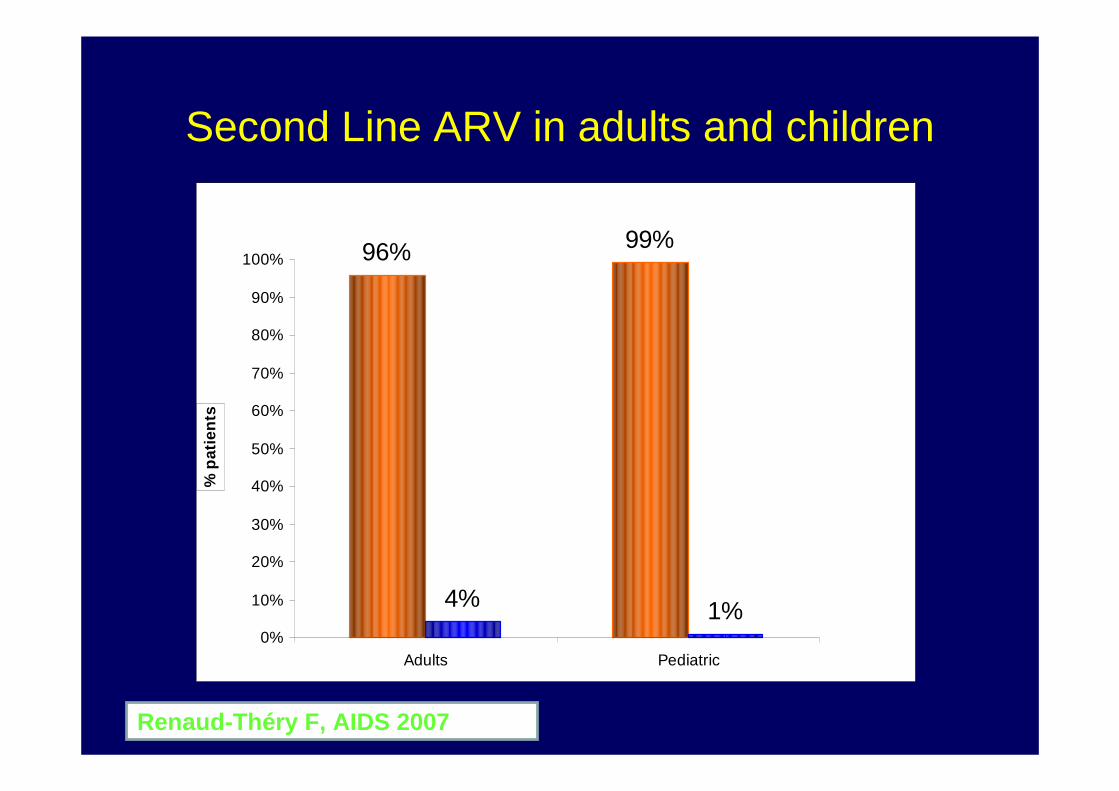
Second Line ARV in adults and children
96% 99%
4% 1%0%
10%
20%
30%
40%
50%
60%
70%
80%
90%
100%
Adults Pediatric
% p
atie
nts
Renaud-Théry F, AIDS 2007
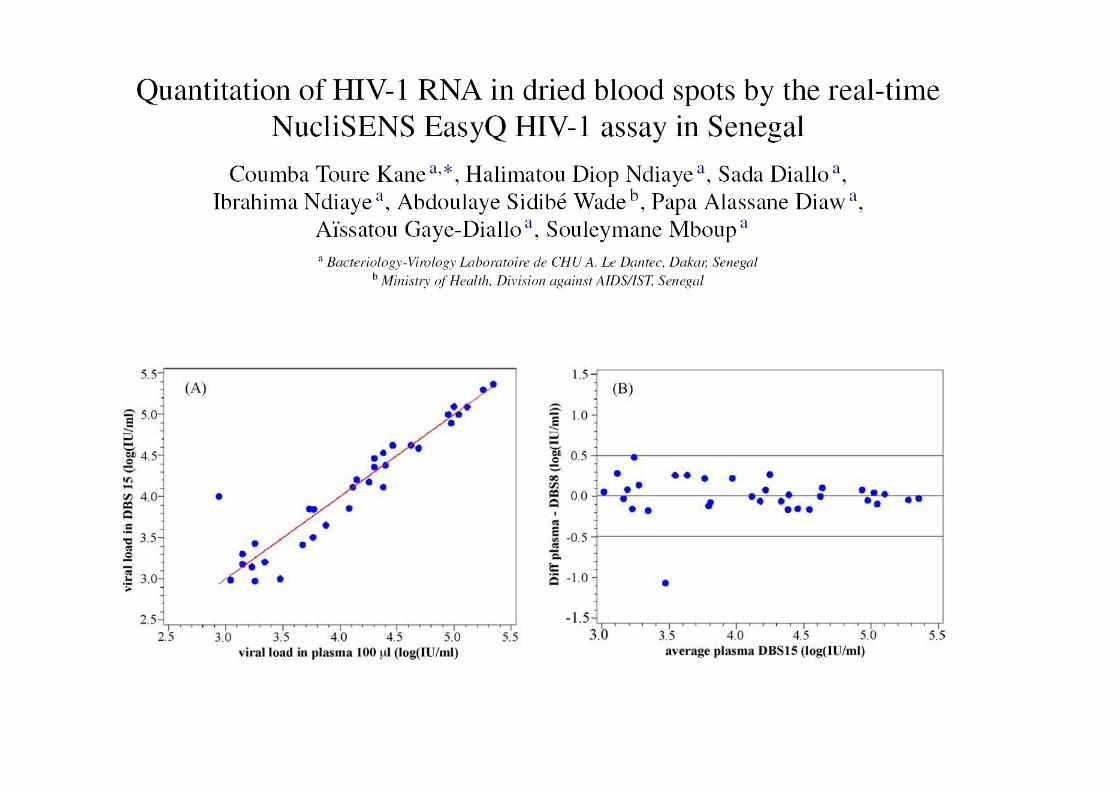
Extend access to Lab facilities
• Plasma Viral load measurements are the gold standard for assessing Antiretroviral activity.
• Its value assessed in 90’s firstly as a predictor of HIV clinical course then for early ARV failures
• Sensitivity has improved step-by-step starting from a threshold at 10 000 copies/ml to 40 copies/ml currently.
• Reproducibility is good.• Simplification of techniques less impressive than sensitivity
increase.• Access for PATIENT INDIVIDUAL MONITORING remains
exceptional in most Developing countries settings.
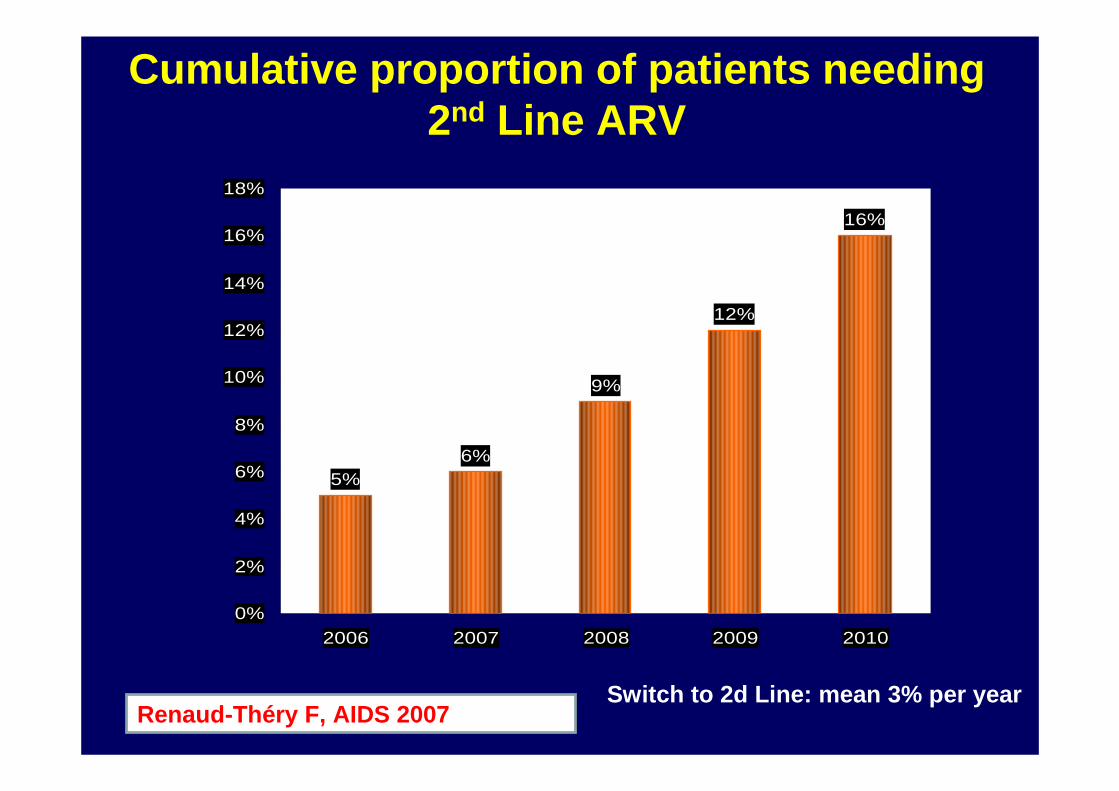
Cumulative proportion of patients needing 2nd Line ARV
Switch to 2d Line: mean 3% per year
5%6%
9%
12%
16%
0%
2%
4%
6%
8%
10%
12%
14%
16%
18%
2006 2007 2008 2009 2010
Renaud-Théry F, AIDS 2007
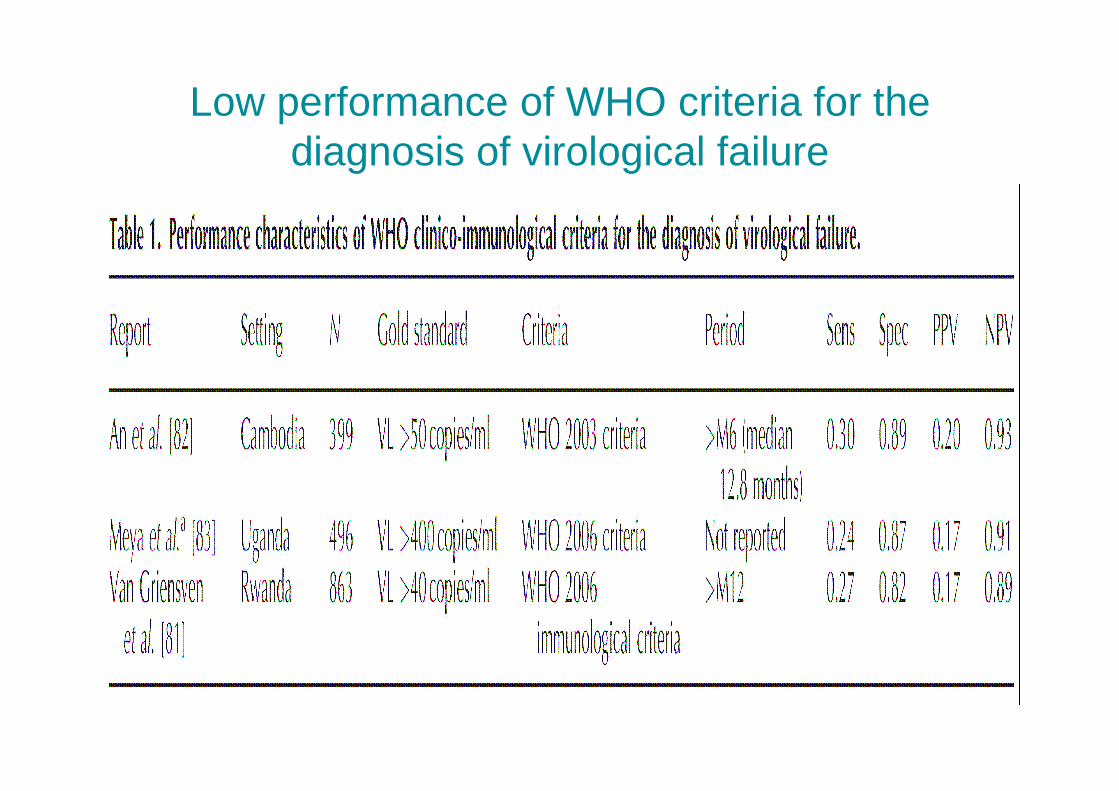
Low performance of WHO criteria for the diagnosis of virological failure
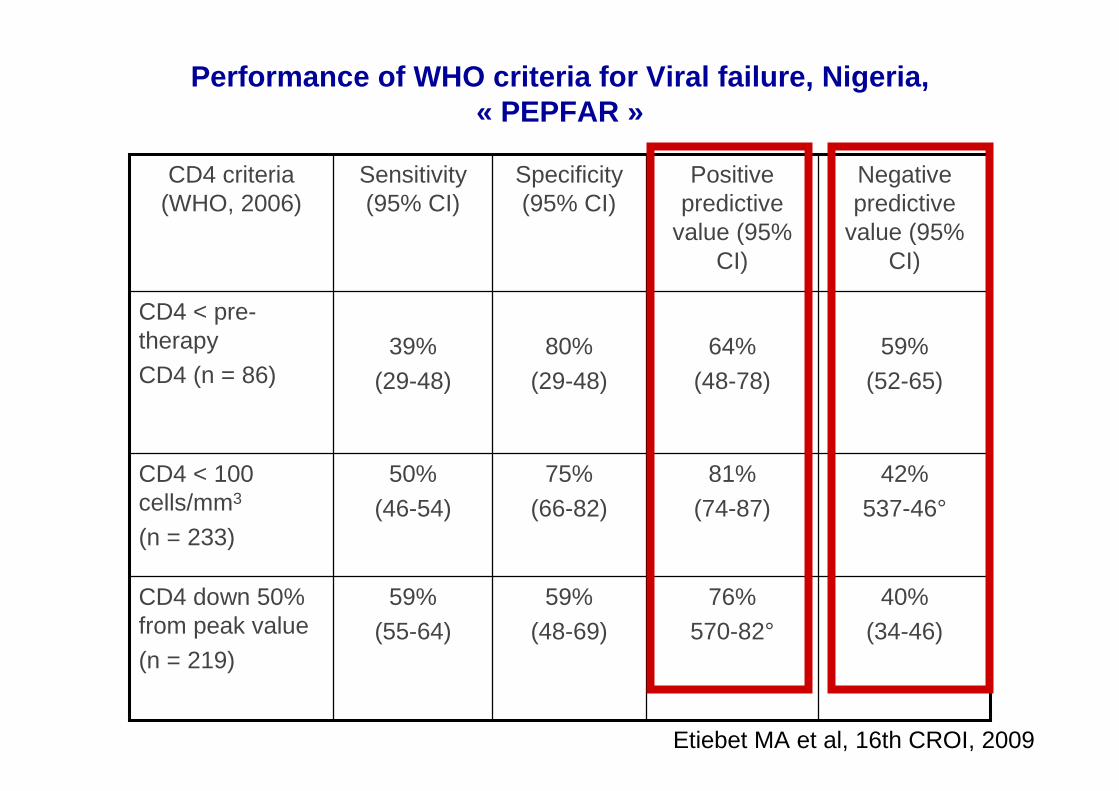
Performance of WHO criteria for Viral failure, Niger ia, « PEPFAR »
40%(34-46)
76%570-82°
59% (48-69)
59%(55-64)
CD4 down 50% from peak value
(n = 219)
42%
537-46°
81%
(74-87)
75%
(66-82)
50%
(46-54)
CD4 < 100 cells/mm3
(n = 233)
59%
(52-65)
64%
(48-78)
80%
(29-48)
39%
(29-48)
CD4 < pre-therapyCD4 (n = 86)
Negativepredictive
value (95% CI)
Positive predictive
value (95% CI)
Specificity(95% CI)
Sensitivity(95% CI)
CD4 criteria(WHO, 2006)
Etiebet MA et al, 16th CROI, 2009

Prices and regimen change in USD
3 000
2 250
Low income Lower Middle income
1 500
750
9191
3 750
132132469469
11391139554554
36203620
X13 X13
X27 X27
D4T/3TC/NVP – 1st line
TDF/FTC/EFV – substitute ABC/ddI/LPVr – 2nd line
Source: WHO HIV Département, AIDS Medicines & Diagno stics Service, Global Price Reporting Mechanism, 2008

WHO criteria for « virological failure »:poor performance
• Cohort in South Africa :
Sensitivity Specificitypositive
predictivevalue
CD4 21,2 % 95,8 % 36,8 %
ClinicalCriteria 15,2 % 88,1 % 12,8 %
P. Mee et al AIDS 2008,22 17-77
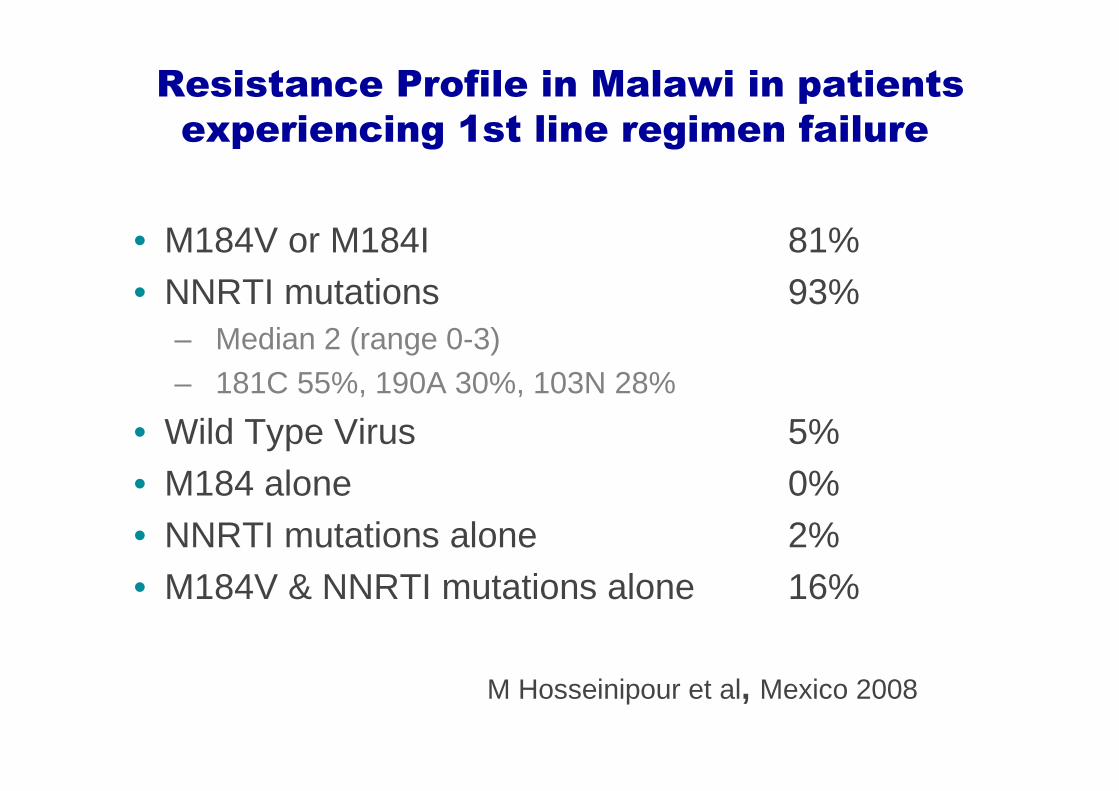
Resistance Profile in Malawi in patients
experiencing 1st line regimen failure
• M184V or M184I 81%• NNRTI mutations 93%
– Median 2 (range 0-3)– 181C 55%, 190A 30%, 103N 28%
• Wild Type Virus 5%• M184 alone 0%• NNRTI mutations alone 2%• M184V & NNRTI mutations alone 16%
M Hosseinipour et al, Mexico 2008
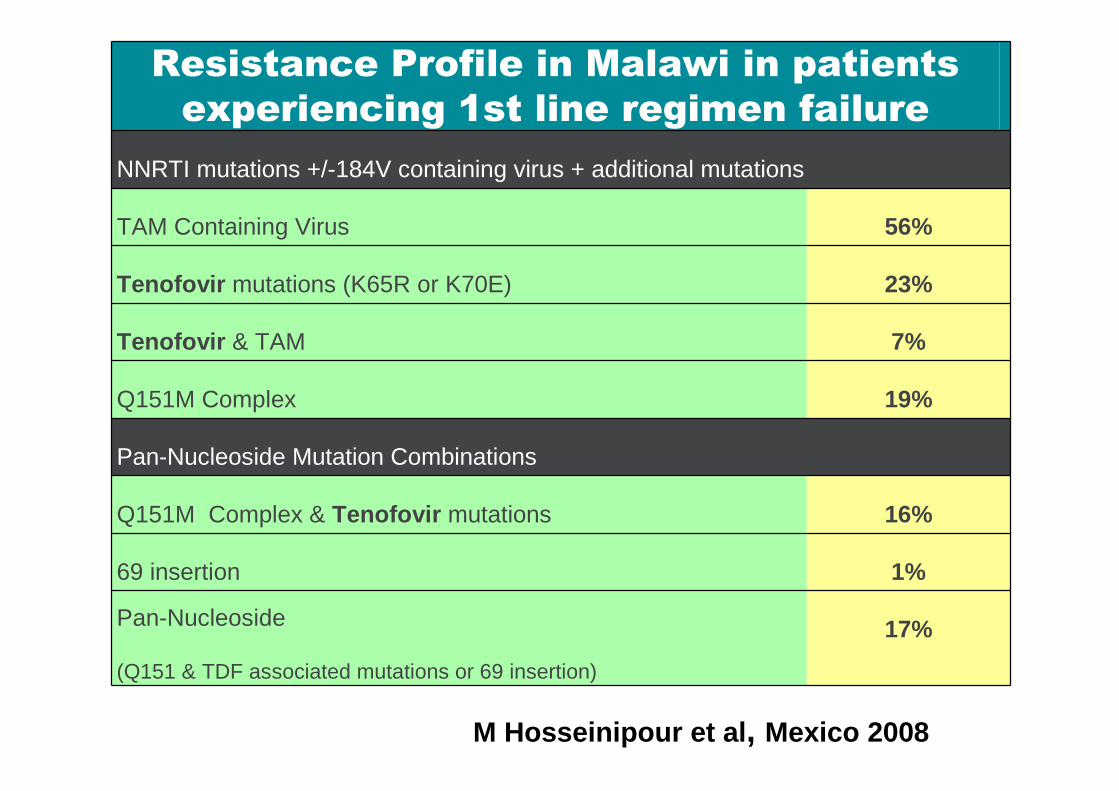
Resistance Profile in Malawi in patients
experiencing 1st line regimen failure
NNRTI mutations +/-184V containing virus + additional mutations
TAM Containing Virus 56%
Tenofovir mutations (K65R or K70E) 23%
Tenofovir & TAM 7%
Q151M Complex 19%
Pan-Nucleoside Mutation Combinations
Q151M Complex & Tenofovir mutations 16%
69 insertion 1%
Pan-Nucleoside
(Q151 & TDF associated mutations or 69 insertion)
17%
M Hosseinipour et al , Mexico 2008
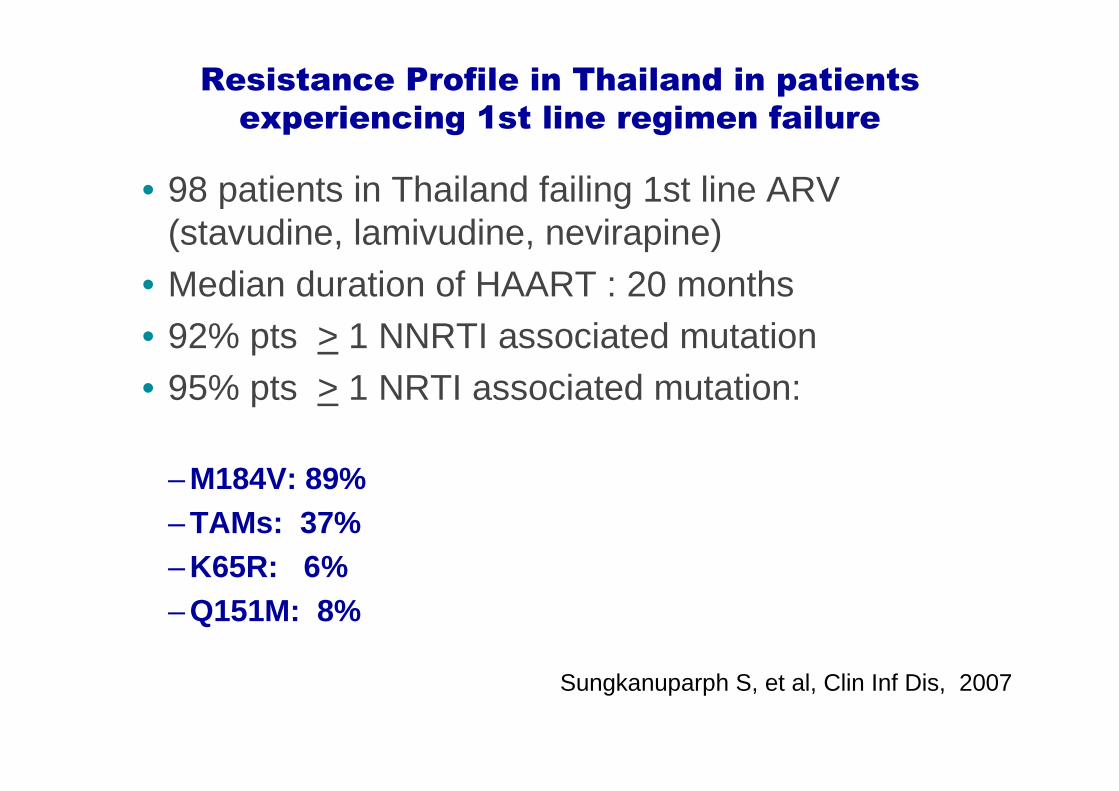
Resistance Profile in Thailand in patients
experiencing 1st line regimen failure
• 98 patients in Thailand failing 1st line ARV (stavudine, lamivudine, nevirapine)
• Median duration of HAART : 20 months• 92% pts > 1 NNRTI associated mutation • 95% pts > 1 NRTI associated mutation:
– M184V: 89%– TAMs: 37% – K65R: 6%– Q151M: 8%
Sungkanuparph S, et al, Clin Inf Dis, 2007
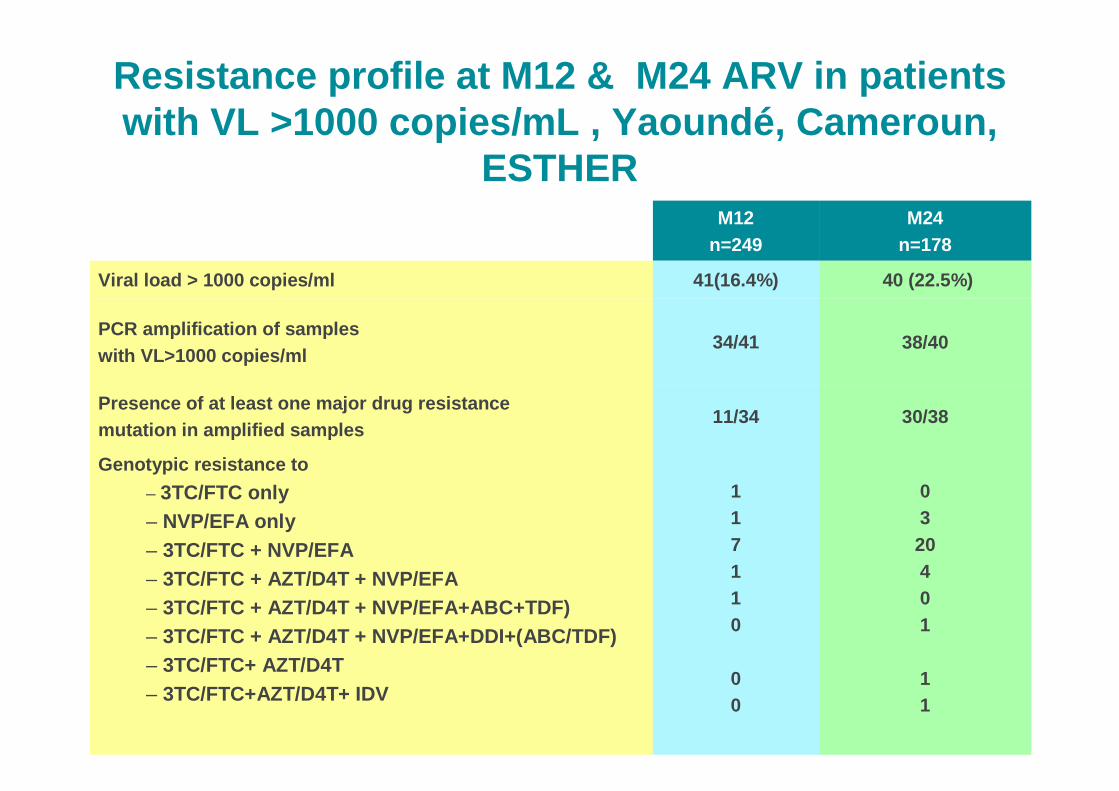
Resistance profile at M12 & M24 ARV in patients with VL >1000 copies/mL , Yaound é, Cameroun,
ESTHERM12
n=249M24
n=178
Viral load > 1000 copies/ml 41(16.4%) 40 (22.5%)
PCR amplification of samples with VL>1000 copies/ml
34/41 38/40
Presence of at least one major drug resistancemutation in amplified samples
11/34 30/38
Genotypic resistance to
– 3TC/FTC only– NVP/EFA only– 3TC/FTC + NVP/EFA– 3TC/FTC + AZT/D4T + NVP/EFA– 3TC/FTC + AZT/D4T + NVP/EFA+ABC+TDF)– 3TC/FTC + AZT/D4T + NVP/EFA+DDI+(ABC/TDF)– 3TC/FTC+ AZT/D4T– 3TC/FTC+AZT/D4T+ IDV
117110
00
0320401
11
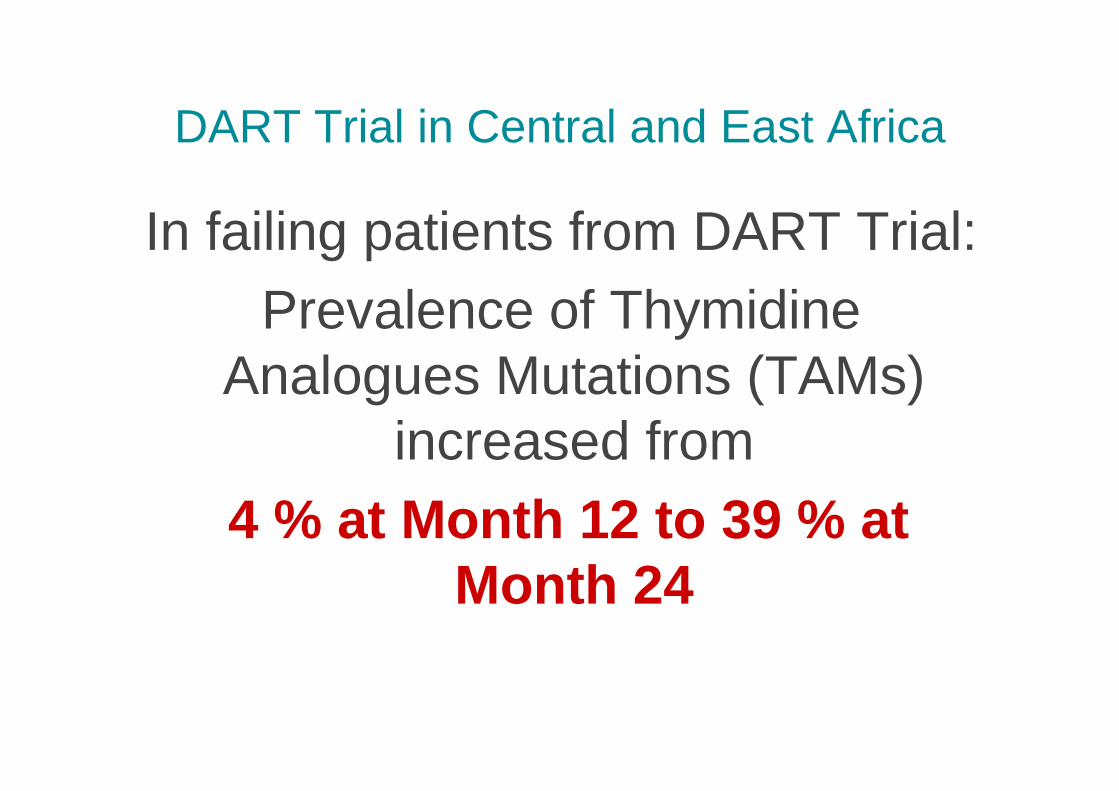
DART Trial in Central and East Africa
In failing patients from DART Trial:Prevalence of Thymidine
Analogues Mutations (TAMs) increased from
4 % at Month 12 to 39 % at Month 24
DART study group
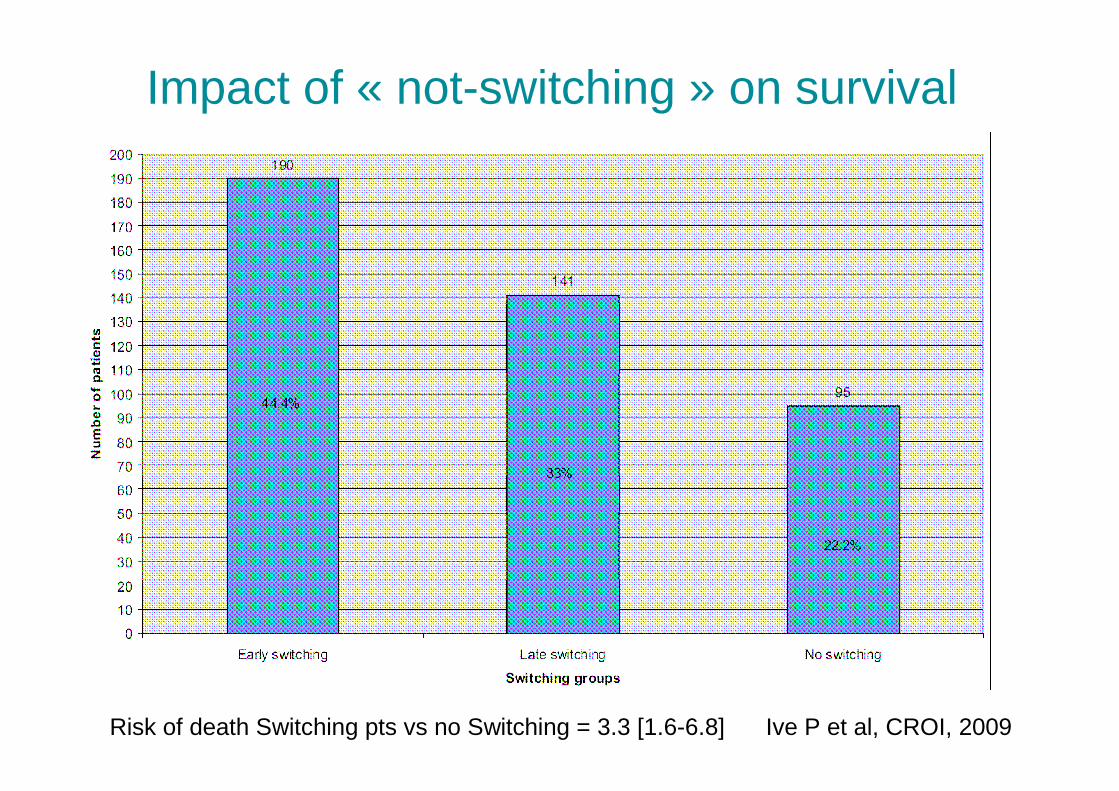
Impact of « not-switching » on survival
Risk of death Switching pts vs no Switching = 3.3 [1.6-6.8] Ive P et al, CROI, 2009
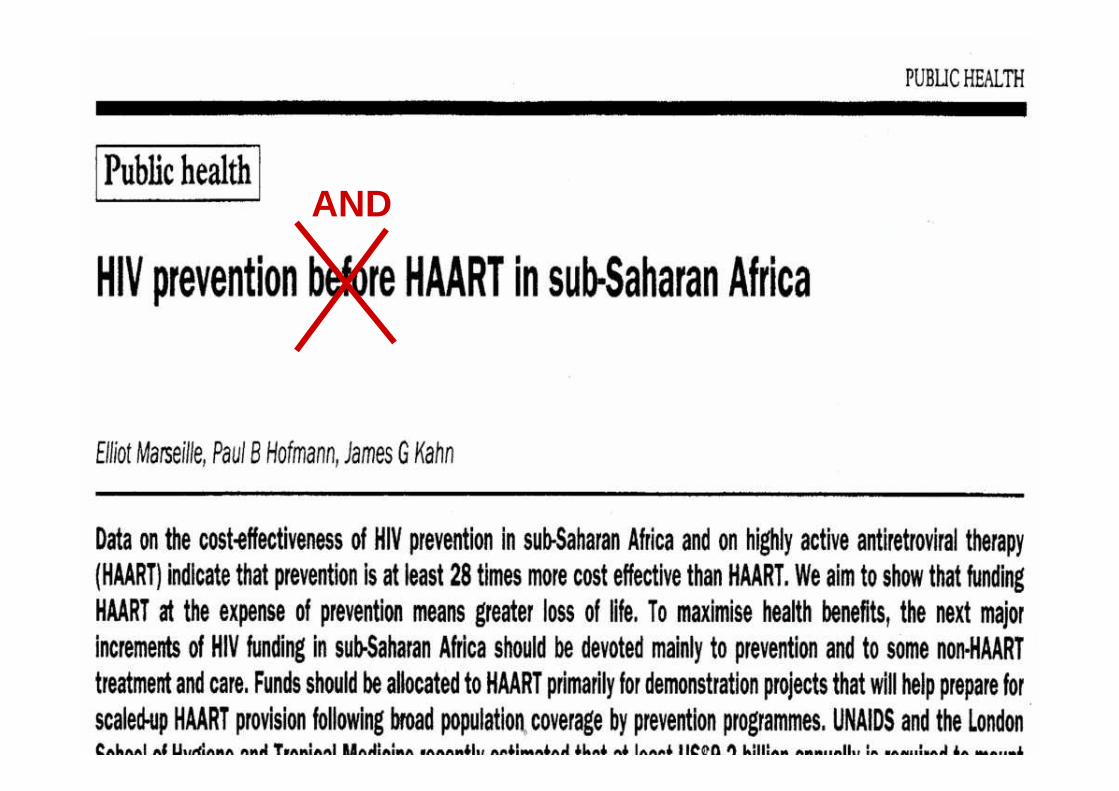
AND


The Lancet, Early Online Publication26 November 2008
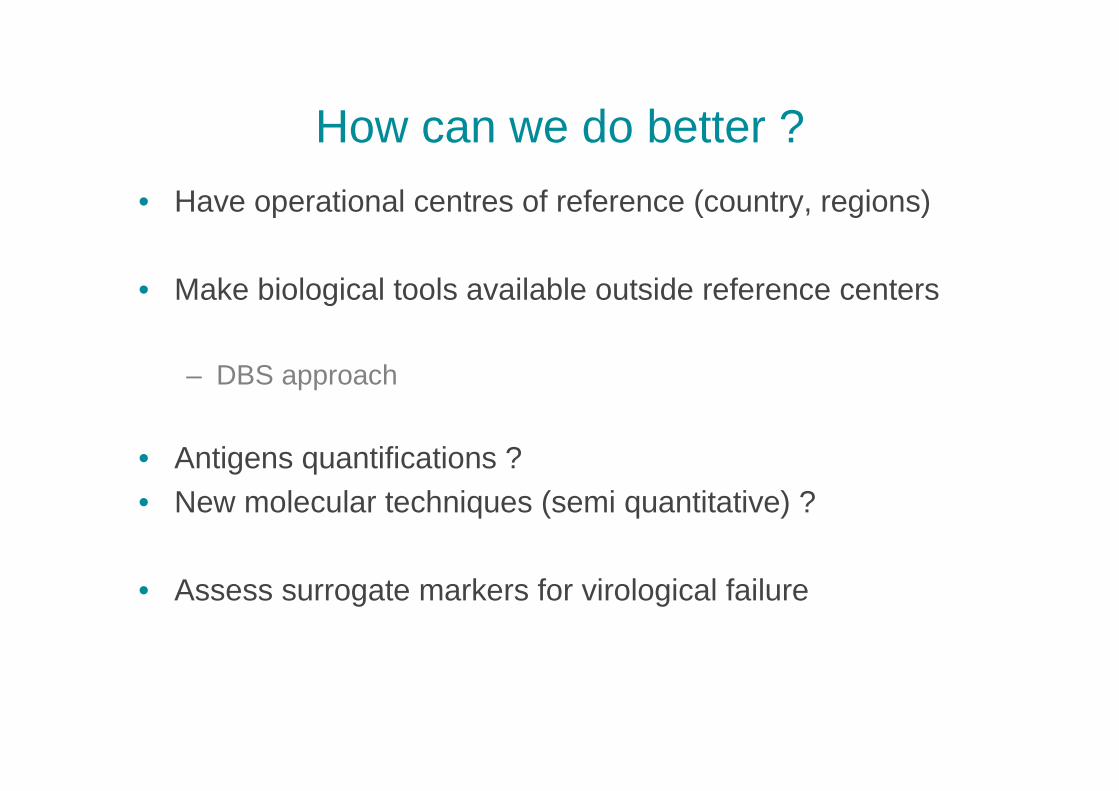
How can we do better ?
• Have operational centres of reference (country, regions)
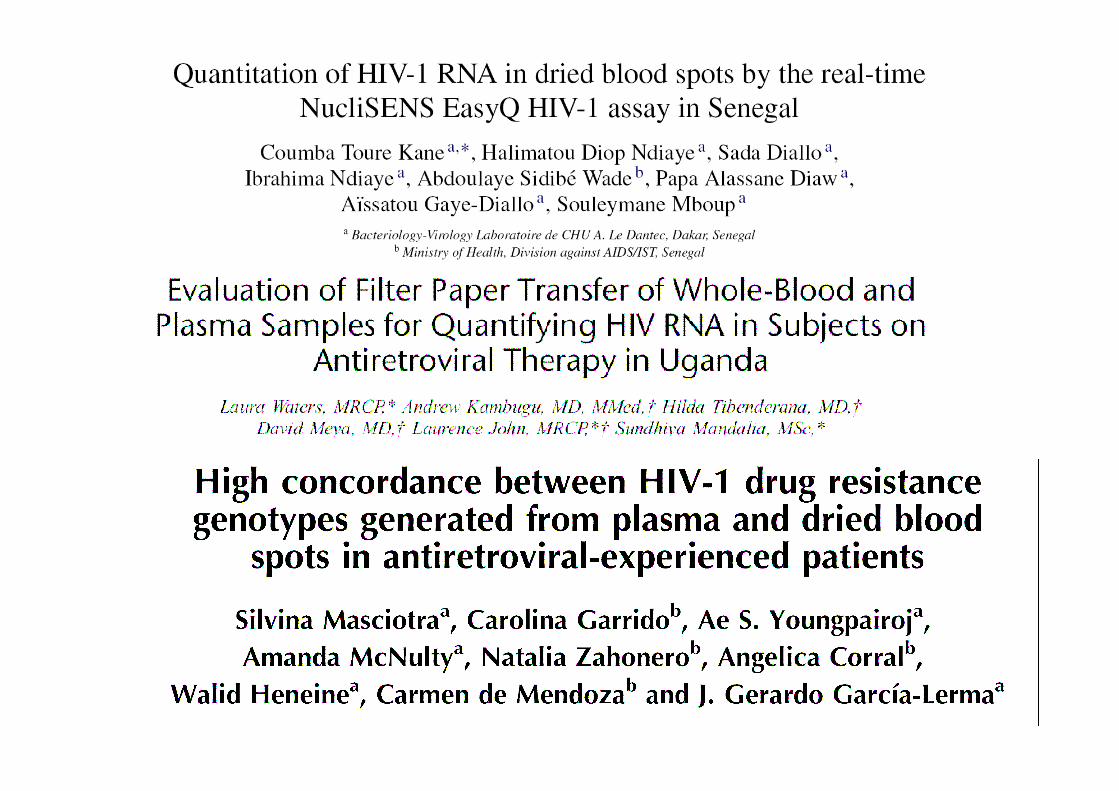
• Make biological tools available outside reference centers
– DBS approach
• Antigens quantifications ? • New molecular techniques (semi quantitative) ?
• Assess surrogate markers for virological failure
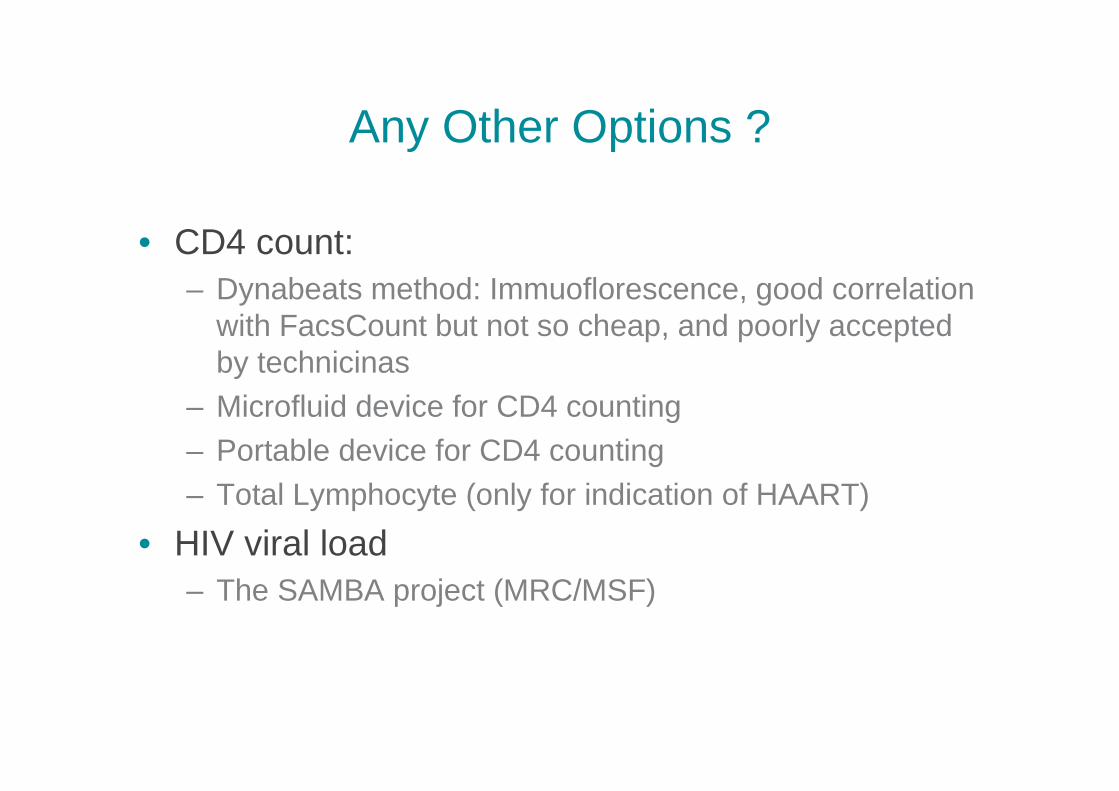
Any Other Options ?
• CD4 count:– Dynabeats method: Immuoflorescence, good correlation
with FacsCount but not so cheap, and poorly acceptedby technicinas
– Microfluid device for CD4 counting– Portable device for CD4 counting – Total Lymphocyte (only for indication of HAART)
• HIV viral load– The SAMBA project (MRC/MSF)
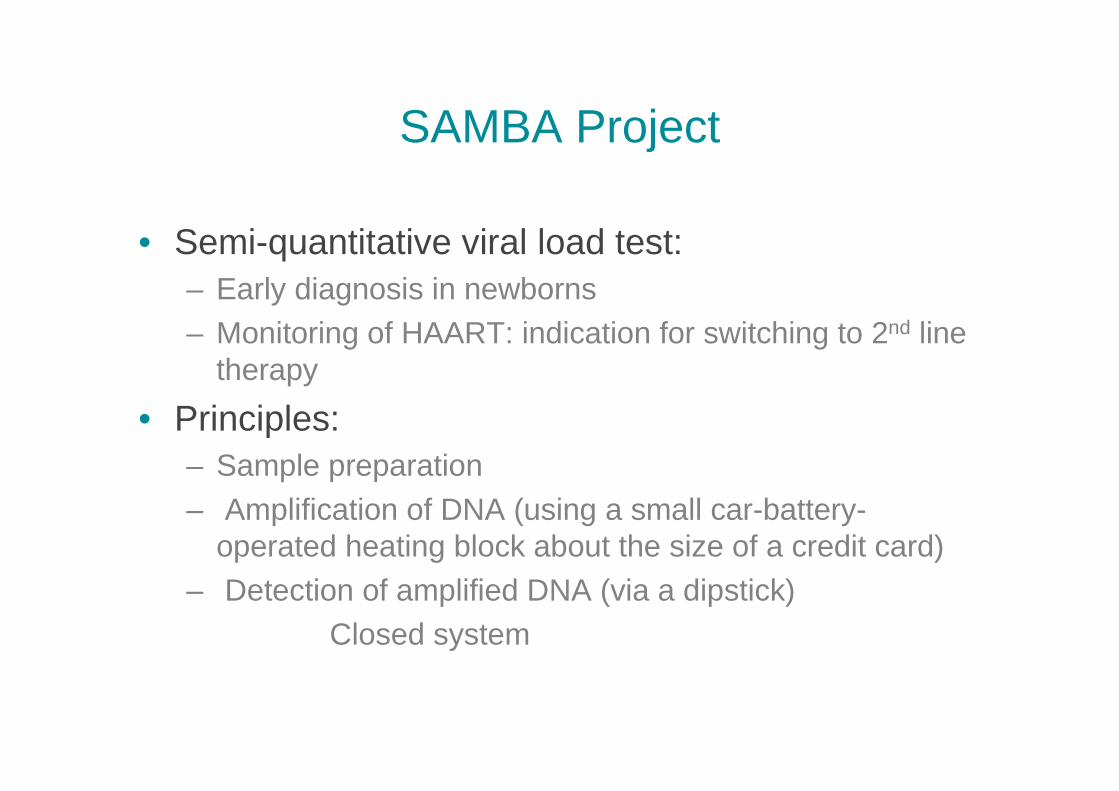
SAMBA Project
• Semi-quantitative viral load test:– Early diagnosis in newborns– Monitoring of HAART: indication for switching to 2nd line
therapy
• Principles:– Sample preparation– Amplification of DNA (using a small car-battery-
operated heating block about the size of a credit card)– Detection of amplified DNA (via a dipstick)
Closed system
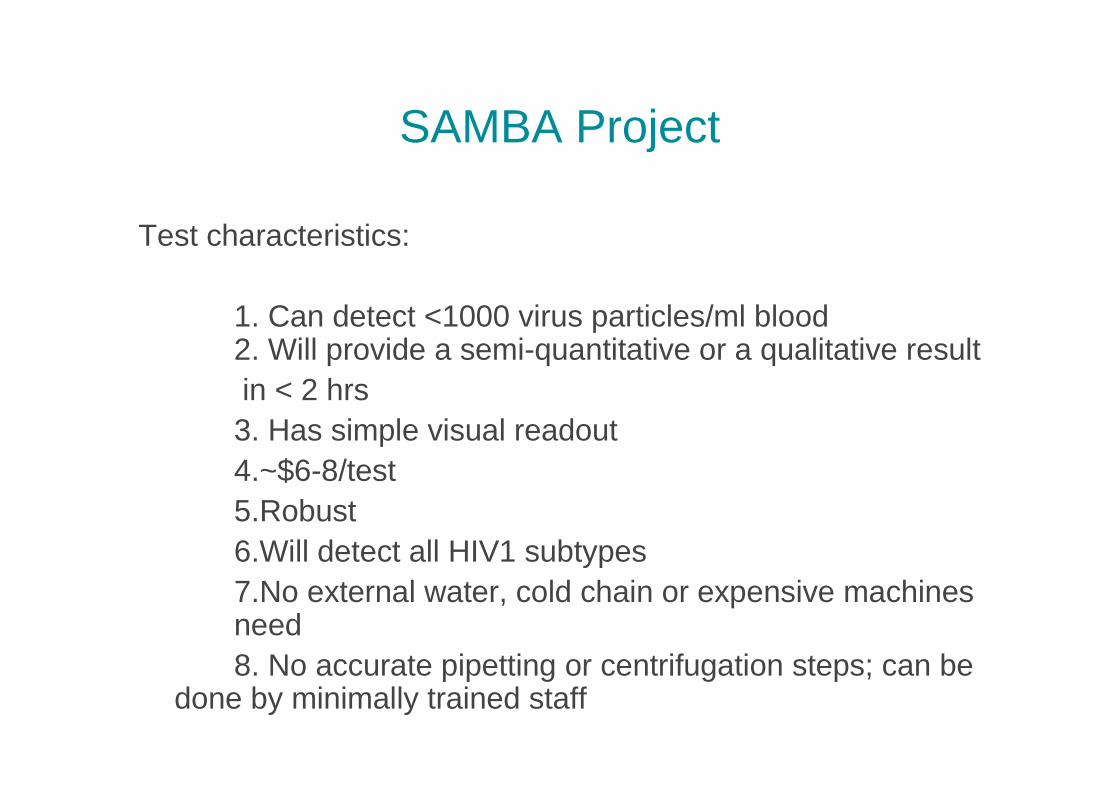
SAMBA Project
Test characteristics:
1. Can detect <1000 virus particles/ml blood 2. Will provide a semi-quantitative or a qualitative resultin < 2 hrs3. Has simple visual readout4.~$6-8/test5.Robust6.Will detect all HIV1 subtypes7.No external water, cold chain or expensive machines need8. No accurate pipetting or centrifugation steps; can be
done by minimally trained staff
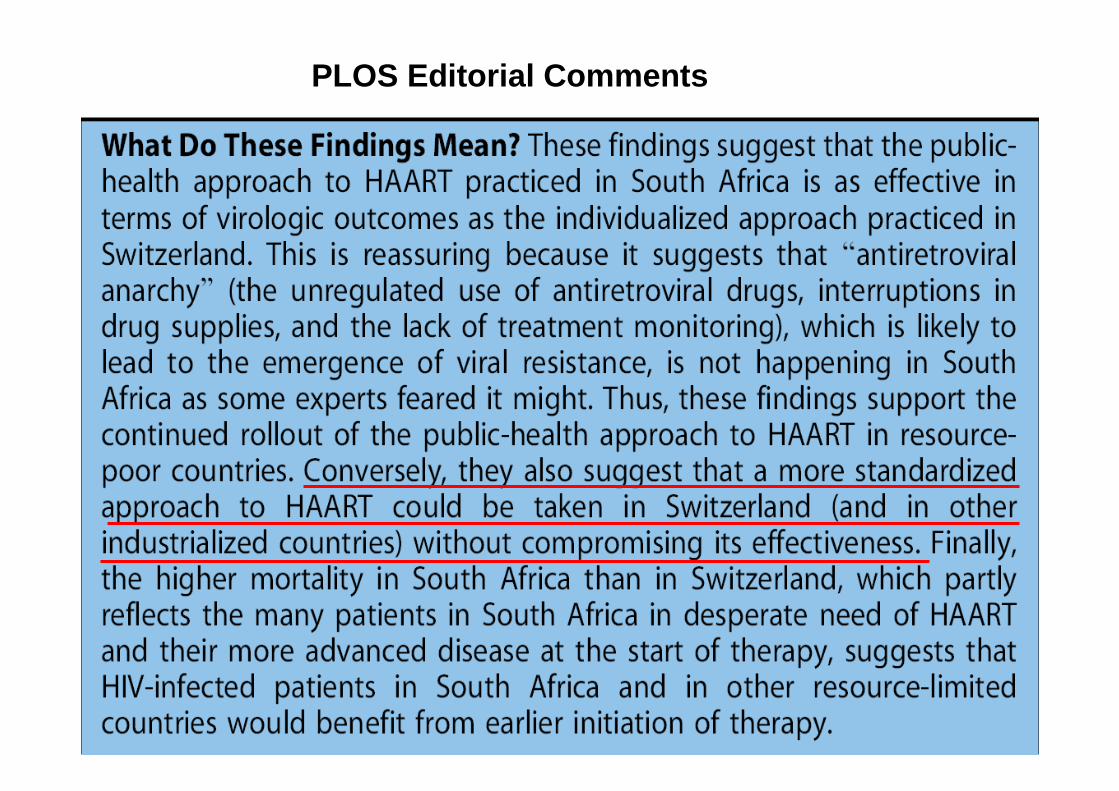
PLOS Editorial Comments
Systematic review of 13 publications
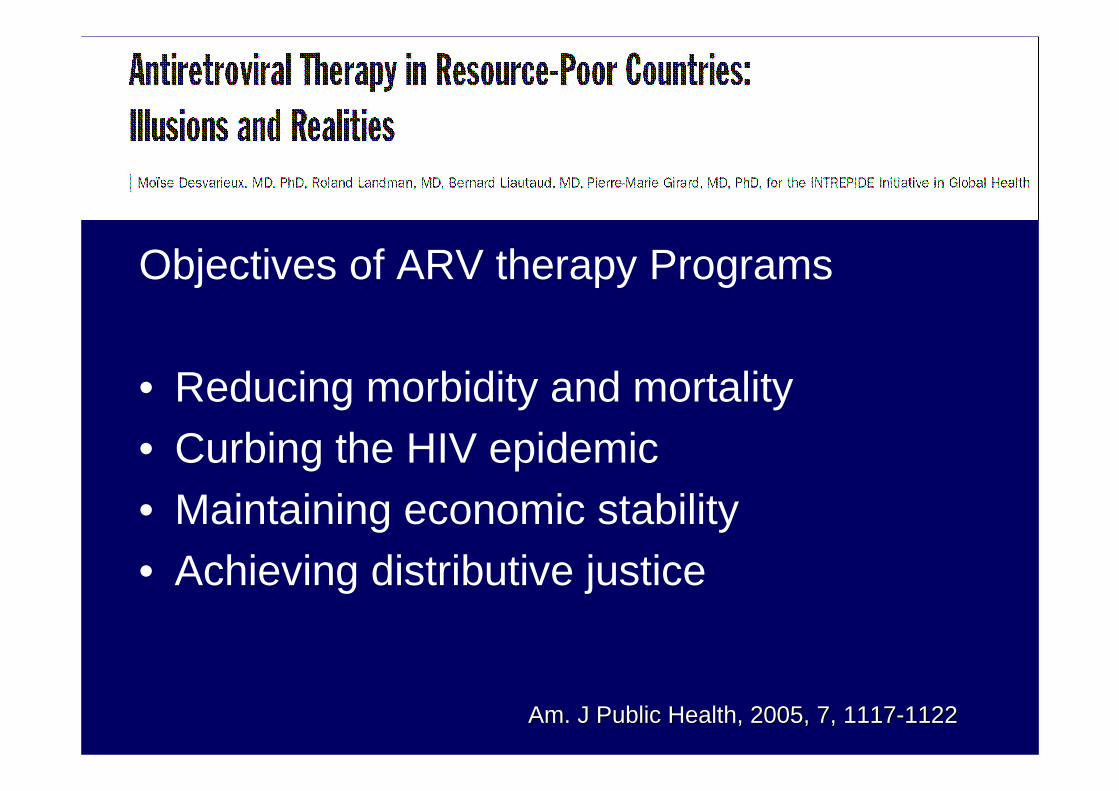
Objectives of ARV therapy Programs
• Reducing morbidity and mortality• Curbing the HIV epidemic• Maintaining economic stability• Achieving distributive justice
Am. J Public Am. J Public HealthHealth, 2005, 7, 1117, 2005, 7, 1117--11221122
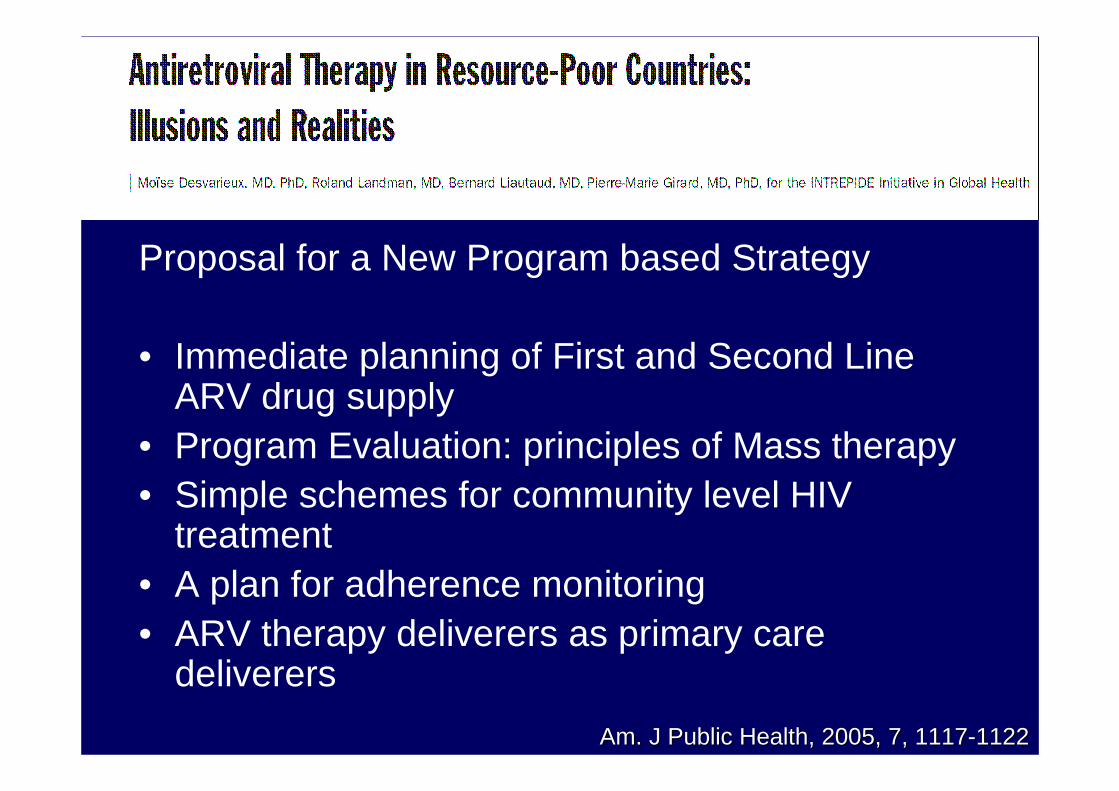
Proposal for a New Program based Strategy
• Immediate planning of First and Second Line ARV drug supply
• Program Evaluation: principles of Mass therapy• Simple schemes for community level HIV
treatment• A plan for adherence monitoring• ARV therapy deliverers as primary care
deliverers
Am. J Public Am. J Public HealthHealth, 2005, 7, 1117, 2005, 7, 1117--11221122
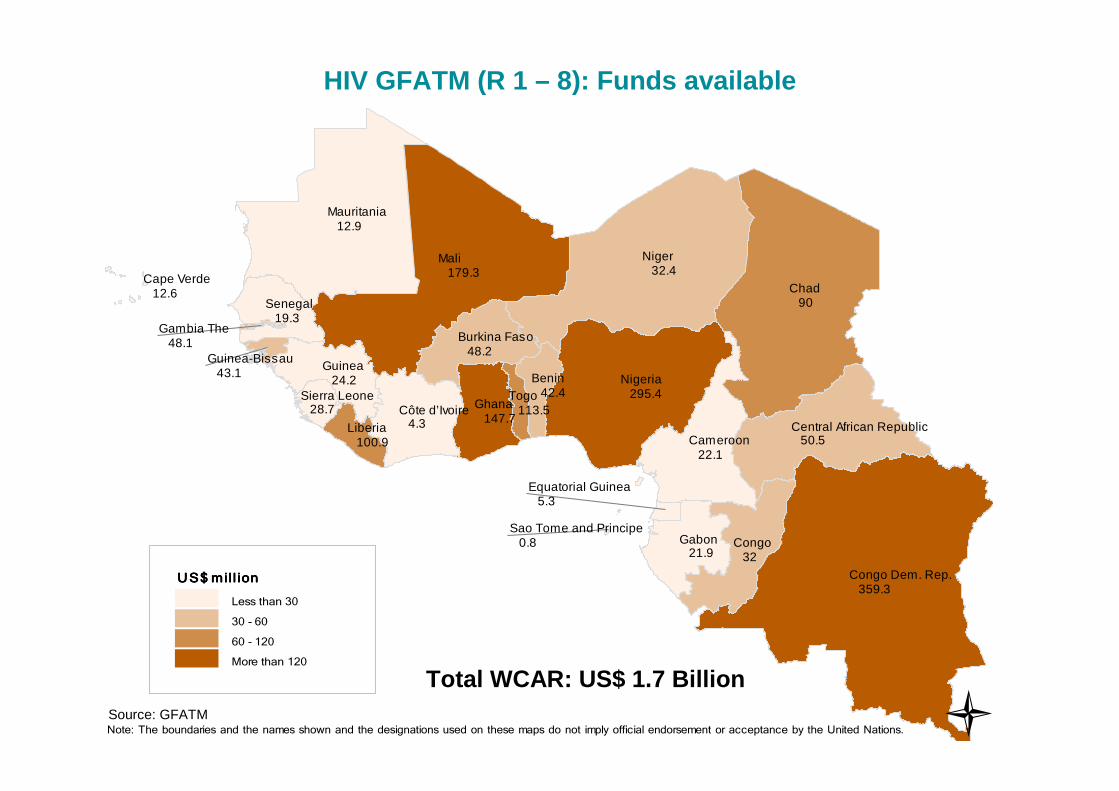
HIV GFATM (R 1 – 8): Funds available
Total WCAR: US$ 1.7 BillionSource: GFATM �
Benin 42.4
Burkina Faso 48.2
Central African Republic 50.5
Côte d’Ivoire 4.3
Cameroon 22.1
Congo Dem. Rep. 359.3
Congo 32
Cape Verde 12.6
Gabon 21.9
Ghana 147.7
Guinea 24.2
Gambia The 48.1
Guinea-Bissau 43.1
Equatorial Guinea 5.3
Liberia 100.9
Mali 179.3
Mauritania 12.9
Niger 32.4
Nigeria 295.4
Senegal 19.3
Sierra Leone 28.7
Sao Tome and Principe 0.8
Chad 90
Togo 113.5
US$ mill ion US$ mill ion US$ mill ion US$ mill ion
Less than 30
30 - 60
60 - 120
More than 120
Note: The boundaries and the names shown and the designations used on these maps do not imply official endorsement or acceptance by the United Nations.
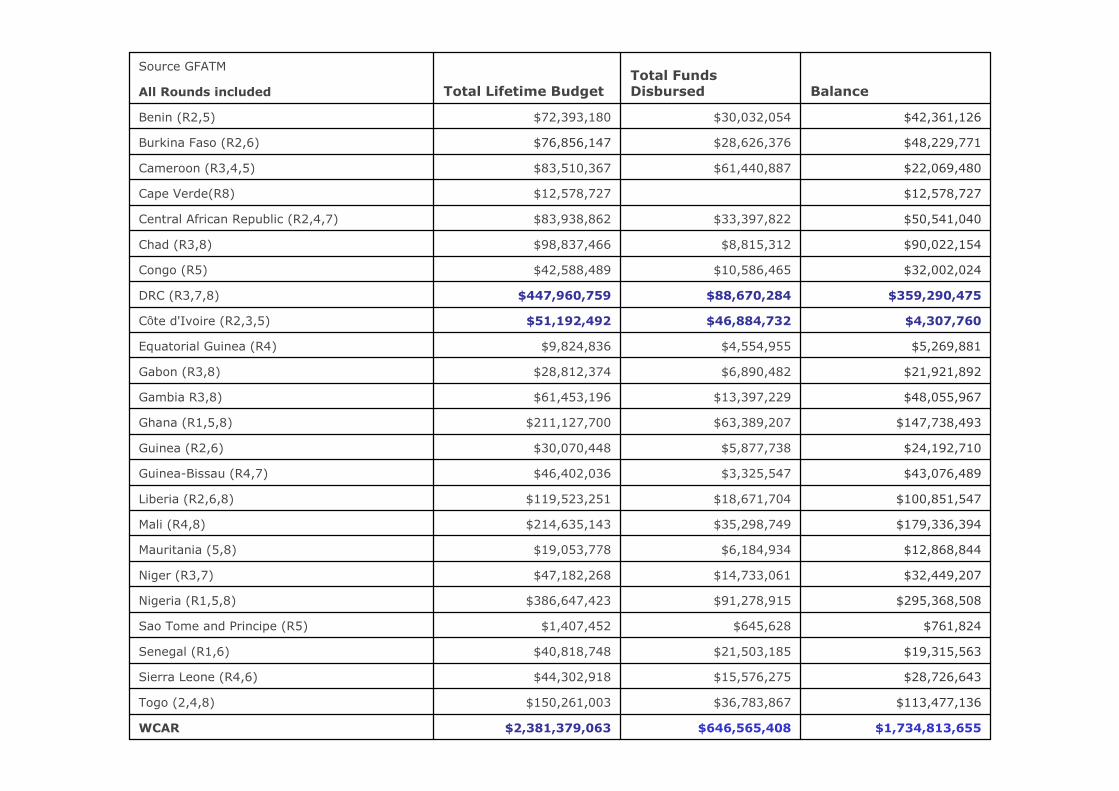
$1,734,813,655$646,565,408$2,381,379,063WCAR
$113,477,136 $36,783,867 $150,261,003 Togo (2,4,8)
$28,726,643 $15,576,275 $44,302,918 Sierra Leone (R4,6)
$19,315,563 $21,503,185 $40,818,748 Senegal (R1,6)
$761,824 $645,628 $1,407,452 Sao Tome and Principe (R5)
$295,368,508 $91,278,915 $386,647,423 Nigeria (R1,5,8)
$32,449,207 $14,733,061 $47,182,268 Niger (R3,7)
$12,868,844 $6,184,934 $19,053,778 Mauritania (5,8)
$179,336,394 $35,298,749 $214,635,143 Mali (R4,8)
$100,851,547 $18,671,704 $119,523,251 Liberia (R2,6,8)
$43,076,489 $3,325,547 $46,402,036 Guinea-Bissau (R4,7)
$24,192,710 $5,877,738 $30,070,448 Guinea (R2,6)
$147,738,493 $63,389,207 $211,127,700 Ghana (R1,5,8)
$48,055,967 $13,397,229 $61,453,196 Gambia R3,8)
$21,921,892 $6,890,482 $28,812,374 Gabon (R3,8)
$5,269,881 $4,554,955 $9,824,836 Equatorial Guinea (R4)
$4,307,760 $46,884,732 $51,192,492 Côte d'Ivoire (R2,3,5)
$359,290,475 $88,670,284 $447,960,759 DRC (R3,7,8)
$32,002,024 $10,586,465 $42,588,489 Congo (R5)
$90,022,154 $8,815,312 $98,837,466 Chad (R3,8)
$50,541,040 $33,397,822 $83,938,862 Central African Republic (R2,4,7)
$12,578,727 $12,578,727 Cape Verde(R8)
$22,069,480 $61,440,887 $83,510,367 Cameroon (R3,4,5)
$48,229,771 $28,626,376 $76,856,147 Burkina Faso (R2,6)
$42,361,126 $30,032,054 $72,393,180 Benin (R2,5)
All Rounds included BalanceTotal Funds DisbursedTotal Lifetime Budget
Source GFATM
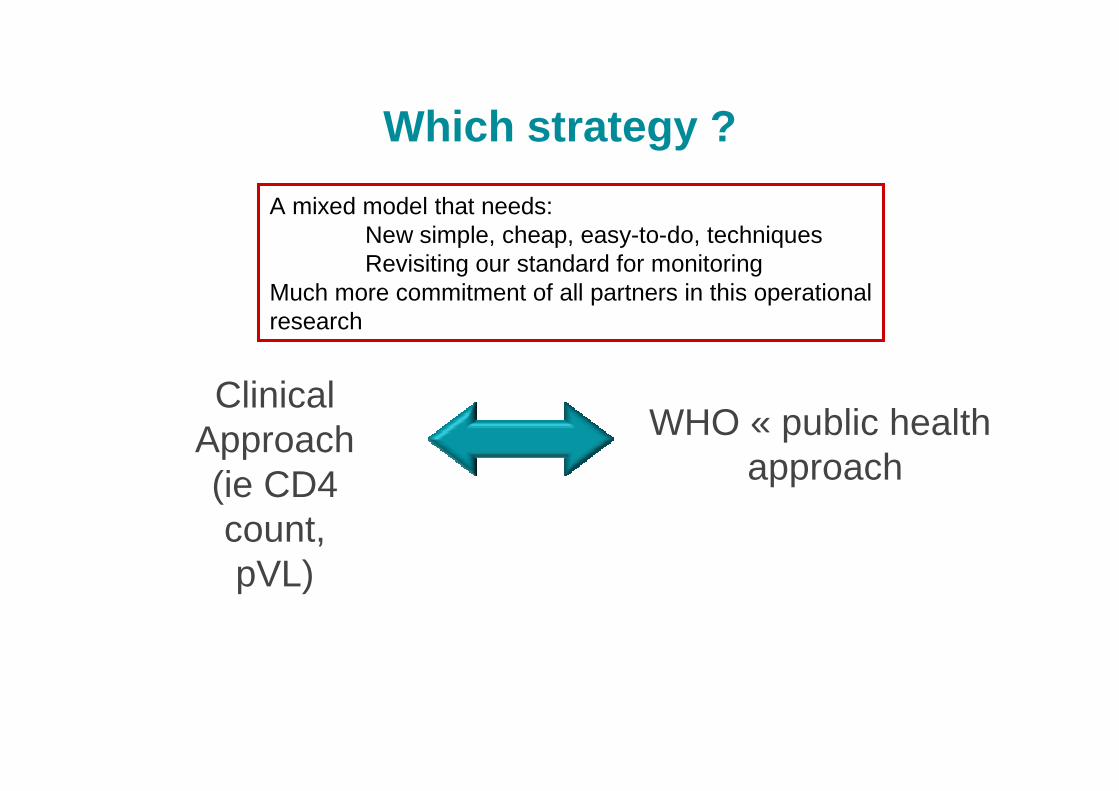
Which strategy ?
ClinicalApproach(ie CD4 count, pVL)
WHO « public healthapproach
A mixed model that needs:New simple, cheap, easy-to-do, techniquesRevisiting our standard for monitoring
Much more commitment of all partners in this operationalresearch
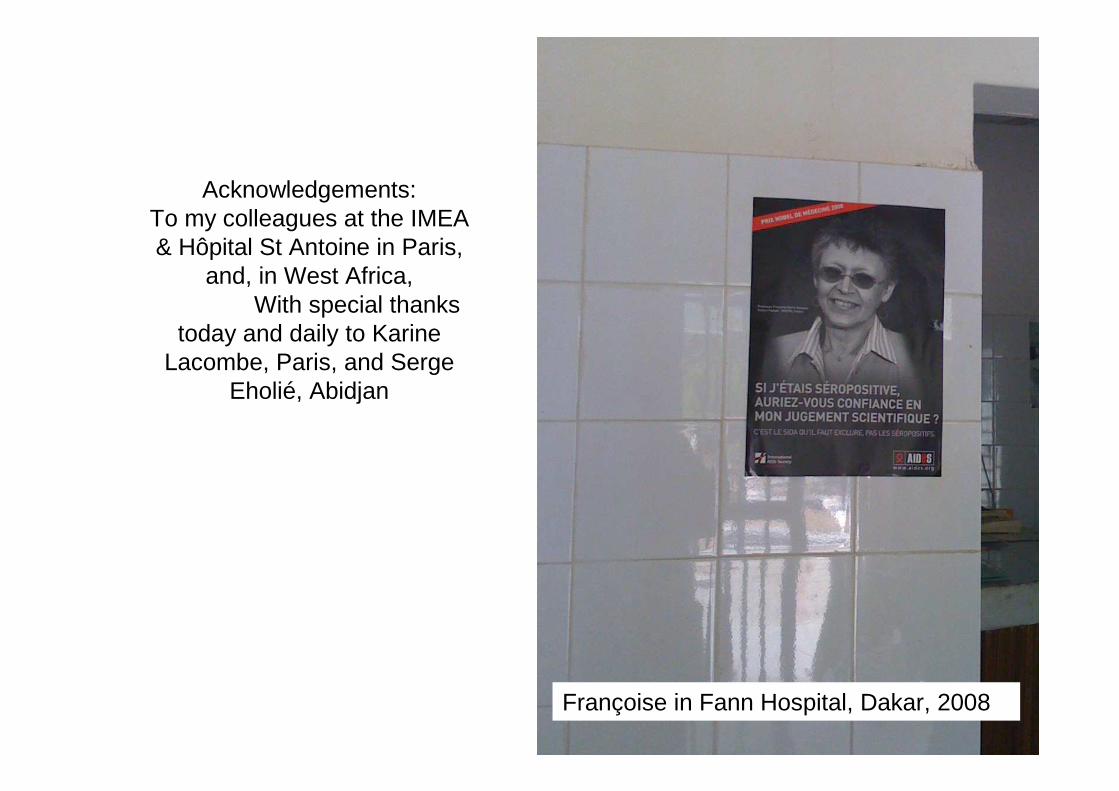
Acknowledgements:To my colleagues at the IMEA & Hôpital St Antoine in Paris,
and, in West Africa,With special thanks
today and daily to Karine Lacombe, Paris, and Serge
Eholié, Abidjan
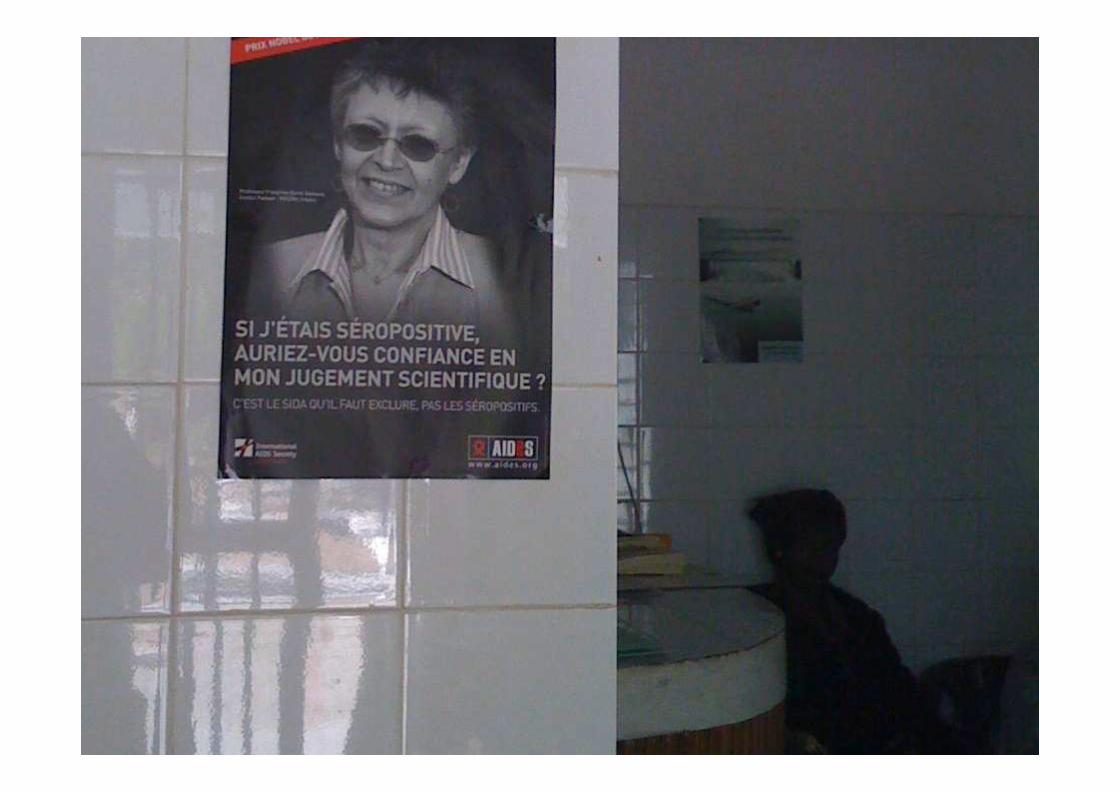
Françoise in Fann Hospital, Dakar, 2008

Thank you………………