Embed Size (px)
Citation preview

Which Test Do I Use?Statistics for Two Group ExperimentsThe Chi Square TestThe t TestAnalyzing Multiple Groups and Factorial ExperimentsAnalysis of VarianceSources of VariabilityA One-Way Between-Subjects Analysis of VarianceOne-Way Repeated Measures Analysis of VarianceAnalyzing Data from a Between-Subjects Factorial ExperimentTwo-Way Analysis of VarianceRepeated Measures and Mixed Factorial Designs
Summarize the properties of the four levels of measurement.
Which Test Do I Use?
A nominal scale assigns items to two or more distinct categories that can be named using a shared feature, but does not quantify the items.
Example: you can sort pictures into attractive and unattractive categories.

Summarize the properties of the four levels of measurement.
Which Test Do I Use?
An ordinal scale measures the magnitude of the DV using ranks.
This scale allows us to make statements about contestants’ relative speed.
Example: marathon contestants are assigned to places from first place to last place.

Summarize the properties of the four levels of measurement.
Which Test Do I Use?
An interval scale measures the magnitude of the DV using equal intervals between values with no absolute zero point.
Example: Fahrenheit or Centigrade temperatures, and Sarnoff and Zimbardo’s 0-100 scale.

Summarize the properties of the four levels of measurement.
Which Test Do I Use?
A ratio scale measures the magnitude of the DV using equal intervals between values and an absolute zero.
This scale allows us to state that 2 meters are twice as long as 1 meter.
Example: distance in meters or time in seconds.

How does the level of measurement affect the test we use?
Statistics for Two Group Experiments
Nonparametric tests use nominal or ordinal data.
Parametric tests require interval or ratio data.

When should we use the chi square test?
Statistics for Two Group Experiments
When the data are nominal and the groups are independent, which means the experimenter assigns different subjects to them.

What does it reveal?
Statistics for Two Group Experiments
The chi square test determines whether the frequency of sample responses represents the frequencies we would expect in the population.

Explain the meaning of the obtained (2 obt) and critical values, and Cramer’s coefficient Φ?
Statistics for Two Group Experiments
The 2 obt is the actual frequency of responses.
The critical value is the minimum value required
to reject the null hypothesis.
Cramer’s coefficient Φ is analogous to r 2 and indexes the degree of association between priming and the number of incorrect responses.

Explain the meaning of the obtained (2 obt) and critical values, and Cramer’s coefficient Φ?
Statistics for Two Group Experiments
If our sample included every member of the population, we would have the maximum possible degrees of freedom and would know the exact population values of the mean and variance.

How do we decide whether to accept or reject the null hypothesis?
Statistics for Two Group Experiments
If 2 obt > 2 critical, reject the null hypothesis.
How does sample size affect the t test?
The t Test
The sample size determines the degrees of freedom.
There is a different t distribution for each value of degrees of freedom.

How does the t distribution change as sample size increases?
The t Test
The t distribution approaches a normal curve as sample size increases.

What does robustness mean?
The t Test
The t test provides a valid test of the hypothesis when assumptions like normal distribution of population values are slightly to moderately violated.

When may we reject the null hypothesis?
The t Test
We reject the null hypothesis when tobt > tcrit.
For 9 df, if tobt > 2.262, we would reject the null hypothesis.

Calculate an effect size for a t test for independent groups.
The t Test
First, we calculate the t statistic (2.47) and then we enter it into the following formula:

Calculate an effect size for a t test for independent groups.
The t Test
An r value of .50 is a large effect.
If we square r , which is .66, this reveals that fun accounts for 44% of the variance in the subjects’ time estimates.

What is a t test for matched groups?
The t Test
A t test for matched groups either assigns the same subjects to both conditions or matches subjects and then randomly assigns them to either condition.

What is a t test for matched groups?
The t Test
A t test for matched groups may use fewer subjects and achieve greater control over individual differences than a t test for independent groups.
This makes a t test for matched groups potentially more powerful.

When do we use an analysis of variance?
Analysis of Variance
We use an analysis of variance when data are interval or ratio level and there is at least one independent variable with three or more levels.
What are within-groups variability and between-groups variability?
Sources of Variability
Within-groups variability is the degree to which the scores of subjects in the same treatment group differ from each other.
Between-groups variability is the degree to which the scores of different treatment groups differ from one another or the grand mean.

What are the sources of within-groups variability and between-groups variability?
Sources of Variability
Within-groups variability consists of error due to individual differences and extraneous variables.
Between-groups variability consists of error due to individual differences and extraneous variables and treatment effects.
What does it mean when an F ratio is statistically significant?
Sources of Variability
Across all group means, there is a significant difference due to the independent variable.
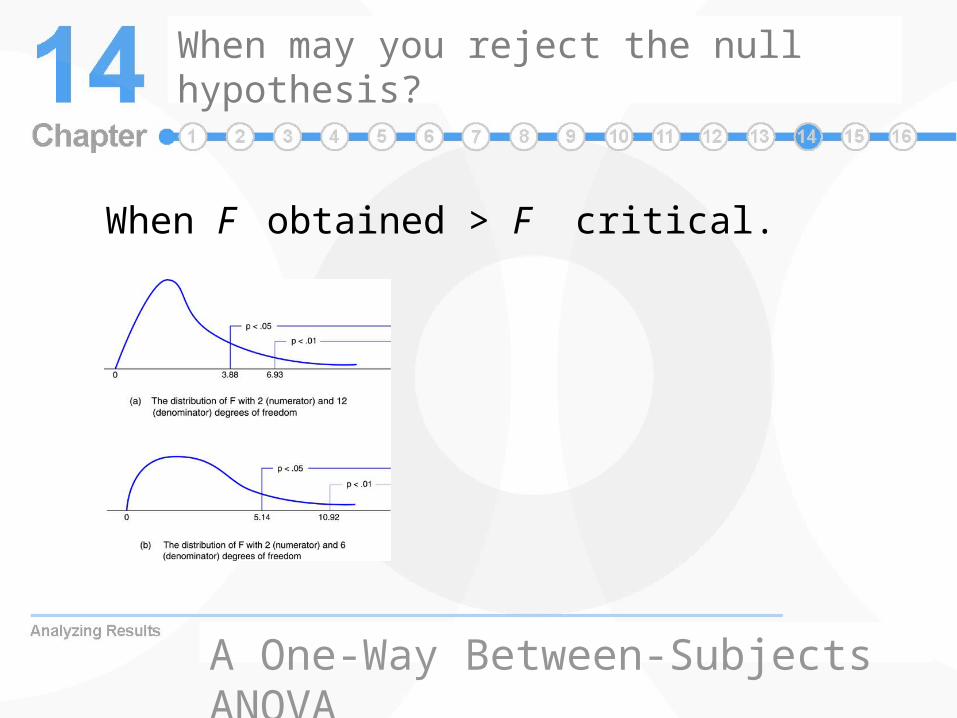
When may you reject the null hypothesis?
A One-Way Between-Subjects ANOVA
When F obtained > F critical.

When is a post hoc test appropriate?
Interpreting the Results
When an overall ANOVA is significant and you have made no specific predictions, you may perform post hoc tests on all pairs of treatment groups.

How many comparisons may we perform?
You may perform all possible pairwise comparisons without increasing the risk of Type 1 error.
Interpreting the Results

When may we use an a priori test?
We may use a priori tests to test predictions of differences between groups, such as between two groups or between one group and the others.
The maximum number of comparisons = p – 1, where p is the number of treatment groups.
Interpreting the Results

What is the advantage of an a priori test over a post hoc test?
A priori tests are more powerful than post hoc tests; but you may perform fewer a priori tests.
Interpreting the Results
Explain the concept of effect size.
Effect size measured by η2 is the proportion of the variability in the dependent variable that can be accounted for by the independent variable.
η2 indexes the strength of the relationship between the independent and dependent variables.
Interpreting the Results