Embed Size (px)
Citation preview
Which Countries in Europe Offer the Best Standard of Living?
Research Report | April 2016
2 Glassdoor | Llewellyn Consulting | Which Countries in Europe Offer the Best Standard of Living
Overview
When it comes to compensation, a larger pay packet isn’t always better. What matters is the ability to afford useful things that enrich our lives: a comfortable home, safe transportation, a quality education, a satisfying holiday and more.
Economists call this the “purchasing power” of salaries, or their “real value.” Throughout Europe, there are dramatic differences in cost of living among countries. That means the same pay packet can have a dramatically higher real value in some countries than others.
In this report from Glassdoor Economic Research, conducted by Llewellyn Consulting, we provide an eye-opening tour of which countries in Europe offer the best standard of living, once wages and costs of living are accounted for. While workers in Switzerland, Denmark and Germany enjoy the highest overall living standards in Europe, Estonia, Greece and Portugal—despite the affordable cost of living—rank among the least advantageous countries for workers.
Our mission at Glassdoor is to help people find a job and company that they love. By helping European job seekers better understand how earnings and cost of living affect their well being across countries, we hope this report contributes to that goal.
Dr. Andrew ChamberlainChief EconomistGlassdoor
Foreword
3 Key Findings
5 Average (Nominal) Wages
6 Average Wages on a “PPP” Basis
7 Cost of Living by City
8 “Standard of Living”
10 Conclusion
This study examines how wages differ across Europe — both in nominal terms and in terms of what they will buy — and identifies countries in which the cost of living is the most (and the least) favourable. It uses the United States as a benchmark.
The analysis covers 18 countries, and is based on four key indicators — average nominal wages; the Purchasing Power Parity (PPP)-adjusted average wage; the cost of living in main European cities; and the purchasing power of the average wage in main European cities (as a measure of standard of living).
1
2

3 Glassdoor | Llewellyn Consulting | Which Countries in Europe Offer the Best Standard of Living
Key Findings
• Average (Nominal) Wages Nominal wages1 are on average highest in Switzerland, at €72,000; Norway €61,000; and Denmark €56,000. They are lowest in Estonia at €13,000; Portugal €15,500; and Greece €18,500. Nominal average wages in the country with the highest wages (Switzerland) are thus over five times those with the lowest (Estonia). (Figure 2)
• Average Wages on a Purchasing Power Parity (PPP) Basis Comparisons of nominal wages do not, however, take into account what those incomes can buy. One way of addressing this is to adjust the income data by a so-called “Purchasing Power Parity” (PPP) factor, which takes into account differences in relative prices between countries to show how much money is needed to buy the same amount of goods and services in each country.2 Comparing wages on a PPP basis narrows the gap somewhat. Average wages on a PPP basis are highest in Switzerland, Ireland, and Norway at around €42,000. That’s roughly double the lowest PPP wages of €20,000 or less in Estonia, Portugal, and Greece. Workers in Switzerland earn about twice as much in real terms, on average, as those in Estonia. (Figure 3)
• Cost of Living A different way of comparing countries is to look at differences in price levels among their largest cities. This shows how much money is needed to buy a standard basket of goods and services — including rent — throughout Europe, with New York City used as a benchmark. On this basis, Geneva and Zurich are more expensive than New York City. These two cities, along with London, are the three most expensive cities in Europe. All of Europe’s other cities are cheaper than New York City, with some cities (notably Tartu, Porto, Thessaloniki, Tallinn, Athens, and Lisbon) markedly so. (Figure 4)
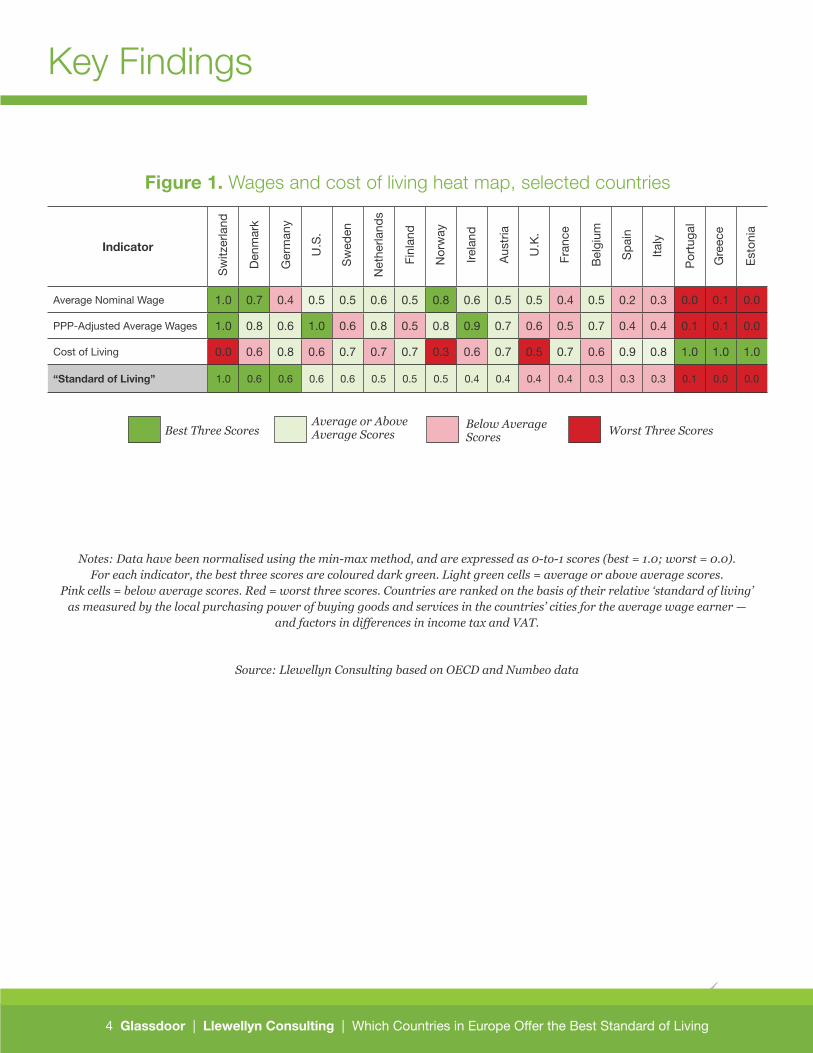
• Standard of Living Taking not only income and cost of living into account, but also the effects of differences in taxation (income tax and VAT), it is possible to derive an indication of after-tax, local purchasing-power-based, “standard of living.” On this basis, the highest overall standard of living is found in the cities of Switzerland, Denmark, and Germany. Although the cost of living can be relatively high in these countries, so are average wages and purchasing power. Estonia, Greece, and Portugal, by contrast, offer the lowest overall standard of living: although the cost of living is relatively low in these countries, average wages and purchasing power are amongst the lowest in the region. The UK, where the cost of living is relatively high, has an overall standard of living that is similar to that in Austria and France. (Figure 1)
Differences in wages across countries are narrowed somewhat when they are adjusted by price differences across countries.
In most of Europe’s cities, the cost of local goods and services (including food, transportation, and rent) is lower than in New York City.
The average city-based worker in most of Europe has a higher standard of living than his or her equivalent in New York City.
In most of Europe, local incomes enable average city-based workers to buy more with their earnings than New Yorkers can.
In Switzerland, Denmark, and Germany the average city-based worker can afford to buy 60 percent or more goods and services with his or her salary than residents of New York.
4 Glassdoor | Llewellyn Consulting | Which Countries in Europe Offer the Best Standard of Living
Figure 1. Wages and cost of living heat map, selected countries
Indicator
Average Nominal Wage 1.0 0.7 0.4 0.5 0.5 0.6 0.5 0.8 0.6 0.5 0.5 0.4 0.5 0.2 0.3 0.0 0.1 0.0
PPP-Adjusted Average Wages 1.0 0.8 0.6 1.0 0.6 0.8 0.5 0.8 0.9 0.7 0.6 0.5 0.7 0.4 0.4 0.1 0.1 0.0
Cost of Living 0.0 0.6 0.8 0.6 0.7 0.7 0.7 0.3 0.6 0.7 0.5 0.7 0.6 0.9 0.8 1.0 1.0 1.0
“Standard of Living” 1.0 0.6 0.6 0.6 0.6 0.5 0.5 0.5 0.4 0.4 0.4 0.4 0.3 0.3 0.3 0.1 0.0 0.0
Key Findings
Notes: Data have been normalised using the min-max method, and are expressed as 0-to-1 scores (best = 1.0; worst = 0.0). For each indicator, the best three scores are coloured dark green. Light green cells = average or above average scores.
Pink cells = below average scores. Red = worst three scores. Countries are ranked on the basis of their relative ‘standard of living’ as measured by the local purchasing power of buying goods and services in the countries’ cities for the average wage earner —
and factors in differences in income tax and VAT.
Source: Llewellyn Consulting based on OECD and Numbeo data
U.K
.
Sw
itzer
land
Den
mar
k
Ger
man
y
U.S
.
Sw
eden
Net
herla
nds
Finl
and
Nor
way
Irela
nd
Aus
tria
Fran
ce
Bel
gium
Sp
ain
Italy
Por
tuga
l
Gre
ece
Est
onia
Best Three ScoresAverage or Above Average Scores Worst Three ScoresBelow Average
Scores
4 Glassdoor | Llewellyn Consulting | Which Countries in Europe Offer the Best Standard of Living

5 Glassdoor | Llewellyn Consulting | Which Countries in Europe Offer the Best Standard of Living
There is considerable disparity within Europe in terms of what people are paid for a given job: nominal wages in the highest paying country are on average over five times those of the lowest. Nominal wages are:
• Highest in: Switzerland at €72,000 followed by Norway, at €61,000; and by Denmark, at €56,000.
• Lowest in: Estonia at €13,000; followed by Portugal, at €15,500; and Greece, at €18,500.
Average wages in the UK, along with Belgium, Sweden, Finland, Austria, at around €41,000, are similar to those in the U.S. (Figure 2).
Average (Nominal) Wages
Notes: Average wages are calculated by dividing the national-accounts-based total wage bill by the average number of employees in the total economy; and then multiplying it by the ratio of the average usual weekly hours per full-time employee to the average usually weekly hours for all employees.
This indicator is measured in USD constant prices using 2014 as the base year, and then converted into Euros at the 2014 average exchange rate.
Source: Glassdoor Economic Research (www.glassdoor.com/Research) and OECD
Figure 2. Average nominal annual wages, selected countries
Switzerland has the highest (nominal) average wages in Europe, Estonia the lowest.
10,000
20,000
30,000
40,000
50,000
60,000
70,000
80,000
Switzer
land
Norway
Denm
ark
Irelan
d
Nethe
rland
s U.S
.
Belgium
Sweden
U.K
.
Finlan
d
Austri
a
Germ
any
Fran
ce
Italy
Spain
Greec
e
Portu
gal
Estonia
2014 2007

6 Glassdoor | Llewellyn Consulting | Which Countries in Europe Offer the Best Standard of Living
Average Wages on a “PPP” Basis
Comparing nominal wages across countries only tells part of the story. It does not take into account what those incomes can actually buy. One way economists address this issue is to adjust income data from different countries to produce Purchasing Power Parity (PPP) figures.3 These adjustments take into account differences in relative prices within countries, so as to estimate how much money would be needed to buy the equivalent goods and services in each. The adjusted figures are typically expressed relative to the United States,4 which is taken as the benchmark.
Because the cost of locally-sold goods and services tend to be lower in lower-income countries, PPP-adjusted figures tend to narrow somewhat the differences in wages across countries on a PPP basis: wages on a PPP basis in the highest paying country are on average around double those in the lowest. (Figure 3). They are:
• Highest in: Switzerland, Ireland, and Norway, at around €40,500.
• Lowest in: Estonia, Portugal, and Greece, at €20,000 or less.
Notes: Average wages are calculated by dividing the national-accounts-based total wage bill by the average number of employees in the whole economy; and then multiplying it by the ratio of the average usual weekly hours per full-time employee to the average usually weekly hours for all
employees. This indicator is measured in USD constant prices using 2014 as the base year and Purchasing Power Parities (PPPs) for private consumption of the same year.
Source: OECD
Figure 3. Average annual wages, PPP adjusted, selected countries
PPP adjusted, average wages in the U.S. are as high as in Switzerland.
PPP adjusted, average wages are almost as high in Ireland as in Switzerland.
2014 2007
10,000
20,000
30,000
40,000
50,000
60,000
70,000
80,000
90,000
100,000
U.S.
Switzer
land
Irelan
d
Norway
Nethe
rland
s
Denm
ark
Belgium
Austri
a
Germ
any
U.K.
Sweden
Fran
ce
Finlan
d
Spain
Italy
Greec
e
Portu
gal
Estonia
USD, PPP

7 Glassdoor | Llewellyn Consulting | Which Countries in Europe Offer the Best Standard of Living
Cost of Living by City
An alternative way of accounting for cross-country differences in prices is to consider differences in price levels in major cities. How much money is needed to buy a standard basket of goods and services in different countries, including groceries, restaurants, transportation, utilities, and rent. By convention, New York City (NYC) is taken as the benchmark. (Figure 4).
On this basis, the cost of living is:
• Highest in: Geneva and Zurich — which are the only two main European cities that are more expensive than New York City (by 3 percent and 1 percent, respectively); and London, which has the highest rents in Europe, but nevertheless is around 7 percent cheaper than NYC.
• Lowest in: Tartu, Porto, Thessaloniki, Tallinn, Athens, and Lisbon, which are some 60 percent - 70 percent cheaper than NYC.
Geneva and Zurich are the only two main European cities more expensive than New York City.
London has the highest rents in Europe.
Notes: The cost of living index for a city includes an estimation of consumer prices (food, restaurant, transportation, and utilities, including VAT) and rent prices, compared to New York City prices (=100). Data are for 2015.
Source: Glassdoor Economic Research (www.glassdoor.com/Research) and Numbeo
Figure 4. Cost of living by city (consumer price index plus rent)
Index, NYC=100 Cost of living (consumer prices plus rent) index NYC = 100 Rent Index
0
20
40
60
80
100
120
Genev
a
Zurich
Lond
on Oslo
Bergen
Chicag
o LA
Copen
hage
n Pari
s
Dublin
Stockh
olm
Helsink
i
Amsterda
m
Arhus
Brusse
ls
Rome
Milan
Birming
ham
Munich
Espoo
Cork
Antwerp
Hambu
rg
Gothen
burg
Vienna
Rotterd
am
Berlin
Madrid
Marseil
le Graz
Barcelo
na
Lisbo
n
Athens
Tallin
n
Thess
alonik
i Port
o
Tartu

8 Glassdoor | Llewellyn Consulting | Which Countries in Europe Offer the Best Standard of Living
Standard of Living
What matters ultimately for standard of living is the gap between the take-home pay and price levels. Taking together both the income (after income tax) and the price-level (including value-added taxes or VAT) information it is possible to derive an indication of after-tax, local purchasing-power-based, “standard of living”. (Figure 5)
The ranking of countries on the basis of their relative standard of living, as measured by after-tax 5 local purchasing power of the average wage earner in countries’ cities is:
• Highest in: Switzerland, Denmark, and Germany; all of which compare closely with the United States. Although the cost of living can be relatively high in these countries, average wages and purchasing power are also relatively high.
• Lowest in: Estonia, Greece, and Portugal. Although the cost of living is relatively low in these countries, average wages and purchasing power are amongst the lowest in the region. The UK, where the cost of living is relatively high, has an overall standard of living that is similar to that in Austria and France.
In the UK, the average city-based worker can afford to buy over 30 percent more than his or her equivalent in New York City.
In other words, if the average city-based worker in the UK were to move to New York City, he or she would have to earn 30 percent more than the average New Yorker in order to have a similar standard of living as he or she previously had in the UK.
Notes: Data is Numbeo’s ‘Local purchasing power index’, which measures the relative purchasing power in buying goods and services for the average wage (after tax) in countries’ cities, compared to New York City (=100). For example, if the purchasing power index of a city is 150, a resident in that given city
earning the average wage can afford to buy 50 percent more typical goods and services than someone in NYC earning the average wage. Data are for 2015.
Source: Glassdoor Economic Research (www.glassdoor.com/Research) and Numbeo
Figure 5. “Standard of living index”, selected countries
0
50
100
150
200
250
Switzer
land
Denm
ark
Germ
any
U.S.
Sweden
Nethe
rland
s
Finlan
d
Norway
Irelan
d
Austri
a U.K
.
Fran
ce
Belgium
Spain
Italy
Portu
gal
Greec
e
Estonia
Index, NYC=100
Local incomes in most of Europe are, on average, higher than in New York City, and hence go further when paying for goods and services.
In Switzerland, the average city-based worker can afford to buy around twice as much as his or her equivalent in New York City.

9 Glassdoor | Llewellyn Consulting | Which Countries in Europe Offer the Best Standard of Living
Standard of Living
“Standard of living index”, selected countries
Finland
Sweden
Norway
Estonia
Greece
Portugal
Spain
Italy
Switzerland
Belgium
Netherlands
Germany
France
Ireland
Austria
UK
Denmark
80 - 100
101 - 120
121 - 140
141 - 160
161+
Notes: Data is Numbeo’s ‘Local purchasing power index’, which measures the relative purchasing power in buying goods and services for the average wage (after tax) in countries’ cities, compared to New York City (=100). For example, if the purchasing power index of a city is 150, a resident in that given city
earning the average wage can afford to buy 50 percent more typical goods and services than someone in NYC earning the average wage. Data are for 2015.
Source: Glassdoor Economic Research (www.glassdoor.com/Research) and Numbeo

10 Glassdoor | Llewellyn Consulting | Which Countries in Europe Offer the Best Standard of Living
Conclusion
Average wages vary considerably from one country to another, with Switzerland at one end of the scale and Estonia at the other. Adjusting salary data to take into account differences in relative prices within countries tends to narrow the differences in wages across countries, but Switzerland and Estonia remain at opposite ends of the spectrum.
What matters ultimately for standard of living is the gap between take-home pay and price levels. Switzerland and Denmark take the top two spots, despite average wages on a PPP basis in Denmark only coming in 6th highest overall. Interestingly, Germany comes in third, despite average nominal wages in the country being relatively low compared to the other countries in the study. This suggests that purchasing power for average earners is high in Germany, as is also the case in Sweden. Countries with a high cost of living in their major cities do not necessarily offer the highest standard of living, as can be seen in the case of Norway and the UK.
There is a significant appetite for more transparency around wages and salaries on behalf of employees and there are legislative moves to increase pay transparency, particularly between genders. This report adds to those debates and puts company-level pay in the context of wider economic conditions at the country level. A job seeker must bear in mind local context when comparing what people with a certain job title make across different national borders.
A combination of factors such as earnings, taxes, costs and purchasing power are therefore all in play when it comes to standard of living. By encouraging transparency, Glassdoor is helping people understand what is fair pay and in what countries their take-home pay would go furthest. When it comes to living standards, though, wages and salaries are just one side of the story.
DisclaimerThe information, tools and material presented herein are provided for informational purposes only and are not to be used or considered as an offer or a solicitation to sell or an offer or solicitation to buy or subscribe for securities, investment products or other financial instruments. All express or implied warranties or representations are excluded to the fullest extent permissible by law. Nothing in this report shall be deemed to constitute financial or other professional advice in any way, and under no circum-stances shall we be liable for any direct or indirect losses, costs or expenses nor for any loss of profit that results from the content of this report or any material in it or website links or references embedded within it. While attempt has been made to ensure accuracy, no warrant or representation is made that the material in this publication is accurate, complete, reliable, fit for any par-ticular purpose or merchantable and we accept no liability for any act (or decision not to act) resulting from use of this publication and related data. To the maximum extent permissible all warranties and other assurances are hereby excluded: we shall have no liability for the use, misuse, or distribution of this information. This report is produced by us in the United Kingdom and we make no representation that any material contained in this report is appropriate for any other jurisdiction. These terms are governed by the laws of England and Wales and you agree that the English courts shall have exclusive jurisdiction in any dispute.
Footnotes1 Data are from the OECD, and for 2014.2 However, making such comparisons is not straightforward because people consume different things. Think of the differences in what men and women buy and the different purchasing habits of the young and the old, of the wealthy and non-wealthy. So many factors are at play, including cultural preferences. Accordingly, the data, which use averages (including for the typical basket of goods and services) have to be interpreted with caution.3 In their simplest form, PPPs are simply price relatives that show the ratio of the prices in national currencies of the same good or service in different countries (OECD, 2016). When comparing the purchasing power of consumers in different countries, it is useful to use PPPs to adjust wages or income up or down depending on the relative prices of non-internationally traded (not traded in the world market, but locally) labour intensive goods and services. While the cost of internationally-traded goods (e.g. machinery) tends to be the same in different countries (international competition tends to reduce the differentials in prices for similar products), non-internationally traded goods and services tend to be cheaper in low-income than in high-income countries (services tend to be relatively labour-intensive and wages tend to be lower in poorer countries). Hence, for example, the price of a haircut in Lisbon is likely to be cheaper that in London; or a taxi ride (of the same distance) will cost more in Paris than in Athens. 4 U.S. nominal average wage = U.S. PPP-adjusted average wage.5 Income tax and VAT
© Glassdoor 2016
100 Shoreline Hwy, Mill Valley, CA 94941
Web: glassdoor.com/research
Email: [email protected]