Embed Size (px)
Citation preview
Which Civil Society Organizations Which Civil Society Organizations in Which Countries are Enjoying in Which Countries are Enjoying
Policy-Making Processes and Why:Policy-Making Processes and Why:Comparing 7 Countries (Japan, Korea, Comparing 7 Countries (Japan, Korea,
Germany, China, Turkey, Russia, Germany, China, Turkey, Russia, and the Philippines) in JIGS Surveysand the Philippines) in JIGS Surveys
Yutaka Tsujinaka, J.Y. Choe, T. Ohtomo, and H. Miwa
University of Tsukuba
2006
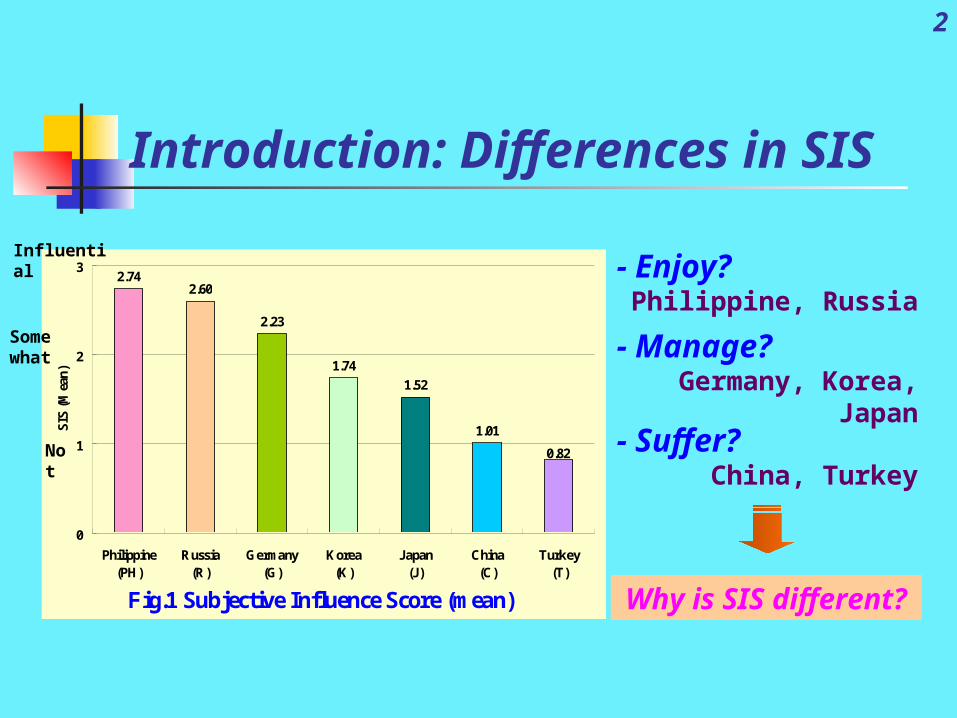
Introduction: Differences in SIS
2
- Enjoy?Philippine, Russia
- Manage?Germany, Korea, Japan
- Suffer?China, Turkey
Why is SIS different?Fig.1 Subjective Influence Score (mean)
2.742.60
2.23
1.74
1.52
1.01
0.82
0
1
2
3
Philippine(PH)
Russia(R)
Germany(G)
Korea(K)
Japan(J)
China(C)
Turkey(T)
SIS
(M
ean
)
Influential
Some what
Not
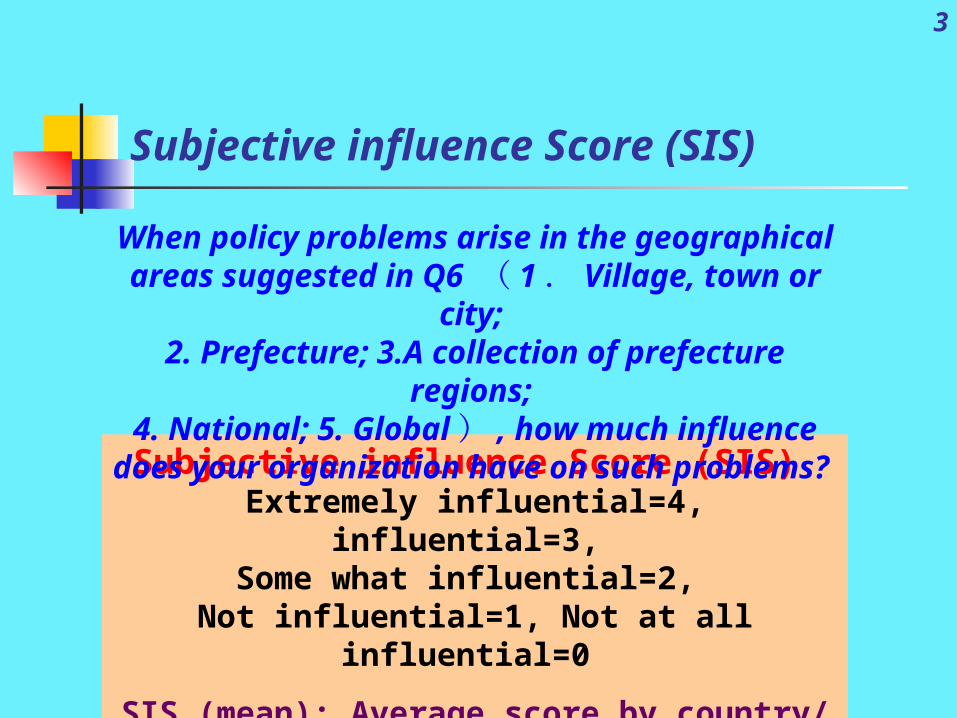
Subjective influence Score (SIS)
3
Subjective influence Score (SIS) Extremely influential=4, influential=3,
Some what influential=2, Not influential=1, Not at all influential=0
SIS (mean): Average score by country/ by sectors
When policy problems arise in the geographical areas suggested in Q6 ( 1 . Village, town or city;
2. Prefecture; 3.A collection of prefecture regions; 4. National; 5. Global ) , how much influence does
your organization have on such problems?
4
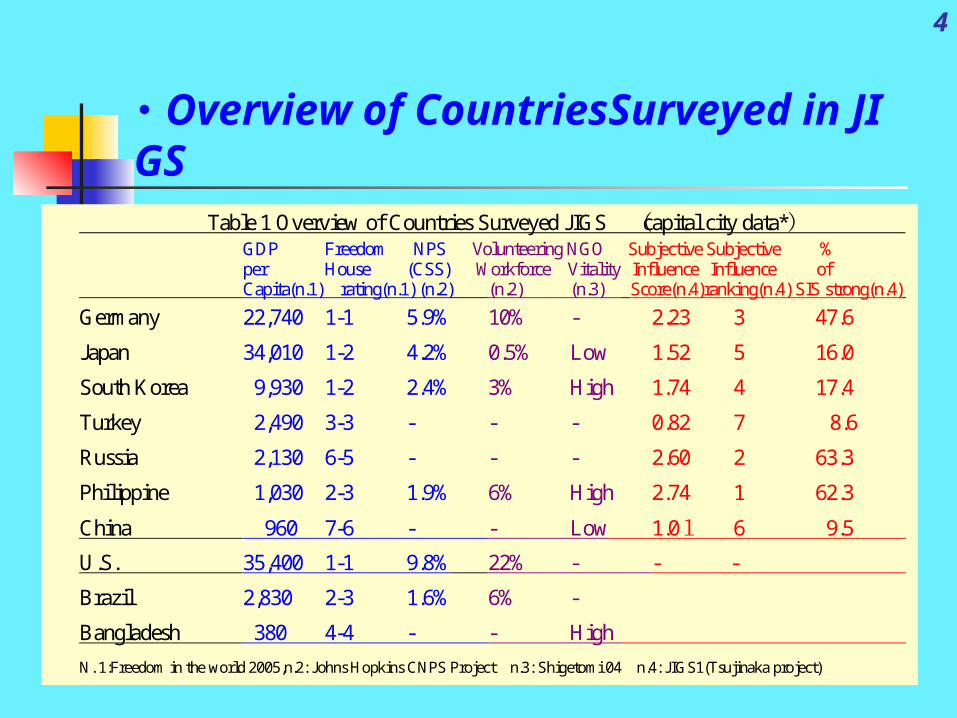
・ Overview of CountriesSurveyed in JIGS Table 1 Overview of Countries Surveyed JIGS (capital city data*) GDP Freedom NPS Volunteering NGO Subjective Subjective % per House (CSS) Workforce Vitality Influence Influence of Capita(n.1) rating(n.1) (n.2) (n.2) (n.3) Score(n.4)ranking(n.4) SIS strong(n.4)
Germany 22,740 1-1 5.9% 10% - 2.23 3 47.6
Japan 34,010 1-2 4.2% 0.5% Low 1.52 5 16.0
South Korea 9,930 1-2 2.4% 3% High 1.74 4 17.4
Turkey 2,490 3-3 - - - 0.82 7 8.6
Russia 2,130 6-5 - - - 2.60 2 63.3
Philippine 1,030 2-3 1.9% 6% High 2.74 1 62.3
China 960 7-6 - - Low 1.01 6 9.5
U.S. 35,400 1-1 9.8% 22% - - -
Brazil 2,830 2-3 1.6% 6% -
Bangladesh 380 4-4 - - High
N. 1:Freedom in the world 2005,n.2: Johns Hopkins CNPS Project n.3: Shigetomi 04 n.4: JIGS1(Tsujinaka project)
5
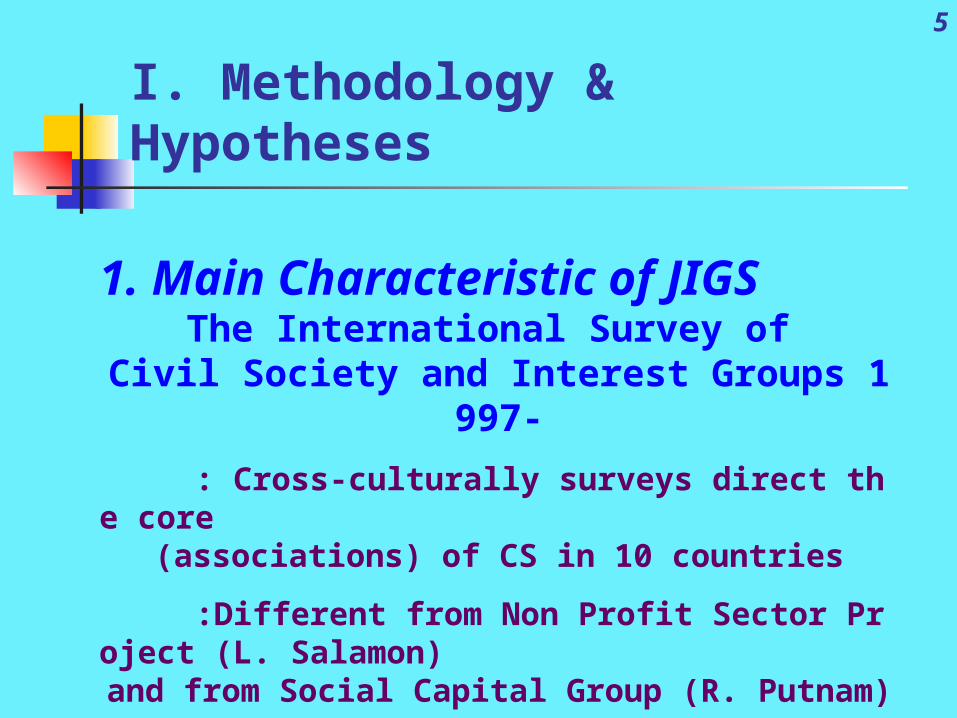
1. Main Characteristic of JIGSThe International Survey of
Civil Society and Interest Groups 1997-
: Cross-culturally surveys direct the core (associations) of CS in 10 countries
:Different from Non Profit Sector Project (L. Salamon)and from Social Capital Group (R. Putnam)
I. Methodology & Hypotheses
6Table 2 Overview of JIGS Surveys
Country Year Data Source / Survey Method Population Sample
(a) Valid
Response(b) Return
Rate(%)(b/a) Regions
(Valid Return Sample)
1.Japan `97 classified telephone directory / mail
23,128 4,247 1,635 38.5 Tokyo (1,438) Ibaraki (197)
2.Korea `97 classified telephone directory / mail
11,521 3,890 4,93 12.7 Seoul (371)
Kyonggi (110)
3.USA `99 classified telephone directory / mail
7,228 5,089 1,492 29.3 Washington, D.C.
(748) North Carolina (752)
4.Germany `00 classified telephone directory, organization directory / mail
4,806 3,074 8,85 28.8 Berlin (643) Halle (154)
5.China `01, ‘03
“Social Groups” officially registered at the Municipal or District/Country Civil Affairs Bureau / mail
9,536 8,897 2,858 32.1 Beijing (627),
Xianju (1,782), Heilongjiang (449)
6.Turkey ‘03 Regional survey investigation based on telephone directory / interview
15,730 Appr. 1,500
841 - Ankara ( 334 ) Istanbul ( 507 )
7.Russia ‘03 Registered Organization(NGO) Database / mail
2,974 1,500 711 47.4 Moscow (411) Saint
Petersburg (300)
8.Philippine ’04
Securities and Exchange Commission (SEC), Philippine Foundation Center (PFC) / interview
44,051 5,472 1,014 18.5 Manila (855) Cebu (159)
9.Brazil ‘05 Brazilian Institute of Geography and Statistics (IBGE) / interview
275,895 3,000 (est.)
1,500 (est.)
50 (est.)
Brasilia,Recife,Belem (Belo Horizonte)
10.Bangladesh ‘06 Telephone books, Directories TBC 1,500 (est.)
800 (est.)
50 (est.)
Dhaka, Rajshahi
7
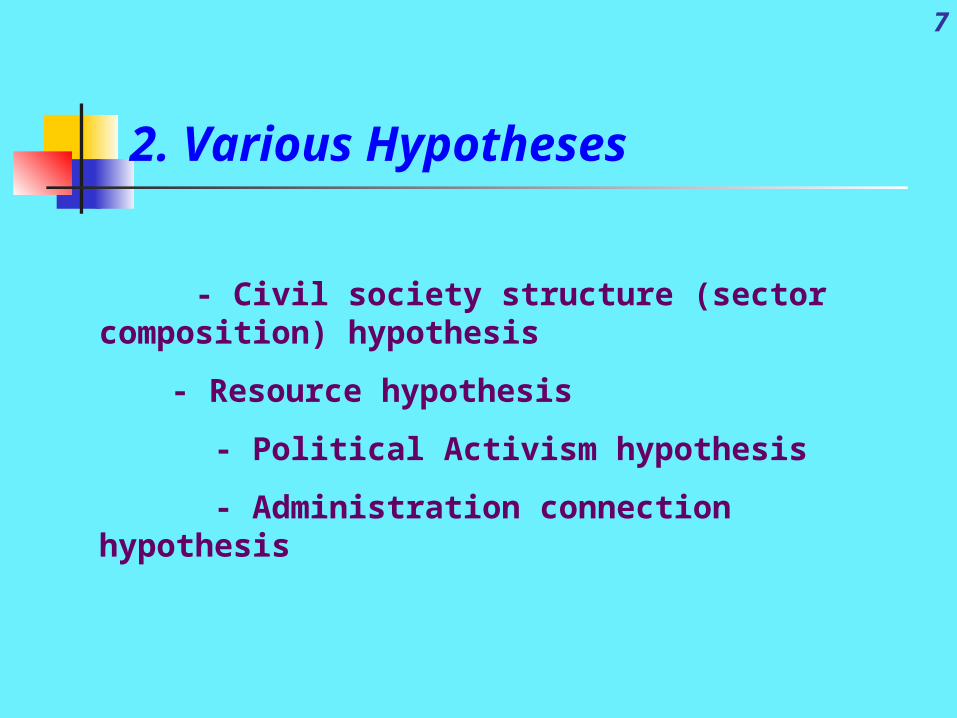
- Civil society structure (sector composition) hypothesis
- Resource hypothesis
- Political Activism hypothesis
- Administration connection hypothesis
2. Various Hypotheses

8
・ Relation between factors and SIS (mean)
- Analysis through Scatter Diagram (Nation Level) : linear or non-linear
- Cross Tabulation Analysis (Nation Level) : χ2-test
- Cross Tabulation Analysis (Sector Level) : χ2-test(Profit Sector, Non Profit Sector, Citizen Sector, Other)
3. Method of Analysis
9
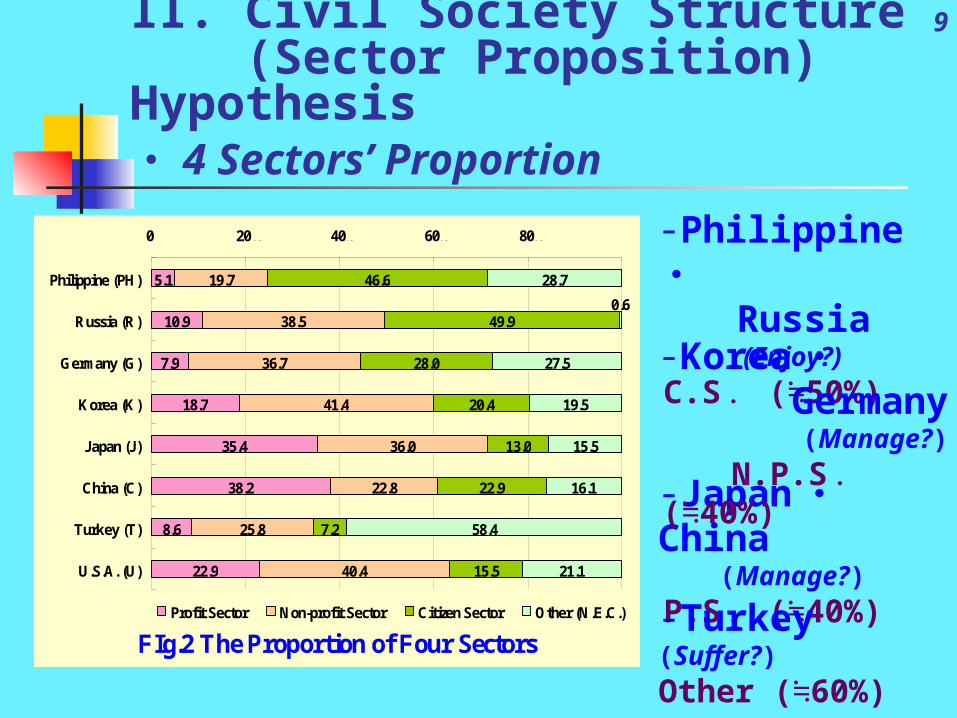
-Philippine ・ Russia (Enjoy?)
C.S . ( 50%)≒
・ 4 Sectors’ Proportion
FIg.2 The Proportion of Four Sectors
5.1
10.9
7.9
18.7
35.4
38.2
8.6
22.9
19.7
38.5
36.7
41.4
36.0
22.8
25.8
40.4
46.6
49.9
28.0
20.4
13.0
22.9
7.2
15.5
28.7
27.5
19.5
15.5
16.1
58.4
21.1
0.6
0 20 40 60 80 100
Philippine (PH)
Russia (R)
Germany (G)
Korea (K)
Japan (J)
China (C)
Turkey (T)
U.S.A. (U)
Profit Sector Non-profit Sector Citizen Sector Other (N.E.C.)
% 100%%%%%
-Japan ・ China(Manage?)
P.S . ( 40%)≒
-Turkey (Suffer?)
Other ( 60%)≒
II. Civil Society Structure (Sector Proposition) Hypothesis
-Korea ・Germany (Manage?)
N.P.S . ( 40%)≒
10
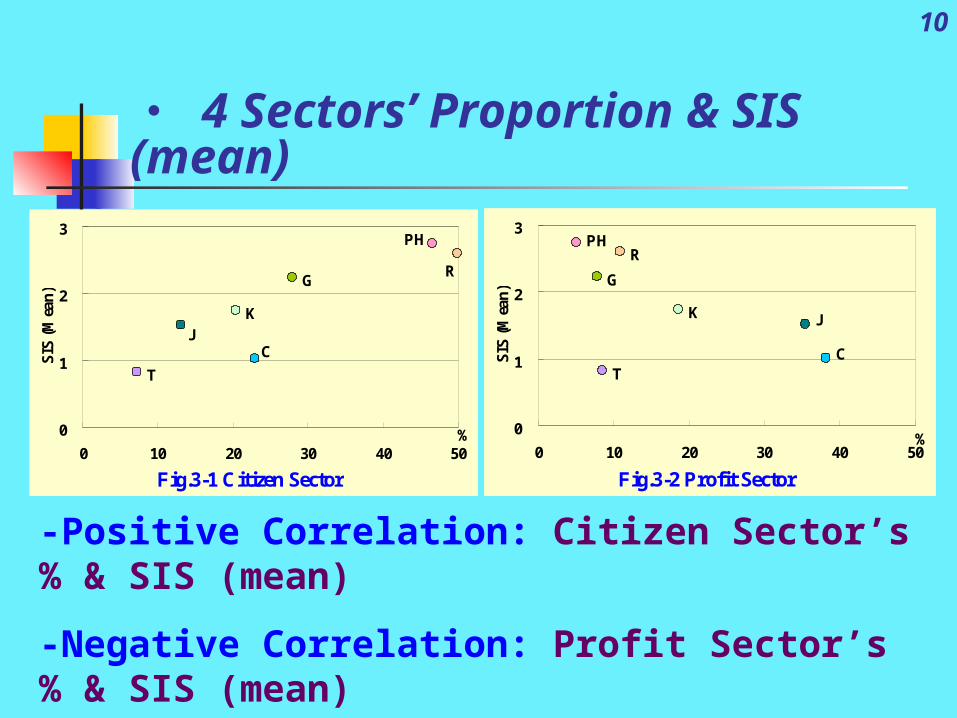
-Positive Correlation: Citizen Sector’s % & SIS (mean)
-Negative Correlation: Profit Sector’s % & SIS (mean)
⇒ CSS Hypothesis is Valid
・ 4 Sectors’ Proportion & SIS (mean)
Fig.3-1 Citizen Sector
K
GR
PH
T
JC
0
1
2
3
0 10 20 30 40 50%
SIS
(M
ean
)
Fig.3-2 Profit Sector
K
G
RPH
T
J
C
0
1
2
3
0 10 20 30 40 50%
SIS
(M
ean
)
11
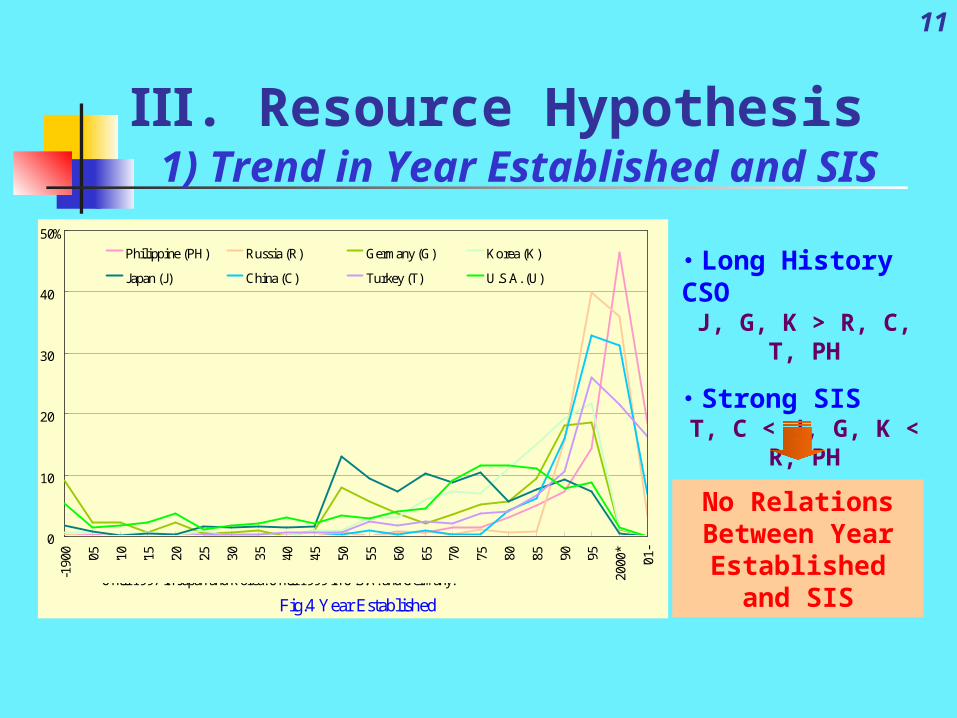
1) Trend in Year Established and SISⅢ. Resource Hypothesis
・ Long History CSOJ, G, K > R, C, T, PH
・ Strong SIST, C < J, G, K < R, PH
0
10
20
30
40
50
-190
0
'05
'10
'15
'20
'25
'30
'35
'40
'45
'50
'55
'60
'65
'70
'75
'80
'85
'90
'95
2000
*
'01-
Fig.4 Year Established
%
Philippine (PH) Russia (R) Germany (G) Korea (K)
Japan (J) China (C) Turkey (T) U.S.A. (U)
* Until 1997 in Japan and Korea. Until 1999 in U.S.A. and Germany.
No RelationsBetween Year
Established and SIS
12
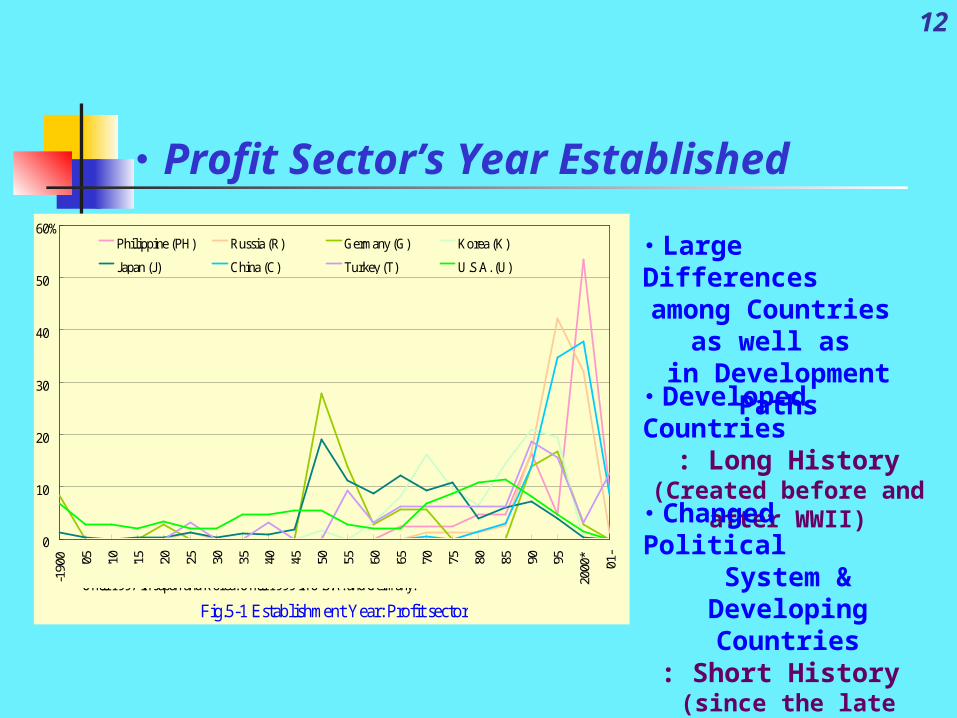
・ Profit Sector’s Year Established
・ Large Differencesamong Countries
as well as in Development Paths
0
10
20
30
40
50
60
-190
0
'05
'10
'15
'20
'25
'30
'35
'40
'45
'50
'55
'60
'65
'70
'75
'80
'85
'90
'95
2000
*
'01-
Fig.5-1 Establishment Year: Profit sector
%Philippine (PH) Russia (R) Germany (G) Korea (K)
Japan (J) China (C) Turkey (T) U.S.A. (U)
* Until 1997 in Japan and Korea. Until 1999 in U.S.A. and Germany.
・ Developed Countries: Long History (Created before and after WWII)
・ Changed Political System & Developing
Countries: Short History
(since the late ’80s)
13
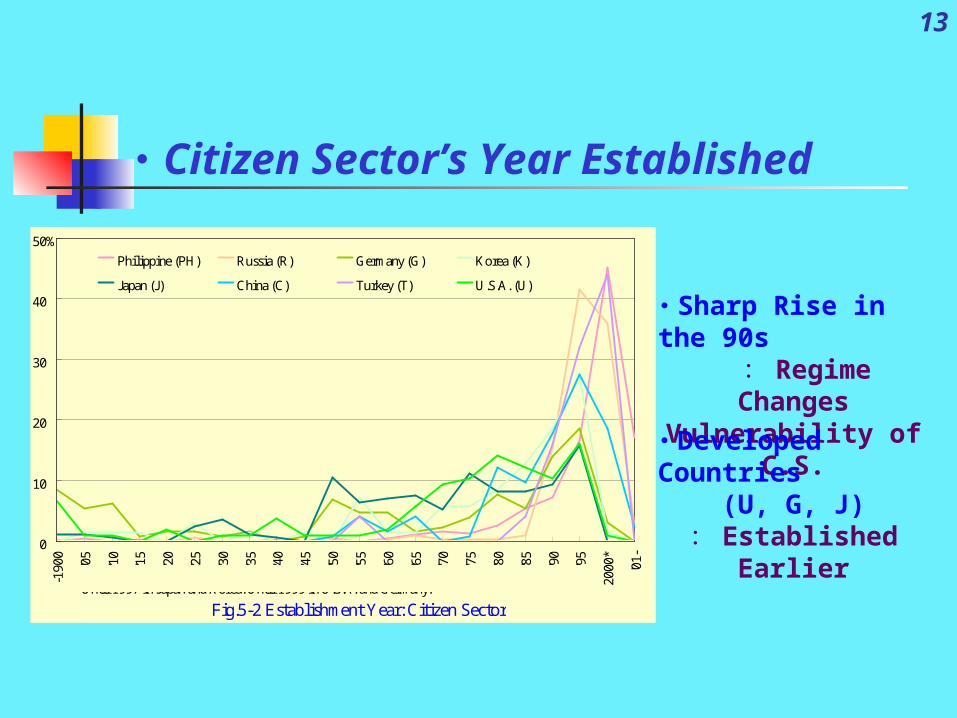
・ Citizen Sector’s Year Established
・ Sharp Rise in the 90s : Regime ChangesVulnerability of C.S.
Fig.5-2 Establishment Year: Citizen Sector
0
10
20
30
40
50
-190
0
'05
'10
'15
'20
'25
'30
'35
'40
'45
'50
'55
'60
'65
'70
'75
'80
'85
'90
'95
2000
*
'01-
%
Philippine (PH) Russia (R) Germany (G) Korea (K)
Japan (J) China (C) Turkey (T) U.S.A. (U)
* Until 1997 in Japan and Korea. Until 1999 in U.S.A. and Germany.
・ Developed Countries (U, G, J)
: Established Earlier
14
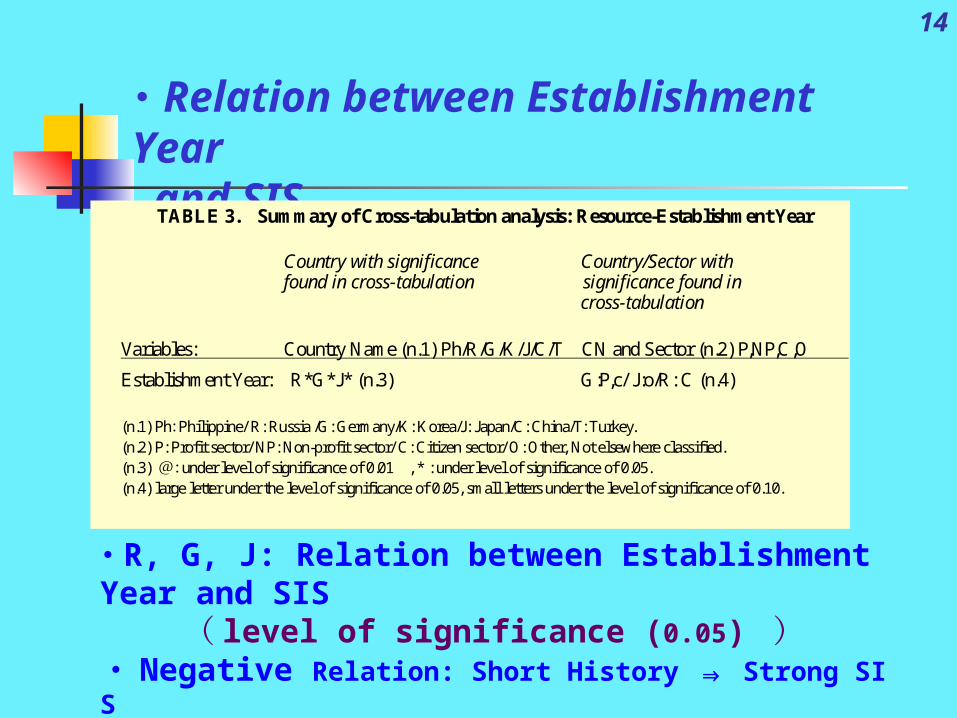
・ Relation between Establishment Year and SIS
・ R, G, J: Relation between Establishment Year and SIS( level of significance (0.05) )
・ Negative Relation: Short History Strong SIS⇒
TABLE 3. Summary of Cross-tabulation analysis: Resource-Establishment Year
Country with significance Country/Sector with found in cross-tabulation significance found in
cross-tabulation
Variables: Country Name (n.1) Ph/R/G/K/J/C/T CN and Sector (n.2) P,NP,C,O
Establishment Year: R*G*J* (n.3) G:P,c/ J:o/R: C (n.4) (n.1) Ph:Philippine/ R: Russia /G: Germany/K: Korea/J: Japan/C: China/T: Turkey. (n.2) P: Profit sector/ NP: Non-profit sector/ C: Citizen sector/ O: Other, Not elsewhere classified. (n.3) @:under level of significance of 0.01 , * : under level of significance of 0.05. (n.4) large letter under the level of significance of 0.05, small letters under the level of significance of 0.10.
15
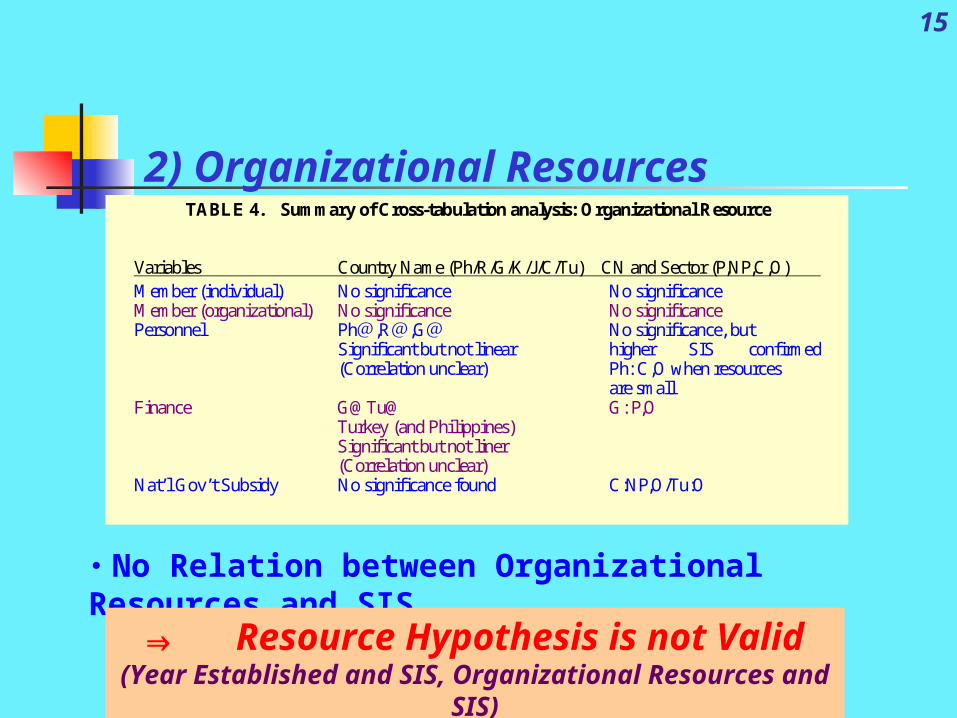
2) Organizational Resources
・ No Relation between Organizational Resources and SIS
TABLE 4. Summary of Cross-tabulation analysis: Organizational Resource
Variables Country Name (Ph/R/G/K/J/C/Tu) CN and Sector (P,NP,C,O) Member (individual) No significance No significance Member (organizational) No significance No significance Personnel Ph@,R@,G@ No significance, but
Significant but not linear higher SIS confirmed (Correlation unclear) Ph: C,O when resources
are small Finance G@Tu@ G: P,O Turkey (and Philippines)
Significant but not liner (Correlation unclear)
Nat’l Gov’t Subsidy No significance found C:NP,O/Tu:O
⇒ Resource Hypothesis is not Valid (Year Established and SIS, Organizational Resources and SIS)
16
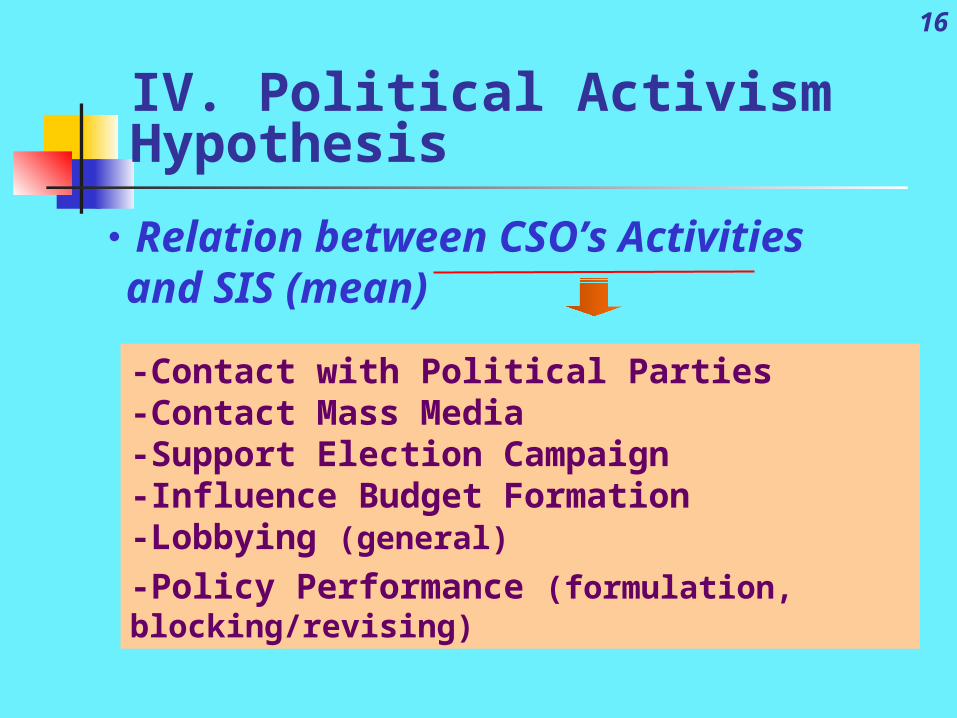
IV. Political Activism Hypothesis
・ Relation between CSO’s Activities and SIS (mean)
-Contact with Political Parties-Contact Mass Media -Support Election Campaign-Influence Budget Formation-Lobbying (general)
-Policy Performance (formulation, blocking/revising)
17
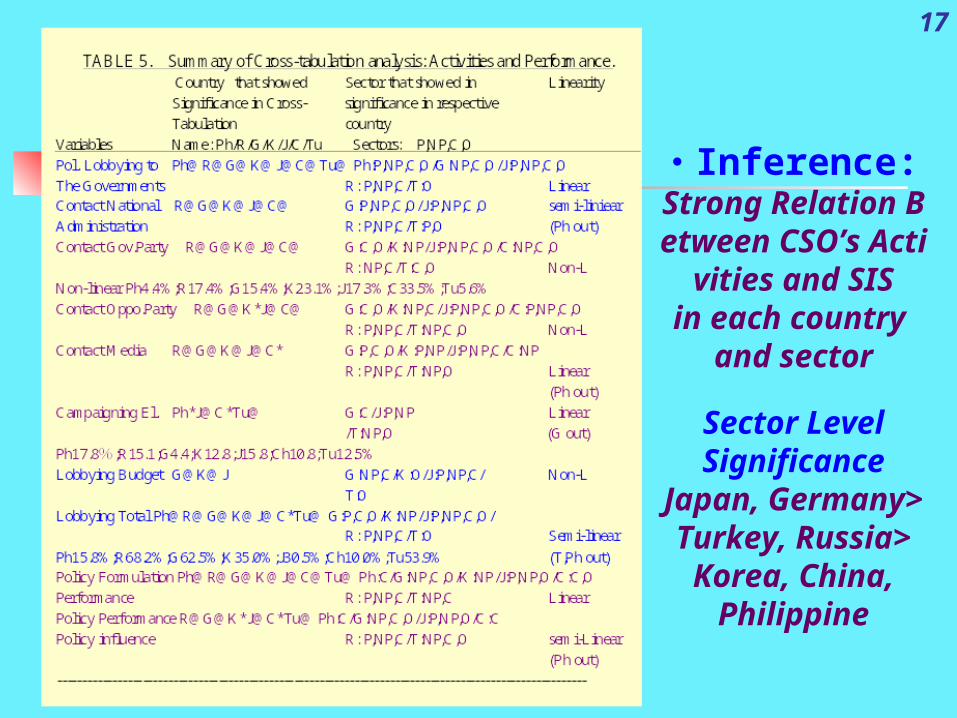
・ Inference:Strong Relation Between CSO’s Activiti
es and SISin each country
and sector
Sector Level Significance
Japan, Germany>Turkey, Russia>Korea, China,
Philippine
18
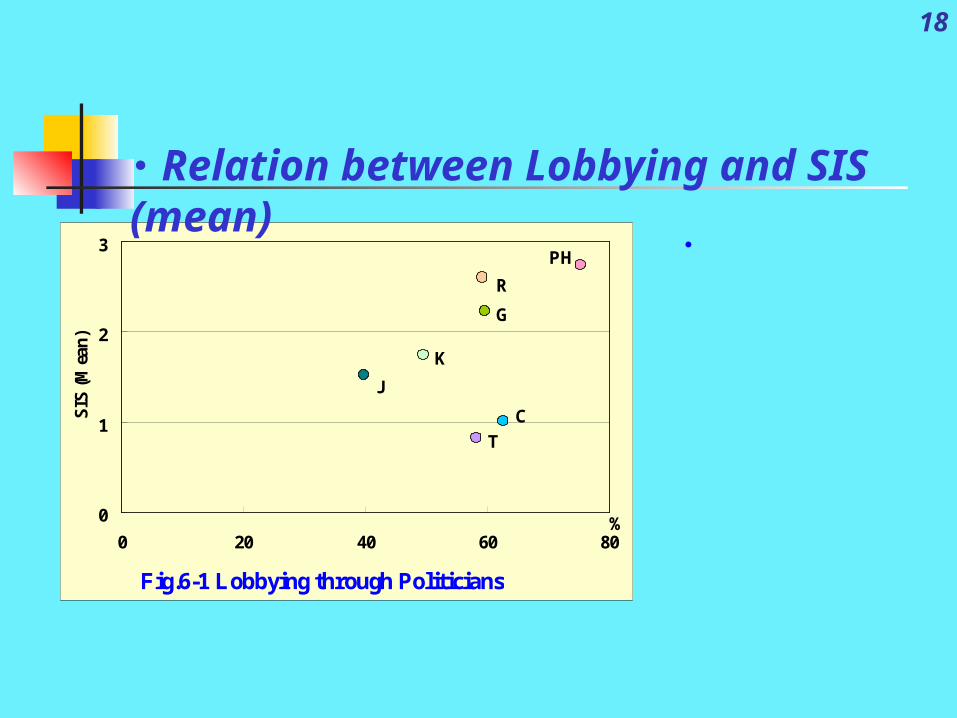
・
Fig.6-1 Lobbying through Politicians
T
C
J
K
G
PH
R
0
1
2
3
0 20 40 60 80%
SIS
(M
ean
)
・ Relation between Lobbying and SIS (mean)
19
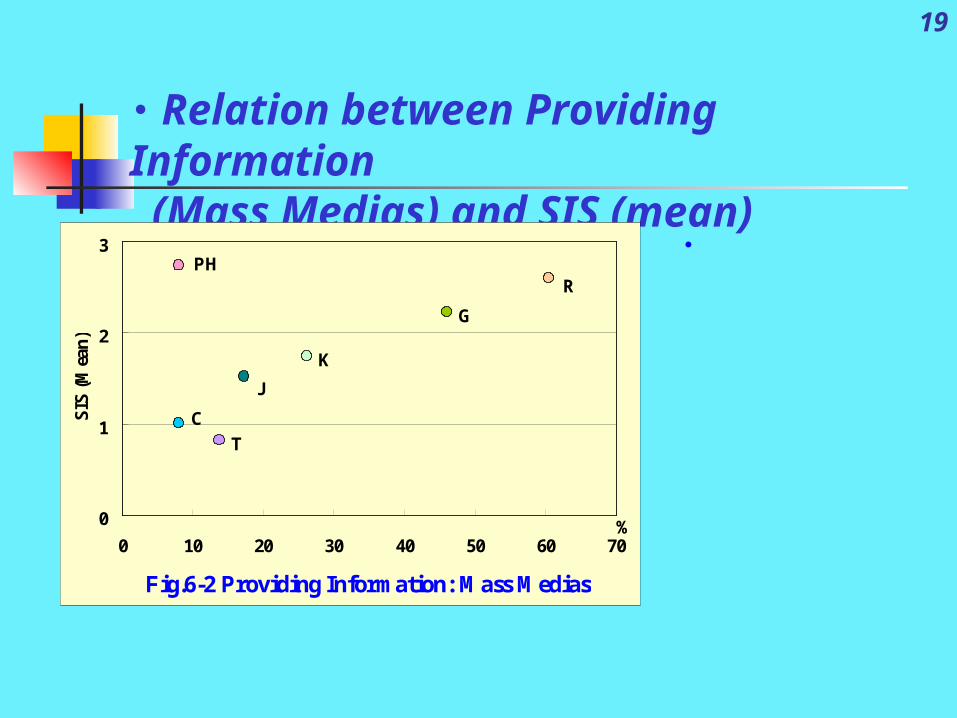
・
・ Relation between Providing Information (Mass Medias) and SIS (mean)
Fig.6-2 Providing Information: Mass Medias
T
C
J
K
G
PHR
0
1
2
3
0 10 20 30 40 50 60 70%
SIS
(M
ean
)
20
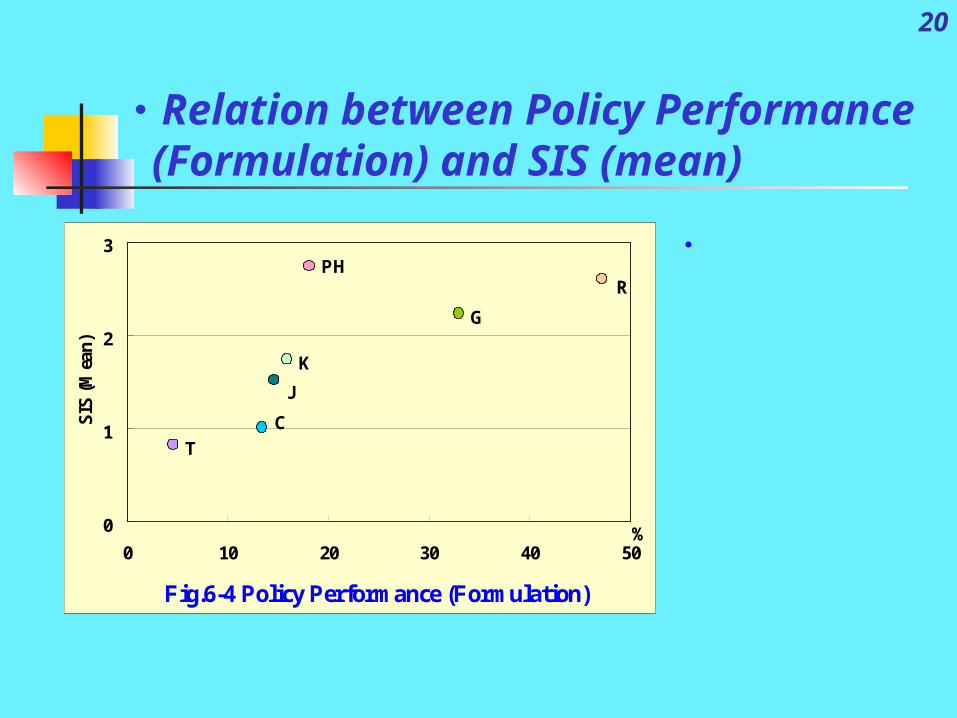
・
・ Relation between Policy Performance (Formulation) and SIS (mean)
Fig.6-4 Policy Performance (Formulation)
T
C
J
K
G
PHR
0
1
2
3
0 10 20 30 40 50%
SIS
(M
ean
)
21
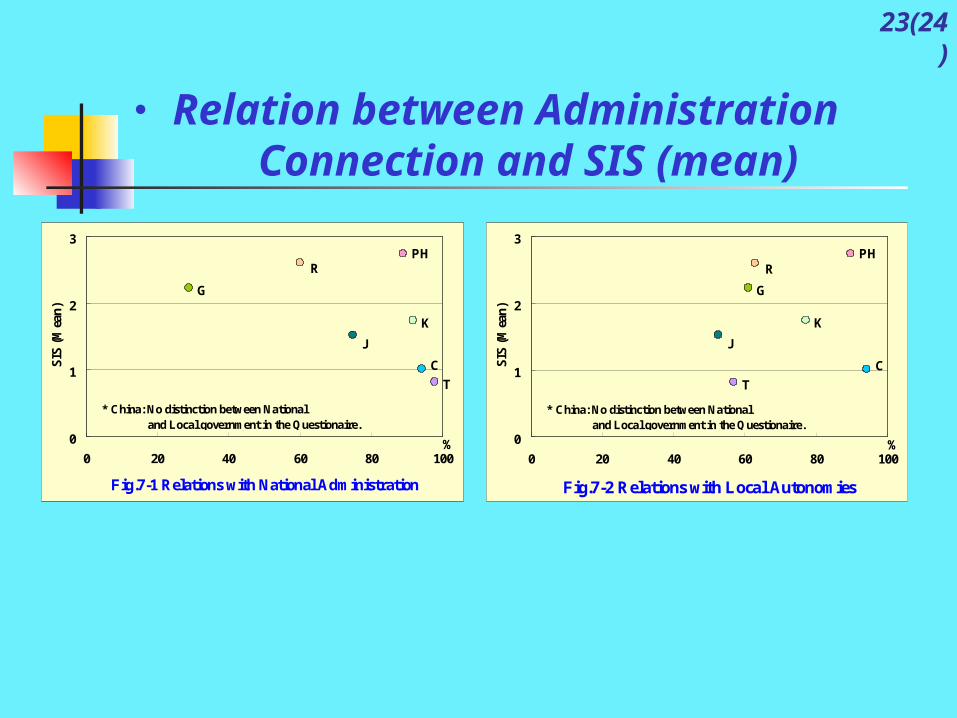
V. Administration Connection Hypothesis
・ Institutional Relation between Administration Connection and SIS (mean)
-Accrediting-Licensing-Administrative Guidance-Policy-Formation Cooperation-Opinion Exchange-Sending Advisory Board Member-Post Offering to the Ex-Bureaucrats …..
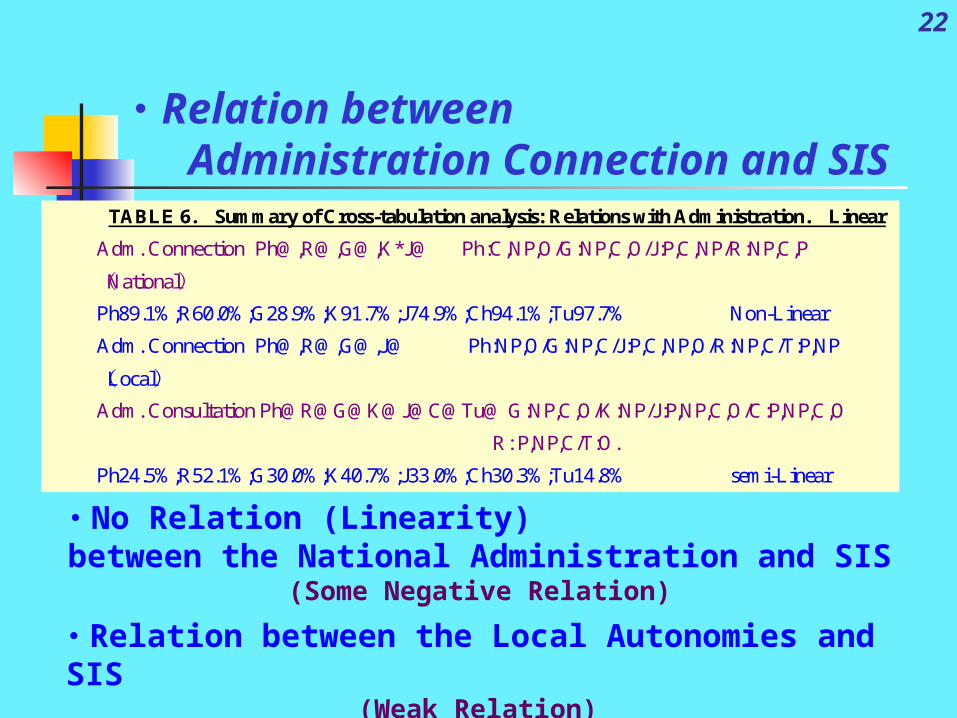
22
・ Relation between Administration Connection and SIS
TABLE 6. Summary of Cross-tabulation analysis: Relations with Administration. Linear
Adm. Connection Ph@,R@,G@,K*J@ Ph:C,NP,O/G:NP,C,O/J:P,C,NP/R:NP,C,P
(National)
Ph89.1%;R60.0%;G28.9%;K91.7%;J74.9%;Ch94.1%;Tu97.7% Non-Linear
Adm. Connection Ph@,R@,G@,J@ Ph:NP,O/G:NP,C/J:P,C,NP,O/R:NP,C/T:P,NP
(Local)
Adm. Consultation Ph@R@G@K@J@C@Tu@ G:NP,C,O/K:NP/J:P,NP,C,O/C:P,NP,C,O
R: P,NP,C/T:O.
Ph24.5%;R52.1%;G30.0%;K40.7%;J33.0%;Ch30.3%;Tu14.8% semi-Linear
・ No Relation (Linearity) between the National Administration and SIS
(Some Negative Relation)
・ Relation between the Local Autonomies and SIS(Weak Relation)
23(24)
・ Relation between Administration Connection and SIS (mean)
Fig.7-1 Relations with National Administration
T
C
J
K
G
PHR
0
1
2
3
0 20 40 60 80 100%
SIS
(M
ean
)
* China: No distinction between National and Local government in the Questionaire.
Fig.7-2 Relations with Local Autonomies
RPH
G
K
J
C
T
0
1
2
3
0 20 40 60 80 100%
SIS
(M
ean
)
* China: No distinction between National and Local government in the Questionaire.
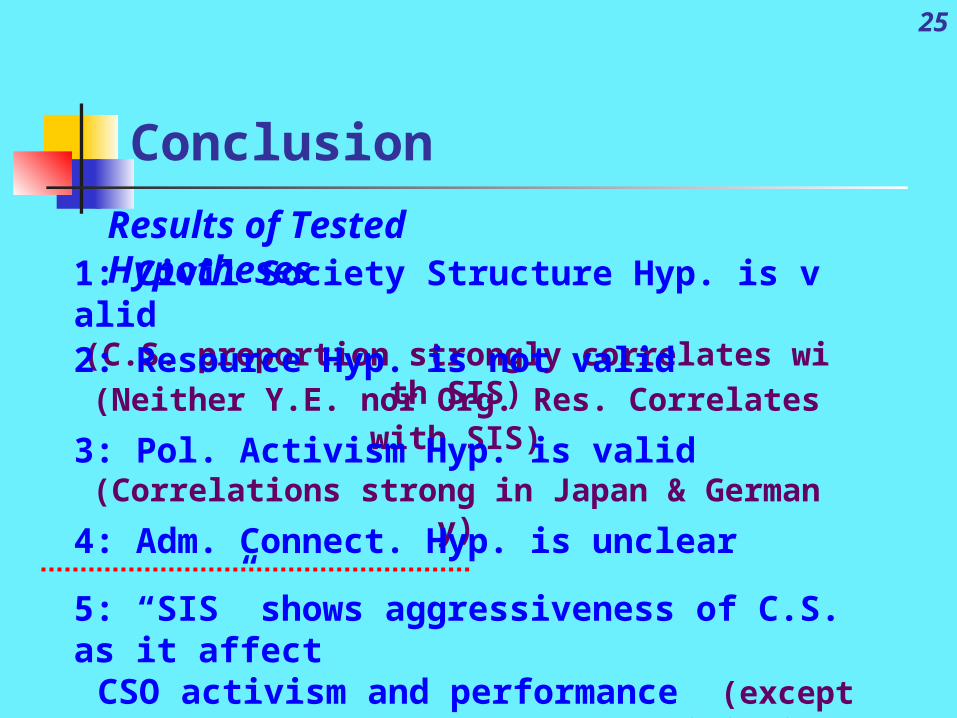
Conclusion
25
1: Civil Society Structure Hyp. is valid(C.S. proportion strongly correlates with SIS)
Results of Tested Hypotheses
2: Resource Hyp. is not valid(Neither Y.E. nor Org. Res. Correlates with SIS)
3: Pol. Activism Hyp. is valid(Correlations strong in Japan & Germany)
4: Adm. Connect. Hyp. is unclear
5: “SIS” shows aggressiveness of C.S. as it affect CSO activism and performance (except Philippine)