Embed Size (px)
Citation preview

A report by the European Wind Energy Association - November 2013
Where's the money coming from? Financing offshore wind farms


Where's the money coming from? Financing offshore wind farms
a report by the European Wind Energy Association
Text and analysis: Athanasia Arapogianni, Jacopo Moccia (European Wind Energy Association -- EWEA)
Data collection and data analysis: EY
Contributing authors: Justin Wilkes, Anne-Bénédicte Genachte (EWEA)
Revision and editing: Sarah Azau (EWEA)
External editor: Adrienne Margoyles
Design coordination: Jesús Quesada (EWEA)
Design: Giselinde Van de Velde
Cover photo: Design based in Siemens AG Energy Sector
EWEA has joined a climate neutral printing programme. It makes choices as to what it prints and how, based on environmental criteria. The CO2 emissions of the printing process are then calculated and compensated by green emission allowances purchased from a sustainable project.
Published in November 2013
ISBN: 978-2-930670-06-5
4 Where's the money coming from? - Financing offshore wind farms
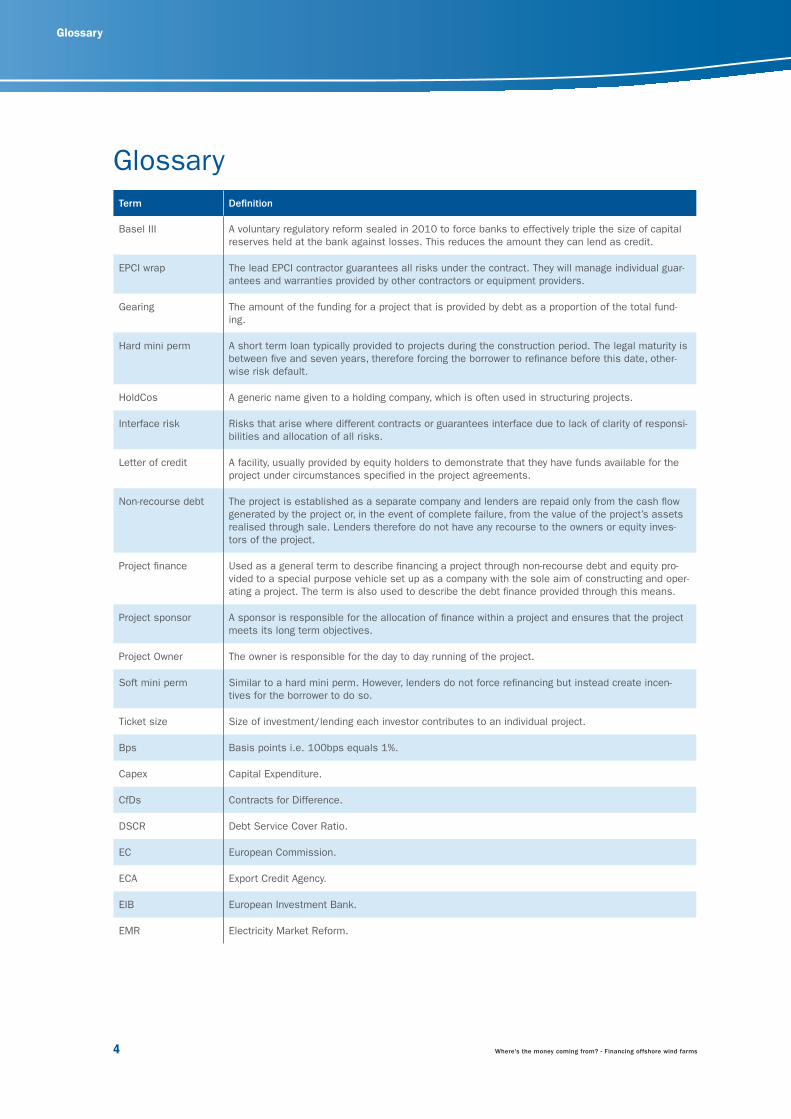
Glossary
GlossaryTerm Definition
Basel III A voluntary regulatory reform sealed in 2010 to force banks to effectively triple the size of capital reserves held at the bank against losses. This reduces the amount they can lend as credit.
EPCI wrap The lead EPCI contractor guarantees all risks under the contract. They will manage individual guar-antees and warranties provided by other contractors or equipment providers.
Gearing The amount of the funding for a project that is provided by debt as a proportion of the total fund-ing.
Hard mini perm A short term loan typically provided to projects during the construction period. The legal maturity is between five and seven years, therefore forcing the borrower to refinance before this date, other-wise risk default.
HoldCos A generic name given to a holding company, which is often used in structuring projects.
Interface risk Risks that arise where different contracts or guarantees interface due to lack of clarity of responsi-bilities and allocation of all risks.
Letter of credit A facility, usually provided by equity holders to demonstrate that they have funds available for the project under circumstances specified in the project agreements.
Non-recourse debt The project is established as a separate company and lenders are repaid only from the cash flow generated by the project or, in the event of complete failure, from the value of the project’s assets realised through sale. Lenders therefore do not have any recourse to the owners or equity inves-tors of the project.
Project finance Used as a general term to describe financing a project through non-recourse debt and equity pro-vided to a special purpose vehicle set up as a company with the sole aim of constructing and oper-ating a project. The term is also used to describe the debt finance provided through this means.
Project sponsor A sponsor is responsible for the allocation of finance within a project and ensures that the project meets its long term objectives.
Project Owner The owner is responsible for the day to day running of the project.
Soft mini perm Similar to a hard mini perm. However, lenders do not force refinancing but instead create incen-tives for the borrower to do so.
Ticket size Size of investment/lending each investor contributes to an individual project.
Bps Basis points i.e. 100bps equals 1%.
Capex Capital Expenditure.
CfDs Contracts for Difference.
DSCR Debt Service Cover Ratio.
EC European Commission.
ECA Export Credit Agency.
EIB European Investment Bank.
EMR Electricity Market Reform.
Where's the money coming from? - Financing offshore wind farms 5
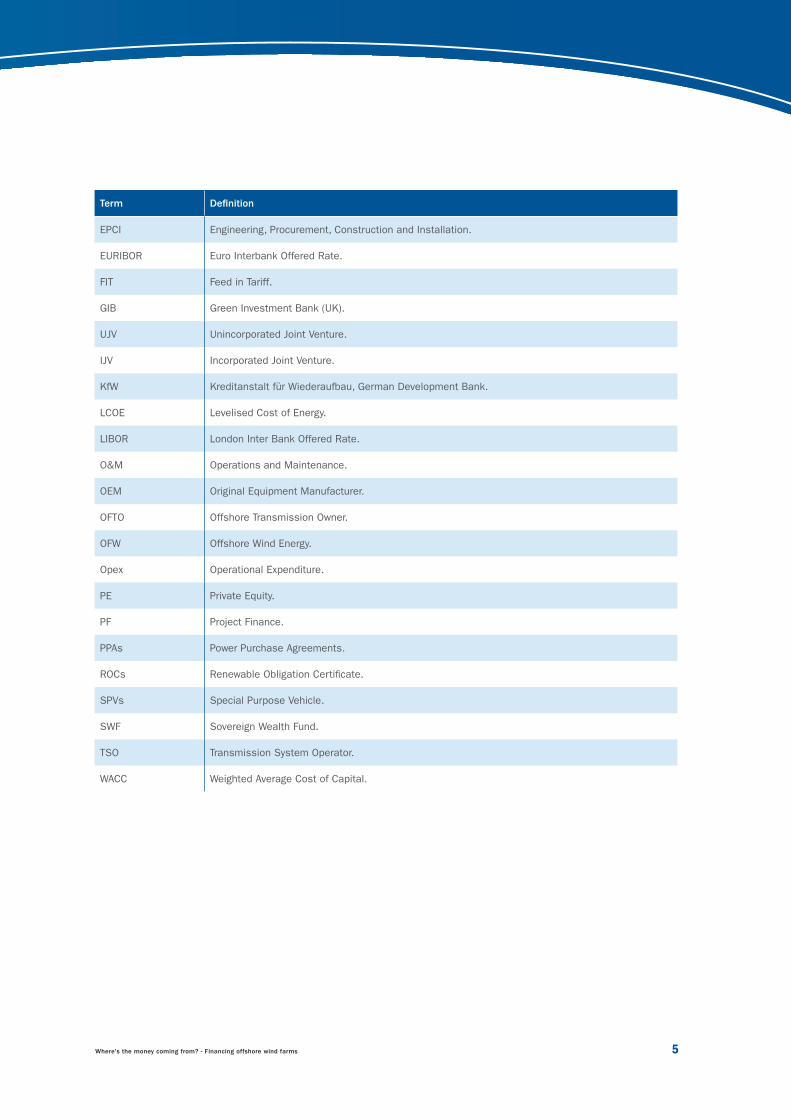
Term Definition
EPCI Engineering, Procurement, Construction and Installation.
EURIBOR Euro Interbank Offered Rate.
FIT Feed in Tariff.
GIB Green Investment Bank (UK).
UJV Unincorporated Joint Venture.
IJV Incorporated Joint Venture.
KfW Kreditanstalt für Wiederaufbau, German Development Bank.
LCOE Levelised Cost of Energy.
LIBOR London Inter Bank Offered Rate.
O&M Operations and Maintenance.
OEM Original Equipment Manufacturer.
OFTO Offshore Transmission Owner.
OFW Offshore Wind Energy.
Opex Operational Expenditure.
PE Private Equity.
PF Project Finance.
PPAs Power Purchase Agreements.
ROCs Renewable Obligation Certificate.
SPVs Special Purpose Vehicle.
SWF Sovereign Wealth Fund.
TSO Transmission System Operator.
WACC Weighted Average Cost of Capital.

6 Where's the money coming from? - Financing offshore wind farms

Where's the money coming from? - Financing offshore wind farms 7
Content Executive summary ..................................................................................................................8
1. Introduction ............................................................................................................................ 12
1.1 Deployment to date and progress against targets ........................................................................... 131.2 Barriers to progress ..................................................................................................................... 141.3 The challenge to 2020 ................................................................................................................. 151.4 The financing requirement ............................................................................................................. 161.5 Purpose and approach of this report.............................................................................................. 17
2. Sources of finance ................................................................................................................. 18
Key findings ....................................................................................................................................... 192.1 Overview of European offshore ...................................................................................................... 202.2 An overview of sources of finance.................................................................................................. 212.3 Equity investors ........................................................................................................................... 222.4 Debt providers ............................................................................................................................. 292.5 Funding structure ......................................................................................................................... 322.6 Refinancing options ...................................................................................................................... 36
3. Contracting and risks ............................................................................................................. 38
Key findings ....................................................................................................................................... 393.1 Introduction ................................................................................................................................. 403.2 Competing for capital with other technologies? ............................................................................... 403.3 Key construction risks .................................................................................................................. 423.4 Key operation risks ...................................................................................................................... 453.5 Service provider underwriting ........................................................................................................ 473.6 Key approaches for mitigating the major risk in offshore wind projects ............................................. 49
4. Plugging the funding gap ...................................................................................................... 50
4.1 Expected funding models up to 2020 ............................................................................................ 514.2 Recommendations to stakeholders to facilitate funding for offshore wind ......................................... 54
Appendix A: Approach and methodology ................................................................................. 63
Appendix B: Project gearing ...................................................................................................... 64
Appendix C: Debt terms ............................................................................................................. 66

© T
hink
stoc
k
EXECUTIVE SUMMARY

Where's the money coming from? - Financing offshore wind farms 9
The long-term stable market and regulatory framework challenge
The major challenge increasingly facing the offshore wind industry is regulatory risk, which can refer to un-clear or conflicting political support for offshore wind, uncertainty with grid connection regimes, or lack of a long-term stable market and regulatory framework. It is critical that national governments address this risk, not least by working with the European Commission to agree a binding 2030 renewable energy target at the earliest opportunity.
The funding challenge
The European offshore wind energy industry needs to attract between €90 billion and €123 billion (bn) by 2020 to meet its deployment target of 40 GW.
Should regulatory instability prevent the offshore in-dustry from reaching its 40 GW target by 2020, even a conservative assumption of 25 GW would still require between €50 bn and €69 bn over the next seven years.
However, availability of financing now appears less likely to constrain the growth of offshore wind energy than regulatory risk.
Funding is available
Power producers have so far been the main investors in offshore wind using their balance sheets. As the scale of investment grows, new entrants are becoming active in different aspects of project development. En-gineering, procurement construction and installation companies (EPCI), wind turbine manufacturers, oil and gas companies and corporate investors are already investing in offshore wind according to their specific strengths and capabilities. Infrastructure funds and institutional investors have already made progress in taking construction risk and enhancing the financing landscape for offshore wind.
Moreover, innovative funding structures are now be-ing used. The role of development banks and Export Credit Agencies (ECAs) has been significant in attract-ing commercial lenders to the sector. There are now over 30 banks with experience of lending to offshore wind and there are more examples of them lending to projects earlier and taking construction risk.
Risky business?
Despite the challenging funding requirements, both traditional and new investors seem optimistic and will-ing to continue to invest in offshore wind. According to them, the most important risk factor is not the avail-ability of funding but regulatory instability. Evidently, the high level of uncertainty that comes with changing regulatory frameworks has slowed down offshore wind energy deployment in many European countries, not least in the two largest markets, the UK and Germany. Nevertheless, as long as Europe ensures a stable framework for offshore wind, the required capital can be channelled into the sector. For this to happen, agreement on a binding 2030 renewable energy target at EU level is crucial.
Looking specifically at construction risks, grid availabil-ity risk was considered the greatest concern by indus-try overall. This is one of the most significant barriers to deployment, particularly in markets where project sponsors are not responsible for grid connection.
Policy recommendations
• Create a long-term stable and clear market and reg-
ulatory framework based in a 2030 binding renew-
able energy target at EU level
Regulatory risk relating to support mechanisms is considered the most important challenge to off-shore wind deployment.
• Develop predictable grid connection regimes, with
clear allocation of responsibility and de-risked cost
recovery mechanisms
Resolving delays in grid connection and the uncer-tainty they create for wind farm developers and financiers is fundamental to avoid delays and cost overruns.

10 Where's the money coming from? - Financing offshore wind farms
Executive summary
• Engage consumers in an open dialogue on the cost
of energy
With an increased focus on the cost of energy bills for consumers, transparent perception of the cost of support to offshore wind energy and its significant benefits, should be addressed.
Plugging the funding gap
A number of funding models are expected to have a role in funding offshore wind projects in the period to 2020. These are shown below, together with recom-mendations for attracting these forms of capital.
• Maintain so-called shallow grid connection charges
as best practice for financing electricity infrastructure
Why should offshore wind energy become the first power generation technology to pay for grid connec-tion through deep grid connection regimes? Grid development benefits all producers and consumers and its costs and benefits should be socialised.
• Provide liquidity and credit support
Multilaterals and Export Credit Agencies are suc-cessful in attracting new sources of capital. They should be encouraged to invest and provide liquidity to the sector and in structures that facilitate the entry of new sources of capital to the sector.
TABLE 1 OUTLINE OF FUNDING MODELS
Potential source of funding Prominence in the sector to date How the capital can be accessed
Power producer balance sheet
Dominated the European offshore wind sector as the source of finance for con-struction and operations.
Power producers’ balance sheets are becoming constrained, limiting their abil-ity to finance new projects.
Power producers could recycle equity investments available on their balance sheet by re-financing existing projects either through debt (project finance bank debt or project bonds) or by selling equity, the majority of which have been minority stakes to date.
Alternatively, power producers could seek to construct more projects through joint ventures with other power producers or third party capital or better utilise project finance (see below).
Project finance Historically project finance has been underused since power producers run the risk of damaging their credit rating and banks’ due diligence process is perceived as time consuming with too much control and influence afforded to lenders . Project finance was considered too expensive and it was overly reliant on the provision of high levels of multi-lateral funding.
Cheaper debt is likely to foster greater demand – increased experience, improved understanding and enhanced appetite should increase competi-tion and lower the cost of debt.
Power producers could seek to construct more projects using project finance from clubs of com-mercial banks, multi-laterals and export credit agencies, so long as they can ensure isolation of the project debt from its corporate credit rating. Power producers would need to engage with ratings agencies in order to protect their credit ratings.

Where's the money coming from? - Financing offshore wind farms 11
Potential source of funding Prominence in the sector to date How the capital can be accessed
Third party capital (including institutional investors)
Historically third party capital has only been prepared to accept operational risk.
However, recently more institutional investors have started taking construc-tion risk under project finance deals with multi-lateral funding as well as working alongside major power producers.
Regulatory risk is the key concern for third party capital: there must be clear and stable regulation with long-term stability in the pricing.
The liquidity offered by multi-laterals is a key factor in ensuring sufficient level of debt is in place for the third party capital to meet its target returns.
Third party capital may be more attracted to con-struction risk if investors can accurately assess the risk and price their investment. This requires knowledge transfer from the EPCI providers and developers.
EPCI balance sheet EPCI providers have contributed equity to the construction of offshore wind farms – Siemens has gone as far as establish-ing a dedicated Private Equity (PE) arm for such ventures.
Like power producers, EPCI providers are becoming constrained.
EPCI providers can seek to recycle balance sheet equity through refinancing debt in existing pro-jects or an outright sale.
EPCI providers may continue to invest equity into offshore wind projects. The most likely route is through providing a minority equity contribution under traditional project finance structures.
However, the sector is looking increasingly to EPCI providers to reduce or mitigate risk through the provision of full turnkey EPCI wraps and to demonstrate strong balance sheets and success-ful track records. This will help to attract addi-tional debt and equity to projects by the sponsor.
Sponsors are seeking cost reductions through multi-contracts, but lenders are averse to this since it increases contract interface risk. The more EPCI providers can do to limit contract in-terface risk through tighter definition and control, the better off the project.
Project bonds Not played any role in European offshore wind energy generation funding to date.
Project bonds are not expected to be a source of construction finance up to 2020.
However, there is an expectation in the industry that they could become a source of finance for operations and potentially act as a route for power producers to recycle their balance sheets, through issuing specific bonds for existing projects.
Source: Offshore wind survey 2013
© Is
tock
INTRODUCTION
1.1 Deployment to date and progress against targets
1.2 Barriers to progress
1.3 The challenge to 2020
1.4 The financing requirement
1.5 Purpose and approach of this report

Where's the money coming from? - Financing offshore wind farms 13
1 European Council Conclusions 29/30 October 2009. Paragraph 7: “The European Council calls upon all Parties to embrace the 2°C objective and to agree to global emission reductions of at least 50%, and aggregate developed country emission reduc-tions of at least 80-95%, as part of such global emission reductions, by 2050 compared to 1990 levels; such objectives should provide both the aspiration and the yardstick to establish mid-term goals, subject to regular scientific review. It supports an EU objective, in the context of necessary reductions according to the IPCC by developed countries as a group, to reduce emissions by 80-95% by 2050 compared to 1990 levels.”
2 Directive 2009/28/EC of the European Parliament and of the Council of 23 April 2009 on the promotion of the use of energy from renewable sources.
3 Pure Power, Wind energy targets for 2020 and 2030, EWEA, 2011.
1.1 Deployment to date and progress against targetsThe European Union has committed to a legally bind-ing target to meet 20% of its energy consumption through renewable energy by 2020. To achieve this, there is an expectation that 34% of electricity will need to be generated by renewables. In the longer term, the EU is considering targets for 2030 as part of the commitment to decarbonise the economy by 80% to 95% by 20501.
Offshore wind has significant generation potential in Europe with increasingly large-scale sites identified as suitable for offshore development and benefiting from a favourable wind resource. Offshore wind is therefore expected to play a significant role in meeting these targets.
As required by the EU’s Renewable Energy Directive2, each Member State submitted a National Renewable
Energy Action Plan (NREAP) stating how it intends to meet these targets and what role each renewable tech-nology will play. Under these plans, Member States indicated that they will deploy 43.3 GW of offshore wind capacity by 2020.
In 2011 the European Wind Energy Association (EWEA) published scenarios for offshore wind energy deployment in Europe3, expecting 40 GW of installed offshore wind energy capacity by 2020.
Offshore wind deployment in Europe is currently lag-ging behind the NREAP targets by an average of 14%. By June 2013, 6 GW of generation capacity was in-stalled across Europe, suggesting that the over 9 GW target set out in the NREAPs for end 2013 will not be reached.
The French and German markets in particular are significantly behind their deployment targets. Their NREAP targets for 2012 were 670 MW and 790 MW respectively, but France has yet to bring any off-shore wind on line and deployment in Germany was 385.3 MW in June 2013.
FIGURE 1 PROJECTED CUMULATIVE OFFSHORE WIND CAPACITY
Source: EWEA, National Renewable Energy Action Plans
5
10
15
20
25
30
35
40
45
50
2011 2012 2013* 2014* 2015* 2016* 2017* 2018* 2019* 2020*
GW
EWEA NREAPs *Expected
14 Where's the money coming from? - Financing offshore wind farms
Chapter 1: Introduction
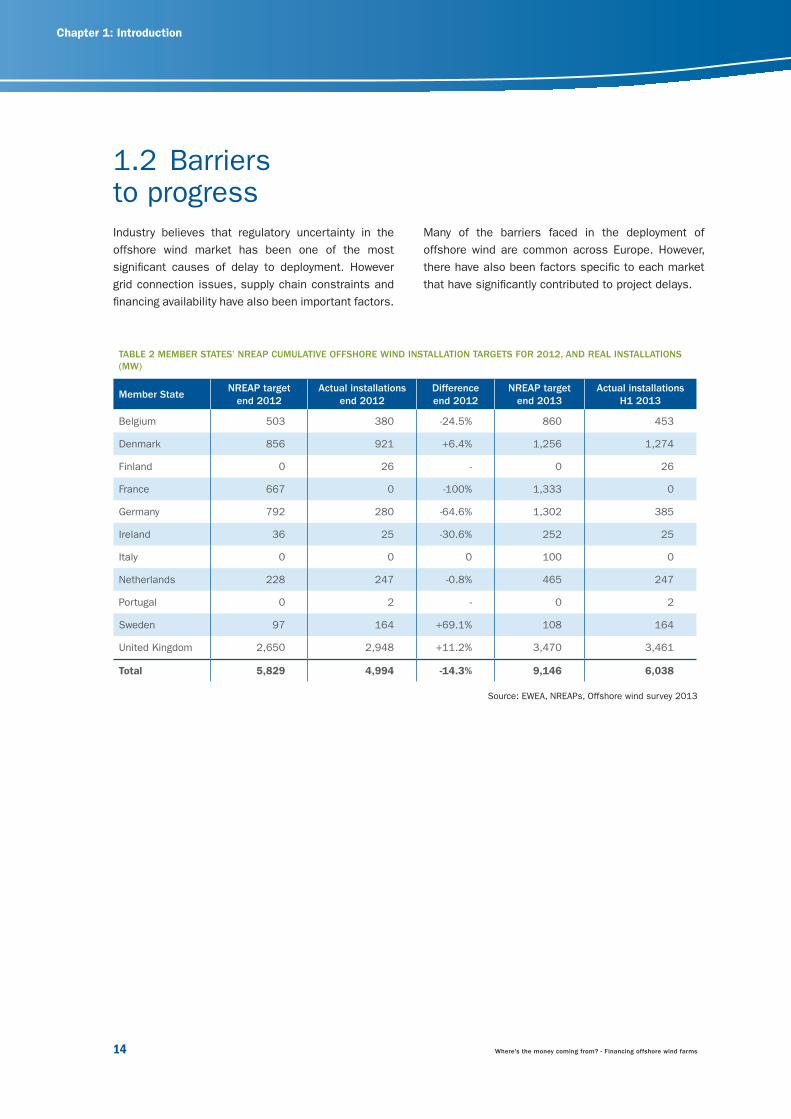
TABLE 2 MEMBER STATES’ NREAP CUMULATIVE OFFSHORE WIND INSTALLATION TARGETS FOR 2012, AND REAL INSTALLATIONS (MW)
Member StateNREAP target
end 2012Actual installations
end 2012Difference end 2012
NREAP target end 2013
Actual installations H1 2013
Belgium 503 380 -24.5% 860 453
Denmark 856 921 +6.4% 1,256 1,274
Finland 0 26 - 0 26
France 667 0 -100% 1,333 0
Germany 792 280 -64.6% 1,302 385
Ireland 36 25 -30.6% 252 25
Italy 0 0 0 100 0
Netherlands 228 247 -0.8% 465 247
Portugal 0 2 - 0 2
Sweden 97 164 +69.1% 108 164
United Kingdom 2,650 2,948 +11.2% 3,470 3,461
Total 5,829 4,994 -14.3% 9,146 6,038
Source: EWEA, NREAPs, Offshore wind survey 2013
1.2 Barriers to progress Industry believes that regulatory uncertainty in the offshore wind market has been one of the most significant causes of delay to deployment. However grid connection issues, supply chain constraints and financing availability have also been important factors.
Many of the barriers faced in the deployment of offshore wind are common across Europe. However, there have also been factors specific to each market that have significantly contributed to project delays.

Where's the money coming from? - Financing offshore wind farms 15
1.3 The challenge to 2020Progress against targets is expected to lag still further behind, as also indicated by mid-year 2013 installa-tion figures. There are currently 4.5 GW of offshore wind projects in construction and EWEA has identified an additional 18.4 GW of consented projects. If all these projects were commissioned, this would take the total deployment in Europe to 27.85 GW in line with the NREAP deployment target for 2018, still leav-ing a gap in the 2020 targets. Projects for the most part have been delayed, rather than cancelled entirely. Consequently, the overall installation targets of 40 GW plus could well be met, but it is increasingly unlikely that this will happen by 2020 without a step-change in deployment rates.
While not necessarily reflected in the deployment of commissioned projects, a number of countries have made progress in development and construction of offshore wind farms. This is the case in Germany, where activity has kicked off since problems with fi-nancing grid connections were resolved.
The UK is currently the largest offshore wind market, but is undergoing a fundamental review of its electric-ity market. Sponsors may delay projects until they have clarity about how the new market will operate in 2014 and a clearer understanding of how the new mechanisms will work in practice. The UK is likely to see a slowdown in deployment during this transitional period that could last into 2017, which could affect whether the UK meets its targets.
© J
an O
elke
r
16 Where's the money coming from? - Financing offshore wind farms
4 Average installation costs would be in the range of €2.6 m/MW – €3.6 m/MW for the period 2013-2020
Chapter 1: Introduction
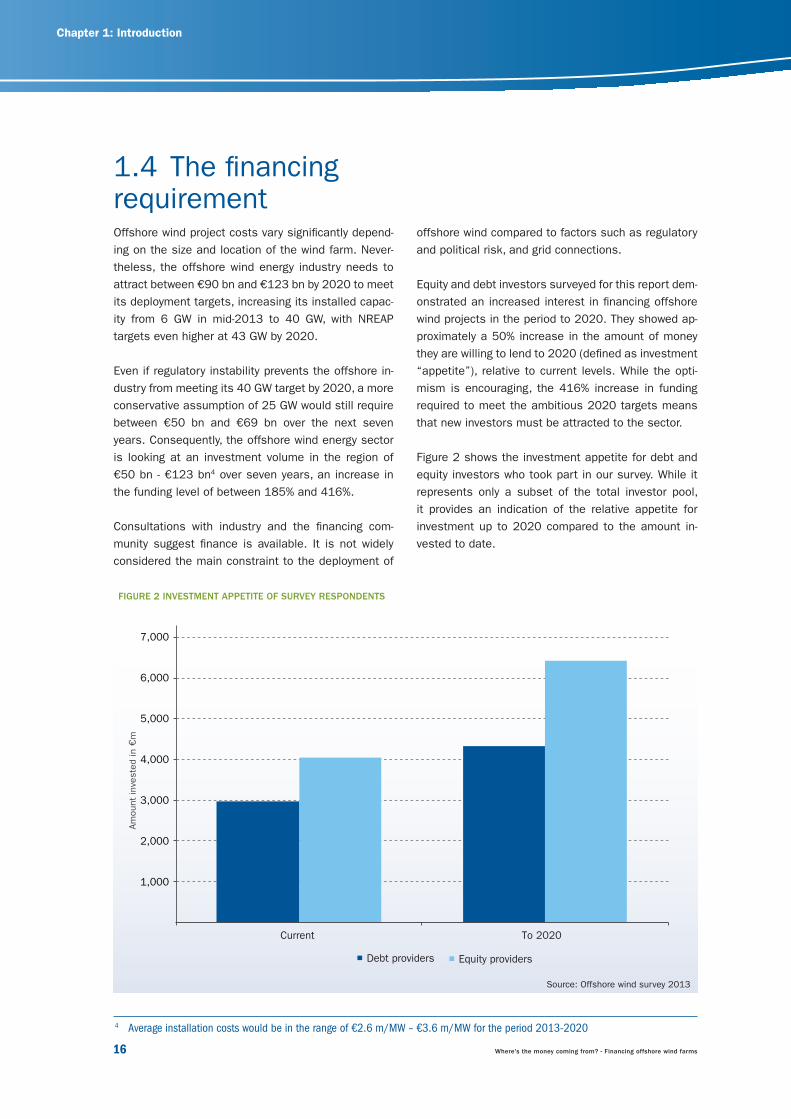
FIGURE 2 INVESTMENT APPETITE OF SURVEY RESPONDENTS
Source: Offshore wind survey 2013
Debt providers Equity providers
1,000
2,000
3,000
4,000
5,000
6,000
7,000
Current To 2020
Amou
nt in
vest
ed in
m
1.4 The financing requirementOffshore wind project costs vary significantly depend-ing on the size and location of the wind farm. Never-theless, the offshore wind energy industry needs to attract between €90 bn and €123 bn by 2020 to meet its deployment targets, increasing its installed capac-ity from 6 GW in mid-2013 to 40 GW, with NREAP targets even higher at 43 GW by 2020.
Even if regulatory instability prevents the offshore in-dustry from meeting its 40 GW target by 2020, a more conservative assumption of 25 GW would still require between €50 bn and €69 bn over the next seven years. Consequently, the offshore wind energy sector is looking at an investment volume in the region of €50 bn - €123 bn4 over seven years, an increase in the funding level of between 185% and 416%.
Consultations with industry and the financing com-munity suggest finance is available. It is not widely considered the main constraint to the deployment of
offshore wind compared to factors such as regulatory and political risk, and grid connections.
Equity and debt investors surveyed for this report dem-onstrated an increased interest in financing offshore wind projects in the period to 2020. They showed ap-proximately a 50% increase in the amount of money they are willing to lend to 2020 (defined as investment “appetite”), relative to current levels. While the opti-mism is encouraging, the 416% increase in funding required to meet the ambitious 2020 targets means that new investors must be attracted to the sector.
Figure 2 shows the investment appetite for debt and equity investors who took part in our survey. While it represents only a subset of the total investor pool, it provides an indication of the relative appetite for investment up to 2020 compared to the amount in-vested to date.
Where's the money coming from? - Financing offshore wind farms 17
The report reflects the views of offshore wind industry and financiers, gathered through a web based survey and in-depth interviews. The report highlights the dif-ferences in perception of these two different actors, shares best practice and innovative approaches to financing offshore wind and outlines steps that can be taken to attract new sources of finance.
Details of the approach and methodology are in Appendix A.
1.5 Purpose and approach of this report Our survey of investors in offshore wind energy in-dicates that three to five times more investment is needed to meet conservative and NREAP deployment targets respectively. This challenge needs to be ad-dressed through industry and finance providers work-ing together to better understand each other’s roles and requirements.
This report considers how the required level of invest-ment can be attracted to the sector and what steps industry can take to meet this funding challenge. It aims to answer the following questions:
1. What is the scale of the financing challenge? 2. What are key lessons learned from the financing
deals that have taken place in the European off-shore wind market to date?
3. What types of funders have invested in offshore wind and why?
4. What can be done to address, manage and mitigate risks of offshore wind projects to attract capital?
5. How can industry and finance providers work to-gether to address this financing challenge?

SOURCES OF FINANCE
Key findings
2.1 Overview of European offshore
2.2 An overview of sources of finance
2.3 Equity investors
2.4 Debt providers
2.5 Funding structure
2.6 Refinancing options
© T
hink
stoc
k
Where's the money coming from? - Financing offshore wind farms 19
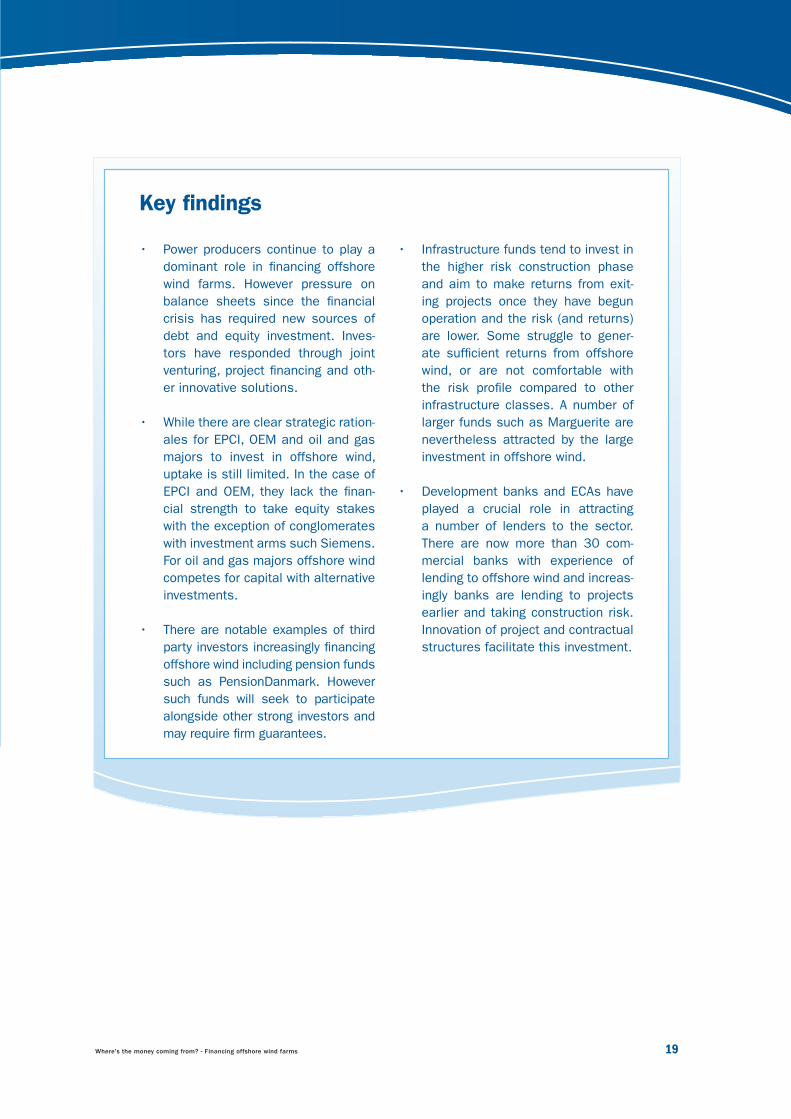
• Power producers continue to play a dominant role in financing offshore wind farms. However pressure on balance sheets since the financial crisis has required new sources of debt and equity investment. Inves-tors have responded through joint venturing, project financing and oth-er innovative solutions.
• While there are clear strategic ration-ales for EPCI, OEM and oil and gas majors to invest in offshore wind, uptake is still limited. In the case of EPCI and OEM, they lack the finan-cial strength to take equity stakes with the exception of conglomerates with investment arms such Siemens. For oil and gas majors offshore wind competes for capital with alternative investments.
• There are notable examples of third party investors increasingly financing offshore wind including pension funds such as PensionDanmark. However such funds will seek to participate alongside other strong investors and may require firm guarantees.
Key findings
• Infrastructure funds tend to invest in the higher risk construction phase and aim to make returns from exit-ing projects once they have begun operation and the risk (and returns) are lower. Some struggle to gener-ate sufficient returns from offshore wind, or are not comfortable with the risk profile compared to other infrastructure classes. A number of larger funds such as Marguerite are nevertheless attracted by the large investment in offshore wind.
• Development banks and ECAs have played a crucial role in attracting a number of lenders to the sector. There are now more than 30 com-mercial banks with experience of lending to offshore wind and increas-ingly banks are lending to projects earlier and taking construction risk. Innovation of project and contractual structures facilitate this investment.

20 Where's the money coming from? - Financing offshore wind farms
5 Assuming an average investment per MW in the range of €2.9 m - €3.9 m.
Chapter 2: Sources of finance
2.1 Overview of European offshore By June 2013, there were 6 GW of offshore wind deployed in Europe. The UK accounted for 57%, fol-lowed by Denmark (21%), Belgium (8%) Germany (6%), Sweden (4%) and the Netherlands (3%)
The investment required to meet this deployment was in the region of €17 bn to €24 bn5. Figure 3 shows the different investors’ participation in offshore wind energy to date. However, the true level of investment will also include lenders providing debt and investors who have sold their participation in projects after the development phase.
FIGURE 3 CUMULATIVE INVESTMENT IN EUROPE TO DATE
Source: EWEA 2013
5
10
15
20
25
Total Investor
Cap
ex in
m
Total Power producers OEM, EPCI
Institutional investors
Oil and gas Specialist developers Cooperative (municipal)
Other
SWF Infrastructure fund
72%
28%

Where's the money coming from? - Financing offshore wind farms 21
2.2 An overview of sources of finance A significant range of investors have played a role in bringing capital to offshore wind. The following sections describe these investors, their investment criteria and the landmarks that have been reached to date. Current equity investor classes in offshore wind projects are shown in Table 3. The chapter also considers the role of debt finance, – both commercial lenders and ECAs – and multilaterals.
TABLE 3 SHARE OF EQUITY INVESTORS IN THE EUROPEAN OFFSHORE WIND SECTOR (JUNE 2013)
Equity investor class Owners of European offshore wind farmsShare of installed offshore wind capacity (June 2013)
Power producers DONG, Vattenfall, E.On, RWE, SSE, Centrica, Statkraft, Eneco, EDF, EWE, EnBW, Pohjolan Voima, Enovos, Nuon, Vindenergi, Stadtwerke Luebeck, Innopower OY, Suomen Hyotytuuli OY, Enova, Repsol, EDP
72%
EPCI contractors BARD, DEME, Siemens, GE, PMV, Principle Power, Vestas, ASM 8%
Institutional investors PensionDanmark, OPW, PKA, Inovcapital 6%
Oil and gas Statoil, Shell (Noordzeewind – 50%), SHV 5%
Cooperative (municipal) Socofe, Nuhma, SRIW, German municipalities, Samso Commune 2%
Corporate investor Colruyt, Mitsubishi corporation, Sumitomo, Sund and Baelt, Ra-bobank, Marubeni Corp
3%
Specialist developers Vindpark Varnen Drift, Nordisk Vindkraftservise 1%
Infrastructure funds Seawind Capital Partners (MeeWind), Marguerite fund 1%
Sovereign wealth fund Masdar 2%
Other SWAY, Floating power plant AS <1%
Source: EWEA, offshore wind survey 2013
22 Where's the money coming from? - Financing offshore wind farms
Chapter 2: Sources of finance
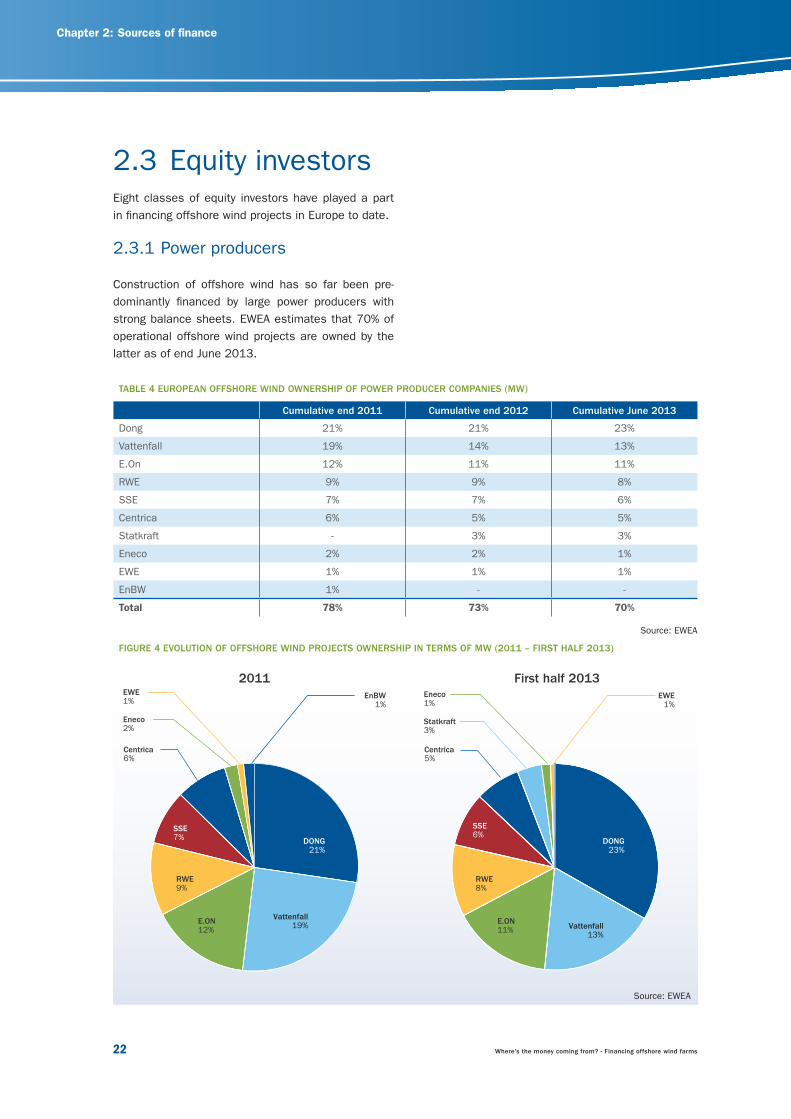
TABLE 4 EUROPEAN OFFSHORE WIND OWNERSHIP OF POWER PRODUCER COMPANIES (MW)
Cumulative end 2011 Cumulative end 2012 Cumulative June 2013
Dong 21% 21% 23%
Vattenfall 19% 14% 13%
E.On 12% 11% 11%
RWE 9% 9% 8%
SSE 7% 7% 6%
Centrica 6% 5% 5%
Statkraft - 3% 3%
Eneco 2% 2% 1%
EWE 1% 1% 1%
EnBW 1% - -
Total 78% 73% 70%
Source: EWEA
2.3 Equity investorsEight classes of equity investors have played a part in financing offshore wind projects in Europe to date.
2.3.1 Power producers
Construction of offshore wind has so far been pre-dominantly financed by large power producers with strong balance sheets. EWEA estimates that 70% of operational offshore wind projects are owned by the latter as of end June 2013.
FIGURE 4 EVOLUTION OF OFFSHORE WIND PROJECTS OWNERSHIP IN TERMS OF MW (2011 – FIRST HALF 2013)
Source: EWEA
DONG21%
Vattenfall19%E.ON
12%
RWE9%
SSE7%
Eneco2%
EWE1%
EnBW1%
Centrica6%
2011
DONG23%
Vattenfall13%
E.ON11%
RWE8%
SSE6%
Statkraft 3%
Eneco1%
EWE1%
Centrica5%
First half 2013

Where's the money coming from? - Financing offshore wind farms 23
• Offshore wind has a higher proportion of the total lifecycle costs spent in initial capex rather than on-going operating costs. As such, renewables encum-ber power producer balance sheets to a higher pro-portion than conventional generation;
• The average size of offshore wind projects in 2002 was just over 150 MW, while in 2012 this was 271 MW. In the medium term, this will increase further. The average size of planned projects is 500 MW. In terms of individual equity investments, the range to date begins at under €20 million (m), to over €100 m in the UK, German and Belgian mar-kets. For individual projects this picture lends itself further to joint venture developments as they are too large in scale for a single power producer;
• Considering the average investment for offshore wind projects ranges from €2.6 m to €3.6 m per MW in the period 2013-2020, this implies that approxi-mately €90 bn to €123 bn is needed to meet the level of 40 GW (EWEA, 2011). This compares with around €12 bn to €16 bn of investment currently tied up on power producer balance sheets. Power producers cannot plug this gap alone.
How can power producers increase their in-vestment in offshore wind?In response to the trend towards larger project sizes, power producers are increasingly developing wind farms in joint ventures (JVs) or multiple equity sponsor projects funded through equity or shareholder loans. Projects with consortia are becoming commonplace. In the UK Round 3, for instance, Forewind – a consor-tium of RWE Npower, SSE, Statkraft and Statoil – was awarded the licence for the Dogger Bank zone, the largest project of the licensing round.
Partnerships also enable companies to have several projects under development, or under construction at the same time in different markets, which helps spread their risk and exposure to regulatory risk in individual countries.
Power producers are also increasingly exiting projects during the development lifecycle to partially free up balance sheets.
Power producers’ share of ownership of offshore ca-pacity in Europe decreased by 8% in the past two and a half years. In 2011, 78% of the capacity installed was owned by big power producers, whereas as of June 2013 they owned and operated 70% of total capacity. This reduction could indicate that an increas-ing number of players are entering the offshore wind energy sector.
There is a clear rationale for power producers to devel-op, construct and operate generation assets. They sell the power they generate through their retail business to end customers. Their business model of operating right across the value chain from generation to retail or trading operations means that they are able to oper-ate more cost effectively than smaller companies who only operate in part of the chain.
As with other generators and depending on the local market, they may also benefit by meeting any obliga-tions for renewable generation placed on them. This model of vertical integration drives clear synergies and provides a competitive advantage.
In addition to the strategic rationale for investment, power producers are able to finance wind farms using their own cash reserves or corporate finance (such as bank debt with recourse against the entire company and not just the specific offshore wind project). They can do this due to their large balance sheets and rela-tive financial strength. These factors mean that the cost of capital at which they fund new investments is in the region of 8-10%. This sets their return require-ments for investing in offshore wind.
However, this model currently suffers from a number of threats and constraints:
• Since the financial and Eurozone crisis, power pro-ducers have suffered credit rating downgrades due to increased liabilities on their balance sheets set against pressure on earnings. This in turn leads to an increase in the cost of financing their business, resulting in a constraint to their ability to continue to invest;

24 Where's the money coming from? - Financing offshore wind farms
Chapter 2: Sources of finance
• BARD has been the most active investor in offshore wind projects to date, currently owning 3% of cumu-lative installed capacity in Europe and supplying 3% of turbine capacity. However BARD suffered financial difficulties and was forced to restructure and dispose of holdings in offshore wind farms. This highlights the difficulties of contractors investing in projects.
2.3.3 Oil and gas
The obvious synergies in construction capabilities and the complexity of operating offshore has meant that a number of oil and gas companies have played a part in offshore wind project development. They are often asset heavy entities with experience in investing in large scale infrastructure.
Oil and gas companies have the balance sheet ca-pacity to invest through corporate funding with cost of capital in the range of 10% to 15%. Their offshore experience may lend itself to holding investments through operations. However, they will typically invest in the form of joint ventures to limit exposure to a project.
Constraints on company balance sheets since 2008 potentially limit funds available for developing new projects. This raises the need to team up with power producers or other equity providers for the develop-ment and construction of new wind farm projects. Statoil, Statkraft and the power producers RWE Innogy and SSE have teamed up as the consortium Forewind in order to develop the Dogger Bank Wind Farm, which has 9.6 GW of potential capacity.
Shell entered the offshore wind market, but exited because alternative investment opportunities gener-ated higher returns, with risk profiles that were better understood.
2.3.4 Independent developers
Although independent developers lack the competi-tive advantages of power producers – balance sheet strength and vertical integration – their need for capital can act as a conduit for new entrants into the sector. This often brings experience of financing projects and, as such, financial innovation.
2.3.2 EPCI contractors
The strategic rationale for Engineering, Procurement, Construction and Installation (EPCI) contractors and wind turbine manufacturers (Original Equipment Manu-facturers or OEM) to invest in offshore wind projects is clearly aligned to their business model – to earn mar-gins on installation, manufacture and maintenance. Investment can be a critical differentiator in being awarded contracts and is therefore important to the success of their business.
However, OEM and EPCI contractors are relatively as-set light in comparison to power producers, who have manufacturing, plant and working capital on their bal-ance sheets. This means that they have far less finan-cial strength to provide corporate finance to projects. Their cost of financing their business and, therefore, return requirement on any investment will be higher: in the region of 12-15%.
Furthermore, many EPCI and OEM contractors have suffered significantly during the global financial crisis, increasing their cost of capital. A number have also been victim of insolvencies such as Subocean – which caused expensive delays to the Greater Gabbard wind farm in the UK – and restructurings such as BARD.
There are high barriers to entry for the supply chain in offshore wind due to the importance of reputation and using proven technologies. This is evidenced by the dominance of Siemens (supplying turbines for 65% of the total installed capacity in the European market) and Vestas.
EPCI and OEM contractors would traditionally limit involvement to finance construction of projects, to facilitate winning contracts. However larger engineer-ing companies such as Siemens also have separate capital units that may provide longer term capital inde-pendently of corporate aims.
• Siemens’ private equity arm, Siemens Project Ven-tures, is an active investment vehicle in offshore wind. Its investments place Siemens in a strong posi-tion to provide more of its turbines and maintenance services to offshore wind projects. An example of Sie-mens’ investments is its €225 m equity contribution to the 270 MW Lincs Offshore wind farm.
Where's the money coming from? - Financing offshore wind farms 25
for investment in non-investment grade assets, insti-tutions are increasingly seeking alternative forms of investment, such as infrastructure.
Offshore wind can be attractive for institutional investments:
• Large scale investment. Institutions will typically manage very large funds, in the scale of billions, rather than millions. Their operating model and the cost of diligence and managing individual invest-ments mean that concluding fewer, larger deals is more efficient than concluding many smaller ones.
• Long term investment. As people pay into pension and life insurance funds over a long period, manag-ers will need to make a return for the long term – until investees have retired. Revenues from offshore wind are typically paid out over 20 to 25 years or more. This provides a good match for the long term liabilities of institutional funds.
• Annuity investment. While there is some variability in annual revenues due to project risks, projects will pay out profits each year, showing a steady return on investment or yield.
However, there are characteristics of offshore wind projects that result in risks that institutional inves-tors are not willing to accept or require mitigation to a greater extent than other investors. They include construction, technology, power price, variability of wind speeds and unknown operating and maintenance risks. This means that unlike less risky infrastructure projects, institutions are hesitant to take project or construction risks in offshore wind. They require guar-antees to cover these risks and there are currently a limited number of institutions investing in the sector.
Institutional investors can, however, make long term commitments to hold projects throughout their oper-ating life, with a low cost of capital in the region of 6%-12%, provided guarantees are available.
• PensionDanmark owns a 30% stake in the 400 MW Anholt offshore wind farm, which became operation-al in early 2013 and is Denmark’s largest offshore wind project. DONG, the project sponsor, guaranteed construction risk.
• PensionDanmark has also committed to providing more than €90 m of debt to the Belgian Northwind offshore project and the Danish ECA EKF is wrap-ping the loan.
The lack of balance sheet strength raises cost of capital for investing in around 10-20% for offshore wind projects. They are financed through the develop-ment stages, but investors typically require third party finance or the sale of consented projects to power producers to finance construction, even if they hold a stake in the project during construction.
Independent developers can leverage their renewables experience to attract equity from new providers who have the capital but not necessarily the experience, as evidenced by the recent financial close of wpd’s 288 MW Butendiek offshore wind project. Infrastruc-ture funds, pension funds and EPCIs were heavily in-volved in providing the project’s equity. This illustrates the increasing need and capability of independent developers to source additional capital – wpd contrib-uted less than 10% of the project’s overall equity.
Key players such as Mainstream Renewable Power, War-wick Energy and SeaEnergy have played an important role in the development of offshore wind and continue to do so. Mainstream Renewable Power is aiming to finalise the funding of its Neart na Gaoithe 450 MW Off-shore Wind Farm off the coast of Scotland in 2013. It recently signed a corporate loan facility with Macquarie infrastructure fund for €60 m to provide funds for the development of projects including Neart na Gaoithe.
2.3.5 Institutional investors
Institutional investors comprise pension, insurance and life funds. They make investments over the long term in order to meet their defined liabilities which are realised when investors need to claim their pen-sion or insurance. Given their nature, investment or fund managers are highly risk adverse and low risk infrastructure assets can be attractive investments.
Institutions also require investments that will gener-ate sufficient long term, low risk yields. They tradition-ally placed capital in investment grade corporate or government bonds. Since the global financial crisis, base interest rates are low and there have been a sig-nificant number of sovereign and corporate downgrad-ings. This results in lower yields and fewer options for strong investment grade products. Although they will typically be constrained in their capital allocations
26 Where's the money coming from? - Financing offshore wind farms
and the GIB, each with a ticket of around €54.7 m. It is believed that the loan has no direct security against project assets or contracts. This is the first time European commercial banks have taken such a risk. The loan also constitutes the GIB’s first invest-ment in offshore wind.
• PGGM, through its investment vehicle OPW, had a joint 24.8% stake in the UK’s Walney offshore wind farm (held jointly with the Ampere equity fund). How-ever, in late 2012 PGGM and Ampere re-financed their stake with a term loan from four commercial lenders (Lloyds, RBS, Santander and Siemens Bank)
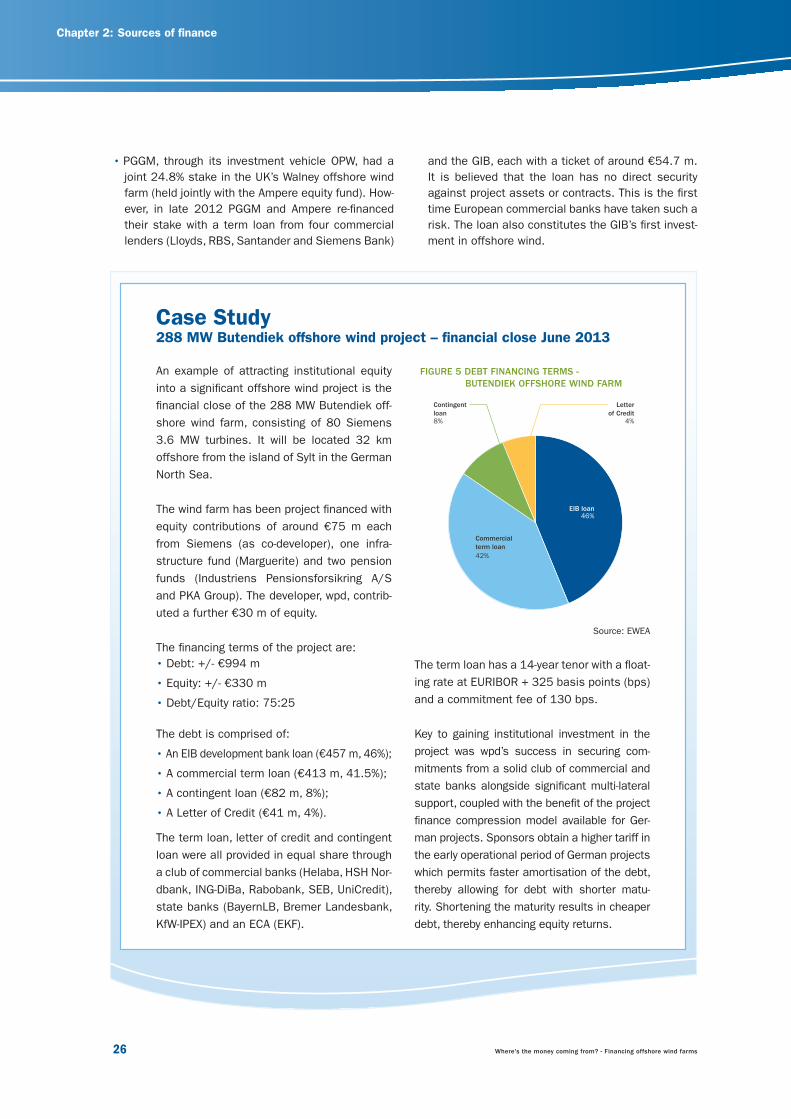
An example of attracting institutional equity into a significant offshore wind project is the financial close of the 288 MW Butendiek off-shore wind farm, consisting of 80 Siemens 3.6 MW turbines. It will be located 32 km offshore from the island of Sylt in the German North Sea.
The wind farm has been project financed with equity contributions of around €75 m each from Siemens (as co-developer), one infra-structure fund (Marguerite) and two pension funds (Industriens Pensionsforsikring A/S and PKA Group). The developer, wpd, contrib-uted a further €30 m of equity.
The financing terms of the project are:• Debt: +/- €994 m
• Equity: +/- €330 m
• Debt/Equity ratio: 75:25
The debt is comprised of:
• An EIB development bank loan (€457 m, 46%);
• A commercial term loan (€413 m, 41.5%);
• A contingent loan (€82 m, 8%);
• A Letter of Credit (€41 m, 4%).
The term loan, letter of credit and contingent loan were all provided in equal share through a club of commercial banks (Helaba, HSH Nor-dbank, ING-DiBa, Rabobank, SEB, UniCredit), state banks (BayernLB, Bremer Landesbank, KfW-IPEX) and an ECA (EKF).
Case Study288 MW Butendiek offshore wind project – financial close June 2013
FIGURE 5 DEBT FINANCING TERMS - BUTENDIEK OFFSHORE WIND FARM
Source: EWEA
The term loan has a 14-year tenor with a float-ing rate at EURIBOR + 325 basis points (bps) and a commitment fee of 130 bps.
Key to gaining institutional investment in the project was wpd’s success in securing com-mitments from a solid club of commercial and state banks alongside significant multi-lateral support, coupled with the benefit of the project finance compression model available for Ger-man projects. Sponsors obtain a higher tariff in the early operational period of German projects which permits faster amortisation of the debt, thereby allowing for debt with shorter matu-rity. Shortening the maturity results in cheaper debt, thereby enhancing equity returns.
Chapter 2: Sources of finance
EIB loan46%
Commercialterm loan42%
Contingent loan8%
Letterof Credit
4%

Where's the money coming from? - Financing offshore wind farms 27
2.3.7 Infrastructure funds
Infrastructure funds are typically specialist intermedi-aries that manage funds on behalf of other investors with specific skills in making investments in infrastruc-ture such as the Maquarie and Ampere funds. Their model is typically to take construction risk and benefit from selling projects to investors at a lower cost of capital once the project has some operating history and is a lower risk investment. As they benefit from this arbitrage, they will typically require investment returns in the region of 10-15%.
The scale of investment achievable with offshore wind projects in comparison to other renewable energy investments is starting to attract some of the large infrastructure funds. However, the sector must provide investment opportunities with sufficient returns as it is in direct competition with other infrastructure classes.
2.3.6 Corporate investors
Many large, energy intensive corporates have started exploring direct investment in offshore wind assets in-cluding Lego and the Oticon foundation which acquired 33% and 18% respectively of Dong Energy's 277 MW Borkum Riffgrund.
Such investments can have the benefit of providing:
• Security over their energy supply;
• Long-term price stability for budgeting purposes;
• Positive impact on brand and PR.
As their investment is driven by a requirement to own green power, corporates will typically invest in projects during construction or operation and seek to hold their investment. Corporates will invest using their cash reserves or corporate financing and their appraisal for any investment will be made at their corporate weighted average cost of capital (WACC), which will vary depending on the company or sector.
In 2012, the Belgian retail corporation Colruyt formed a JV with the developer Aspiravi and reached financial close on the 216 MW (€750 bn) Northwind offshore project in Belgium. Equity of €241 m was provided by the JV in a 2/3 (Colruyt) to 1/3 (Aspiravi) split. Debt of €615 m was secured by the sponsors from a diverse combination of sources, illustrating the growing ap-petite for offshore wind and the scale of potentially available capital:
• An export credit agency (ECA), EKF, wrapped loan of €182 m (29.6% of total debt) in equal share from PensionDanmark and KfW;
• Two term loans (17 year tenors) totalling €156 m (25.4%) in equal share from five commercial banks ING, ASN, BNP Paribas, Rabobank and Belfius;
• A European Investment Bank (EIB) facility of €124.5 m (20.2%);
• A direct loan of €93 m (15.1%) from the insurance company ONDD;
• A facility from the ECA GIEK of €33 m (5.4%);
• Two loans (bridge loan and working capital loan) of €9 m (1.5%) each from Rabobank.
FIGURE 6 DEBT STRUCTURE OF NORTHWIND OFFSHORE WIND FARM
Source: EWEA
ECA GIEK facility5%
Bridge loan1%
Working loan1%
Direct loan16%
EIB facility21%
Terms loan26%
ECA EKF loan30%

28 Where's the money coming from? - Financing offshore wind farms
Chapter 2: Sources of finance
2.3.8 Sovereign wealth funds
Sovereign wealth funds have historically kept their distance from offshore wind. This is due to the scale of investment required in what would constitute a new sector for them, exacerbating the risk they expose themselves to. However, as they are state owned in-vestment funds, their cost of funds is typically low and they have sizeable pots of capital to invest.
Abu Dhabi’s state renewables developer Masdar has taken a 20% stake in the €2.4 bn, 630 MW first phase of the world’s largest offshore wind farm, the London Array. This investment was the first of other SWFs following suit and making investments in the sector.
The Marguerite Infrastructure Fund aims at equity investments totalling €1.5 billion by 2016. Its first investment was the acquisition of a 9% stake in the Belgian 325 MW Thorntonbank offshore wind project from EDF Energies Nouvelles in 2011. Marguerite acquired 49.9% of EDF’s initial stake in the project, illustrating the potential for infrastructure funds’ ap-petite for operational risk in offshore wind.
Its recent equity contribution of €75 m to the 288 MW Butendiek offshore wind farm demonstrates that the Marguerite Fund has evolved its investment criteria and is now open to taking construction risk too.
FIGURE 7 REQUIRED RETURN ON INVESTMENTS FROM DIFFERENT EQUITY PROVIDERS
Source: Offshore wind survey 2013
5% 7% 9% 11% 13% 15% 17% 19% 21%
Return on equity
Powerproducers
EPCIcontractors
Oil & gascompanies
Independentdevelopers
Institutionalinvestors
Infrastructurefunds

Where's the money coming from? - Financing offshore wind farms 29
Equity providers in the project finance model will be a power producer funding all of the equity or a devel-oper with a number of additional third party capital contributors.
This section considers the drivers for investment, role, typical terms and examples.
2.4.1 Commercial lenders
Commercial banks have been providing project finance to infrastructure projects since the late 1990s. A sig-nificant amount of capital has been lent to offshore wind by a vast number of major commercial banks.
2.4 Debt providersFunding construction through project finance typically involves raising substantially more debt than equity. Our analysis indicates that typical debt to equity ratio for offshore wind is around 75%:25%.
The debt will generally come from a variety of sources including commercial banks, state banks (such as KfW), multi-laterals (such as the EIB), and export cred-it agencies. The key characteristic of project finance debt is that in the event of default, recourse is against the specific offshore wind project and not against the entities raising the debt (such as power producers or other developers). Therefore, the pricing and structur-ing of the debt takes account of the forecast cash flows of the asset.
TABLE 5 COMMERCIAL DEBT PROVIDERS TO OFFSHORE WIND
Bank Home market Stage of lending Example projects with location
National Australia Bank Australia Operation Lynn and Inner Dowsing
Belfius (formerly Dexia) Belgium Construction stage Northwind, Thornton Bank (Phases 2 & 3)
BNP Paribas France Construction, Operation Lincs, Northwind, Lynn and Inner Dowsing
Crédit Agricole CIB France Operation Lynn and Inner Dowsing
Natixis France Construction Global Tech
Société Générae S.A. France Construction Global Tech, Thornton Bank Phases 2&3
LBBW Germany Construction Baltic 1
BayernLB Germany Construction Butendiek
Bremer Landesbank Germany Construction Butendiek
Commerzbank Germany Construction Meerwind
Deutsche Bank Germany Construction Borkum West II
HeLaBa Germany Construction Butendiek
HSH Nordbank Germany Construction Butendiek
Nord/LB Germany Construction Global Tech
SEB Germany Construction Butendiek, Global Tech, Borkum West II
Siemens Financial Services Germany Construction Butendiek, Walney, Meerwind
Bank of Ireland Ireland Operation Lynn and Inner Dowsing wind farms
Unicredit Bank Italy Construction Butendiek
Bank of Tokyo-Mitsubishi UFJ Japan Construction Lincs, Meerwind
Mizuho Corporate Bank Japan Operation Gunfleet Sands
Sumitomo Mitsui Banking Group Japan Operation Gunfleet Sands
ASN Bank Netherlands Construction Bligh Bank Phase I, Northwind
ING Bank N.V. Netherlands Construction Northwind, Butendiek
NIBC Bank N.V. Netherlands Construction, Operation Baltic 1, Global Tech, Borkum West II, Lynn and Inner Dowsing
DNB Bank Norway Construction Lincs
Banco de Sabadell SA Spain Construction Global Tech
Banco Santander Spain Construction and Operation Walney, Lincs
BBVA Spain Operation Lynn and Inner Dowsing
HSBC UK Construction Lincs
Lloyds TSB UK Construction, Operation Lynn and Inner Dowsing, Walney, Lincs, Meerwind
Source: Clean Energy pipeline VB, Infrastructure Journal

30 Where's the money coming from? - Financing offshore wind farms
Chapter 2: Sources of finance
TABLE 6 LENDERS’ APPETITE FOR UNDERWRITING
Appetite for underwriting Proportion of respondents
Yes 25%
Potentially 50%
No 25%
Source: Offshore wind survey 2013
The survey also asked lenders who would consider underwriting how much they would be willing to un-derwrite. This was universally between €100 m and €500 m. By contrast, offshore wind projects are now increasingly in the scale of €1 billion. These results represent a positive signal, however whether sponsors would be willing to accept this remains to be seen.
2.4.2 ECAs and multilaterals
Export Credit Agencies (ECAs), multilateral banks and state development banks are, to an extent, state controlled. They, therefore, typically have investment mandates to provide capital that contributes to do-mestic economic growth. Multilateral and state banks will traditionally look to provide liquidity and capital to projects in their home markets. However, ECAs gener-ally provide guarantees or capital to projects in order to encourage export of products and services from their home market, encouraging domestic economic growth.
Commercial lenders will carry out extensive due diligence on projects before lending. They will look at technical, commercial, legal and financial aspects of the project. They will typically invest term loans for between five to 15 years. There is precedent of com-mercial lenders providing debt pre-construction, during construction and operations. More details on pricing of debt and debt terms can be found in Chapter 4 and in Appendix B.
The scale of projects in offshore wind means that mul-tiple lenders will often need to lend to an individual project. Each lender is not able or willing to lend above a certain amount (ticket size). Our analysis shows that individual banks are currently limiting to €50-150 m investment. Over €50 m implies ECA/multilateral involvement or better yet, guarantee. This highlights one of the issues with investment in offshore wind, particularly as project sizes further increase such as in UK Round 3 projects where wind farm capacity is in excess of 300 MW.
Club lending is more difficult to arrange and more time consuming. During negotiations, terms tend to gravi-tate to those offered by the bank with the most risk adverse view and can, therefore, lead to more restric-tive covenants or more expensive pricing.
Availability of debt financeMacroeconomic factors and liquidity constraints in the banking market curtail both debt funding and the bankability of individual projects. Restrictions on bank balance sheets due to the global financial crisis and introduction of Basel III have increased the amount of risk capital that banks are required to hold, and reduced risk appetite and willingness to lend.
While underwriting has reduced significantly since the credit crunch and the subsequent global financial crisis, the debt providers surveyed showed an appetite for underwriting. Around 75% of surveyed debt provid-ers said they had or potentially have an appetite for underwriting offshore wind projects.
FIGURE 8 CONSTRAINTS TO RAISING DEBT FINANCE
Source: Offshore wind survey 2013
0 1
2
3
4
5
Liquidity
Bankability
Debt treatment
Credit rating
Contracting
Other
Where's the money coming from? - Financing offshore wind farms 31
risk in a number of the projects. KfW’s experience and robust due diligence has undoubtedly contributed to this.
This is particularly relevant in comparison to the UK market, which only set up a state investment bank in 2012. Walney, the GIB’s first offshore wind investment, was also the first UK project to attract institutional investors. The UK market has now seen commercial lenders take construction risk.
Examples of ECAs include the role EKF played in a number of projects including the Dutch project Prinses Amalia (120 MW) where it provided an export finance guarantee to the Mandated Lead Arrangers (MLAs) Dexia (now Belfius) and Rabobank.
The EIB has played a major role in financing offshore wind, having lent an estimated €4.5 bn to offshore projects which includes just under €250 m to the Offshore Transmission Operator (‘OFTO’) regime. The bank has leant to generation projects in Germany, Belgium, Denmark, and the UK. The largest project for EIB to date has been providing €843 m to fund construction of the London Array in the UK.
There are a number of factors that make offshore wind projects a target investment for ECAs and multilaterals:
• Offshore wind development makes a significant con-tribution to growth and jobs;
• Strategic importance towards meeting EU renewable energy and decarbonisation targets;
• The scale and risk profile mean that offshore wind projects have difficulty in attracting commercial fi-nance. The role of ECAs and multilaterals can be an effective facilitator of other investments in off-shore wind.
The investment parameters will typically depend on the investment remit of the organisation, although they will invest throughout the project lifecycle. They may provide guarantees (ECAs), senior capital to other lenders at cheaper rates (EIB), lend through corpo-rates rather than the project (EIB – Thanet) or lend on commercial terms providing liquidity and expertise to the sector (KfW).
The importance of such government lenders is high-lighted by the case of KfW in Germany, where the bank has lent to projects totalling over 1.2 GW of capacity in that country alone. Germany has also been successful in attracting commercial lenders to take construction
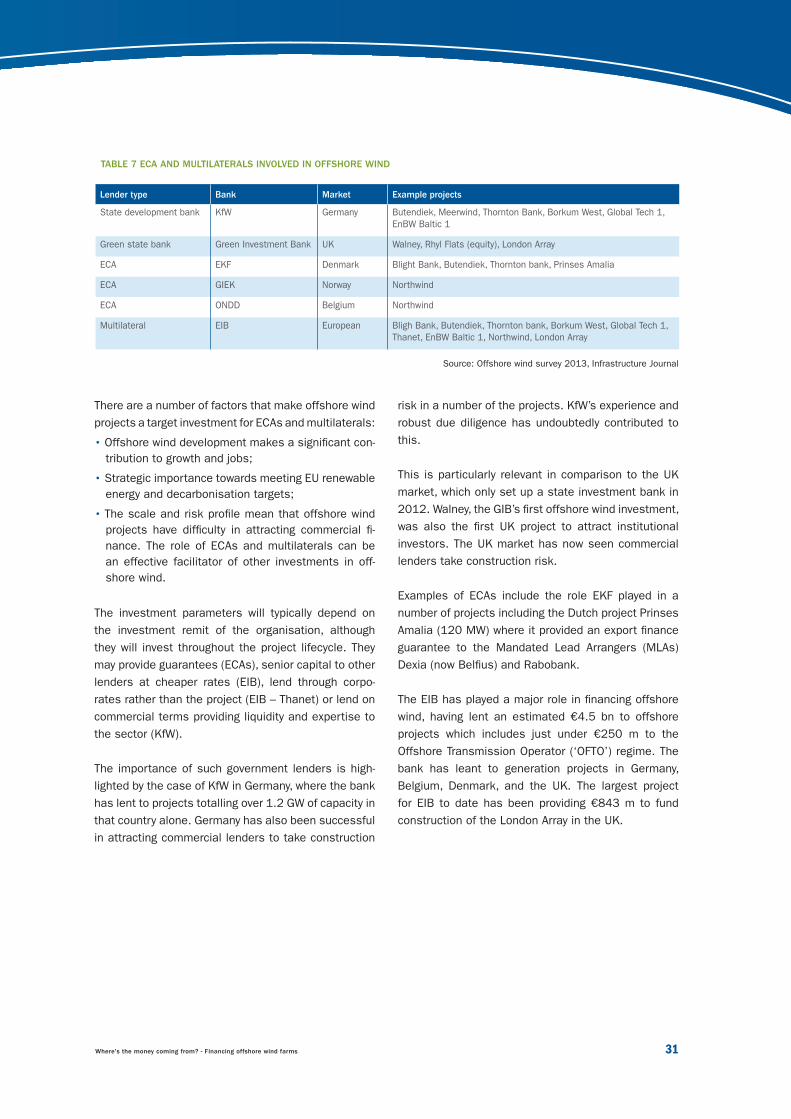
TABLE 7 ECA AND MULTILATERALS INVOLVED IN OFFSHORE WIND
Lender type Bank Market Example projects
State development bank KfW Germany Butendiek, Meerwind, Thornton Bank, Borkum West, Global Tech 1, EnBW Baltic 1
Green state bank Green Investment Bank UK Walney, Rhyl Flats (equity), London Array
ECA EKF Denmark Blight Bank, Butendiek, Thornton bank, Prinses Amalia
ECA GIEK Norway Northwind
ECA ONDD Belgium Northwind
Multilateral EIB European Bligh Bank, Butendiek, Thornton bank, Borkum West, Global Tech 1, Thanet, EnBW Baltic 1, Northwind, London Array
Source: Offshore wind survey 2013, Infrastructure Journal
32 Where's the money coming from? - Financing offshore wind farms
6 Some typical terms of debt instrument are: • Senior debt - the lender will be paid interest and principle repayments from project cash flows first before other lenders. The
debt they provide will have greater security than less senior lenders.• Subordinated loans – subordinated to the senior debt and such associated capital and interest payments will be made after
those to the senior debt holders.• Mezzanine debt - junior to other forms of debt and a hybrid between debt and equity.
Chapter 2: Sources of finance
• The level of certainty of the output (electricity pro-duced) of a project;
• The stage of the project investment, whether the lender taking construction risk has some operat-ing history against which to assess the project performance;
• Guarantees provided.
Various debt structures can be used to allocate risk between different classes of lender. Lenders may pro-vide debt in different tranches with each layer of debt taking different levels of risk or have different rights assigned to the instrument6.
The lenders may also provide facilities other than capital expenditure set aside to fund other borrow-ing requirements. These include working capital and VAT facilities which are provided to fund the shortfall between delays in collecting revenues and the require-ment to pay operating expenses.
2.5 Funding structure The funding structure of projects determines how the debt and equity finance will work together. In broad terms, the gearing will describe the proportion of debt and equity, defined as Debt / (Debt+Equity). However due to the size of offshore wind projects, clubs of multiple lenders will frequently be required. They may individually lend in different proportions.
The level of gearing will typically be restricted by the banks providing debt in a project and will depend on a number of factors including:
• Technology and regulatory risks;
• Project specific risks;
• The level of project cash flows expected to allow debt repayments in comparison to the level of inter-est and principal repayments required (cover ratios);
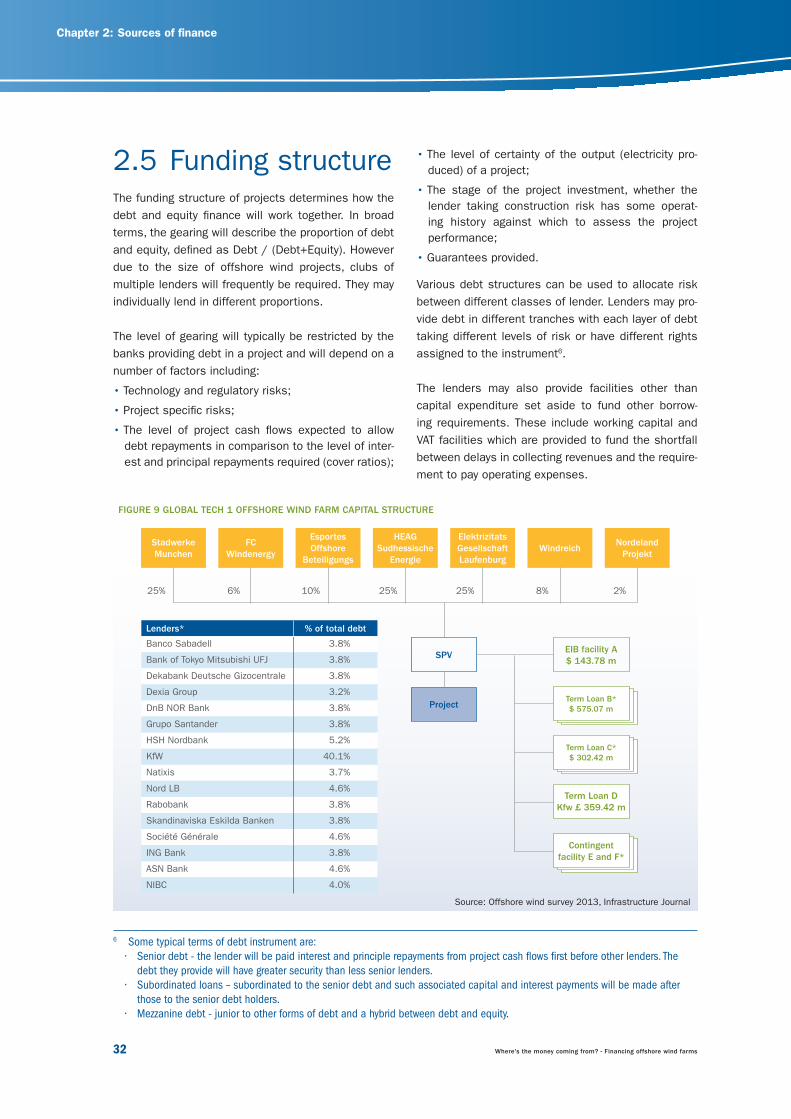
FIGURE 9 GLOBAL TECH 1 OFFSHORE WIND FARM CAPITAL STRUCTURE
Source: Offshore wind survey 2013, Infrastructure Journal
Lenders* % of total debt
Banco Sabadell 3.8%
Bank of Tokyo Mitsubishi UFJ 3.8%
Dekabank Deutsche Gizocentrale 3.8%
Dexia Group 3.2%
DnB NOR Bank 3.8%
Grupo Santander 3.8%
HSH Nordbank 5.2%
KfW 40.1%
Natixis 3.7%
Nord LB 4.6%
Rabobank 3.8%
Skandinaviska Eskilda Banken 3.8%
Société Générale 4.6%
ING Bank 3.8%
ASN Bank 4.6%
NIBC 4.0%
Stadwerke Munchen
Esportes Offshore
BeteiligungsWindreich
FC Windenergy
Elektrizitats Gesellschaft Laufenburg
SPVEIB facility A$ 143.78 m
Term Loan B*$ 575.07 m
Term Loan C*$ 302.42 m
Term Loan DKfw £ 359.42 m
Contingent facility E and F*
Project
HEAG Sudhessische
Energie
Nordeland Projekt
25% 10% 8%6% 25%25% 2%

Where's the money coming from? - Financing offshore wind farms 33
2.5.1 Project structuring
A range of funding structures can be applied in differ-ent projects and used for commercial, financial and tax reasons to make the projects more attractive to potential investors.
Surveyed lenders have an overwhelming preference for traditional Special Purpose Vehicle (SPV) structures. However there is an indication of minimal use of unin-corporated Joint Ventures in the UK and Germany and Minority Holdcos in Denmark and the Netherlands.
An example of a project structure with a number of tranches of debt is Global Tech 1. It required around €1 bn of borrowing with the EIB providing €500 m and contributions from another sixteen commercial banks. The complexity of the structure enables the different lenders to take different exposure to risks and provide price and debt terms accordingly.
In terms of the overall proportion of debt to equity, our survey requested views of debt providers on project gearing. Currently, 86% of offshore wind projects were limited to a gearing bracket of 60% to 70%. However, lenders’ expectations are that they will increasingly provide debt to projects at gearing levels over 70% in the period to 2020. Also, the proportion of gearing that lenders will typically lend to a project is expected to change throughout the project lifecycle as the risk of the project changes. Further details of project gear-ing can be found in Appendix B.
FIGURE 10 CURRENT PREFERRED PROJECT FINANCE STRUCTURES
Source: Offshore wind survey 2013 Note: Responses that are ‘non country specific’ are given where respondents do not have differential views on specific markets.
5
10
15
20
25
30
35
40
Traditional SPV Unincorporated JV Minority Holdco Don't know
Num
ber
of r
espo
ndan
ts
Non country speci�c UK Germany France Belgium Denmark Netherlands Poland Ireland
34 Where's the money coming from? - Financing offshore wind farms
Chapter 2: Sources of finance
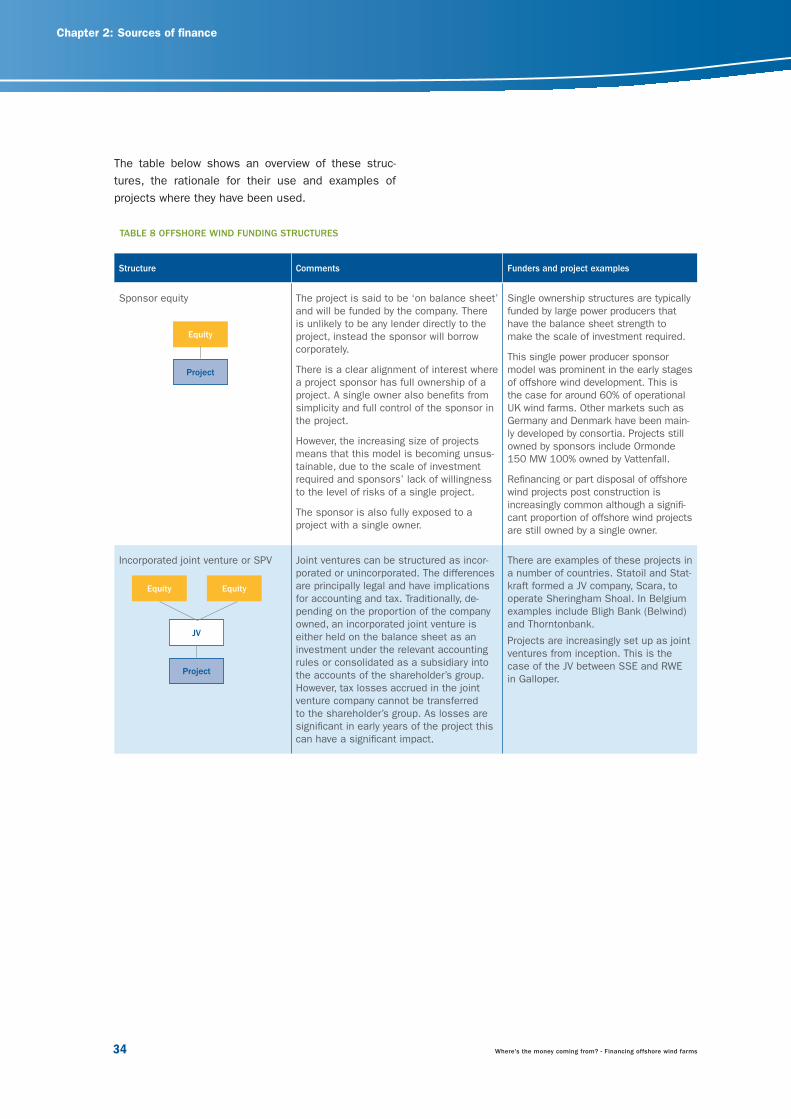
TABLE 8 OFFSHORE WIND FUNDING STRUCTURES
Structure Comments Funders and project examples
Sponsor equity The project is said to be ‘on balance sheet’ and will be funded by the company. There is unlikely to be any lender directly to the project, instead the sponsor will borrow corporately.
There is a clear alignment of interest where a project sponsor has full ownership of a project. A single owner also benefits from simplicity and full control of the sponsor in the project.
However, the increasing size of projects means that this model is becoming unsus-tainable, due to the scale of investment required and sponsors’ lack of willingness to the level of risks of a single project.
The sponsor is also fully exposed to a project with a single owner.
Single ownership structures are typically funded by large power producers that have the balance sheet strength to make the scale of investment required.
This single power producer sponsor model was prominent in the early stages of offshore wind development. This is the case for around 60% of operational UK wind farms. Other markets such as Germany and Denmark have been main-ly developed by consortia. Projects still owned by sponsors include Ormonde 150 MW 100% owned by Vattenfall.
Refinancing or part disposal of offshore wind projects post construction is increasingly common although a signifi-cant proportion of offshore wind projects are still owned by a single owner.
Incorporated joint venture or SPV Joint ventures can be structured as incor-porated or unincorporated. The differences are principally legal and have implications for accounting and tax. Traditionally, de-pending on the proportion of the company owned, an incorporated joint venture is either held on the balance sheet as an investment under the relevant accounting rules or consolidated as a subsidiary into the accounts of the shareholder’s group. However, tax losses accrued in the joint venture company cannot be transferred to the shareholder’s group. As losses are significant in early years of the project this can have a significant impact.
There are examples of these projects in a number of countries. Statoil and Stat-kraft formed a JV company, Scara, to operate Sheringham Shoal. In Belgium examples include Bligh Bank (Belwind) and Thorntonbank.
Projects are increasingly set up as joint ventures from inception. This is the case of the JV between SSE and RWE in Galloper.
Equity
Project
Equity Equity
JV
Project
The table below shows an overview of these struc-tures, the rationale for their use and examples of projects where they have been used.
Where's the money coming from? - Financing offshore wind farms 35
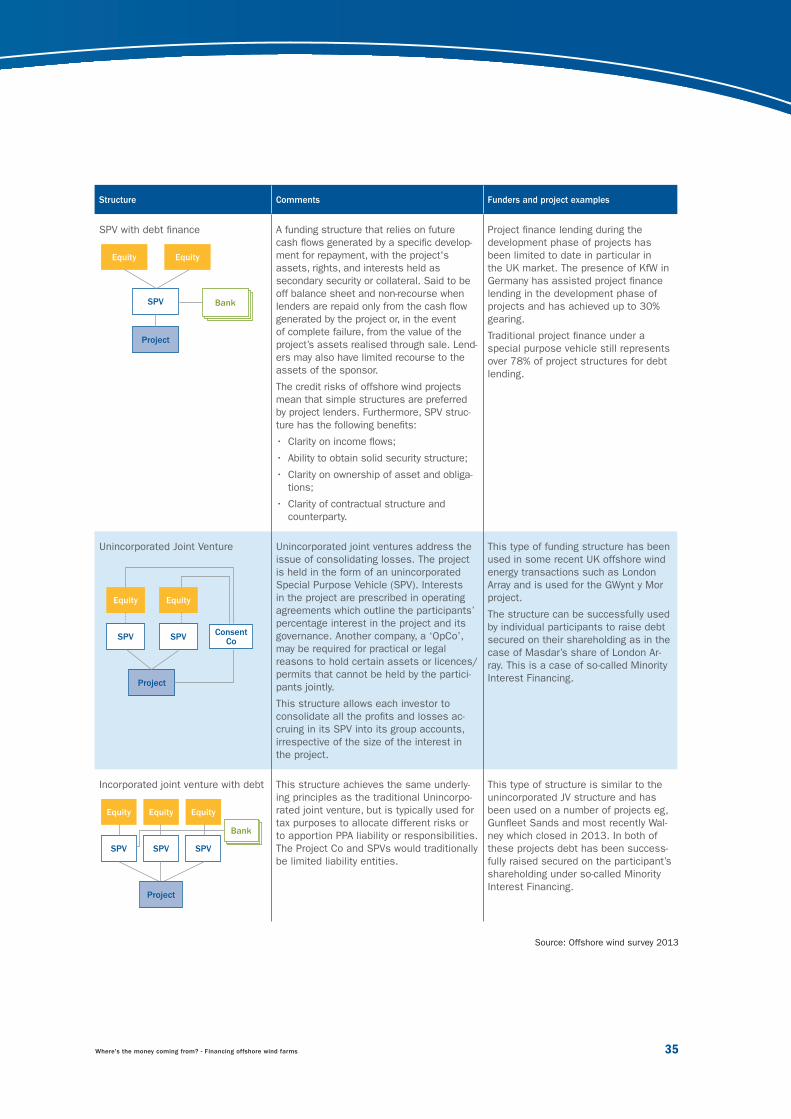
Source: Offshore wind survey 2013
Structure Comments Funders and project examples
SPV with debt finance A funding structure that relies on future cash flows generated by a specific develop-ment for repayment, with the project's assets, rights, and interests held as secondary security or collateral. Said to be off balance sheet and non-recourse when lenders are repaid only from the cash flow generated by the project or, in the event of complete failure, from the value of the project’s assets realised through sale. Lend-ers may also have limited recourse to the assets of the sponsor.
The credit risks of offshore wind projects mean that simple structures are preferred by project lenders. Furthermore, SPV struc-ture has the following benefits:
• Clarity on income flows;
• Ability to obtain solid security structure;
• Clarity on ownership of asset and obliga-tions;
• Clarity of contractual structure and counterparty.
Project finance lending during the development phase of projects has been limited to date in particular in the UK market. The presence of KfW in Germany has assisted project finance lending in the development phase of projects and has achieved up to 30% gearing.
Traditional project finance under a special purpose vehicle still represents over 78% of project structures for debt lending.
Unincorporated Joint Venture Unincorporated joint ventures address the issue of consolidating losses. The project is held in the form of an unincorporated Special Purpose Vehicle (SPV). Interests in the project are prescribed in operating agreements which outline the participants’ percentage interest in the project and its governance. Another company, a ‘OpCo’, may be required for practical or legal reasons to hold certain assets or licences/permits that cannot be held by the partici-pants jointly.
This structure allows each investor to consolidate all the profits and losses ac-cruing in its SPV into its group accounts, irrespective of the size of the interest in the project.
This type of funding structure has been used in some recent UK offshore wind energy transactions such as London Array and is used for the GWynt y Mor project.
The structure can be successfully used by individual participants to raise debt secured on their shareholding as in the case of Masdar’s share of London Ar-ray. This is a case of so-called Minority Interest Financing.
Incorporated joint venture with debt This structure achieves the same underly-ing principles as the traditional Unincorpo-rated joint venture, but is typically used for tax purposes to allocate different risks or to apportion PPA liability or responsibilities. The Project Co and SPVs would traditionally be limited liability entities.
This type of structure is similar to the unincorporated JV structure and has been used on a number of projects eg, Gunfleet Sands and most recently Wal-ney which closed in 2013. In both of these projects debt has been success-fully raised secured on the participant’s shareholding under so-called Minority Interest Financing.
Equity Equity
SPV
Project
Bank
Equity Equity
SPV SPV ConsentCo
Project
Equity Equity Equity
SPV SPV SPV
Project
Bank
36 Where's the money coming from? - Financing offshore wind farms
2.6 Refinancing optionsOffshore wind projects will typically see a number of new investors come into the project during their life-cycle. Refinancing may include a combination of the principal options and a number of different parties investing in a project at different stages of its develop-ment or operation as the risks evolve.
While these funding models have been described as distinct options, financing an offshore wind project will often involve complex combinations of the structures and mechanisms described above.
Chapter 2: Sources of finance
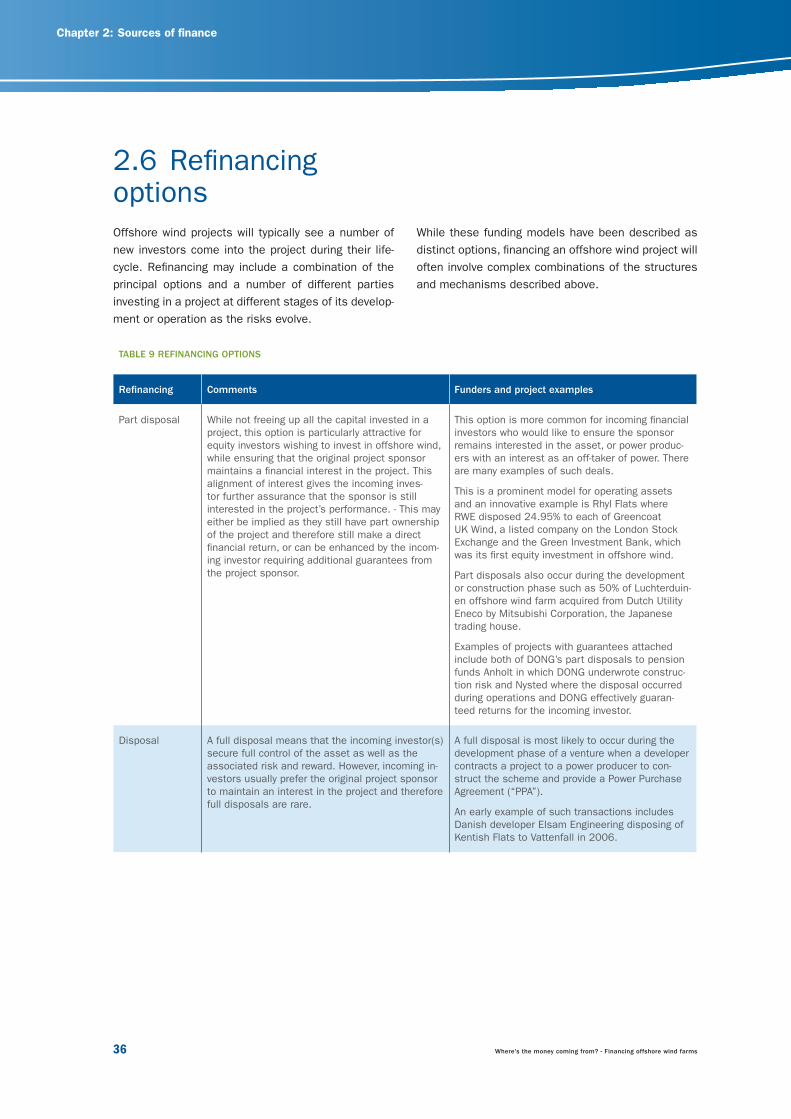
TABLE 9 REFINANCING OPTIONS
Refinancing Comments Funders and project examples
Part disposal While not freeing up all the capital invested in a project, this option is particularly attractive for equity investors wishing to invest in offshore wind, while ensuring that the original project sponsor maintains a financial interest in the project. This alignment of interest gives the incoming inves-tor further assurance that the sponsor is still interested in the project’s performance. - This may either be implied as they still have part ownership of the project and therefore still make a direct financial return, or can be enhanced by the incom-ing investor requiring additional guarantees from the project sponsor.
This option is more common for incoming financial investors who would like to ensure the sponsor remains interested in the asset, or power produc-ers with an interest as an off-taker of power. There are many examples of such deals.
This is a prominent model for operating assets and an innovative example is Rhyl Flats where RWE disposed 24.95% to each of Greencoat UK Wind, a listed company on the London Stock Exchange and the Green Investment Bank, which was its first equity investment in offshore wind.
Part disposals also occur during the development or construction phase such as 50% of Luchterduin-en offshore wind farm acquired from Dutch Utility Eneco by Mitsubishi Corporation, the Japanese trading house.
Examples of projects with guarantees attached include both of DONG’s part disposals to pension funds Anholt in which DONG underwrote construc-tion risk and Nysted where the disposal occurred during operations and DONG effectively guaran-teed returns for the incoming investor.
Disposal A full disposal means that the incoming investor(s) secure full control of the asset as well as the associated risk and reward. However, incoming in-vestors usually prefer the original project sponsor to maintain an interest in the project and therefore full disposals are rare.
A full disposal is most likely to occur during the development phase of a venture when a developer contracts a project to a power producer to con-struct the scheme and provide a Power Purchase Agreement (“PPA”).
An early example of such transactions includes Danish developer Elsam Engineering disposing of Kentish Flats to Vattenfall in 2006.
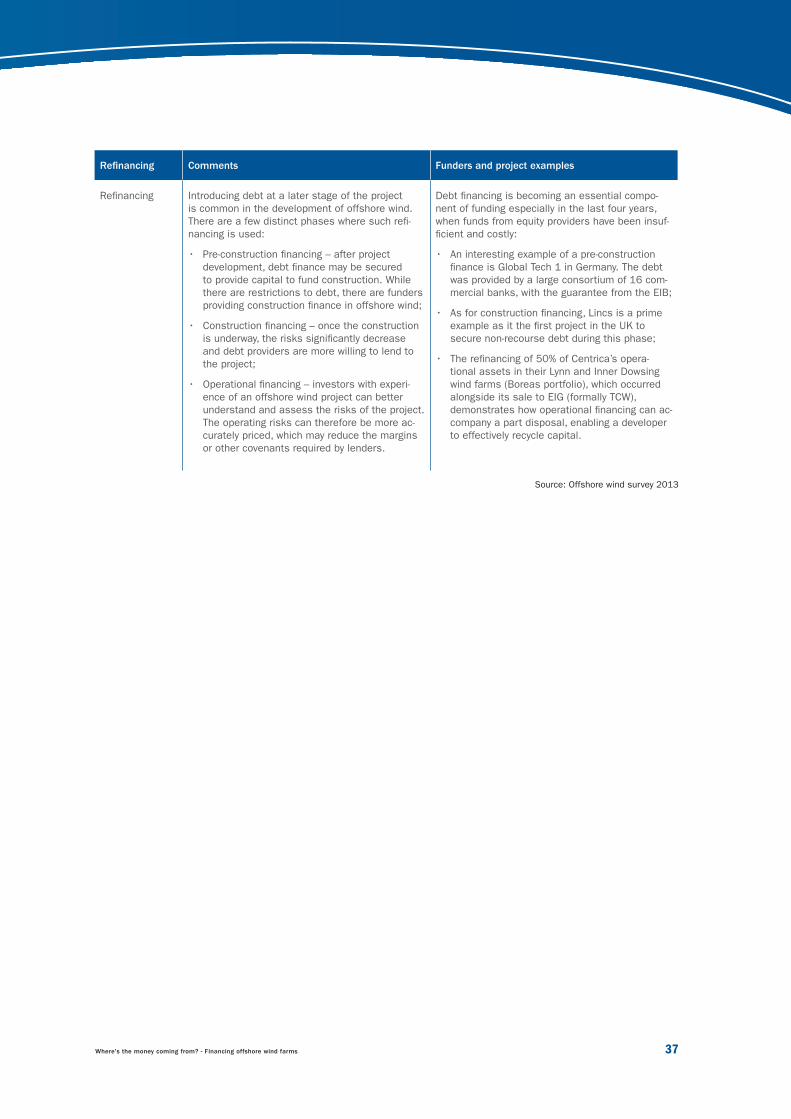
Where's the money coming from? - Financing offshore wind farms 37
Refinancing Comments Funders and project examples
Refinancing Introducing debt at a later stage of the project is common in the development of offshore wind. There are a few distinct phases where such refi-nancing is used:
• Pre-construction financing – after project development, debt finance may be secured to provide capital to fund construction. While there are restrictions to debt, there are funders providing construction finance in offshore wind;
• Construction financing – once the construction is underway, the risks significantly decrease and debt providers are more willing to lend to the project;
• Operational financing – investors with experi-ence of an offshore wind project can better understand and assess the risks of the project. The operating risks can therefore be more ac-curately priced, which may reduce the margins or other covenants required by lenders.
Debt financing is becoming an essential compo-nent of funding especially in the last four years, when funds from equity providers have been insuf-ficient and costly:
• An interesting example of a pre-construction finance is Global Tech 1 in Germany. The debt was provided by a large consortium of 16 com-mercial banks, with the guarantee from the EIB;
• As for construction financing, Lincs is a prime example as it the first project in the UK to secure non-recourse debt during this phase;
• The refinancing of 50% of Centrica’s opera-tional assets in their Lynn and Inner Dowsing wind farms (Boreas portfolio), which occurred alongside its sale to EIG (formally TCW), demonstrates how operational financing can ac-company a part disposal, enabling a developer to effectively recycle capital.
Source: Offshore wind survey 2013

CONTRACTING AND RISKS
Key findings
3.1 Introduction
3.2 Competing for capital with other technologies?
3.3 Key construction risks
3.4 Key operation risks
3.5 Service provider underwriting
© T
hink
stoc
k

Where's the money coming from? - Financing offshore wind farms 39
Among construction risks, grid availabil-ity was the greatest concern to the indus-try. It is seen as one of the most signifi-cant barriers to deployment, particularly in markets where project sponsors are not responsible for grid connection.
The contracting structure and credit qual-ity of suppliers and contractors are also important risks and the sector has suf-fered from a large number of bankrupt-cies which have contributed to project delays. EPCI wraps are frequently dis-cussed as a solution that crucially cov-ers interface risks. However, the depend-ency on one contractor and benefits of multi-contracting such as cost savings along with the flexibility of separate par-ties able to manage risks within their core competencies, prevents this from becoming the norm.
Key findingsIn terms of operating risks, regulatory risk was seen as the most important, highlighting the damage caused by sud-den and at times retroactive adjust-ments to support mechanisms in Euro-pean countries. Issues with performance have affected a number of projects and the ability of warranties to cover these components is still a major concern. Contingency funds can be used as a way of managing this.
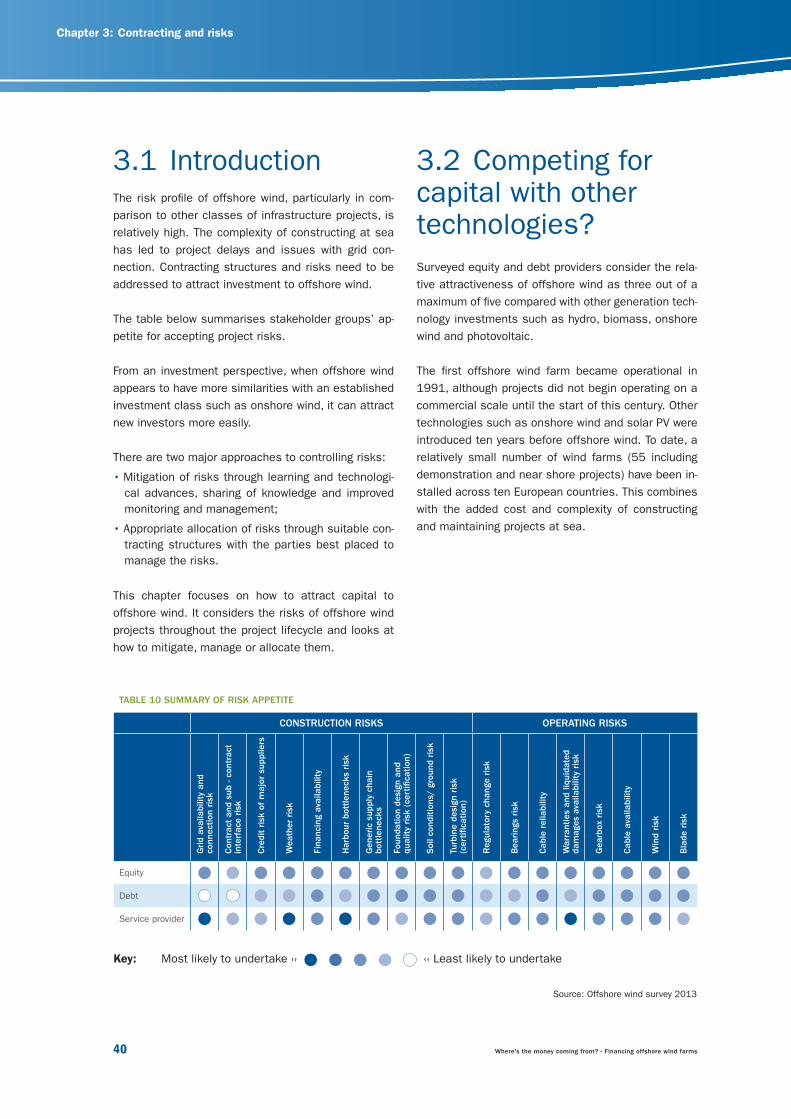
40 Where's the money coming from? - Financing offshore wind farms
3.1 IntroductionThe risk profile of offshore wind, particularly in com-parison to other classes of infrastructure projects, is relatively high. The complexity of constructing at sea has led to project delays and issues with grid con-nection. Contracting structures and risks need to be addressed to attract investment to offshore wind.
The table below summarises stakeholder groups’ ap-petite for accepting project risks.
From an investment perspective, when offshore wind appears to have more similarities with an established investment class such as onshore wind, it can attract new investors more easily.
There are two major approaches to controlling risks:
• Mitigation of risks through learning and technologi-cal advances, sharing of knowledge and improved monitoring and management;
• Appropriate allocation of risks through suitable con-tracting structures with the parties best placed to manage the risks.
This chapter focuses on how to attract capital to offshore wind. It considers the risks of offshore wind projects throughout the project lifecycle and looks at how to mitigate, manage or allocate them.
3.2 Competing for capital with other technologies?Surveyed equity and debt providers consider the rela-tive attractiveness of offshore wind as three out of a maximum of five compared with other generation tech-nology investments such as hydro, biomass, onshore wind and photovoltaic.
The first offshore wind farm became operational in 1991, although projects did not begin operating on a commercial scale until the start of this century. Other technologies such as onshore wind and solar PV were introduced ten years before offshore wind. To date, a relatively small number of wind farms (55 including demonstration and near shore projects) have been in-stalled across ten European countries. This combines with the added cost and complexity of constructing and maintaining projects at sea.
Chapter 3: Contracting and risks
TABLE 10 SUMMARY OF RISK APPETITE
CONSTRUCTION RISKS OPERATING RISKS
Grid
avai
labi
lity
and
conn
ectio
n risk
Con
trac
t an
d su
b - c
ontr
act
inte
rfac
e risk
Cre
dit
risk
of
maj
or s
uppl
iers
Wea
ther
ris
k
Fina
ncin
g av
aila
bilit
y
Har
bour
bot
tlene
cks
risk
Gen
eric
sup
ply
chai
n bo
ttle
neck
s
Foun
datio
n de
sign
and
qu
ality
ris
k (c
ertifi
catio
n)
Soi
l con
ditio
ns/
grou
nd r
isk
Turb
ine
desi
gn r
isk
(cer
tifica
tion)
Reg
ulat
ory
chan
ge r
isk
Bea
ring
s risk
Cab
le r
elia
bilit
y
War
rant
ies
and
liqui
date
d da
mag
es a
vaila
bilit
y risk
Gea
rbox
ris
k
Cab
le a
vaila
bilit
y
Win
d risk
Bla
de r
isk
Equity
Debt
Service provider
Key: Most likely to undertake ›› ‹‹ Least likely to undertake Source: Offshore wind survey 2013

Where's the money coming from? - Financing offshore wind farms 41
Debt providers have a more risk averse perception of technologies than equity providers. What is important for investors is that the risk and return profile of an investment is commensurate. The returns of equity providers are highly sensitive to cost, timing and other project risks, so they are likely to be more averse to untested technologies.
While we can expect technology risk to significantly decrease with time and experience, component
manufacturers and service providers must secure investors‘ confidence to maintain current flows and attract further investment.
Analysis of the survey responses highlighted five risks that are most concerning to equity, debt and service providers. These are shown in the figure 12.
FIGURE 11 RELATIVE ATTRACTIVENESS OF RENEWABLE TECHNOLOGIES COMPARED TO OFFSHORE WIND FARM (OWF)
Source: Offshore wind survey 2013
0.5
1
1.5
2
2.5
3
3.5
4
4.5
5
Solar CSP Solar PV Onshore wind
Hydro-electric
Biomass Tidal energy
Wave energy
Energy from waste
Other
Ran
k
Equity Debt
OWF

42 Where's the money coming from? - Financing offshore wind farms
advance of construction. This can lead to a mismatch between grid infrastructure supply and actual demand at the time of delivery. The consequences are major delays in completion affecting project returns and even potentially revenue (see Section 4.2.1).
As a result, there is widespread concern about grid availability: debt providers take a more risk averse posi-tion, affecting their willingness to accept construction risks. Service providers are much less concerned by grid issues. They are less likely to be financially im-pacted by delays, with limited precedent for investment in projects and separate contracts for grid construction.
In the UK the transitional rounds of the Offshore Transmission Operator (‘OFTO’) regime enable the wind farm sponsors to retain control of grid delivery. Prior to the project being operational the transmission asset must be transferred to a new owner who is granted a licence by Ofgem, the regulator, to own and operate the asset. By categorising the transmission asset as a separate asset class, revenues are based on the availability of the assets, rather than exposed to price or output. The de-risked asset class can ac-cess a larger pool of capital from financial institutions and other investors. This in turn relieves the financial burden of grid delivery and provides developers with the capital to reinvest.
By understanding the risks causing the greatest con-cern to capital providers, potential mitigation strate-gies – and the role of service providers in realising them – can be explored.
3.3 Key construction risksThe construction phase of offshore wind projects is relatively complex. According to stakeholder profiles, the perception of key construction risks is different.
Debt providers and, to a lesser extent equity provid-ers, perceive grid, contracting and suppliers’ credit risks as the most important during the construction phase. Service providers on the other hand are less concerned about grid risks, but perceive foundation design and soil condition risks as more problematic.
3.3.1 Grid availability
Grid availability concerns are prominent where the party delivering grid infrastructure is not the one in charge of connection. This is the case in Belgium and Germany. The considerable lead times often mean that investment decisions on grid are made well in
FIGURE 12 TOP FIVE MOST CONCERNING RISKS
Source: Offshore wind survey 2013
Technology and components
Installation and logistics
Grid connection and availabilitySupplier warranties
and credit
Regulatory change
Chapter 3: Contracting and risks

Where's the money coming from? - Financing offshore wind farms 43
7 http://www.risktec.co.uk/knowledge-bank/technical-articles/de-risking-offshore-wind-power.aspx
reflects the post 2010 trend for larger, broader scope contracts rather than the multi-contracting that was prominent up to 2010.
Installation and logisticsInstallation and logistics are the main construction risks identified by the service providers surveyed. This is reflected in Figure 13, where the soil conditions and foundation design risk were of most concern to service providers. Installation operations and the inherent technology have to withstand increasingly deeper wa-ters as well as constantly changing wave and weather conditions. In addition to reliable weather and ground assessments, the principal way of understanding and mitigating the risks incurred in this process is through experience.
Assessing lessons learnt and formulating best prac-tice can be a key source of competitive advantage. However, not all players in the growing offshore wind industry will have access to this. Therefore this knowledge must be shared to support a successful increase in deployment, as this will ultimately benefit all players.
3.3.2 Supplier risks
Credit strengthOn the supply side, the credit risk of major suppliers continues to be a key consideration. Up to 2011, no offshore wind project was fully completed without a contractor going bankrupt7.
Supplier financial strength determines not only its abil-ity to fulfil the contract, but also the guarantees and warranties if it fails to do so. As new technology is used, supplier guarantees provide an assurance and remedy if the equipment or service does not perform. Lack of sufficient credit strength undermines this.
ContractingContracting presents a complex problem for many projects. Of debt respondents surveyed, 20% stated that they would prefer fewer multi contract structures, whilst 10% of equity investors and sponsors believed that multi contracting was an effective method of reducing costs. This debt provider preference has implications for project sponsors and developers who increasingly seek project financing. The survey
FIGURE 13 CONSTRUCTION RISKS
Source: Offshore wind survey 2013
0.0 0.5 1.0 1.5 2.0 2.5 3.0 3.5 4.0 4.5 5.0
Equity
Ran
k
Debt Service
Grid
ava
ilabi
lity
and
conn
ectio
n ris
k
Con
trac
t an
d su
b - c
ontr
act
inte
rfac
e ris
k
Cre
dit
risk
ofm
ajor
sup
plie
rs
Foun
datio
n de
sign
and
qual
ity r
isk
(cer
ti�ca
tion)
Wea
ther
ris
k
Fina
ncin
g av
aila
bilit
y
Gen
eric
sup
ply
chai
n bo
ttle
neck
s
Har
bour
bot
tle-
neck
s ris
k
Soi
l con
ditio
ns/
grou
nd r
isk
Turb
ine
desi
gnris
k (c
erti�
catio
n)

44 Where's the money coming from? - Financing offshore wind farms
This could be a result of a yield compression model available for German projects that have front-loaded revenue incentives. This provides the sponsor with the ability to re-pay the debt faster, necessitating shorter loan tenors that can incur cheaper margins.
The survey also indicated a 50 bps differential be-tween construction and operating projects providing an indication of the premium incurred during construc-tion. There are also other factors that lenders will con-sider when assessing their pricing expectations. The key factors for investors when considering construc-tion risks are how these are passed on through either guarantees, or full EPCI wraps that manage interface risks, but require strong counterparties.
3.3.3 Financing availability
Financing availability from third parties is less of a concern than other risks. However, this is a micro level conclusion based on experience. Other risks are likely to decrease as industry has a better understanding of how to manage projects. However, financing becomes more of a concern as deployment of offshore wind increases and the balance sheets of power producers become further constrained. The financing require-ment will consequently intensify.
Pricing of construction riskFinance providers will set return margin or return ex-pectations in conjunction with their view of their expo-sure to risks. The survey indicates that debt providers would charge a margin of 300-400 basis points (bpd), regardless of where the project is located. One excep-tion was a respondent who stated they would require a lower margin for a German project, at 250-300 bps.
Chapter 3: Contracting and risks
FIGURE 14 MARGIN RATES DURING CONSTRUCTION
Source: Offshore wind survey 2013
5
10
15
20
25
Num
ber
of r
espo
ndan
ts
Non country speci�c UK Germany France Belgium Denmark Netherlands Poland Ireland
<50 50-100 100-150 150-200 200-250 250-300 300-400 >400
bps

Where's the money coming from? - Financing offshore wind farms 45
wind were not affected and governments have main-tained a commitment to honouring support allocated to a project.
Respondents note that short sighted pricing policies create a high level of uncertainty over the long term economic viability of projects, which affects invest-ment decisions. The impact of regulatory change is to a degree, self-perpetuating. This increases the cost of capital and the general cost associated with the industry, which in turn diverts government support and undermines investor confidence.
The prominence of regulatory change risk has peaked as a result of the global financial crisis, whereby poli-cymakers are continuously forced to assess the effi-ciency of their support to renewable energy. However, where adjustments need to be made, they should be well designed and quickly implemented in a clear time frame.
3.4 Key operation risksDuring the operation phase of a wind farm, regula-tory changes are perceived as the key risk in offshore wind, especially by debt providers. Other technology risks, such as bearing reliability, come in second.
Warranty and damage liquidation risks are also ranked highly by debt providers, but less so by service providers.
3.4.1 Regulatory change risk
Respondents rated regulatory change as the most significant risk during operations. This implies a level of concern over retroactive adjustment of support, al-though it may reflect broader views of regulatory risk. Since the Eurozone crisis, there have been examples of retroactive adjustment of support for renewables, most notably Spain. The main markets for offshore
FIGURE 15 OPERATION RISKS
Source: Offshore wind survey 2013
0.0 0.5 1.0 1.5 2.0 2.5 3.0 3.5 4.0 4.5 5.0
Equity Debt Service
Reg
ulat
ory
chan
ge r
isk
Bea
rings
ris
k
Cab
le r
elia
bilit
y
War
rant
ies
and
liqui
date
d da
mag
es
Gea
rbox
ris
k
Cab
le a
vaila
bilit
y
Win
d ris
k
Bla
de r
isk
Tow
er r
isk
Ran
k

46 Where's the money coming from? - Financing offshore wind farms
8 UK Offshore Wind Market Study, A report by Redpoint Energy Limited in association with GL Garrad Hassan for The Crown Estate, October 2012.
result in sponsors being averse to adopting new tech-nologies and result in slowing learning. This highlights the importance of demonstration sites.
These risks are transferred to some degree to manu-facturers by warranties and liquidated damages risk, as poor or untested technologies are unlikely to attract suf-ficient insurance/cover from suppliers. Consequently, investment in new technologies and the projects using them may be deterred.
In addition to contractual obligations, suppliers can pro-vide more information on testing and operational data to lenders or participate in the ownership structure of the project – for instance via a minority shareholding.
3.4.3 Pricing of operational risk
Debt for the first five years of operations comes at a cheaper margin than for construction, which is not un-expected given the decreased risk. However, this only applies to countries with substantial existing offshore wind projects, such as the UK, Denmark, Belgium and Germany.
Respondents to the survey suggested that projects based in countries such as the Netherlands, Ireland or Poland would incur a higher margin during operations. Regulatory risk is likely to be a key factor in their pricing, as well as track record of existing projects.
Examples of changes in policy include:
• The UK reform of the electricity sector whereby Re-newable Obligations Certificates are being replaced with a Contract for Difference (CfD) tariff, transitioning from 2014 to 2017. The Crown Estate estimates that this may lead to a slowdown in deployment of up to 2 GW around 2017/2018 as developers and inves-tors weigh up the effects of the new regime before adjusting8.
• Germany reviewed feed in tariff levels in 2012 due to increasing costs of offshore wind generation. However tariffs are published up to 2021 to provide some de-gree of clarity over the level of support for an expect-ed year of commissioning. However, grid connection delays can affect the timing of commissioning and despite the compensation allowance, this uncertainty can still impact on projects’ ability to raise finance.
“Policies out to 2030” and “long term stability in pric-ing” are recommendations from surveyed companies for policy makers. It is important to highlight that long term policies do not equate to increased levels of support.
3.4.2 Component risk
Blade, bearings and gearbox risks relate to the overall technology risk of a project. Risks increase when new designs and technologies are developed. The perfor-mance and installation of unproven components can lead to reliability issues and finance providers are likely to take a very conservative view of unknown or unproven risks that they cannot accurately price. This, in turn, may
Chapter 3: Contracting and risks
FIGURE 16 OPERATION - FIRST FIVE YEARS
Source: Offshore wind survey 2013
Num
ber
of r
espo
nden
ts
Non country speci�c UK Germany France Belgium Denmark Netherlands Poland Ireland
<50 50-100 100-150 150-200 200-250 250-300 300-400 >400
2
4
6
8
10
12
14
bps
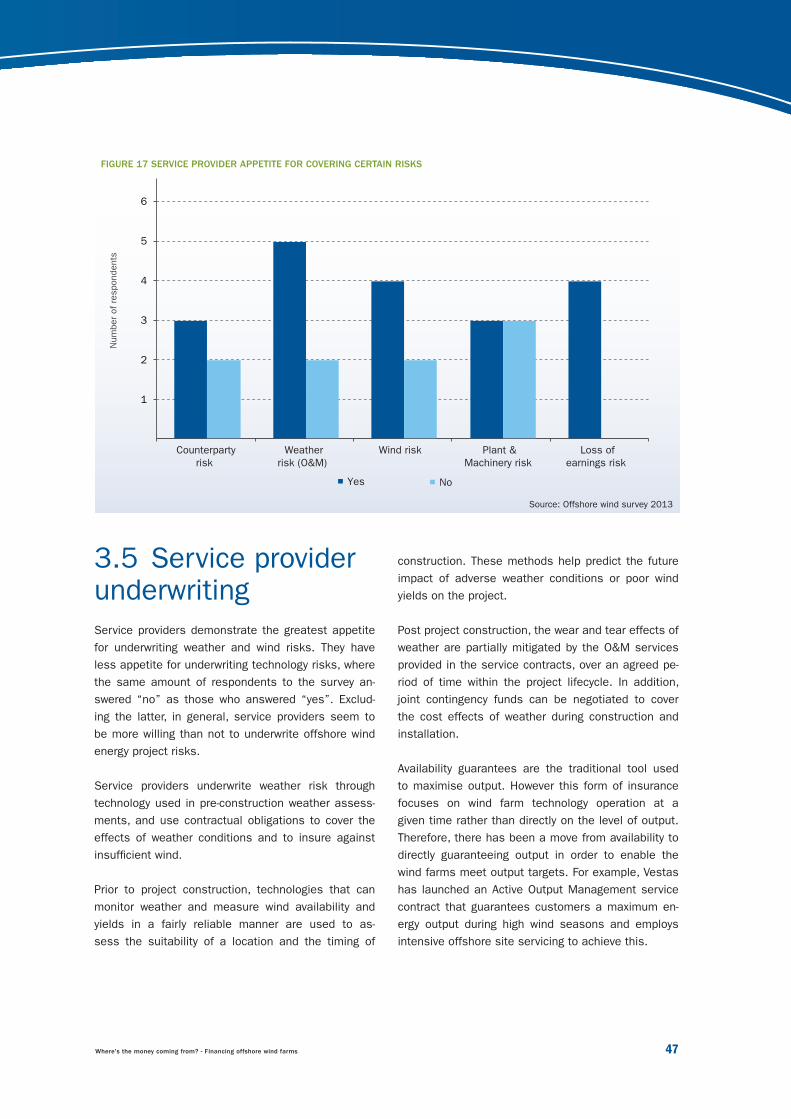
Where's the money coming from? - Financing offshore wind farms 47
construction. These methods help predict the future impact of adverse weather conditions or poor wind yields on the project.
Post project construction, the wear and tear effects of weather are partially mitigated by the O&M services provided in the service contracts, over an agreed pe-riod of time within the project lifecycle. In addition, joint contingency funds can be negotiated to cover the cost effects of weather during construction and installation.
Availability guarantees are the traditional tool used to maximise output. However this form of insurance focuses on wind farm technology operation at a given time rather than directly on the level of output. Therefore, there has been a move from availability to directly guaranteeing output in order to enable the wind farms meet output targets. For example, Vestas has launched an Active Output Management service contract that guarantees customers a maximum en-ergy output during high wind seasons and employs intensive offshore site servicing to achieve this.
3.5 Service provider underwritingService providers demonstrate the greatest appetite for underwriting weather and wind risks. They have less appetite for underwriting technology risks, where the same amount of respondents to the survey an-swered “no” as those who answered “yes”. Exclud-ing the latter, in general, service providers seem to be more willing than not to underwrite offshore wind energy project risks.
Service providers underwrite weather risk through technology used in pre-construction weather assess-ments, and use contractual obligations to cover the effects of weather conditions and to insure against insufficient wind.
Prior to project construction, technologies that can monitor weather and measure wind availability and yields in a fairly reliable manner are used to as-sess the suitability of a location and the timing of
FIGURE 17 SERVICE PROVIDER APPETITE FOR COVERING CERTAIN RISKS
Source: Offshore wind survey 2013
Yes No
1
2
3
4
5
6
Num
ber
of r
espo
nden
ts
Counterpartyrisk
Weatherrisk (O&M)
Wind risk Plant &Machinery risk
Loss ofearnings risk

48 Where's the money coming from? - Financing offshore wind farms
the necessary experience, and plant and machinery will improve compared with tried and tested designs.
A frequently discussed solution to these risks is the use of full EPCI wraps. They are considered ideal by 33% of survey respondents. However, they are not commonly offered because wraps lead to a depend-ency on one contractor who bears all the project risks. This results in more expensive contracts. While the contractor will back off risks to providers, the benefit is that a wrap provides cover for interface risks. Early offshore wind projects became insolvent or the initial EPCI contractors were bought out, because the full scope of services was outside the core competencies of the majority of companies.
Multi-contracting is still preferred by those who have the expertise in maximising their cost efficiencies. A single contract responsibility will remain of interest to the few who have gained the necessary all round ex-perience. For the near term, it is unlikely that full EPCI wraps will be an industry wide solution. Instead, we can expect to see a variety of contracting structures, with an emergence of split wraps via joint ventures between contracting parties.
There is currently no product that directly covers loss of earnings risk. Once again, this risk is partially mitigated by various contractual guarantees and war-ranties and then borne by project investors. These obligations could be extended to cover an increased proportion of the loss of earnings risk, depending on the strength of the provider’s balance sheet, but this is unlikely to be possible for counterparties other than major utilities. There are examples such as DONG that provide guarantees of project earnings to encourage institutional investment.
Counter party risk is mitigated by use of experienced developers and suppliers with strong credentials in terms of credit rating and performance. Track record is extremely important in offshore wind as evidenced by the very high barriers to entry in the supply chain. The use of long term contracting provides a form of insurance. Similarly plant and machinery risks are mitigated by guarantees and other supplier contrac-tual obligations.
Over time, as the technology develops and the risks are better understood, insurers are likely to be more willing to provide cover. More counterparties will gain
Chapter 3: Contracting and risks
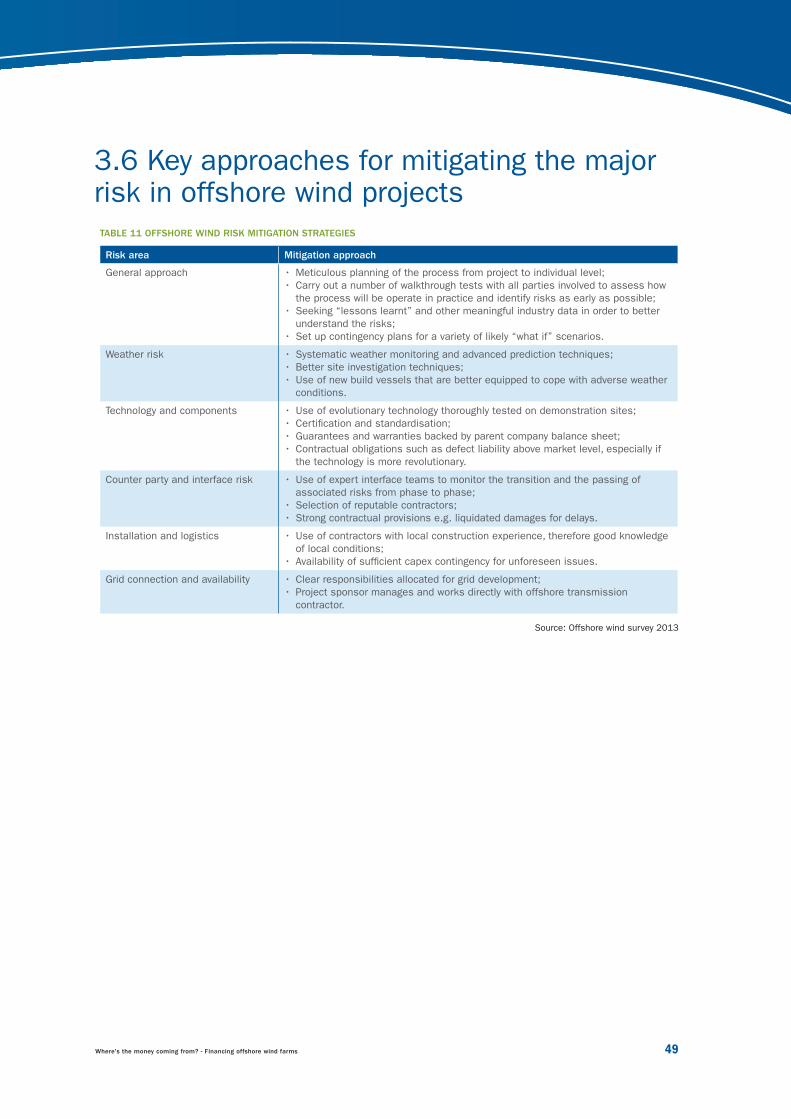
Where's the money coming from? - Financing offshore wind farms 49
3.6 Key approaches for mitigating the major risk in offshore wind projectsTABLE 11 OFFSHORE WIND RISK MITIGATION STRATEGIES
Risk area Mitigation approach
General approach • Meticulous planning of the process from project to individual level;• Carry out a number of walkthrough tests with all parties involved to assess how
the process will be operate in practice and identify risks as early as possible;• Seeking “lessons learnt” and other meaningful industry data in order to better
understand the risks;• Set up contingency plans for a variety of likely “what if” scenarios.
Weather risk • Systematic weather monitoring and advanced prediction techniques;• Better site investigation techniques;• Use of new build vessels that are better equipped to cope with adverse weather
conditions.
Technology and components • Use of evolutionary technology thoroughly tested on demonstration sites;• Certification and standardisation;• Guarantees and warranties backed by parent company balance sheet;• Contractual obligations such as defect liability above market level, especially if
the technology is more revolutionary.
Counter party and interface risk • Use of expert interface teams to monitor the transition and the passing of associated risks from phase to phase;
• Selection of reputable contractors;• Strong contractual provisions e.g. liquidated damages for delays.
Installation and logistics • Use of contractors with local construction experience, therefore good knowledge of local conditions;
• Availability of sufficient capex contingency for unforeseen issues.
Grid connection and availability • Clear responsibilities allocated for grid development;• Project sponsor manages and works directly with offshore transmission
contractor.
Source: Offshore wind survey 2013
PLUGGING THE FUNDING GAP
4.1 Expected funding models up to 2020
4.2 Recommendations to stakeholders to facilitate funding for offshore wind
© T
hink
stoc
k

Where's the money coming from? - Financing offshore wind farms 51
Power producers’ balance sheets are becoming more constrained, limiting the scope for further investment in new offshore wind projects. As such, the funding model does not appear to be sustainable at past levels.
This chapter examines the funding models which sur-veyed offshore wind sector participants expect to be most utilised up to 2020. It also examines restrictions that might apply to each model.
4.1 Expected funding models up to 2020Power producers’ balance sheets are expected to re-main the main source of funding for the construction of offshore wind farms to 2020. However, respondents
to the survey consider that project finance will be al-most as important although the liquidity and capacity of project financing may well limit this ambition for both construction and operational finance. This was followed by third party capital – such as from insti-tutional investors. EPCI balance sheets are expected to play the fourth biggest role in funding construction with arguably the greatest potential capacity, while pro-ject bonds are not expected to play a significant role.
During the operating phase of offshore wind farms, project finance is expected to become the main source of funding, followed by third party capital and, only in third place, power producers’ balance sheets. Project bonds, although ranked fourth, may play a meaning-ful role during the operational phase of offshore wind farms, whereas EPCI balance sheets are considered a less relevant source of funding.
FIGURE 18 MOST PROMINENT FUNDING STRUCTURES TO 2020
Source: Offshore wind survey 2013
Construction
0.0
0.5
1.0
1.5
2.0
2.5
3.0
3.5
4.0
Pow
er p
rodu
cer
bala
nce
shee
t
Proj
ect
�nan
ce
Third
par
ty c
apita
l (e.
gin
situ
tiona
l inv
esto
r)
EPC
I(b
alan
ce s
heet
)
Bon
ds
Ran
k
4.5
Operation
0.0
0.5
1.0
1.5
2.0
2.5
3.0
3.5
4.0
Pow
er p
rodu
cer
bala
nce
shee
t
Proj
ect
�nan
ce
Third
par
ty c
apita
l (e.
gin
situ
tiona
l inv
esto
r)
EPC
I(b
alan
ce s
heet
)
Bon
ds
Ran
k
4.5
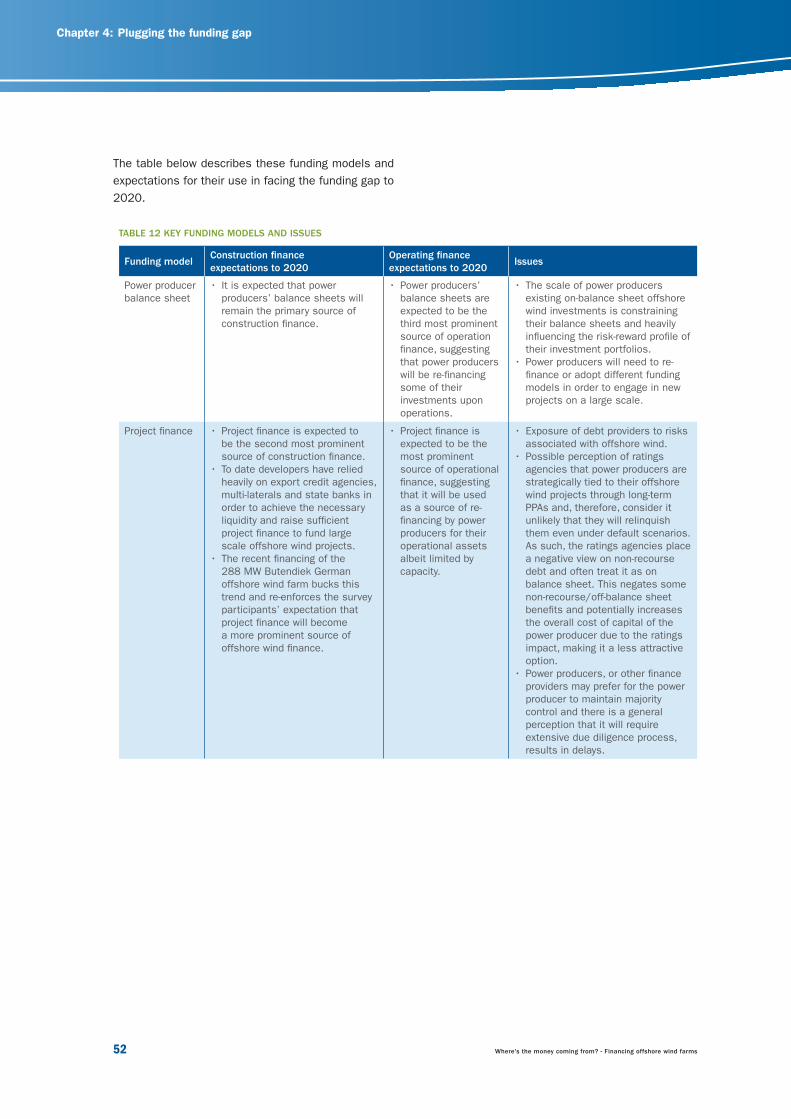
52 Where's the money coming from? - Financing offshore wind farms
Chapter 4: Plugging the funding gap
The table below describes these funding models and expectations for their use in facing the funding gap to 2020.
TABLE 12 KEY FUNDING MODELS AND ISSUES
Funding modelConstruction finance expectations to 2020
Operating finance expectations to 2020
Issues
Power producer balance sheet
• It is expected that power producers’ balance sheets will remain the primary source of construction finance.
• Power producers’ balance sheets are expected to be the third most prominent source of operation finance, suggesting that power producers will be re-financing some of their investments upon operations.
• The scale of power producers existing on-balance sheet offshore wind investments is constraining their balance sheets and heavily influencing the risk-reward profile of their investment portfolios.
• Power producers will need to re-finance or adopt different funding models in order to engage in new projects on a large scale.
Project finance • Project finance is expected to be the second most prominent source of construction finance.
• To date developers have relied heavily on export credit agencies, multi-laterals and state banks in order to achieve the necessary liquidity and raise sufficient project finance to fund large scale offshore wind projects.
• The recent financing of the 288 MW Butendiek German offshore wind farm bucks this trend and re-enforces the survey participants’ expectation that project finance will become a more prominent source of offshore wind finance.
• Project finance is expected to be the most prominent source of operational finance, suggesting that it will be used as a source of re-financing by power producers for their operational assets albeit limited by capacity.
• Exposure of debt providers to risks associated with offshore wind.
• Possible perception of ratings agencies that power producers are strategically tied to their offshore wind projects through long-term PPAs and, therefore, consider it unlikely that they will relinquish them even under default scenarios. As such, the ratings agencies place a negative view on non-recourse debt and often treat it as on balance sheet. This negates some non-recourse/off-balance sheet benefits and potentially increases the overall cost of capital of the power producer due to the ratings impact, making it a less attractive option.
• Power producers, or other finance providers may prefer for the power producer to maintain majority control and there is a general perception that it will require extensive due diligence process, results in delays.
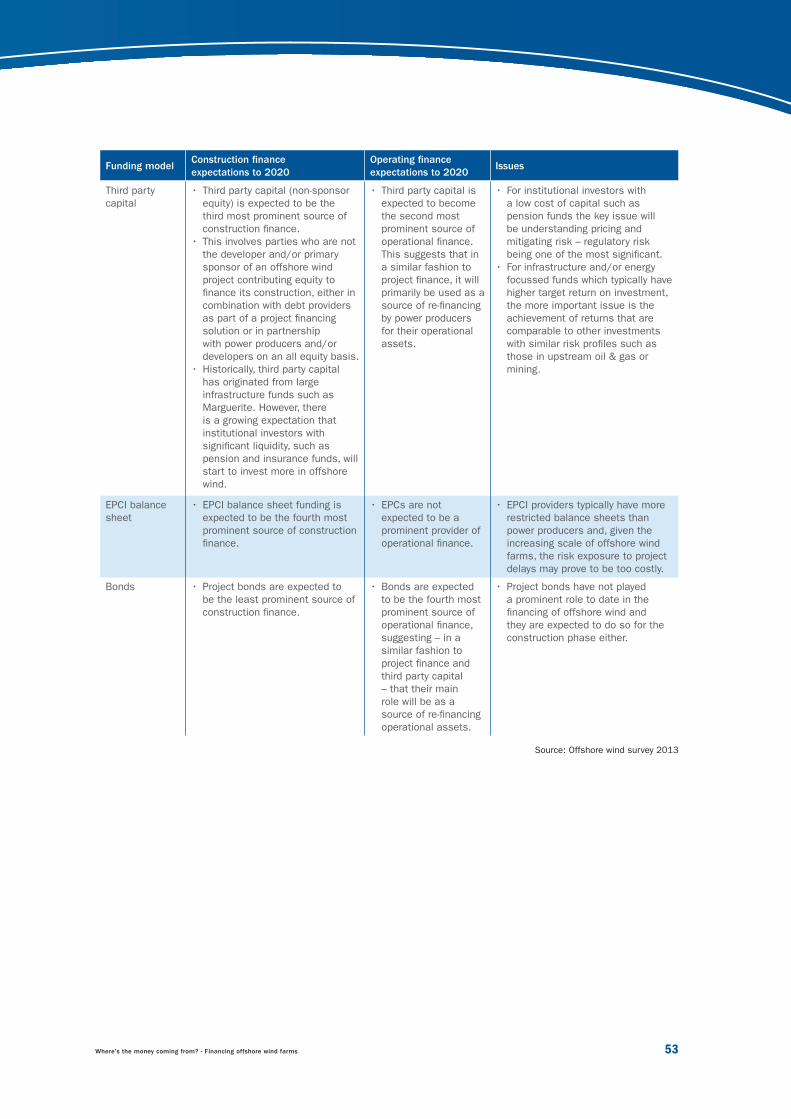
Where's the money coming from? - Financing offshore wind farms 53
Funding modelConstruction finance expectations to 2020
Operating finance expectations to 2020
Issues
Third party capital
• Third party capital (non-sponsor equity) is expected to be the third most prominent source of construction finance.
• This involves parties who are not the developer and/or primary sponsor of an offshore wind project contributing equity to finance its construction, either in combination with debt providers as part of a project financing solution or in partnership with power producers and/or developers on an all equity basis.
• Historically, third party capital has originated from large infrastructure funds such as Marguerite. However, there is a growing expectation that institutional investors with significant liquidity, such as pension and insurance funds, will start to invest more in offshore wind.
• Third party capital is expected to become the second most prominent source of operational finance. This suggests that in a similar fashion to project finance, it will primarily be used as a source of re-financing by power producers for their operational assets.
• For institutional investors with a low cost of capital such as pension funds the key issue will be understanding pricing and mitigating risk – regulatory risk being one of the most significant.
• For infrastructure and/or energy focussed funds which typically have higher target return on investment, the more important issue is the achievement of returns that are comparable to other investments with similar risk profiles such as those in upstream oil & gas or mining.
EPCI balance sheet
• EPCI balance sheet funding is expected to be the fourth most prominent source of construction finance.
• EPCs are not expected to be a prominent provider of operational finance.
• EPCI providers typically have more restricted balance sheets than power producers and, given the increasing scale of offshore wind farms, the risk exposure to project delays may prove to be too costly.
Bonds • Project bonds are expected to be the least prominent source of construction finance.
• Bonds are expected to be the fourth most prominent source of operational finance, suggesting – in a similar fashion to project finance and third party capital – that their main role will be as a source of re-financing operational assets.
• Project bonds have not played a prominent role to date in the financing of offshore wind and they are expected to do so for the construction phase either.
Source: Offshore wind survey 2013
54 Where's the money coming from? - Financing offshore wind farms
Chapter 4: Plugging the funding gap
In the extreme of instability, retroactive changes to a support regime can do far reaching damage to the perception of regulatory risk of the sector as a whole. This applies particularly to new investors with less experience in understanding regulatory risks of revenue support. Policy makers can assist by legis-lating so that the support regime cannot be changed retroactively.
Develop predictable grid connection pro-grammes, with clear allocations of responsibil-ity and de-risked mechanism of cost recovery“Solving grid connection issues” is a key recommen-dation for policy makers and has been a major issue in the German market causing significant delays in the deployment of offshore wind.
The current German example demonstrates the combined effect of grid delays and regulatory change that impacts on financing. Delays in grid connection caused by the transmission system operator beyond 2017 may affect projects’ tariff revenues as the cur-rent front-loaded feed-in tariff of 19 cents/kWh during the first eight years of a project is only available to wind farms connected by 2017. Uncertainty over the level of FIT after 2017 makes projects in earlier stages of development more difficult to finance. The proposed remedy of providing a 90% revenue liability does not cover this issue and it needs to be addressed.
New rules were also agreed in 2012 by the German government to deliver greater co-ordination and risk sharing between wind farm developers and grid opera-tors. According to the previous rules, grid operators were only required to have the connection ready once the offshore wind farm became operational, creating a risk that wind farms become stranded. New rules to address this require the two parties to keep each other updated on their respective projects’ progress, to work towards an anticipated date of completion. However, with consent of the German federal grid agency, this anticipated date can be postponed for up to 30 months.
4.2 Recommenda-tions to stakeholders to facilitate funding for offshore wind4.2.1 Policy makers
Create a stable and clear market and regula-tory frameworkRegulatory risk with the allocation of support mecha-nism is considered the most important threat to offshore wind deployment. Stakeholders surveyed frequently called for “stable, predictable, consistent regulation and incentives” with “long-term stability in pricing”, want-ing policies through to 2030 to support offshore wind deployment. Overall, stability is considered of greater importance than increasing the level of support.
A clear support regime enables sponsors and financi-ers to assess the economics earlier in the develop-ment phase of a project. Any lack of long-term visibility on support may affect investors’ ability to understand whether sufficient returns can be made on a given project to attract their investment and to understand project returns and risk profiles. This is crucial to maintain the appetite of current investors and attract new investors to a sector requiring a good understand-ing of project returns.
Third party capital providers are keen to ensure that policy makers keep support structures simple and “avoid having frequent adjustments in any support scheme” to help them better assess long-term cash flows. The German feed-in tariff regime, for example, has two levels of support, which is attractive for debt allowing faster repayment and lower interest costs. However, institutional investors prefer consistent long term yield and moreover, post the tariff reduction, the asset value is increasingly driven by long term power price forecasts which can make exit difficult.

Where's the money coming from? - Financing offshore wind farms 55
Moreover, to provide for the necessary infrastructure innovative financing schemes for pan-European trans-mission grid reinforcements at EU level must be estab-lished at EU level. They should be in particular geared to facilitating the first legs stages of a HVDC overlay grid and integrated offshore grid solutions. The wider application of financial instruments, such as the pilot phase of the ‘EU 2020 project bonds initiative’, as provided for by the European Commission’s new trans-European energy network (‘TEN-E’) guidelines, would be well suited to alleviate the on-going difficulties in financing infrastructure investments, especially as the costs of capital-intensive investments have gone up.
Provide liquidity and credit support to the sec-tor and make project data publically availableMultilaterals and ECAs have successfully attracted new sources of capital, in particular to the Danish and German markets. The emergence of the GIB in the UK was welcomed, but lending capacity should be increased through the bank’s ability to borrow.
Multilaterals and ECAs should be encouraged to take risks through providing construction finance and taking first loss pieces. Since this will help the understand-ing of construction risks and operating performance of assets the information should be made publicly avail-able. This would be useful to insurance providers, as they are currently unable to price a number of risks in offshore wind due to insufficient data.
Feed-in-Tariffs are the preferred form of supportAccording to the survey responses shown in Figure 19, Feed-in-Tariffs (FITs) are perceived as a more popular form of support by both debt and equity providers. While in theory the UK Contract for Difference (CfD) gives greater revenue certainty than premium tariffs, the relative lack of experience and understanding of the mechanism makes it less attractive.
Once finalised, it cannot be further postponed. How-ever this is on condition that the wind farm opera-tor begins construction at least 12 months prior to final date and reaches completion by the end of 18 months after the final date. Otherwise, the allocated grid capacity can be awarded to a competing opera-tor. Stronger coordination comes at a price of greater uncertainty during the project lifecycle.
Develop international interconnection charging frameworkPolicy makers also need to address the need for the energy regime to extend across borders, and focus on the industry as a whole. Countries would be able to harness each other’s strength, helping each other meet national renewable energy targets and rising energy demand.
The Export Agenda between Ireland and the UK is one example. It allows Ireland not only to export up to 3 GW of wind power to the UK as per the EU Renew-able Energy Directive’s cooperation mechanisms, but also to enable this energy to count towards the UK’s national targets. In the long term, such agreements will facilitate the cost efficient use of resources and drive down costs.
The discussion on financing the corresponding grid infrastructure should be placed in the broader context of the development of an internal electricity market. This will decouple the benefits of grid development from individual projects or technologies. So-called shallow grid connection charging regimes should be maintained for all power generators. This could be reflected in both upcoming legislation on a post-2020 regulatory framework as well as a possible EC Guide-line or Network Code on harmonised transmission tariff structures. More specific regional interconnec-tion charging and cost-allocation frameworks should be developed by existing intergovernmental initiatives such as the North Seas Countries Offshore Grid Initia-tive (NSCOGI).
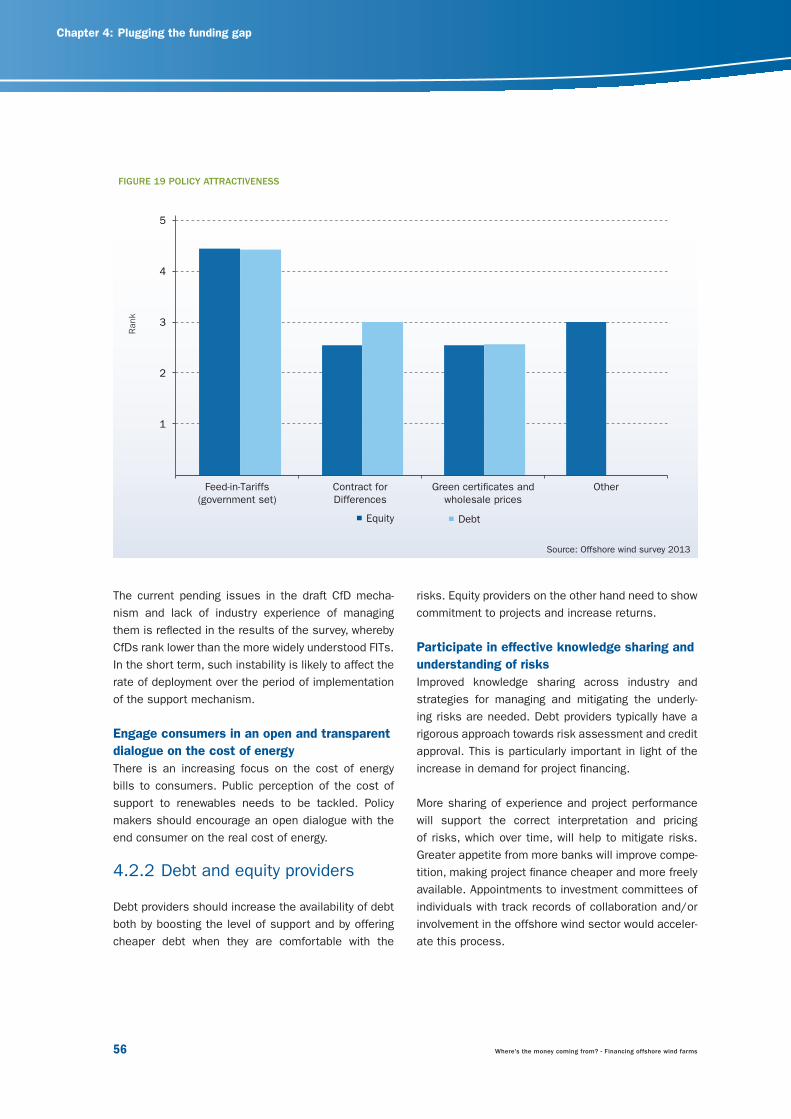
56 Where's the money coming from? - Financing offshore wind farms
Chapter 4: Plugging the funding gap
risks. Equity providers on the other hand need to show commitment to projects and increase returns.
Participate in effective knowledge sharing and understanding of risksImproved knowledge sharing across industry and strategies for managing and mitigating the underly-ing risks are needed. Debt providers typically have a rigorous approach towards risk assessment and credit approval. This is particularly important in light of the increase in demand for project financing.
More sharing of experience and project performance will support the correct interpretation and pricing of risks, which over time, will help to mitigate risks. Greater appetite from more banks will improve compe-tition, making project finance cheaper and more freely available. Appointments to investment committees of individuals with track records of collaboration and/or involvement in the offshore wind sector would acceler-ate this process.
The current pending issues in the draft CfD mecha-nism and lack of industry experience of managing them is reflected in the results of the survey, whereby CfDs rank lower than the more widely understood FITs. In the short term, such instability is likely to affect the rate of deployment over the period of implementation of the support mechanism.
Engage consumers in an open and transparent dialogue on the cost of energyThere is an increasing focus on the cost of energy bills to consumers. Public perception of the cost of support to renewables needs to be tackled. Policy makers should encourage an open dialogue with the end consumer on the real cost of energy.
4.2.2 Debt and equity providers
Debt providers should increase the availability of debt both by boosting the level of support and by offering cheaper debt when they are comfortable with the
FIGURE 19 POLICY ATTRACTIVENESS
Source: Offshore wind survey 2013
Equity Debt
1
2
3
4
5
Ran
k
Feed-in-Tariffs(government set)
Contract forDifferences
Green certi�cates andwholesale prices
Other

Where's the money coming from? - Financing offshore wind farms 57
defined range. This ensures that institutional inves-tors do not take project or construction risks;
• Another example of institutional capital entering the offshore wind sector has been the OFTO regime in the UK. This effectively de-risks a proportion of the asset, in this case the transmission cable, which is separately financed. The asset receives availability based revenue streams and is not exposed to the operating or power output risks of the wind farm.
While these are contractually, commercially and legally different, similar principals may be applied in contractually de-risking portions of other offshore wind assets.
4.2.3 Power producers
Facilitate third party finance through leverag-ing existing power producer balance sheet fundingRecycling of capital of power producers will be key to facilitating the level of capital required to finance the deployment expectations of the sector. As such, power producer balance sheet funding will remain the most prominent source of construction finance up to 2020. This will require power producers to free up their bal-ance sheets.
Power producers can re-finance existing investments as a means of recycling their capital and providing the opportunity to invest in new offshore projects.
However, given their strategic importance, power pro-ducers may want to retain control over their existing offshore wind assets and retain majority equity stakes.
Therefore, power producers could re-finance existing operational offshore wind farms either through debt (in the form of project finance or project bonds) or by selling minority stakes of the equity.
Equity disposal
Selling equity stake is key to facilitating the recycling of capital. The approach typically taken is to sell a minority equity stake in an asset which ensures that the power producer retains overall ordinary control. However, the purchaser of the minority stake will gain
Debt and equity capital providers agree that knowledge will be gained through experience, and capital, will flow to the industry only if the experience is positive. Industry players must take action to share knowledge, such as providing detailed project and equipment data and hosting forums to share best practice across the sector and markets. Sharing information on the latter will help to strengthen subsequent risk mitigation on other projects, which will support the availability and commitment of capital.
Return to underwritingLenders can also contribute to attracting new players to the sector through a return to underwriting. While underwriting has reduced across project financing, a sector such as offshore wind would particularly benefit from an increase. Survey results show some appetite for underwriting although there has not been evidence of this in reality today and interest in the amount of underwriting may need to increase as the size of pro-jects grows.
Develop a collaborative approach to due dili-genceIntrusive due diligence and bank involvement in con-tract negotiation and/or sign-off could add to project delays. All parties need to be committed to the model and adopt it at an early stage to ensure the appro-priate contracting structure is used. Furthermore im-proved standardisation of contract and risk allocation structure may improve the efficiency of this process.
However, the financing model would benefit from bet-ter risk discipline. This would help all parties and pro-vide greater leverage in the negotiation of contractual terms, making the project more saleable should the developer be seeking to subsequently flip it.
De-risk a proportion of the capital requirement either through providing guarantees or creat-ing a new asset classTo attract institutional investment, projects need to be significantly de-risked. There are two examples of how this has been done:
• Through project sponsors providing construction guarantees, or guaranteeing project returns within a

58 Where's the money coming from? - Financing offshore wind farms
Chapter 4: Plugging the funding gap
construction risks as well as “geographic” risks such as wind resource. However, if that power producer is not involved in the other country’s electricity supply market then it will fail to benefit from vertical integra-tion, losing some of the gain made through generation risk diversification. If they need to source from differ-ent suppliers, power producers may not benefit from the economies of scale achievable by expanding in the home market,
This could be mitigated through alliances between power producers, particularly those who lack cross-border supply markets. It could help to diversify de-velopment and construction risk while still ensuring the benefits of vertical integration and economies of scale. Such diversification could reduce the overall portfolio risk, allowing further capital deployment.
Increased use of unincorporated JVs and inter-action with credit rating agenciesThe survey results suggest a lender preference for power producers to remain as majority shareholders in project financed ventures. Debt providers perceive high operating risks - so by maintaining a large share of the project, the power producer’s interests are aligned with those of the lenders.
This is a key recommendation as it reflects the view that project financing is unlikely to occur on a stand-alone basis in the near future. In addition, power producers are urged to “select first class suppliers” to ensure high quality revenue streams as defined by the PPA.
To combat the issue of ratings agencies enveloping project finance into the evaluation of credit ratings, more interaction between power producers, banks and ratings agencies is required. Increased use of JVs between power producers might be a way to convince ratings agencies to take a more positive view on pro-ject finance.
Use of financially stable, high end suppliers with relationships with lendersPower producers and other developers could encourage more project finance by providing banks with greater
certain rights, restricting the power producer’s ability to re-finance further. But this will only free up to 50% of the investment for recycling into new projects. It means that this option is not sustainable in the long term, given the size of the financing challenge and power producers will have to increasingly relinquish majority control to willing incoming equity investors, and not be limited by covenants of lenders.
Debt re-finance
Taking out debt against the asset once it reaches operation has the benefit of securing finance for a greater proportion of investment value whilst still re-taining strategic control of the asset. The increasing use of unincorporated in incorporated joint venture structures can potentially play an important role in fa-cilitating individual participants to raise debt through minority interest financings.
Vertically integrated power companies fund construc-tion of offshore wind farms using their own cash re-serves or corporate finance (such as bank debt with recourse against the entire power producer and not just the specific offshore wind project).
If the power producer does not sell or re-finance the offshore wind farm once construction is completed and it becomes operational, the power producer is said to be financing operations too.
Increase diversification of offshore wind port-foliosTo maintain appetite for investment in offshore wind the risk-reward profile of future projects needs to be aligned with the long-term portfolio strategy. This can be best tackled by the power producers through a de-tailed assessment of their existing offshore wind and other investment portfolios. An acceptable risk profile for future offshore wind projects can be designed, in line with the requirements for risk diversification and vertical integration.
For example, if a power producer has the majority of its existing offshore wind portfolio based in the UK it may be advantageous to secure future projects in another country to diversify regulatory, grid connection and

Where's the money coming from? - Financing offshore wind farms 59
However, there are a number of issues that must be addressed:
• Power producers need to demonstrate an appetite to re-finance through issuance of project bonds. They need to invest in preparing projects and in col-laborating with ratings agencies. This will be key to ensuring the viability of power producers issuing project bonds and minimising the impact on their balance sheets;
• Project bonds will benefit from being rated. Collabo-ration with ratings agencies will demonstrate the fi-nancial stability of the respective project. Success-ful operational data along with the use of proven technology and strong OEM providers with excellent track records are needed;
• Bond guarantees would improve their rating and en-sure access to the new capital pool. However, the financial viability of securing such guarantees is un-known. It may present a re-financing solution that is too expensive to consider. Alternatively, the liquid-ity may not be available. State mechanisms for im-proving debt liquidity such as the UK Treasury’s In-frastructure Guarantee Scheme would be ideal for resolving such issues. However, they tend to only apply to assets in pre-construction and are not avail-able as a re-financing solution, since their primary function is to facilitate construction of infrastructure through enhanced liquidity. However, applying them to the re-financing of operational assets could indi-rectly enhance liquidity for construction of new as-sets since the freed balance sheet capital can be applied to new projects. Exploration of this collabo-ration between power producers and state treasur-ies is an interesting option;
• Finally, there must be sufficient interest and under-standing in the market for such a bond. As insti-tutional funds expand their capabilities in the off-shore wind sector through experienced investment teams and invest more equity in offshore wind as-sets, their interest and appetite for offshore wind project bonds could grow. However, key to ensuring an appetite for such bonds will be the provision of stable, clear, consistent regulation and incentives with long term stability in pricing. This is essential given the long-term yield requirements of the insti-tutional funds.
reassurance. This can best be achieved through the selection of top-end suppliers and OEM providers that have successful track records, along with strong finan-cial standing. Establishing a selection of “preferred suppliers” who conform to specific, published stand-ards would help to provide bank confidence.
Accelerating the issuance of project bonds in offshore wind projects may be achieved through preparation of projects, co-operation with ratings agencies and the involvement of state guaranteesProject bonds differ from corporate bonds as they do not technically have recourse against the power pro-ducer but only against the specific project for which they are raised. As such, they should not impact a power producer’s credit rating overall.
From the survey results, it seems unlikely that project bonds will act as a source of construction finance for offshore wind up to 2020. However, there appears to be a growing belief that they could act as a source of finance for operational assets. Offshore wind farms built on balance sheet by power producers and other developers and/or third party capital providers could potentially be re-financed using project bonds during the operation phase. This would free up capital for power producers and developers to invest in new projects.
Project bonds also have the potential to tap into a source of finance that would otherwise be inaccessi-ble to the offshore wind sector. Institutional investors such as pension funds are expected to invest more equity into offshore wind up to 2020. However, this is likely to be a small portion of the capital potentially available from these sources. Institutional investors will have set requirements for investing their funds at varying grades. Project bonds at a higher investment grade than equity investment could provide access to additional capital.

60 Where's the money coming from? - Financing offshore wind farms
Chapter 4: Plugging the funding gap
Invest in product development, cost reduction road maps and improved efficiencies, learning lessons from the oil and gas sectorHaving clear cost reduction road maps across the value chain will be important to lower the levelised cost of electricity and, ultimately, reduce the support required and reliance on policy-makers. Cross industry collaboration helps to focus on areas such as improv-ing load factors and availability, as well as on manu-facturing and construction techniques.
The oil and gas sector is significantly more mature than offshore wind and there are a number of lessons that can be learned. Improved cooperation across the sector – such as making spare parts available to a number of providers – can reduce costs and im-prove efficiencies for the sector as a whole. Sharing facilities, supplies and infrastructure between the oil and gas sector and the offshore wind sector may be beneficial.
Balance cost effective collaboration with sim-ple contracting structuresThe primary concern to debt providers is the interface risk of contracting structures. Many debt providers say that they would prefer simple structures, minimis-ing interface risk. On the other hand, some equity providers have demonstrated a preference for multi-contracting due to potential for cost optimisation. It is the combination of EPCI experience and project developer contracting expertise that determines the success of either structure.
However, there is a common preference for full EPCI wraps but with the realisation that this is not possi-ble in the short term. EPCI providers could improve knowledge sharing, and team up with more expe-rienced partners to offer a strong EPCI solution. To demonstrate commitment and reliability more guaran-tees can be provided by undertaking an investor role through a minority stake. As outlined above, this would be compatible with the power producers’ objective of freeing up their balance sheets.
4.2.4 OEM and EPCI providers
Improve the provision of data and knowledge and experience sharingOEM providers represent a counterparty risk that con-cerns funders. To mitigate this, OEM providers should “demonstrate operational data” in order to give as-surance on the quality and reliability of their services. Cataloguing the impact of the different construction risks relating to their projects and sharing this data with investors, could help investors manage their risk better. To avoid any loss of competitive advantage ano-nymity could be ensured through a common database with a standardised format for data sharing.
Key to securing more third party capital will be ensur-ing that they can understand and assess the risk, to accurately price their investment. Knowledge transfer by existing EPCI providers, power producers, develop-ers and OEM providers sharing their data with third party capital providers, will help achieve this.
Demonstrate long term commitment to project reliability and provide bankable guaranteesStronger balance sheets would enable EPCI and OEM providers to back up the strong guarantees that debt providers rely on, for mitigating key risks such as tech-nology risks. As a demonstration of reliability, OEM providers could offer long term arrangements with projects.
The appointment of experienced EPCI providers with financial standing and successful track records (particularly in multi-contracting arrangements) and provision of appropriate levels of guarantees and war-ranties will be key to attracting third party capital.
Investors with experience of other types of infrastruc-ture are also keen for OEM providers to demonstrate an increased commitment to the long term reliability of projects. They could achieve this by adopting mod-els used in other sectors, such as gas turbines and by shifting their revenue focus from capex to opex. This delays the OEMs’ returns from the project and maintains interest in the project longer term.

Where's the money coming from? - Financing offshore wind farms 61
EPCI providers help encourage finance to the sector through tighter definition and implementation of con-tractor and sub-contractor wraps. By taking on more construction risk in the form of wraps, developers will find it easier to obtain third party capital and debt.
Experience in the industry to date suggests that it is unlikely that EPCI providers will contribute significant additional balance sheet investment to offshore wind since they lack the ability to sufficiently diversify their risk. Demand for enhanced credit terms and con-tractor wraps from EPCI providers could continue to increase and could represent the most significant financial contribution that EPCI providers make to the sector in future.
Some debt providers favour simplification through reduced numbers of contracts. However, this can re-sult in increased costs, to the detriment of equity. A successful track record in multi-contract structuring is vital to ensure bank confidence in such projects.
APPENDICES
Appendix A: Approach and methodology
Appendix B: Project gearing
Appendix C: Debt terms
© T
hink
stoc
k
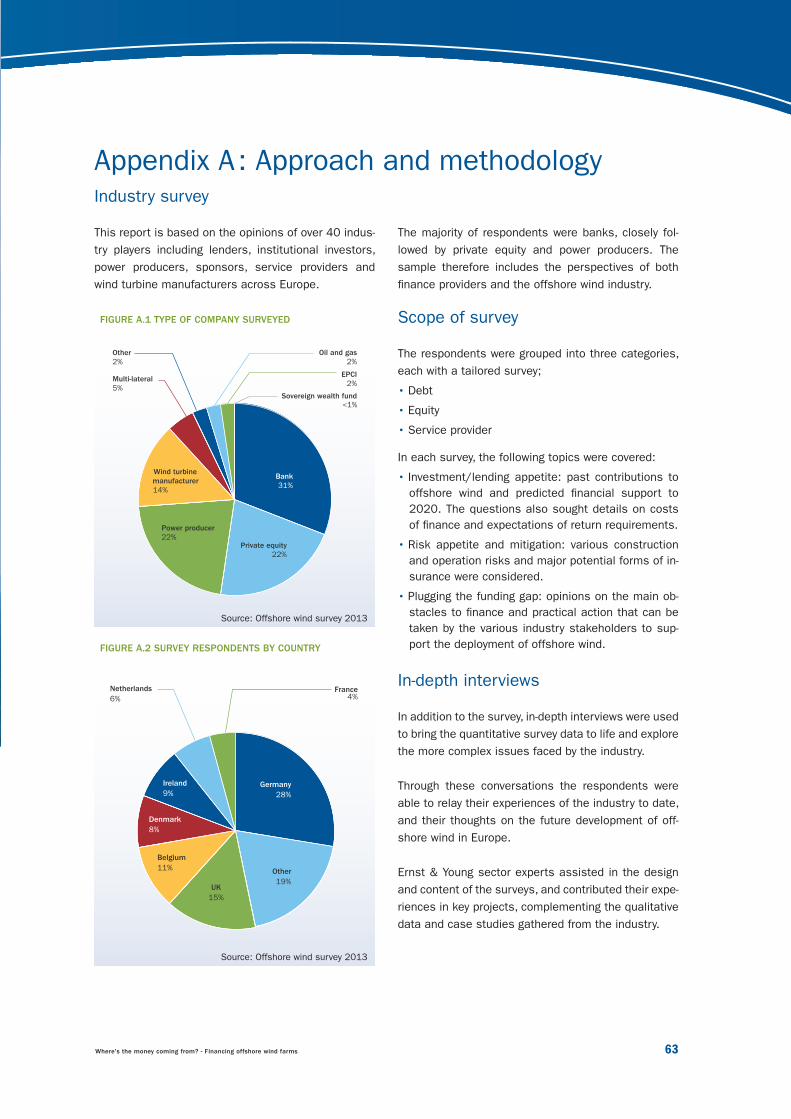
Where's the money coming from? - Financing offshore wind farms 63
Appendix A : Approach and methodologyIndustry survey
This report is based on the opinions of over 40 indus-try players including lenders, institutional investors, power producers, sponsors, service providers and wind turbine manufacturers across Europe.
The majority of respondents were banks, closely fol-lowed by private equity and power producers. The sample therefore includes the perspectives of both finance providers and the offshore wind industry.
Scope of survey
The respondents were grouped into three categories, each with a tailored survey;
• Debt
• Equity
• Service provider
In each survey, the following topics were covered:
• Investment/lending appetite: past contributions to offshore wind and predicted financial support to 2020. The questions also sought details on costs of finance and expectations of return requirements.
• Risk appetite and mitigation: various construction and operation risks and major potential forms of in-surance were considered.
• Plugging the funding gap: opinions on the main ob-stacles to finance and practical action that can be taken by the various industry stakeholders to sup-port the deployment of offshore wind.
In-depth interviews
In addition to the survey, in-depth interviews were used to bring the quantitative survey data to life and explore the more complex issues faced by the industry.
Through these conversations the respondents were able to relay their experiences of the industry to date, and their thoughts on the future development of off-shore wind in Europe.
Ernst & Young sector experts assisted in the design and content of the surveys, and contributed their expe-riences in key projects, complementing the qualitative data and case studies gathered from the industry.
FIGURE A.1 TYPE OF COMPANY SURVEYED
Source: Offshore wind survey 2013
FIGURE A.2 SURVEY RESPONDENTS BY COUNTRY
Source: Offshore wind survey 2013
Multi-lateral 5%
Other 2%
Oil and gas2%
EPCI2%
Sovereign wealth fund<1%
Bank 31%
Private equity 22%
Power producer 22%
Wind turbine manufacturer 14%
Germany 28%
Other 19%
UK 15%
Belgium 11%
Denmark 8%
Ireland 9%
Netherlands 6%
France 4%

64 Where's the money coming from? - Financing offshore wind farms
Appendices
Appendix B : Project gearing
This appendix outlines data regarding preferred levels of project gearing during the different stages of the project lifecycle.
Project development
The analysis supports the current trend for sponsors to fund projects during their development phase. Low levels of non-sponsor equity and sub-debt are also popular which reflects the lack of sponsor ability to finance a project alone, as in the past.
Sub-debt will be included in a project by equity holders in order to benefit from the tax relief available in debt repayments, but not dividends. Respondents have also suggested that at development phase either low, (<30%) or very high levels (>75%) of non-recourse debt can be obtained. This demonstrates a polarisation of the availability of debt funding whereby high gearing early in the lifecycle can be obtained, in particular where there are multilateral guarantees.
FIGURE B.1 FUNDING STRUCTURES DURING DEVELOPMENT
Source: Offshore wind survey 2013
1
2
3
4
5
6
7
8
9
Nil <10% 10-30% 30-50% 50-75% >75%
Num
ber
of r
espo
nden
ts
% Sponsor equity or sub debt % Non-sponsor equity or sub-debt % Non-recourse debt
Project construction
As shown above, the availability of debt increases during construction creating a variety of funding struc-tures. Sponsor equity or sub-debt decreases creating room for third party investors. The responses suggest strong appetite for project co-ownership during con-struction. As for debt, the polarisation increases at
this stage, with very, no or minimal debt on one end and high level of gearing on the other. The low levels of debt demonstrate some lenders’ lack of appetite for undertaking construction risks.
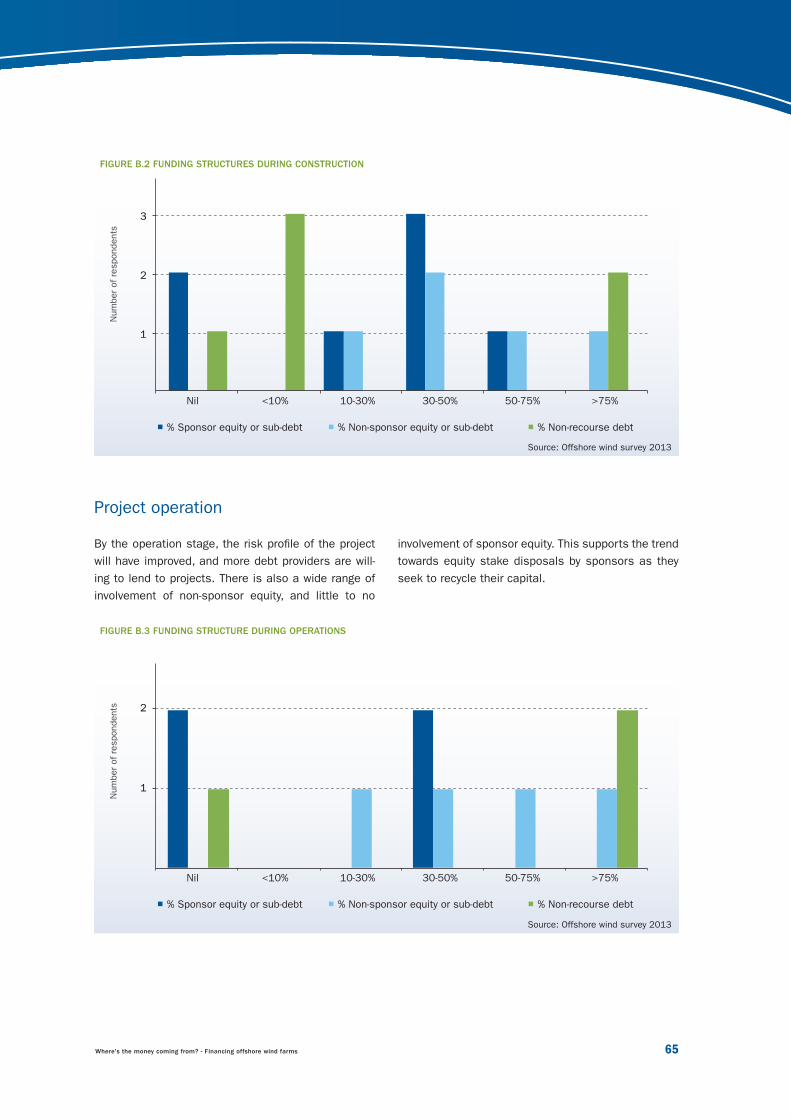
Where's the money coming from? - Financing offshore wind farms 65
FIGURE B.2 FUNDING STRUCTURES DURING CONSTRUCTION
Source: Offshore wind survey 2013
FIGURE B.3 FUNDING STRUCTURE DURING OPERATIONS
Source: Offshore wind survey 2013
1
2
Nil <10% 10-30% 30-50% 50-75% >75%
Num
ber
of r
espo
nden
ts
% Sponsor equity or sub-debt % Non-sponsor equity or sub-debt % Non-recourse debt
Project operation
By the operation stage, the risk profile of the project will have improved, and more debt providers are will-ing to lend to projects. There is also a wide range of involvement of non-sponsor equity, and little to no
involvement of sponsor equity. This supports the trend towards equity stake disposals by sponsors as they seek to recycle their capital.
1
2
3
Nil <10% 10-30% 30-50% 50-75% >75%
Num
ber
of r
espo
nden
ts
% Sponsor equity or sub-debt % Non-sponsor equity or sub-debt % Non-recourse debt

66 Where's the money coming from? - Financing offshore wind farms
Appendix C : Debt terms
This appendix illustrates the findings on key debt terms and trends for lending in offshore wind. The data provides an overview of how these terms work to-gether when lenders evaluate offshore wind projects.
Respondents were asked to assume typical current offshore wind projects where there is pre-construction finance, traditional legal structure, strong sponsor and EPCI contractor, Tier 1 technology providers, standard (bankable) warranties and long secure PPA contract.
Debt type
A term loan, whereby a lender provides a facility for a fixed repayment period, is overwhelmingly the most popular debt type in the European offshore wind market. This is the simplest form of project finance loan and benefits lenders as they are not encouraged or forced to refinance the debt in the project. Lenders use mini perm structures, either soft or hard, to encourage refinancing prior to the termination of the loan. Mini perms are used by a limited number of lenders and will typically consist of step-ups in margins after, say five years of operations to encour-age equity holders to seek more attractive debt facilities elsewhere. Hard mini perms will have stricter clauses in the facility agreements to force refinancing.
FIGURE C.1 PROMINENT DEBT TYPE PER COUNTRY
Source: Offshore wind survey 2013
5
10
15
20
25
30
35
Num
ber
of r
espo
nden
ts
Non country speci�c UK Germany France Belgium Denmark Netherlands Poland Ireland
Hard mini perm Soft mini perm Term Loan Other Don't Know
Appendices

Where's the money coming from? - Financing offshore wind farms 67
Debt tenors
Debt tenors in offshore wind are predominantly 10 to 15 years. However a number of lenders also provide loans with tenors between five and ten years. The UK and the Netherlands are the only two markets that
see examples of tenors over 15 years. Both markets have support regimes extending to 20 years allowing a debt tail – or period of project operations beyond which repayment of debt is required – of five years.
FIGURE C.2 DEBT TENORS PER COUNTRY
Source: Offshore wind survey 2013
Debt terms
The average debt service cover ratios refer to the ratio between the cash flows to the project that are available to repay the debt and the amount of debt required to be repaid over a given period (or debt ser-vice). The higher the debt service required, the higher the perception of risk of the lender.
Respondents indicated a range of cover ratios prin-cipally in the range of 1.3x to 1.5x. Lenders did not indicate any change in Debt Service Cover Ratios (DSCR) requirements during the life of the project. The respondents overwhelmingly did not expect DSCRs to change up to 2020, with the exception of respondents in Ireland where there is very limited precedent and ratios are higher.
1
2
3
4
Num
ber
of r
espo
nden
ts
Non country speci�c UK Germany France Belgium Denmark Netherlands Poland Ireland
<5 years 5-10 years 10-15 years >15 years Others
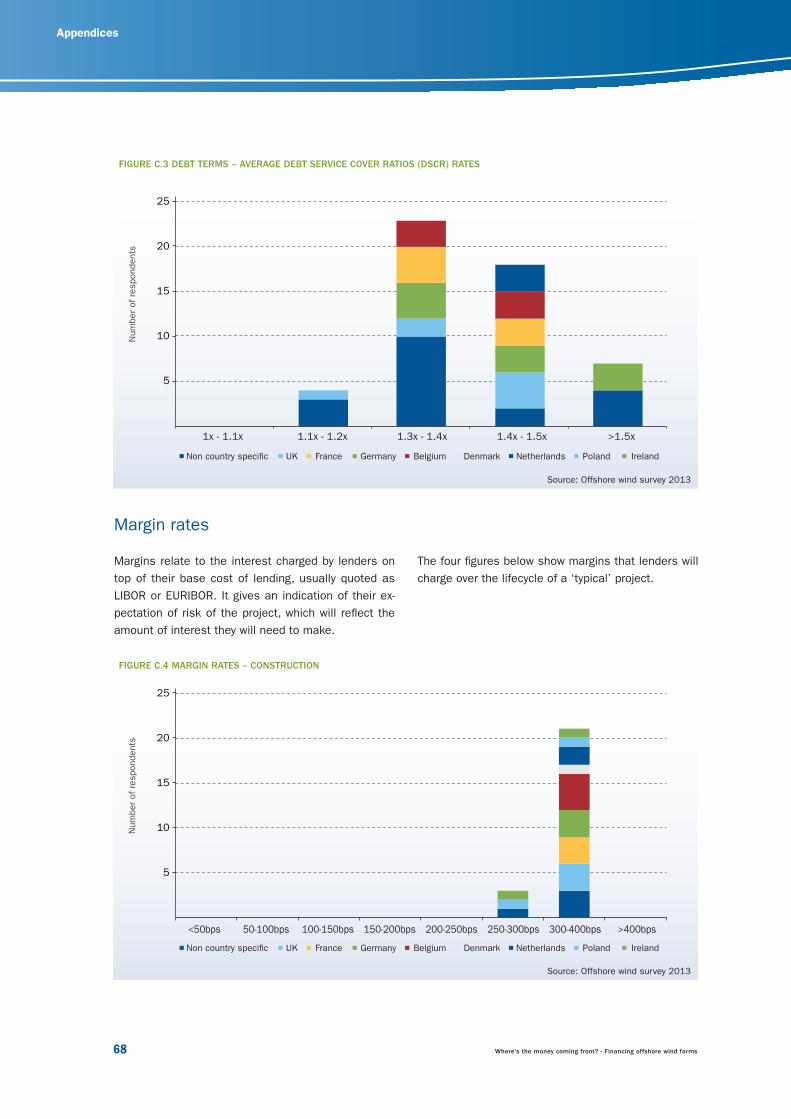
68 Where's the money coming from? - Financing offshore wind farms
FIGURE C.3 DEBT TERMS – AVERAGE DEBT SERVICE COVER RATIOS (DSCR) RATES
Source: Offshore wind survey 2013
FIGURE C.4 MARGIN RATES – CONSTRUCTION
Source: Offshore wind survey 2013
5
10
15
25
20
Num
ber
of r
espo
nden
ts
Non country speci�c UK Germany France Belgium Denmark Netherlands Poland Ireland
1x - 1.1x 1.1x - 1.2x 1.3x - 1.4x 1.4x - 1.5x >1.5x
Margin rates
Margins relate to the interest charged by lenders on top of their base cost of lending, usually quoted as LIBOR or EURIBOR. It gives an indication of their ex-pectation of risk of the project, which will reflect the amount of interest they will need to make.
The four figures below show margins that lenders will charge over the lifecycle of a ‘typical’ project.
Appendices
5
10
15
20
25
Num
ber
of r
espo
nden
ts
Non country speci�c UK Germany France Belgium Denmark Netherlands Poland Ireland
<50bps 50-100bps 100-150bps 150-200bps 200-250bps 250-300bps 300-400bps >400bps

Where's the money coming from? - Financing offshore wind farms 69
FIGURE C.6 OPERATIONS: 5-10 YEARS
Source: Offshore wind survey 2013
FIGURE C.5 OPERATION - FIRST FIVE YEARS
Source: Offshore wind survey 2013
As a project’s operational period becomes longer, fewer lenders provide debt and some lenders may in-crease margin expectations to encourage refinancing. Survey respondents were also asked how they expect
margins to change in the period up to 2020. Half of respondents anticipated a decrease in the offshore wind sector, while the remainder expected no change.
4
6
8
Num
ber
of r
espo
nden
ts
2
14
10
12
Non country speci�c UK Germany France Belgium Denmark Netherlands Poland Ireland
<50bps 50-100bps 100-150bps 150-200bps 200-250bps 250-300bps 300-400bps >400bps
4
6
8
Num
ber
of r
espo
nden
ts
2
14
10
12
20
16
18
Non country speci�c UK Germany France Belgium Denmark Netherlands Poland Ireland
<50bps 50-100bps 100-150bps 150-200bps 200-250bps 250-300bps 300-400bps >400bps

70 Where's the money coming from? - Financing offshore wind farms
FIGURE C.7 OPERATIONS: 10 YEARS+
Source: Offshore wind survey 2013
Disclaimer
In preparing this report, EWEA commissioned Ernst & Young LLP (EY) to carry out and analyse the results of a survey of the key stake holders including power producers, wind turbine manufacturers, and EPCI providers as well as existing and potential providers of debt and equity investment to the offshore wind industry.
At EY, we understand the challenges of cost, decarbonisation and security of supply which face energy users, generators and the supply chain alike. We have been committed to renewable energy and the environment since the industry’s more pioneering days. We recognise the offshore wind industry as being a means by which economies can quickly decarbonise and generate clean energy at scale. We work with utility companies to address these challenges, advise on asset investments and divest-ments, provide funding advice for large scale renewable projects and help high energy users optimise their energy consumption.
Our Environmental Finance practice consists of over 70 professionals dedicated to offering advice on financing renewable energy and environmental infrastructure. As a team based in the UK we act as a global centre of excellence for advising our clients on financing renewable energy projects.
EY is a global leader in assurance, tax, transaction and advisory services. The insights and quality services we deliver help build trust and confidence in capital markets and economies the world over. We develop outstanding leaders who team to deliver on our promises to all of our stakeholders. In so doing, we play a critical role in building a better working world for our people, for our clients and for our communities.
The opinions of third parties set out in this publication are not necessarily the opinions of the global EY (Ernst & Young) organi-sation or its member firms. Moreover, they should be viewed in the context of the time they were expressed. This publication contains information in summary form and is therefore intended for general guidance only. It is not intended to be a substitute for detailed research or the exercise of professional judgment. Neither EY (Ernst & Young LLP) nor any other member of the global EY organisation can accept any responsibility for loss occasioned to any person acting or refraining from action as a result of any material in this publication.
Contact
Ben Warren - Partner, Environmental Finance - [email protected] Perkins - Partner, Environmental Finance - [email protected] Bouillé - Director, Environmental Finance - [email protected] Shaw - Assistant Director, Environmental Finance - [email protected]
Appendices
4
6
8
Num
ber
of r
espo
nden
ts
2
14
10
12
16
Non country speci�c UK Germany France Belgium Denmark Netherlands Poland Ireland
<50bps 50-100bps 100-150bps 150-200bps 200-250bps 250-300bps 300-400bps >400bps
Twenties
The aim of the TWENTIES project is to advance the development and deployment of new technologies which facilitate the widespread integration of more onshore and offshore wind power into the European electricity system by 2020 and beyond.
PUBLICATION DATE: October 2013
DOWNLOAD THE PDF HERE: www.ewea.org/report/twenties
Eastern Winds: Emerging European wind power markets
Eastern Winds examines the frontier of wind power development in Europe. The report deals with the prospects for wind power in central and eastern Europe, tackles financing and provides an in-depth analysis of 12 emerging wind power markets. Eastern Winds is also a tool for
decision-makers highlighting bottlenecks, regulatory challenges and providing policy recommendations.
PUBLICATION DATE: February 2013
DOWNLOAD THE PDF HERE: www.ewea.org/report/eastern-winds
2030 The next steps for EU climate and energy policy
The EU must decide as soon as possible on an energy and climate policy framework for 2030. This is so investors continue to invest, wind energy continues to grow and
deliver all its benefits, and the EU can meet its greenhouse gas reduction commitments of 80-95% by 2050 in the most cost-efficient way.
PUBLICATION DATE: September 2013
DOWNLOAD THE PDF HERE: www.ewea.org/report/2030
Workers wantedThe EU wind energy sector skills gap
The European wind industry has grown rapidly. Installed capacity has increased from around 13 GW in 2000 to more than 100 GW in 2012. A consequence of this has been a failure for skills development to keep pace. This report shows that the European
wind industry can play a key role in combatting unemployment.
PUBLICATION DATE: August 2013
DOWNLOAD THE PDF HERE: www.ewea.org/report/workers-wanted
Deep WaterThe next step for offshore wind energy
Offshore wind is one of the fastest growing maritime sectors. Its installed capacity was 5 GW at end 2012, and by 2020 this could be eight times higher, at 40 GW, meeting 4% of European electricity demand. By 2030, offshore wind capacity could total 150 GW,
meeting 14% of the EU’s total electricity consumption.
PUBLICATION DATE: August 2013
DOWNLOAD THE PDF HERE: www.ewea.org/report/deep-water
EWEA annual report 2012: United in tough times
In 2012, Europe’s wind energy industry was plunged into a crisis of regulatory uncertainty as governments, seeing renewables as an easy target for austerity
measures, slashed or changed their support. Despite this, 2012 marked a historic milestone: reaching 100 GW of wind power capacity in the EU, meeting the power needs of 57 million households, equivalent to the output of 39 nuclear power plants – a remarkable success which was achieved during a period of extraordinary growth founded on firm political support.
PUBLICATION DATE: June 2013
DOWNLOAD THE PDF HERE: www.ewea.org/report/annual-report-2012
Latest reports published by EWEA
SUPPORT EWEA BECAUSE WE SUPPORT YOU
EWEA is building a strong wind industry for Europe through its activities aimed at supporting the development of its member organisations. 600 organisations from over 60 countries are already benefiting from EWEA services. To discover how EWEA can support your development in wind, visit www.ewea.org/membership/benefits or contact [email protected]
53520-1310-1018
www.ewea.org
About EWEAEWEA is the voice of the wind industry, actively promoting wind power in Europe and worldwide. It has over 600 members from almost 60 countries, including wind turbine manufacturers with a leading share of the world wind power market, plus component suppliers, research institutes, national wind and renewables associations, developers, contractors, electricity providers, finance and insurance companies, and consultants. This combined strength makes EWEA the world's largest and most powerful wind energy network.
Rue d’Arlon 80 | B-1040 BrusselsTel: +32 2 213 18 11 - Fax: +32 2 213 18 90E-mail: [email protected]