Embed Size (px)
Citation preview

Economic Roundtable
2009
Underwritten through the Los Angeles Homeless Services Authority by theCounty of Los Angeles, City of Los Angeles, Corporation for Supportive Housing,
The California Endowment, and the Economic Roundtable
Wh e re We S l e e pCosts when Homeless and Housed in Los Angeles


Where We Sleep Costs when Homeless and Housed in Los Angeles
2009
Underwritten through the Los Angeles Homeless Services Authority by the County of Los Angeles, City of Los Angeles, Corporation for Supportive Housing,
The California Endowment, and the Economic Roundtable
Daniel Flaming Patrick Burns Michael Matsunaga Economic Roundtable
Gerald Sumner – Statistical Consultant
Manuel H. Moreno Halil Toros Duc Doan
Los Angeles County Chief Executive Office, Service Integration Branch Public record linkage, database construction and data mapping
ECONOMIC ROUNDTABLE A Nonprofit, Public Policy Research Organization
315 West Ninth Street, Suite 1209, Los Angeles, California 90015 www.economicrt.org

This report has been prepared by the Economic Roundtable homeless cost avoidances study team, which assumes all responsibility for its contents. Data, interpretations and conclusions contained in this report are not necessarily those of any other organization that supported or
assisted this project.
This report can be downloaded from the Economic Roundtable web site: www.economicrt.org
Acknowledgements We would like to thank the human service professionals and researchers
listed below who have contributed to this study.
Skid Row Housing Trust Management Staff
Mike Alvidrez Oliver Baker
Craig Fenner JoAnne Cohen
Katherine Hill Molly Rysman
Case Management Staff
Erin Antes Vincent L. Benton Pamela Driskel Alexis Earkman Maria Euceda Celis Fernando Katherine Hill Rachel Karman
Dana LaVerne Erin Law Rachel McCrickard Yvette Nelson Thomas Mondello Claudia Roman Jennifer Schneider Lauren Singer
Elizabeth Spates Jose G. Tovar Marc Vannguyen Lisa Williams Leslie Young Krista Zabor
Property Managers
Jemere Calhoun Bryant Caver Aaron Fontenot
Beverly Jackson Mazala Kelley Priscilla Leonard
Michael Richardson Stacey Ruff Gregory Stamps
Randy Jeffery Lamp Community
Casey Horan Shannon Murray
JWCH InstituteAl Ballesteros
Paul Gregerson
Corporation for Supportive Housing Gabriele Hooks
Los Angeles Homeless Services Authority
Michael Arnold Stephen Andryszewski Frances Hutchins
Rebecca Isaacs Christine Mirasy-Glasco Amanda Prince
Leslie Wise
Los Angeles County Government
Chief Executive Office, Services Integration Branch Kathy House Lari Sheehan
Nancy Salem
Miguel Santana

Department of Coroner
Onnie Brown Maria Campos Brian Cosgrove
County Counsel Department Katherine Bowser Stephanie Farrell
Jill Meyers Eva Vera Morrow
Gordon Trask Stephen Watson
Department of Health Services
Elizabeth Boyce Irene Dyer
Department of Public HealthLa Tasha Barber Linda Dyer
Sun Lee Dorothy de Leon
Patrick Ogawa Wayne Sugita
Department of Public Social Services
Michael Bono
LaShonda Diggs
Judith Lillard
Linda T. McBride, Auditor Controller Department Al Brusewitz, Chief Information Office
Mary Marx, Department of Mental Health Karen Dalton, Sheriff’s Department
California State Government
Janice Morgan, Office of Statewide Health Planning and Development Jonathan Teague, Office of Statewide Health Planning and Development
Karen Vinson, California Department of Public Health
Independent Reviewers and Researchers Daniel Chandler Dennis Culhane
Jonathan Hunter Bill Pitkin
Ruth Teague Paul Tepper
Nonprofit Organizations
Maribel Carrillo, Economic Roundtable Becky Dennison, Los Angeles Community Action Network
Economic Roundtable Institutional Review Board
Yolanda Arias, Chair Rosina Becerra
Ruth Wilson Gilmore Paul Hunt
Leland Saito

v
Table of Contents 1 EXECUTIVE SUMMARY..........................................................................................................1
2 STUDY DESIGN .....................................................................................................................3
Purpose...........................................................................................................................3 Context...........................................................................................................................3 People.............................................................................................................................7 Costs...............................................................................................................................9 Supportive Housing .....................................................................................................12 Summary ......................................................................................................................13
3 PUBLIC COSTS WHEN HOMELESS ........................................................................................15
Profile...........................................................................................................................15 Costs for Homeless Women and Men .........................................................................16 Cost Deciles .................................................................................................................17 Cost Savings.................................................................................................................19 Public Agencies Bearing the Cost of Homelessness....................................................20 Health Care Costs ........................................................................................................21 Place of Birth ...............................................................................................................22 Summary ......................................................................................................................23
4 COSTS FOR PERSONS IN SUPPORTIVE HOUSING AND COMPARABLE
HOMELESS PERSONS ........................................................................................................25 Costs for Supportive Housing Residents and Comparable Homeless Persons............25 Population Profiles.......................................................................................................30 Cost Impacts of the Skid Row Collaborative and Project 50.......................................33 Rent and Rent Subsidy.................................................................................................34 Summary .....................................................................................................................35 5 TENURE IN SUPPORTIVE HOUSING AND COSTS AFTER LEAVING .........................................37 Tenure and Costs..........................................................................................................37 Point of Departure for Housing Leavers......................................................................38 Level of Service and Costs ..........................................................................................41 Costs while Housed versus Costs after Housing..........................................................42 Summary ......................................................................................................................44

vi
6 GENERAL RELIEF EMERGENCY HOUSING VOUCHER RECIPIENTS .......................................45 Profile of Housing Voucher Recipients .......................................................................45 Costs When Housed and Homeless .............................................................................46 Monthly Cost Trends when Homeless and Housed.....................................................47 Public Agencies Bearing the Costs of Homelessness Voucher Recipients .................48 Cost Savings from GR Emergency Housing Vouchers Compared to Savings from
Supportive Housing for Specific Homeless Subgroups.........................................49 New General Relief Housing Subsidy and Case Management Project .......................50 Summary ......................................................................................................................51 7 CONCLUSIONS AND RECOMMENDATIONS............................................................................53 Bottom Line .................................................................................................................53 Link Housing Strategies to Cost Savings ....................................................................55 Strengthen Government-Housing Partnerships and Leverage Resources ...................57 Improve Retention Rates for Individuals in Supportive Housing................................57 Increase the Supply of Supportive Housing.................................................................58 Produce Information for Developing Comprehensive Strategies and Improving Outcomes.......................................................................................61 Summary ......................................................................................................................61
APPENDICES PROPENSITY SCORE MATCHING, by Gerald Sumner, Project Statistician...........................63 DATA TABLES APPENDIX....................................................................................................69 PROTECTION OF HUMAN SUBJECTS...................................................................................111 END NOTES...................................................................................................................................113

vii
List of Figures 1 Populations in Study ............................................................................................................8 2 Profile of All Residents and Homeless General Relief Recipients in LA Co. - 2007 .......15 3 Average Monthly Costs for General Relief Recipients when Homeless – 2008 dollars ...17 4 Average Monthly Costs by Decile for Homeless GR Recipients – 2008 dollars ..............18 5 Monthly Cost When Homeless vs. When Not Homeless ..................................................19 6 Average Monthly Costs of Service Providers per Homeless General Relief Recipient – 2008 dollars...............................................................................................................21 7 Percent of LA County Residents 18-65 Years of Age Born in Each State that Are in Database of Homeless General Relief Recipients ............................................23 8 Average Monthly Costs when Homeless and Savings when in Supportive Housing by Subgroup.................................................................................................................26 9 Average Monthly Costs by Departments for Persons in Supportive Housing and Homeless Persons ........................................................................................................28 10 Profile of Homeless GR Recipients, Current Supportive Housing Residents, SRC
Participants, and Project 50 Participants......................................................................31 11 Average Monthly Cost of Skid Row Collaborative and Project 50 Participants when Homeless and Housed ........................................................................................32 12 Distribution by Cost Decile of Monthly Public Costs when Homeless for Four Study Populations ..........................................................................................33 13 Median Monthly Cost for Supportive Housing Residents by Month in Residency ..........38 14 Tenure before Departing Supportive Housing...................................................................38 15 Tenure before Departing Supportive Housing by Individual Characteristics....................39 16 Reasons for Leaving Supportive Housing by Tenure ........................................................40 17 Average Monthly Costs by Departments for Residents in the Rainbow and St. George Apartments and Comparable Residents in Other SRHT Facilities (Matched Pairs)............................................................................................................41 18 Average Monthly Costs for Persons while in Supportive Housing and for Persons after Exiting Supportive Housing by Public Agency (Matched Pair)..........................43 19 Profile of Recipients of GR Housing Voucher for 4+ Months and All Homeless General Relief Recipients ............................................................................................45 20 GR Voucher Recipient Costs When Homeless vs. When Not Homeless..........................46 21 Monthly Public Costs Before and During GR Voucher Housing......................................47 22 Average Monthly Costs for General Relief Emergency Housing Voucher Recipients by Service Provider – 2008 dollars..............................................................................48 23 Average Monthly Costs and Savings for Homeless Single Adults Broken Out by Age, Jail History in Past 5 Years, Substance Abuse and/or Mental Illness, Disability, and Employment in Past 3 Years .............................................................................................55 24 Funding Sources for the Americas Hotel...........................................................................58 25 Funding Sources for the Boyd Hotel .................................................................................59 26 Funding Sources the St. George Hotel...............................................................................59

viii
List of Tables
1 Estimates of Los Angeles County Homeless Population 2002 to 2009...............................5 2 Average Monthly Costs and Savings for Public Services Received by Supportive Housing Residents and Matched-Pair Homeless Comparison Group.......25 3 Overall Average Monthly Savings for Residents in Supportive Housing after Operating and Capital Costs for Housing and Costs for Public Services............30 4 Rent and Rent Subsidy for Supportive Housing Residents ...............................................34 5 Comparison of Average Monthly Cost Change for Similar Individuals Living in General Relief Voucher Housing and Supportive Housing.....................................49 6 Overview of Eight Cost Comparisons in Study.................................................................54 A1 Within-Group Distributions for Housed, Matched Unhoused, and within the Unhoused Pool .............................................................................................................67 A2 Six-Variable Breakouts of Average Monthly Costs of 9,186 Los Angeles County
General Relief Recipients in Months when Homeless ................................................71 A3 Six-Variable Breakouts of Average Monthly Costs of 9,186 Los Angeles County
General Relief Recipients in Months when Not Homeless .........................................77 A4 Single Variable Breakouts of Average Monthly Costs of 9,186 Los Angeles
County General Relief Recipients in Months when Homeless....................................83 A5 Single Variable Breakouts of Average Monthly Costs of 9,186 Los Angeles
County General Relief Recipients in Months when Not Homeless.............................85 A6 Single-Variable Breakouts of Average Monthly Costs in Months they were
Housed for 855 Los Angeles County General Relief Recipients that Received Emergency Housing Vouchers for 4+ Consecutive Months .......................................87
A7 Single-Variable Breakouts of Average Monthly Costs in Months they were Homeless for 820 Matched-Pair Group Members Identified through Propensity Scores as Comparable to Los Angeles County General Relief Recipients that Received Emergency Housing Vouchers for 4+ Consecutive Months........................89
A8 Single-Variable Breakouts of Average Monthly Costs in Months they were Homeless for 855 Los Angeles County General Relief Recipients that Received Emergency Housing Vouchers for 4+ Consecutive Months........................91
A9 Six –Variable Breakout of Average Monthly Costs in Months they were Homeless for 855 Los Angeles County General Relief Housing Voucher Recipients and their Matched Pair Comparison Group in Months when Homeless.....................................93
A10 Five-Variable Breakouts of Average Monthly Costs of 9,186 Los Angeles County General Relief Recipients in Months when Homeless ................................................95
A11 Five-Variable Breakouts of Average Monthly Costs of 9,186 Los Angeles County General Relief Recipients in Months when Not Homeless .......................................103


Chapter 1
Executive Summary
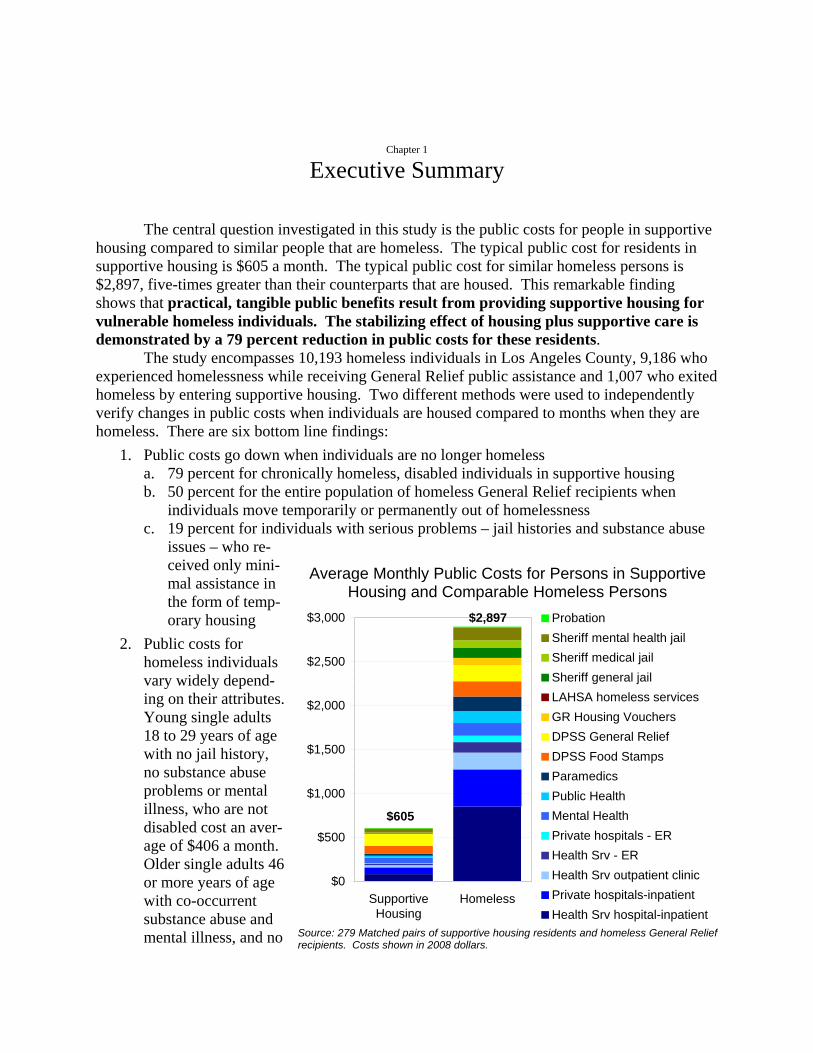
The central question investigated in this study is the public costs for people in supportive housing compared to similar people that are homeless. The typical public cost for residents in supportive housing is $605 a month. The typical public cost for similar homeless persons is $2,897, five-times greater than their counterparts that are housed. This remarkable finding shows that practical, tangible public benefits result from providing supportive housing for vulnerable homeless individuals. The stabilizing effect of housing plus supportive care is demonstrated by a 79 percent reduction in public costs for these residents. The study encompasses 10,193 homeless individuals in Los Angeles County, 9,186 who experienced homelessness while receiving General Relief public assistance and 1,007 who exited homeless by entering supportive housing. Two different methods were used to independently verify changes in public costs when individuals are housed compared to months when they are homeless. There are six bottom line findings:
1. Public costs go down when individuals are no longer homeless a. 79 percent for chronically homeless, disabled individuals in supportive housing b. 50 percent for the entire population of homeless General Relief recipients when
individuals move temporarily or permanently out of homelessness c. 19 percent for individuals with serious problems – jail histories and substance abuse
issues – who re-ceived only mini-mal assistance in the form of temp-orary housing
2. Public costs for homeless individuals vary widely depend-ing on their attributes. Young single adults 18 to 29 years of age with no jail history, no substance abuse problems or mental illness, who are not disabled cost an aver-age of $406 a month. Older single adults 46 or more years of age with co-occurrent substance abuse and mental illness, and no
Average Monthly Public Costs for Persons in Supportive Housing and Comparable Homeless Persons
$0
$500
$1,000
$1,500
$2,000
$2,500
$3,000
SupportiveHousing
Homeless
Probation Sheriff mental health jail Sheriff medical jail Sheriff general jailLAHSA homeless servicesGR Housing VouchersDPSS General ReliefDPSS Food StampsParamedicsPublic HealthMental HealthPrivate hospitals - ERHealth Srv - ERHealth Srv outpatient clinicPrivate hospitals-inpatientHealth Srv hospital-inpatient
$605
$2,897
Source: 279 Matched pairs of supportive housing residents and homeless General Relief recipients. Costs shown in 2008 dollars.
2 Where We Sleep
recent employment history cost an average of $5,038 a month. A range of solutions is required that match the needs of different groups in the homeless population.
3. Public costs increase as homeless individuals grow older. There is a strong case for intervening early rather than deferring substantive help until problems become acute.
4. Most savings in public costs come from reductions in health care outlays – 69 percent of the savings for supportive housing residents are in reduced costs for hospitals, emergency rooms, clinics, mental health, and public health.
5. Higher levels of service for high-need individuals produce higher cost savings, as shown by the higher savings from supportive housing compared to voucher housing, and by the higher saving for supportive housing residents in service-rich environments.
6. One of the challenges in addressing homelessness is housing retention – keeping individuals who may well be socially isolated, mentally ill and addicted from abandoning housing that has been provided for them.
Recommended Solutions Link housing strategies to cost savings – The cost map for single homeless adults developed through this study can guide cost effective housing strategies.
Strengthen government-housing partnerships and leverage resources – It is difficult to convert cost savings of hospitals and other public agencies into cash that can be reallocated to underwrite supportive housing because the demand for these agencies’ services often exceeds the number of people they can serve. The homeless person who is not served may simply open up a hospital bed for another sick person. However, there is a powerful public interest in housing homeless persons and reducing the public costs for crises in their lives. It is critically important to expand the role of public agencies in providing on-site services for supportive housing, including mental health and drug and alcohol services, and SSI advocacy. It is also critically important to use available funds, such as General Relief, to house more homeless people.
Improve retention rates for individuals in supportive housing – Supportive housing organizations need public help in providing higher levels of on-site services to improve housing retention rates. Individuals with above-average risks of leaving housing include those that have co-occurrent mental health and substance abuse problems, those with jail histories, and young adults.
Increase the supply of supportive housing – Los Angeles County has far less supportive housing than is needed to shelter its disabled homeless population. This housing inventory can be expanded through new construction, master leases, and scattered site rentals. All three approaches need to be expanded. There is a window of opportunity for affordable master leases in the currently less expensive housing market.
Produce information for developing comprehensive strategies and improving outcomes – Los Angeles needs to get its arms around its homeless residents by getting enough information to understand who they are and what they require, and by acting on that information to provide shelter. This includes the size and composition of the population, cycles and duration of homelessness, family and immigrant homelessness, and outcomes for those who leave housing.

Chapter 2
Study Design Purpose This study began as an investigation of public costs for chronically homeless individuals who received permanent housing and supportive services through the Skid Row Collaborative.1 As additional data became available, it expanded into a much larger study of over 10,000 homeless single adults and their housed counterparts. The housed populations include current and former residents in supportive housing provided by the Skid Row Housing Trust (SRHT) and individuals who received basic single-room-occupancy housing through Los Angeles County’s emergency housing vouchers for General Relief recipients.2 The purpose of this study is to identify public costs for different types of homeless individuals when they are housed and when they are unhoused, the extent to which any cost savings when housed are sufficient to pay the cost of housing, and the public agencies that bear these costs. Context The larger context for this study is a nationwide body of research into the cost of homelessness and the savings that are achieved by housing homeless residents, particularly individuals who are chronically homeless and mentally ill. In addition, this study builds on research and policy analysis that is specific to homelessness in Los Angeles. National Dialogue The landmark study of the public costs that are avoided by housing homeless residents was undertaken in New York City by Dennis Culhane, Stephen Metraux and Trevor Hadley. The study examined cost-offsets associated with a major initiative to provide 3,700 units of supported housing targeted to nearly 10,000 homeless persons with severe mental illness. It was published in 2002 and showed that people with a severe mental illness who were homeless used an average of $40,500 per year in services (1998 dollars). Once housed, people used fewer services, for an average decline of $16,200 in expenditures per occupied unit per year. Costs that were tracked included health, corrections and shelter service. The cost of the supported housing intervention was $17,200 per unit per year, resulting in a net cost of approximately $1,000 per unit per year. The study provided significant evidence that ending homelessness among people in New York City with severe mental illness was nearly a break-even proposition.3 The following brief survey of subsequent “cost avoidance” research draws on two reviews of the body of literature prepared by Dennis Culhane and coauthors.4 Nearly 50 American communities have undertaken local studies to determine the costs of providing services to chronically homeless persons. The finding that homeless persons reduce their utilization of acute care services such as inpatient hospitalizations and jail stays subsequent to housing placement is nearly universal.5
4 Where We Sleep
Findings about the cost of public services for homeless residents and the savings obtained after providing housing have varied widely among communities. Factors that affect findings include the severity of disabilities in the population that is studied, size of the sample, level of services and accessibility of services for homeless residents in the city being studied, and the types of cost information that were obtained. Studies using large and inclusive samples of chronically homeless persons have found more modest service utilization costs, and accordingly more modest savings, than studies using smaller, less inclusive samples.6
Fewer than half of the studies have examined the costs of services use by people only during homeless episodes; the others looked at people who had been homeless and then placed in housing, comparing the costs before and after their housing placement. Few have involved comparison or control groups. This diminishes the level of scientific rigor that can be attributed to many of the studies as well as confidence that their findings are generalizable rather than simply illustrative.7
Researchers, policymakers and service providers have a very limited understanding of the cost dynamics for the vast majority of homeless persons who do not have a serious mental illness and the potential economic benefits of programs that assist these persons. Much remains to be learned about the effects of different types of housing intervention for individuals that are not chronically homeless. In particular, homeless families have not been studied as intensively as single adults.8 This study was designed to address several of these methodological challenges. Costs are analyzed for the specific months in which individuals are known to be homeless. Multiple types of cost comparisons are made, the most rigorous being comparison groups comprised of homeless individuals identified as matching the attributes of housed counterparts based on propensity scores.9 This study investigates public costs for over 10,000 homeless individuals with a broad range of attributes and widely varying degrees of vulnerability, and breaks out costs for detailed subgroups within the overall population. Los Angeles Dialogue
Who is homeless in Los Angeles County? What kinds of help do different groups need to escape homelessness? How many people need each kind of help? What are the public costs for different groups of homeless persons? Answers to these practical questions are just beginning to emerge and to provide the rough outlines of a realistic plan for addressing homelessness.
Homeless individuals are defined by the absence of crucial connections that give us much of our information about the American population, making it difficult to delineate the size and characteristics of these residents. One or more of the following connections are typically absent from the lives of homeless individuals and families:10
1. Housing, which provides the framework for enumeration of the American population by the Census Bureau.
2. Place, homeless individuals have exceptionally high mobility rates. 3. Family, the long-term homeless are often single individuals without active family
connections. From the research of others 11 and subsequent local work we know that the homeless
people who we see on a given day at shelters and meal programs or on sidewalks are

Study Design 5
predominantly individuals who have been homeless for extended periods. Yet the total population that is homeless over the course of a year is predominantly people who have had shorter stints of homelessness, and many of them are in families. In other words, when the music stops and we look at those who are un-housed rather housed on a given night, most of the homeless “slots” are taken up by people who have held them for a long time. However, because a much larger population of precariously housed individuals cycles through the smaller number of short-term homeless “slots”, they account for a majority of the people who experience homelessness over the course of a year. This population is not static. Homelessness is the most extreme manifestation of poverty and the population in poverty fluctuates with the economy12 as well as with the trajectories of individual lives. Many people experience stints of poverty and a few remain fixed in poverty. Some, especially the most destitute, experience stints of homelessness; for some this is a page or a chapter in their lives, but for others homelessness becomes the entire story.
There is evidence, including in this study, that the impacts of protracted homelessness become progressively more severe over time. Older homeless individuals are likely to have more problems and higher public costs than younger people. The range of needs, as well as the range of autonomous capabilities, among homeless persons calls for a broad array of types of housing assistance. However, Los Angeles does not yet have enough reliable information about the composition of its point-in-time and annual homeless populations to plan comprehensive, balanced housing strategies.
Los Angeles is generally thought to have more homeless residents than any other U.S. urban area, with an unusually high proportion of those residents living without shelter on the streets, alleys, and overpasses, or in cars, doorways or encampments.13 Table 1 shows the four most recent estimates of Los Angeles County’s homeless population, with significant divergence in the shares that are chronically homeless versus members of families.14
Table 1 Estimates of Los Angeles County Homeless Population 2002 to 2009
Bring LA Home 2002
Homeless Count 2005
Homeless Count 2007
Homeless Count 2009
Point-in-Time (PIT) Homeless Population 78,600 88,345 73,702 48,053 PIT as % of Poverty Population 4.7% 5.4% 5.1% 2.8% % of PIT Chronically Homeless 17% 49% 33% 24% % of PIT in Families 43% 24% 24% 11%
Annual Homeless Population 232,600 237,648 152,261 96,169 Annual as % of Poverty Population 14% 15% 11% 6%
Los Angeles County Poverty Population 1,658,000 1,626,000 1,437,000 1,745,000
The four point-in-time (PIT) homeless estimates as a percent of the poverty population in the year of the estimate range from 2.8 to 5.4 percent. The highest estimate of the share of the poverty population that is homeless is nearly double the lowest and most recent estimate.15
Estimates of the annual homeless population have varied more widely than estimates of the point-in-time population – from 6 to 15 percent of the poverty population. Divergent estimates of the size of the annual homeless population are the result of divergent estimates of the composition of the point-in-time homeless population, particularly the share that is
6 Where We Sleep
chronically homeless and turns over very little, and the share in families, which typically have access to higher welfare benefits, short stints of homelessness and more turnover. More turnover means a larger annual population and less turnover means a smaller population.
Strengths and limitation of the four most recent estimates of the composition and annual size of the homeless population include:
• The 2002 estimate by the Economic Roundtable was based on records for 216,708 public assistance recipients who experienced homelessness during that year. A strength of this data set is that eligibility for public assistance requires documentation and verification of information, making this a convincing measure of the number of people that experienced homelessness over the course of that year. This large record set was a rich source of data about the demography and family structure of homeless persons but a limitation was that it did not provide reliable information about the duration of homeless stints.16 A second limitation was that the estimate of chronically homeless persons included only those that were homeless for twelve or more consecutive months. This is more restrictive than HUD’s definition.17
• A limitation of the 2005 estimate was that a non-random survey that was conducted to determine the composition of the homeless population. Because the survey was non-random, it cannot be counted on to be representative of the overall homeless population.18
• A limitation of the 2007 count was that a non-random survey was again conducted to estimate the composition of the homeless population.19 A second limitation was that the annual estimate was based on a formula from a national study for projecting the annual population when no personal information is available about the homeless population rather than on information specific to Los Angeles County.20
• A strength of the 2009 count was that it covered more census tracts than previous counts. A second strength was that it surveyed a random sample of homeless persons to obtain information about their characteristics. The estimate that 24 percent of the population is chronically homeless closely matches HUD’s national estimate of 23 percent. 21 A limitation is that the estimate of the annual population does not appear to be based on information specific to Los Angeles County.22
The most serious uncertainty in these estimates of the homeless population is the annual number and characteristics of individuals that experience homelessness. There is a significant disparity between the lowest annual estimate that under one-hundred-thousand people were homeless in a year with a high poverty rate whereas nearly a quarter of a million people were identified as being homeless in a year when the poverty rate was lower.
Los Angeles does not yet have consistent information about the characteristics of people who are homeless or how those characteristics affect the duration of homelessness. The impact of this lack of consistent information about the composition of the homeless population for housing policy is that Los Angeles does not have a road map for meeting the housing needs of homeless residents. Many chronically homeless are disabled and need supportive housing, whereas many people with short stints of homelessness and less acute problems simply need some form of affordable housing. Better information about the composition of the homeless population will guide better and more confident planning about the mix of housing needed by homeless residents.

Study Design 7
A range of affordable and supportive housing is needed for Los Angeles’ large, diverse homeless population. This study seeks to provide some missing pieces of information about the characteristics of single homeless adults in Los Angeles County, the size of subgroups within this population, and their public costs when homeless and housed. People A major strength of this study is the large population for which a wide range of data was available. The study encompasses 10,193 homeless individuals in Los Angeles County; 9,186 who experienced homelessness while receiving General Relief public assistance and 1,007 who exited homelessness by entering supportive housing provided by Skid Row Housing Trust (Figure 1). We have complete cost data for General Relief recipients from January 2006 through October 2007, and for SRHT residents from July 2005 through December 2008.23
Each population is distinct and provides valuable information. The 1,007 current and former residents in Skid Row Housing Trust (SRHT) supportive housing provide information about public costs when disabled individuals, many with histories of mental illness and substance abuse, receive housing and comprehensive case management services. Information about these individuals’ characteristics, services and costs was extracted from records of the county departments of Health Services, Mental Health, Public Health, Public Social Services, Probation, and Sheriff, and the Los Angeles Homeless Services Authority.24 Costs of inpatient and emergency room services at private hospitals, and emergency medical transportation were estimated.25
The 9,186 General Relief recipients with documented episodes of homelessness,26 out of the 13,176 General Relief recipients in LA County’s Adult Linkage Project,27 provide information about monthly homeless status28 as well as the same information about client characteristics, public services and costs that was obtained for SRHT residents. This provides a large comparison population of unhoused individuals.
We use information about the characteristics and costs of these two populations in multiple ways to compare costs when homeless to costs when housed. Analyses that we report on include:
1. Comparison of costs for persons in supportive housing with comparable homeless individuals. Comparison groups are identified based on: a. Two-hundred-seventy-nine matched pairs of housed and homeless individuals
identified through a statistical methodology known as propensity score matching explained in Appendix 1.
b. Individuals with similar gender, age, work histories, and disability status. c. Comparison of pre-housing costs for Project 50 residents in months when they
were homeless with costs of comparable individuals residing in Skid Row Housing Trust apartments, using propensity score matches. 29
d. Comparison of costs for housed participants in the Skid Row Collaborative Project with comparable homeless individuals using propensity score matches.30
e. Breakouts of the costs typically paid by each public agency before and after individuals are housed.

8 Where We Sleep
2. Comparison of costs for persons who have left supportive housing with comparable individuals residing in supportive housing. Comparison groups were identified based on: a. Two-hundred-thirty-eight matched pairs of individuals based on similar
propensity scores.
Figure 1 Populations in Study
13,176 General Relief recipients (Adult Linkage Project, 22-month cost window)
9,186 Homeless Persons (homeless 1+ months out of 22)
1,007 residents
Skid Row Housing Trust (42-month cost window)
322 Persons 12+ months of cost data
while housed
261 Persons 12+ months of housing and 12+
months of post-housing cost data
3,372 Persons General Relief emergency housing
vouchers 1+ months
855 persons 4+ continuous months of housing vouchers
Skid Row Collaborative 53 - 12+ months housing
Project 50 44 persons

Study Design 9
b. Breakouts of costs typically paid by each public agency before and after individuals have left housing.
3. Analysis of costs for 9,186 General Relief recipients with episodes of homelessness, including: a. Costs when homeless and when not homeless for subpopulations broken out by
gender, age, work experience, disability, mental health, substance abuse history, incarceration history, veteran’s status, nativity, language, ethnicity, and HIV/AIDS status.
b. Percent of months homeless for each subpopulation. c. Breakout of the costs typically paid by each public agency for each subpopulation
when individuals are homeless and when they are housed. d. Breakouts of costs before and during housing for 855 individuals who received 4
or more continuous months of General Relief emergency housing vouchers.
In addition, we examine the geographic origins of homeless General Relief recipients. Costs Methods of Comparing Costs Two different methods are used in this study to estimate public costs for homeless individuals, with limited additional use of a third method. None of these methods is completely reliable by itself, but each method provides a double-check for findings produced by other methods.
1. Comparison groups formed through matched pairs based on propensity scores. Matching on propensities is a powerful statistical technique that incorporates all of the descriptive data about people in a group that reliably defines that group and reduces it to a single score – this score is the propensity of individuals to be in that group. Some members are highly typical of a group and they will have high propensity scores. Other members have few of the traits that characterize a group and they will have low propensity scores. After propensity scores are calculated for each member of a group, for example, formerly homeless people living in supportive housing, the same fields of descriptive data that were used to calculate propensity scores for the group are used again to calculate the propensity scores of candidates for a comparison group. In this example, the comparison group candidates are homeless General Relief recipients. The final step in creating the comparison group is to create matched pairs with similar propensity scores. In this example the pairs are made up of one person in housing and a second similar homeless person who becomes part of the comparison group. This is the most unbiased and statistically reliable tool available in this study for comparing costs of housed individuals with their homeless counterparts, however it is not a perfect tool, and for this reason, other methods of comparison are used in parallel with propensity score matches. The 15 fields of descriptive data available for computing propensity scores are listed below. Propensity score methodology is explained further in Appendix 1.31
10 Where We Sleep
i. Gender ii. Ethnicity (African American, Latino, White, Other)
iii. Nativity (U.S., non-U.S.) iv. Language (Spanish, English, Other) v. Age
vi. Veteran status vii. Jail record
viii. Jail medical facility record ix. Jail mental health facility record x. Probation record
xi. Employment earnings record xii. Mental illness
xiii. Substance abuse problem xiv. Disability xv. HIV/AIDS status
2. Comparison of costs for the same group of individuals when homeless and when housed. The strength of this method is that no comparison group is needed – the cost data being compared is for the same individuals. The quite serious limitation of this method is that the pre-housing data for individuals may capture a crises period in which their problems peaked. When we look at month-by-month data for subjects in this study, we often see cost spikes before individuals enter housing. This interval of heightened services at a turning point in a person’s life may well not be typical of his or her longer-term pattern of service usage and public costs.32 The population in this study for which this method is most feasible is the 9,186 homeless General Relief recipients. Many people in this population appear to cycle frequently from homelessness to short-term or precarious housing, and then back to homelessness. We do not understand these dynamics well enough to know how the severity of problems and also the availability of service varies at different points in this cycle, but these variations are likely to affect public costs.
3. Comparison groups based on common attributes. This method uses descriptive information obtained from individuals’ records with public agencies to break them into detailed subgroups that share common characteristics. A strength of this approach is that comparisons are made between groups with similar characteristics that are identified in existing public records. If housing referral decisions were made using the same combinations of existing administrative data shown in this report, the impact on public costs might well be similar to what is shown by this type of comparison. A limitation of this method of comparison is that a large sample is required to break out detailed subgroups that are still large enough to yield reliable data. The group in this study that is best suited for this method is the 9,186 homeless General Relief recipients. Fifteen variables were available across all groups in this study for breaking out subpopulations.
The most reliable method of comparing costs, random assignment of individuals to a
treatment group (for example, supportive housing) and a control group (for example, no unusual interventions to end homelessness) was not possible in this project.33 An offsetting strength of

Study Design 11
this project is the large number of homeless individuals that was studied and the multiple ways in which costs were analyzed. Cost Windows
Two different windows of cost data were available. For the 9,186 homeless General Relief recipients from the Adult Linkage Project, there were 22 months of cost data, from January 2006 through October 2007.34 For the 1,007 current and former residents of the Skid Row Housing Trust, there were 42 months of cost data, from July 2005 through December 2008. All costs were converted to 2008 dollars and calculated on an average monthly basis. Types of Costs Identified Seventeen types of costs could be determined for all persons in this study, based on data provided by county departments and other agencies:
1. Los Angeles County Department of Health Services hospitals-inpatient35 2. Los Angeles County Department of Health Services outpatient clinics 3. Los Angeles County Department of Health Services emergency rooms 4. Private hospitals-inpatient36 5. Private hospitals-emergency room37 6. Emergency Medical Transportation38 7. Los Angeles County Department of Mental Health 8. Los Angeles County Department of Public Health39 9. Los Angeles County Department of Public Social Services Food Stamps40 10. Los Angeles County Department of public Social Services General Relief41 11. Los Angeles County Department of Public Social Services GR Housing Vouchers42 12. Los Angeles Homeless Services Authority services43 13. Los Angeles County Probation Department44 14. Los Angeles County Sheriff’s Department general jail facilities and services45 15. Los Angeles County Sheriff’s Department medical jail facilities and services46 16. Los Angeles County Sheriff’s Department mental health jail facilities and services 17. Supportive housing costs of the Skid Row Housing Trust
Twelve types of costs could not be determined and are left out of this study:
1. Homeless services not in shown in the Los Angeles Consortium of Care Homeless Management Information System (HMIS) and not directly funded by LAHSA. These missing costs include a significant number of agencies funded by LAHSA, matching costs by all LAHSA service providers, and all nonprofit service providers not funded by LAHSA, including faith-based missions and food pantries.
2. Non-county outpatient clinics such as JWCH Institute or Homeless Health Care Los Angeles47
3. Non-county substance abuse facilities 4. Non-county mental health facilities 5. Veteran's Administrations services
12 Where We Sleep
6. State incarceration and parole 7. Federal incarceration 8. City of Los Angeles Police Department 9. Courts 10. Business environment impacts 11. Los Angeles City Business Improvement Districts 12. Costs outside of Los Angeles County
These twelve types of costs were unavailable for both housed and homeless individuals in this study, so the absence of this data did not create any asymmetry in cost comparisons. However, this missing data results in understating the amount of public costs for homeless residents, and where there are cost savings from housing homeless individuals, to understate the amount of those savings. It is also important to note that some of the public costs presented in this study include only direct client costs and not total organizational administrative overhead and capital costs for facilities. Our review of cost information indicates that a reasonable approximation of total costs, including overhead and facilities, is shown for Department of Health Services inpatient, emergency room and outpatient services, private hospital inpatient and emergency room services, emergency medical transportation, and Department of Public Social Services Food Stamps and General Relief. Only client-linked direct costs are shown for the Department of Mental Health, Department of Public Health, Department of Public Social Services General Relief housing vouchers, Probation Department, Sheriff's general jail, medical and mental health jail facilities, and services funded by the Los Angeles Homeless Services Authority.
Incomplete cost data has two effects on this analysis: 1. Public costs are somewhat under-stated in comparison to supportive housing costs,
because supportive housing costs include capital costs and administrative overhead. 2. Cost savings are somewhat under-stated because there are cost savings for most
housed individuals, and to the extent that not all public costs are visible, not all savings are visible.
Supportive Housing
All of the supportive housing residents in this study were housed by the Skid Row Housing Trust (SRHT). SRHT is a non-profit housing, community development, and social services organization that provides permanent, affordable, independent apartments and supportive services to homeless and very low-income individuals. Currently, the Trust provides 1,325 units of permanent affordable housing; most of it for formerly homeless individuals. Skid Row Housing Trust has adopted the Housing First approach to addressing homelessness, together with a harm reduction approach to service delivery. Homeless individuals enter supportive housing as quickly as possible regardless of the challenges they are experiencing. A range of services are then immediately offered to tenants to help them achieve stability, remain housed, and enhance their overall well-being. Housing is not contingent upon participation in services. Through a variety of early engagement and community-building activities, coupled with a safe, supportive environment, easy access to services, no predetermined sequence or set of
Study Design 13
services, and a highly client-driven approach to developing a services plan, staff engages residents in services designed meet their specific needs.
SRHT residents in this study were in buildings with two types of services configurations. In buildings constructed and renovated since 2003, the Trust has created dedicated supportive service space. Two of the buildings included in this study were opened after 2003 and have dedicated space for supportive services – the Rainbow and St. George. This allows provision of on-site services including primary medical care and psychiatric services. These services are provided through community partners that work with Trust staff as members of an integrated services team.
On-site Resident Services Coordinators (RSCs) are responsible for providing comprehensive case management services. RSCs meet regularly with residents, conduct initial and on-going assessments, update individual service plans, coordinate resident care with providers in the community as needed, and offer on-site life skills, psychoeducational, and interest-oriented groups as well as socialization activities. RSCs also work with residents to develop resident-run groups and activities. In buildings with limited dedicated service space to meet the residents’ needs for medical care, mental health and psychiatric services and benefits advocacy, RSCs facilitate residents’ access to community-based services. Summary
The purpose of this study is to identify public costs for different types of homeless individuals when they are housed and when they are unhoused, the extent to which any cost savings when housed are sufficient to pay the cost of housing, and the public agencies that bear these costs.
This study joins a nationwide body of research demonstrating that public costs are saved when disabled and mentally ill homeless individuals are housed. However, there is very limited understanding of the cost dynamics for homeless persons who do not have a serious mental illness. In particular, homeless families have not been studied as intensively as single adults.
Los Angeles does not have reliable information about the characteristics of people who are homeless, how those characteristics affect the duration of homelessness, or the dynamics of entrances into and exits out of homelessness among precariously housed individuals.
A major strength of this study is the large population for which a wide range of data was available. The study encompasses 10,193 homeless individuals in Los Angeles County; 9,186 who experienced homelessness while receiving General Relief public assistance and 1,007 who exited homelessness by entering supportive housing.
Two primary methods are used in this study to estimate public costs for homeless individuals when housed and unhoused: 1) comparison groups formed through matched pairs based on propensity scores – the most reliable method, and 2) comparison of longitudinal costs for the same group of individuals when homeless and when housed. Limited use is made of a third method: 3) comparison groups based on common attributes. To the extent that these different methods show similar results, they provide additional validation for findings from this study.
Some but not all public costs resulting from homelessness are captured in this study. Most expenditures by Los Angeles County departments are captured. To the extent that cost data

14 Where We Sleep
is missing, this study understates the amount of public costs for homeless residents, and where there are cost savings from housing homeless individuals, the study understates the amount of those savings.
Chapter 3
Public Costs When Homeless
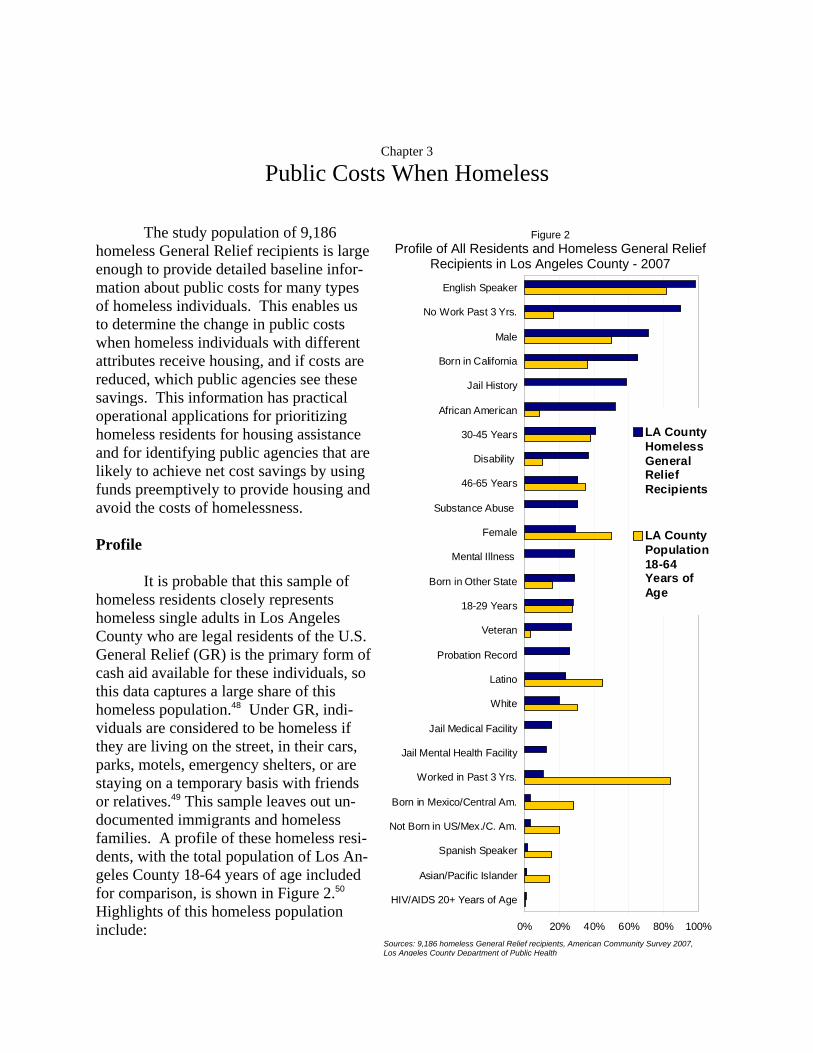
The study population of 9,186 homeless General Relief recipients is large enough to provide detailed baseline infor-mation about public costs for many types of homeless individuals. This enables us to determine the change in public costs when homeless individuals with different attributes receive housing, and if costs are reduced, which public agencies see these savings. This information has practical operational applications for prioritizing homeless residents for housing assistance and for identifying public agencies that are likely to achieve net cost savings by using funds preemptively to provide housing and avoid the costs of homelessness. Profile It is probable that this sample of homeless residents closely represents homeless single adults in Los Angeles County who are legal residents of the U.S. General Relief (GR) is the primary form of cash aid available for these individuals, so this data captures a large share of this homeless population.48 Under GR, indi-viduals are considered to be homeless if they are living on the street, in their cars, parks, motels, emergency shelters, or are staying on a temporary basis with friends or relatives.49 This sample leaves out un-documented immigrants and homeless families. A profile of these homeless resi-dents, with the total population of Los An-geles County 18-64 years of age included for comparison, is shown in Figure 2.50 Highlights of this homeless population include:
Figure 2 Profile of All Residents and Homeless General Relief
Recipients in Los Angeles County - 2007
0% 20% 40% 60% 80% 100%
HIV/AIDS 20+ Years of Age
Asian/Pacific Islander
Spanish Speaker
Not Born in US/Mex./C. Am.
Born in Mexico/Central Am.
Worked in Past 3 Yrs.
Jail Mental Health Facility
Jail Medical Facility
White
Latino
Probation Record
Veteran
18-29 Years
Born in Other State
Mental Illness
Female
Substance Abuse
46-65 Years
Disability
30-45 Years
African American
Jail History
Born in California
Male
No Work Past 3 Yrs.
English Speaker
LA CountyHomelessGeneralReliefRecipients
LA CountyPopulation18-64Years ofAge
Sources: 9,186 homeless General Relief recipients, American Community Survey 2007, Los Angeles County Department of Public Health
16 Where We Sleep
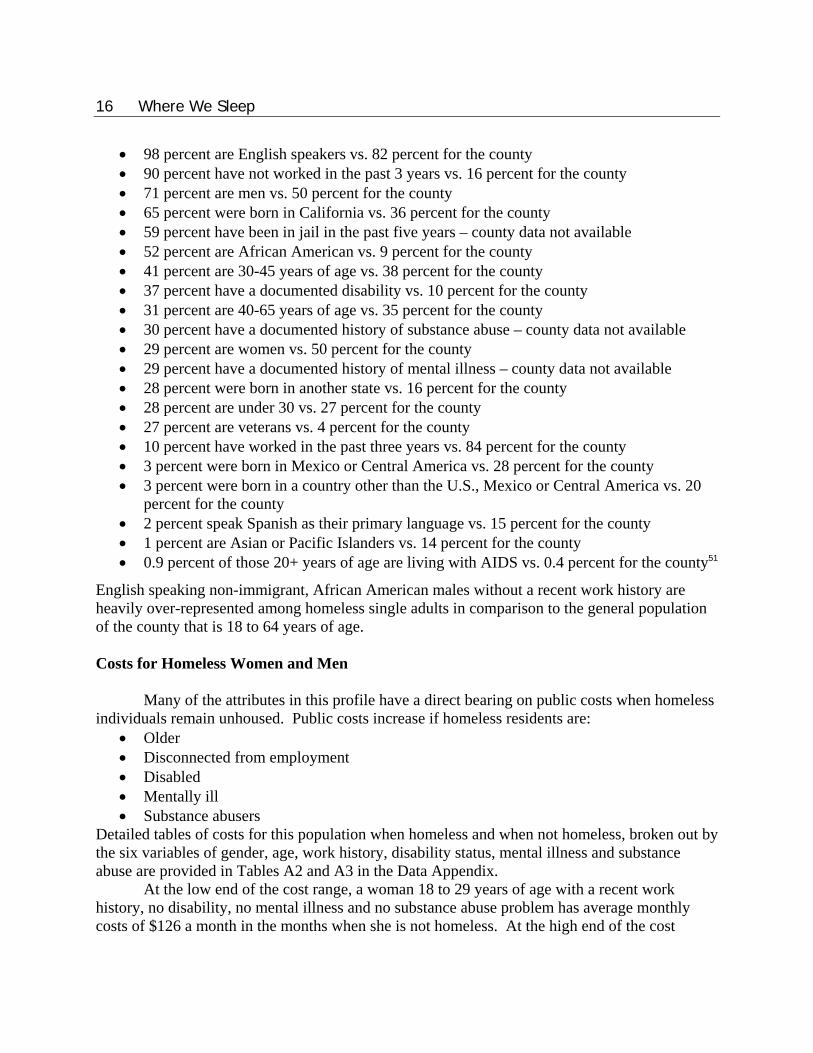
• 98 percent are English speakers vs. 82 percent for the county • 90 percent have not worked in the past 3 years vs. 16 percent for the county • 71 percent are men vs. 50 percent for the county • 65 percent were born in California vs. 36 percent for the county • 59 percent have been in jail in the past five years – county data not available • 52 percent are African American vs. 9 percent for the county • 41 percent are 30-45 years of age vs. 38 percent for the county • 37 percent have a documented disability vs. 10 percent for the county • 31 percent are 40-65 years of age vs. 35 percent for the county • 30 percent have a documented history of substance abuse – county data not available • 29 percent are women vs. 50 percent for the county • 29 percent have a documented history of mental illness – county data not available • 28 percent were born in another state vs. 16 percent for the county • 28 percent are under 30 vs. 27 percent for the county • 27 percent are veterans vs. 4 percent for the county • 10 percent have worked in the past three years vs. 84 percent for the county • 3 percent were born in Mexico or Central America vs. 28 percent for the county • 3 percent were born in a country other than the U.S., Mexico or Central America vs. 20
percent for the county • 2 percent speak Spanish as their primary language vs. 15 percent for the county • 1 percent are Asian or Pacific Islanders vs. 14 percent for the county • 0.9 percent of those 20+ years of age are living with AIDS vs. 0.4 percent for the county51
English speaking non-immigrant, African American males without a recent work history are heavily over-represented among homeless single adults in comparison to the general population of the county that is 18 to 64 years of age. Costs for Homeless Women and Men
Many of the attributes in this profile have a direct bearing on public costs when homeless individuals remain unhoused. Public costs increase if homeless residents are:
• Older • Disconnected from employment • Disabled • Mentally ill • Substance abusers
Detailed tables of costs for this population when homeless and when not homeless, broken out by the six variables of gender, age, work history, disability status, mental illness and substance abuse are provided in Tables A2 and A3 in the Data Appendix.
At the low end of the cost range, a woman 18 to 29 years of age with a recent work history, no disability, no mental illness and no substance abuse problem has average monthly costs of $126 a month in the months when she is not homeless. At the high end of the cost

Public Costs When Homeless 17
range, a man 46 to 65 years of age with no recent work history, a disability, mental illness and a substance abuse problem has public costs of $4,739 in the months when he is homeless. The typical public costs for homeless men are 40 percent higher than for homeless women. The cost progression as individuals age and have more acute problems is much the same for both sexes except that costs for the youngest group of men, those 18 to 29 years of age, with mental illness and substance abuse problems exceed those of counterparts in their middle years, 30 to 45 years of age. The energy of young men, the futility of being homeless, and the exacerbating factors of mental illness and substance abuse create significant and costly public impacts. As individuals age, the neglect that accompanies homelessness takes a physical toll. Homeless individuals 46 to 65 years of age have public health costs that are more than five times greater than for individuals under thirty years of age, creating the highest public costs of any homeless age group. Cost Deciles When we rank homeless General Relief recipients by their public costs and break them into ten groups of equal size, we find that most of the population has comparatively low public costs, as shown in Figure 4.52 Forty percent of homeless individuals have public costs of less
Figure 3 Average Monthly Costs for General Relief Recipients when Homeless – 2008 dollars
$0
$500
$1,000
$1,500
$2,000
$2,500
$3,000
$3,500
$4,000
$4,500
$5,000
No
SA, N
o M
I, N
o D
is, W
H
No
MI,
No
Dis
, WH
No
Dis
, WH
WH
All P
erso
ns in
Age
Gro
up
No
WH
Dis
abilit
y, N
o W
H
MI,
Dis
, No
WH
SA,
MI,
Dis
No
WH
No
SA,
No
MI,
No
Dis
, WH
No
MI,
No
Dis
, WH
No
Dis
, WH
WH
All P
erso
ns in
Age
Gro
up
No
WH
Dis
abilit
y, N
o W
H
MI,
Dis
, No
WH
SA
, MI,
Dis
No
WH
No
SA
, No
MI,
No
Dis
, WH
No
MI,
No
Dis
, WH
No
Dis
, WH
WH
All
Per
sons
in A
ge G
roup
No
WH
Dis
abilit
y, N
o W
H
MI,
Dis
, No
WH
SA, M
I, D
is N
o W
H
18-29 Years 30-45 Years 46-65 Years
FemalesMales
Variables: SA - Substance Abuse MI - Mental Illness Dis - Disability WH - Work History
Source: 9,186 homeless General Relief recipients in Los Angeles County

18 Where We Sleep
than $500 a month. It is the extremely high public costs of the most expen-sive 10 percent, $8,083 per month, which raises the over-all average for this population to $1,446 per month. Roughly 80 percent of homeless resi-dents have costs below this aver-age.
For the most expensive decile, 45 per-cent of costs are for hospitals and emergency rooms, and 35 percent for jails, with most of this for medical and mental health costs while incarcerated. This costly tenth accounts for over half of all public costs for homelessness. In contrast, public costs for the lowest five deciles are largely for minimal necessities – 87 percent of costs are for General Relief grants (averaging $180 per month) and Food Stamps (averaging $160 per month).
The reality that underscores the need for appropriately targeted services for all groups within the homeless population is that public costs increase as individuals age. The median age of individuals in the least expensive decile is 33 years; the median age of individuals in the most expensive decile is 42 years. If intervention is deferred until problems become acute, the solutions become much more expensive.
Figure 4 Average Monthly Costs by Decile for Homeless GR Recipients – 2008 dollars
$0
$1,000
$2,000
$3,000
$4,000
$5,000
$6,000
$7,000
$8,000
$9,000
AVE
RA
GE
Low
est D
ecile
Sec
ond
Dec
ile
Third
Dec
ile
Four
th D
ecile
Fifth
Dec
ile
Six
th D
ecile
Sev
enth
Dec
ile
Eig
hth
Dec
ile
Nin
th D
ecile
Hig
hest
Dec
ile
Probation
Sheriff mental health jail
Sheriff medical jail
Sheriff general jail
LAHSA homeless services
GR Housing Vouchers
DPSS General Relief
DPSS Food Stamps
Paramedics
Public Health
Mental Health
Private hospitals-ER
Health Srv - ER
Health Srv outpatient clinic
Private hospitals-inpatient
Health Srv hospital-inpatient
$8,083
$1,949
$1,103
$784$602$500$447$397$344$259
$1,446
Source: 9,186 homeless General Relief recipients in Los Angeles County

Public Costs When Homeless 19
Cost Savings
Public costs for typical homeless General Relief re-cipients decrease 50 percent in the months they are not home-less, from $1,446 to $728, as shown in Tables A2 and A3 in the Data Appendix. Individuals were classified as homeless in any month in which one or more of the following four conditions were met: a) their mailing ad-dress was an office of the Los Angeles County Department of Public Social Services or a homeless shelter, b) they re-ceived a GR emergency housing voucher, c) they received ser-vices funded by the Los Angeles Homeless Services Authority, or d) they began a jail stint imme-diately following a month in which they were homeless. In months when they were home-less, most were living on the street or in emergency shelters.
GR recipients were classified as not homeless in any month when none of these conditions were met. This population shows up in our data as being not homeless 51 percent of the time, with variation for the groups shown in Data Appendix Table A3 ranging from 38 to 71 percent. The available data under-reports months when individuals were homeless, and provides little information about their living circumstances in months when they were not homeless. Despite this conservative demarcation of homeless intervals, there are marked reductions in public costs during months when individuals are not shown to be homeless. Possible non-homeless living circumstances include:
• Staying with relatives or friends • Doubling up in housing with other individuals receiving cash grants • Occupying housing that is paid for with earned income • A jail stint following a month when the person was not flagged as homeless • Occupying housing with a long-term rent subsidy
Figure 5 Monthly Costs When Homeless vs. When Not Homeless
$0 $1,000 $2,000 $3,000 $4,000
Worked in Past 3 Yrs.18-29 Years
Spanish SpeakerBorn in Mex. or Central Am.
FemaleLatino
VeteranBorn in California
30-45 YearsWhite
English SpeakerNot Veteran
No Work Past 3 YearsNot Born in US, Mex., C. Am.
African AmericanMale
Born in Other StateJail History
Asian/Pacific Islander46-65 Years
Substance Abuse Disability
Mental Illness Jail Medical Facility
Jail Mental Health FacilityHIV/AIDS
Average Monthly Cost - 2008 $
MonthsHomeless
Months NotHomeless
Source: 9,186 homeless General Relief recipients in Los Angeles County

20 Where We Sleep
It would be valuable to achieve a clearer understanding of when and for whom these non-homeless outcomes occur. It is particularly important to understand how to replicate and strengthen positive outcomes such as employment and permanent housing. A recent study of the General Relief population found that nearly three quarters had held jobs in the past decade.53 Another earlier study of homeless adults in Los Angeles reported that 68 percent had worked in the past five years.54 Employment is often intermittent, generating more income than General Relief benefits, but lifting only about one-sixth of individuals out of poverty.55
When we break out individuals by discrete attributes in the months when they were homeless, we see cost savings for every group in the homeless population when costs in months they are homeless are compared to costs in months when they are not homeless, as shown in Tables A4 and A5 in the Data Appendix and Figure 5. 56 Highlights of these monthly cost savings when not homeless include:
• $1,896 or 54 percent savings for people with living with AIDS • $1,559 or 47 percent savings for people who have been in jail mental health facilities. • $1,091 or 45 percent savings for people with documented mental illness • $1,028 or 38 percent savings for people who have been in jail medical facilities • $1,021 or 46 percent savings for people with documented disabilities • $898 or 47 percent savings for people with documented substance abuse problems • $815 or 47 percent savings for people who have been in jail • $796 or 39 percent savings for people 46-65 years of age
Public Agencies Bearing the Cost of Homelessness Average monthly costs borne by service providers for homeless General Relief recipients, in months when they are homeless as well as months when they are not homeless are shown in Figure 6.57 The amount and payer of costs vary greatly depending on whether individuals are homeless in a given month and the severity of their problems. In general, costs decrease by about half in months when individuals are not homeless. General Relief recipients typically have $1,446 in costs in months when they are homeless (left cost bar in Figure 6). These costs are distributed as follows:
• 16 percent Department of Health Services hospital-inpatient • 12 percent DPSS General Relief • 11 percent DPSS Food Stamps • 10 percent Sheriff mental health jail facility • 8 percent Private hospitals-inpatient • 8 percent Sheriff general jail facility • 8 percent Sheriff medical jail facility • 5 percent Department of Public Health • 5 percent DPSS General Relief Housing Vouchers • 4 percent Paramedics • 4 percent Department of Health Services outpatient clinic • 3 percent Department of Health Services emergency room • 3 percent Department of Mental Health

Public Costs When Homeless 21
• 2 percent Private hospitals-emergency room • 1 percent Probation Department • 0.1 percent LAHSA homeless services
Health Care Costs
Costs for health problems account for the majority of all public costs for homelessness. Poor health can contribute to being homeless, and being homeless can lead to poor health. People without shelter or life stability are at greatly increased risk of illness, injury and diminished well-being. Health risks include tuberculosis, HIV/AIDS, malnutrition, severe dental problems, alcoholism, addiction, mental illness, diabetes, hypertension, and physical disabilities.
Costs for health care services provided by the county departments of Health Services and Public Health, together with private hospitals, account for 38 percent of all costs in months when individuals are homeless. The share of costs for health needs increases to 56 percent if we include the Sheriff’s medical and mental health incarceration facilities.
Health costs make up a much larger share of total costs among high-cost homeless individuals, such as the older persons with disabilities, mental illness and substance abuse problems shown in Figure 6. The groups of individuals shown in Appendix Table A2 with
Figure 6 Average Monthly Costs of Public Agencies per Homeless General Relief Recipient – 2008 dollars
$0
$500
$1,000
$1,500
$2,000
$2,500
$3,000
$3,500
$4,000
$4,500
$5,000
Homeless NotHomeless
Homeless NotHomeless
Homeless NotHomeless
All General ReliefHomeless
Female 46-65, NoWH, Disability, MI, SA
Male 46-65, No WH,Disability, MI, SA
Probation
Sheriff mental health jail
Sheriff medical jail
Sheriff general jail
LAHSA homeless services
GR Housing Vouchers
DPSS General Relief
DPSS Food Stamps
Paramedics
Public Health
Mental Health
Private hospitals-ER
Health Srv - ER
Health Srv outpatient clinic
Private hospitals-inpatient
Health Srv hospital-inpatient
Abbreviations:WH - Work History in Past 3 Years SA - Substance AbuseMI - Mental Illness
$728
$1,446
$3,659
$2,422
$4,739
$2,273
Source: 9,186 homeless General Relief recipients in Los Angeles County
22 Where We Sleep
monthly costs of $2,500 or more in months when they are homeless make up 16 percent of the homeless population but account for 46 percent of total homeless health care costs for all homeless General Relief recipients.
Forty-eight percent of the costs when homeless for these high-cost individuals are for health care, a figure that goes up to 73 percent when we include medical and mental health incarceration. Their health care costs average $1,561 in months when they are homeless, and increase to $2,366 with medical and mental health incarceration included. In months when they are not homeless, health care costs drop 56 percent, to $686 per person, or $1,062 with medical and mental health incarceration included.
Hospitalizations account for nearly two-thirds of non-incarcerated health care costs. The rate of hospitalizations increases as the number of vulnerabilities impacting individuals increase. These vulnerabilities include age, disabilities, mental illness, substance abuse and HIV/AIDS. However, even within highly vulnerable subpopulations there is significant variation in costs among individuals, largely because some individuals are hospitalized and others are not.
In the overall homeless General Relief population, only 4.6 percent of individuals were hospitalized in a county Department of Health Services hospital during a month when they were homeless within the cost window for this study (and 3.2 percent in a month when they were not homeless). Even among 229 high-risk homeless General Relief recipients who were 46-65 years of age, with no recent work history, a disability, mental illness, and substance abuse problems, only 30 percent were hospitalized during the 22-month cost window for this study. Only 21 percent were hospitalized in a month when they were homeless and an additional 9 percent were hospitalized in a month when they were not homeless.
It is possible to identify the groups that are most likely to have high health costs, but it is more difficult to identify specific individuals. Frequency of health care encounters explains only a quarter of the variation in health care costs among homeless persons.58 This suggests that in order to reduce public health care costs, it is more feasible to target housing and services toward high-risk groups rather than toward specific individuals.
Health risks and reduction of costs for health problems can most effectively be addressed by designing and targeting interventions that are responsive to the needs of specific homeless subpopulations. By reducing group rates of hospitalization, these interventions are likely to yield significant net savings in public costs. Place of Birth
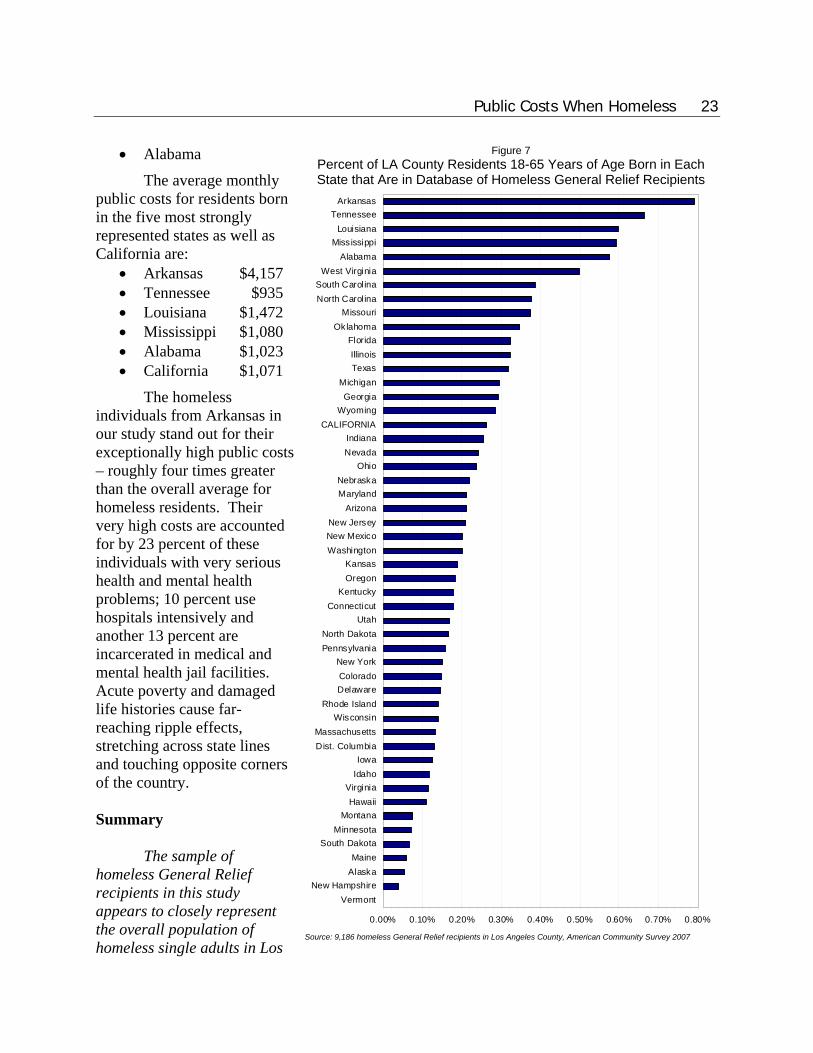
The percent of Los Angeles County residents born in each state that show up in the
database of homeless General Relief recipients investigated in this study provides a measure of over- and under-representation of individuals from other states in the homeless population. This information is shown in Figure 7.
Five Southern states with high poverty rates have the highest shares of their native sons and daughters represented among local homeless residents. These states are:
• Arkansas • Tennessee • Louisiana • Mississippi
Public Costs When Homeless 23
• Alabama
The average monthly public costs for residents born in the five most strongly represented states as well as California are:
• Arkansas $4,157 • Tennessee $935 • Louisiana $1,472 • Mississippi $1,080 • Alabama $1,023 • California $1,071
The homeless individuals from Arkansas in our study stand out for their exceptionally high public costs – roughly four times greater than the overall average for homeless residents. Their very high costs are accounted for by 23 percent of these individuals with very serious health and mental health problems; 10 percent use hospitals intensively and another 13 percent are incarcerated in medical and mental health jail facilities. Acute poverty and damaged life histories cause far-reaching ripple effects, stretching across state lines and touching opposite corners of the country. Summary
The sample of homeless General Relief recipients in this study appears to closely represent the overall population of homeless single adults in Los
Figure 7 Percent of LA County Residents 18-65 Years of Age Born in Each State that Are in Database of Homeless General Relief Recipients
0.00% 0.10% 0.20% 0.30% 0.40% 0.50% 0.60% 0.70% 0.80%
VermontNew Hampshire
AlaskaMaine
South DakotaMinnesota
MontanaHawaii
VirginiaIdahoIowa
Dist. ColumbiaMassachusetts
WisconsinRhode Island
DelawareColorado
New YorkPennsylvaniaNorth Dakota
UtahConnecticut
KentuckyOregonKansas
WashingtonNew MexicoNew Jersey
ArizonaMarylandNebraska
OhioNevadaIndiana
CALIFORNIAWyoming
GeorgiaMichigan
TexasIllinois
FloridaOklahoma
MissouriNorth CarolinaSouth Carolina
West VirginiaAlabama
MississippiLouisiana
TennesseeArkansas
Source: 9,186 homeless General Relief recipients in Los Angeles County, American Community Survey 2007

24 Where We Sleep
Angeles County who are legal residents of the United States. English-speaking non-immigrant males in their thirties to mid-forties without a recent work history are heavily over-represented among homeless single adults in comparison to the general population.
Public costs increase if homeless residents are: older, disconnected from employment, disabled, mentally ill, or substance abusers. The cost progression as individuals age and have more acute problems is much the same for both sexes except for unusually high costs for the youngest group of men, those 18 to 29 years of age, with mental illness and substance abuse problems.
Forty percent of homeless individuals have public costs of less than $500 a month. It is the extremely high public costs of the most expensive 10 percent, $8,083 per month, which raises the overall average for this population to $1,446 per month.
For the most expensive decile, 45 percent of costs are for hospitals and emergency rooms, and 35 percent for jails, with most of this for medical and mental health costs while incarcerated. In contrast, public costs for the lowest five deciles are largely for minimal necessities – 87 percent of costs are for General Relief grants and Food Stamps.
The median age of individuals in the least expensive cost decile is 33 years; the median age of individuals in the most expensive decile is 42 years. If intervention is deferred until problems become acute, the solutions become much more expensive.
Health risks and reduction of costs for health problems can most effectively be addressed by designing and targeting interventions that are responsive to the needs of specific high-risk homeless subpopulations rather than by trying to identify specific high-cost individuals. By reducing group rates of hospitalization, targeted interventions are likely to yield significant net savings in public costs.
Public costs for the typical homeless General Relief recipient decrease 50 percent in the months they are not homeless, from $1,446 to $728. Cost savings of roughly half can be seen for all subgroups of homeless General Relief recipients in months when they are not homeless.
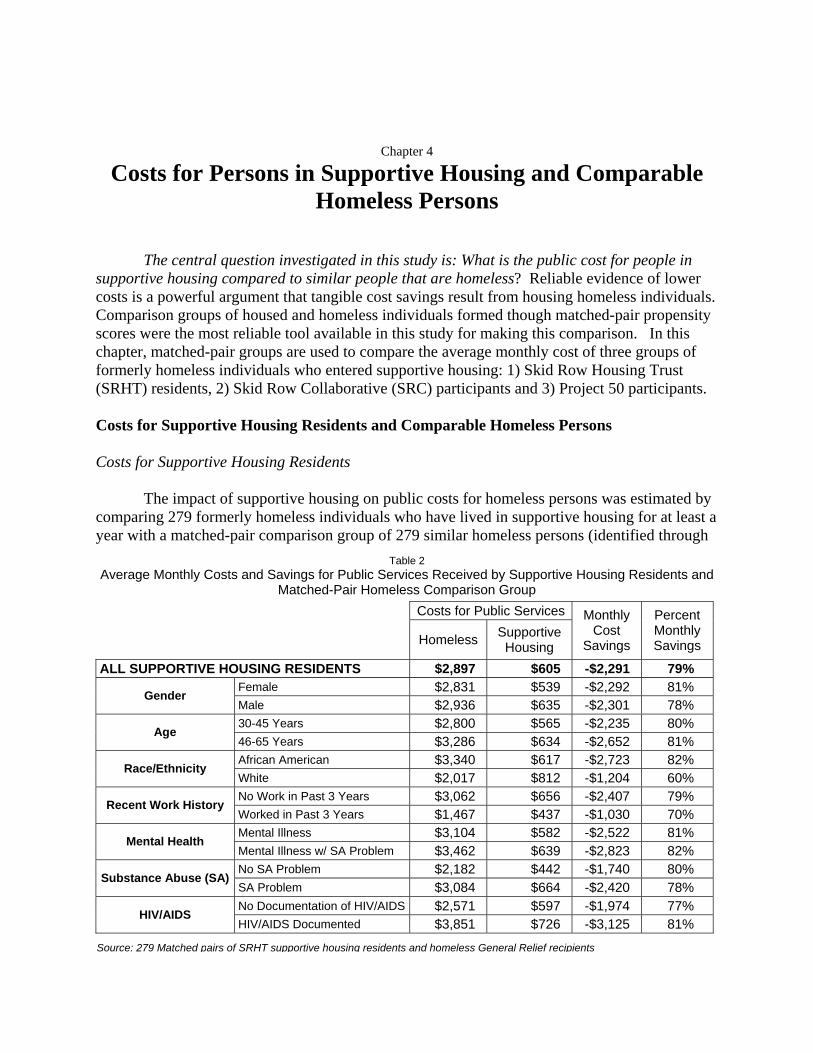
Chapter 4
Costs for Persons in Supportive Housing and Comparable Homeless Persons
The central question investigated in this study is: What is the public cost for people in supportive housing compared to similar people that are homeless? Reliable evidence of lower costs is a powerful argument that tangible cost savings result from housing homeless individuals. Comparison groups of housed and homeless individuals formed though matched-pair propensity scores were the most reliable tool available in this study for making this comparison. In this chapter, matched-pair groups are used to compare the average monthly cost of three groups of formerly homeless individuals who entered supportive housing: 1) Skid Row Housing Trust (SRHT) residents, 2) Skid Row Collaborative (SRC) participants and 3) Project 50 participants. Costs for Supportive Housing Residents and Comparable Homeless Persons Costs for Supportive Housing Residents
The impact of supportive housing on public costs for homeless persons was estimated by comparing 279 formerly homeless individuals who have lived in supportive housing for at least a year with a matched-pair comparison group of 279 similar homeless persons (identified through
Table 2 Average Monthly Costs and Savings for Public Services Received by Supportive Housing Residents and
Matched-Pair Homeless Comparison Group Costs for Public Services
Homeless Supportive Housing
Monthly Cost
Savings
Percent Monthly Savings
ALL SUPPORTIVE HOUSING RESIDENTS $2,897 $605 -$2,291 79% Female $2,831 $539 -$2,292 81%
Gender Male $2,936 $635 -$2,301 78% 30-45 Years $2,800 $565 -$2,235 80%
Age 46-65 Years $3,286 $634 -$2,652 81% African American $3,340 $617 -$2,723 82%
Race/Ethnicity White $2,017 $812 -$1,204 60% No Work in Past 3 Years $3,062 $656 -$2,407 79%
Recent Work History Worked in Past 3 Years $1,467 $437 -$1,030 70% Mental Illness $3,104 $582 -$2,522 81%
Mental Health Mental Illness w/ SA Problem $3,462 $639 -$2,823 82% No SA Problem $2,182 $442 -$1,740 80%
Substance Abuse (SA) SA Problem $3,084 $664 -$2,420 78% No Documentation of HIV/AIDS $2,571 $597 -$1,974 77%
HIV/AIDS HIV/AIDS Documented $3,851 $726 -$3,125 81%
Source: 279 Matched pairs of SRHT supportive housing residents and homeless General Relief recipients
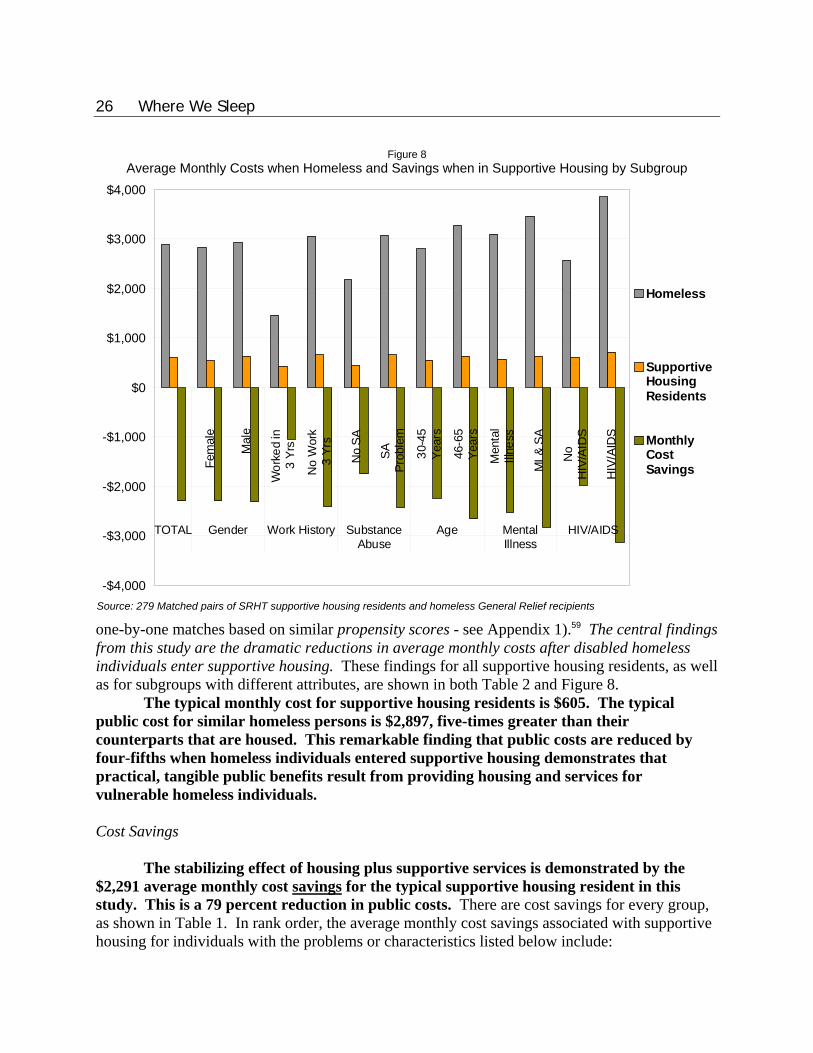
26 Where We Sleep
one-by-one matches based on similar propensity scores - see Appendix 1).59 The central findings from this study are the dramatic reductions in average monthly costs after disabled homeless individuals enter supportive housing. These findings for all supportive housing residents, as well as for subgroups with different attributes, are shown in both Table 2 and Figure 8.
The typical monthly cost for supportive housing residents is $605. The typical public cost for similar homeless persons is $2,897, five-times greater than their counterparts that are housed. This remarkable finding that public costs are reduced by four-fifths when homeless individuals entered supportive housing demonstrates that practical, tangible public benefits result from providing housing and services for vulnerable homeless individuals.
Cost Savings
The stabilizing effect of housing plus supportive services is demonstrated by the $2,291 average monthly cost savings for the typical supportive housing resident in this study. This is a 79 percent reduction in public costs. There are cost savings for every group, as shown in Table 1. In rank order, the average monthly cost savings associated with supportive housing for individuals with the problems or characteristics listed below include:
Figure 8 Average Monthly Costs when Homeless and Savings when in Supportive Housing by Subgroup
-$4,000
-$3,000
-$2,000
-$1,000
$0
$1,000
$2,000
$3,000
$4,000Fe
mal
e
Mal
e
Wor
ked
in3
Yrs
No
Wor
k3
Yrs
No
SA
SAPr
oble
m
30-4
5Ye
ars
46-6
5Ye
ars
Men
tal
Illne
ss
MI &
SA
No
HIV
/AID
S
HIV
/AID
S
TOTAL Gender Work History SubstanceAbuse
Age MentalIllness
HIV/AIDS
Homeless
SupportiveHousingResidents
MonthlyCostSavings
Source: 279 Matched pairs of SRHT supportive housing residents and homeless General Relief recipients

Public Costs and Savings While in Supportive Housing 27
HIV/AIDS - $3,125 or 81 percent cost reduction; average monthly costs decline from $3,851 when homeless to $726 when housed
Mental Illness and Substance Abuse - $2,823 or 82 percent cost reduction; average monthly costs decline from $3,462 when homeless to $639 when housed
46-65 Years of Age - $2,652 or 81 percent cost reduction; average monthly costs decline from $3,286 when homeless to $634 when housed
Mental Illness - $2,522 or 81 percent cost reduction; average monthly costs decline from $3,104 when homeless to $582 when housed
Substance Abuse - $2,420 or 78 percent cost reduction; average monthly costs decline from $3,084 when homeless to $664 when housed
No Work in Past 3 Years - $2,407 or 79 percent cost reduction; average monthly costs decline from $3,062 when homeless to $656 when housed
Cost Comparisons for Subgroups Highlights of costs when housed are shown below with a detailed breakout in Table 2.
Males in housing have an average monthly cost of $635 - 18 percent higher than for females in housing.
The average monthly cost for older persons, age 46 to 65, in housing is $634. Their costs are 12 percent higher than the costs for housed persons age 30 to 45.
Residents who have not worked in the past 3 years have an average monthly cost of $656 - 50 percent higher than residents with recent work histories.
The average monthly cost for residents that have a co-occurring mental illness and substance abuse problems is $639 - 10 percent more than for residents with only a mental illness.
The average monthly cost for residents with a substance abuse problem is $664 - 50 percent higher than for residents with no indications of a substance abuse problem.
Residents with HIV/AIDS have the highest average monthly cost at $726, which is 20 percent higher than the overall average cost for all residents.
Cost Distribution among Public Agencies when Homeless and Housed Average monthly costs borne by service providers for supportive housing residents and comparable homeless persons in this analysis are shown in Figure 9.60 The amount of costs and the payer of costs vary greatly between people that are homeless and those that are housed. The $605 average monthly cost for supportive housing residents and the $2,897 average monthly cost for comparable homeless persons are distributed as follows among service providers:
Public Agency Supportive Housing Residents Homeless • Health Services hospital-inpatient 13 percent 29 percent • Private hospitals-inpatient 13 percent 15 percent • Health Services outpatient clinic 4 percent 7 percent • DPSS General Relief 23 percent 6 percent

28 Where We Sleep
• DPSS Food Stamps 15 percent 6 percent • Paramedics 4 percent 6 percent • Sheriff mental health jail 8 percent 5 percent • Mental Health 11 percent 5 percent • Public Health 3 percent 5 percent • Health Services - ER 2 percent 4 percent • Sheriff general jail 1 percent 4 percent • Sheriff medical jail 1 percent 3 percent • GR Housing Vouchers 0 percent 3 percent • Private hospitals - ER 2 percent 3 percent • Probation 1 percent 0.3 percent • LAHSA homeless services 0 percent 0.1 percent TOTAL61 100 percent 100 percent
Costs for health care services provided by the county departments of Health Services and Public Health, together with private hospitals, account for a majority – 62 percent – of the total cost for the matched-pair comparison group of homeless persons. Department of Public Social Service costs and justice system costs account for an additional 15 percent and 12 percent of total costs for homeless persons, respectively. The distribution of costs by public agency is quite different for supportive housing residents. The major difference is the share of total costs borne
Figure 9 Average Monthly Costs by Public Agency for Persons in Supportive Housing and Homeless Persons
$0$200$400$600$800
$1,000$1,200$1,400$1,600$1,800$2,000$2,200$2,400$2,600$2,800$3,000
Supportive Housing Homeless
Probation Sheriff mental health jail Sheriff medical jail Sheriff general jailLAHSA homeless servicesGR Housing VouchersDPSS General ReliefDPSS Food StampsParamedicsPublic HealthMental HealthPrivate hospitals - ERHealth Srv - ERHealth Srv outpatient clinicPrivate hospitals-inpatientHealth Srv hospital-inpatient
$605
$2,897
Source: 279 Matched pairs of SRHT supportive housing residents and homeless General Relief recipients
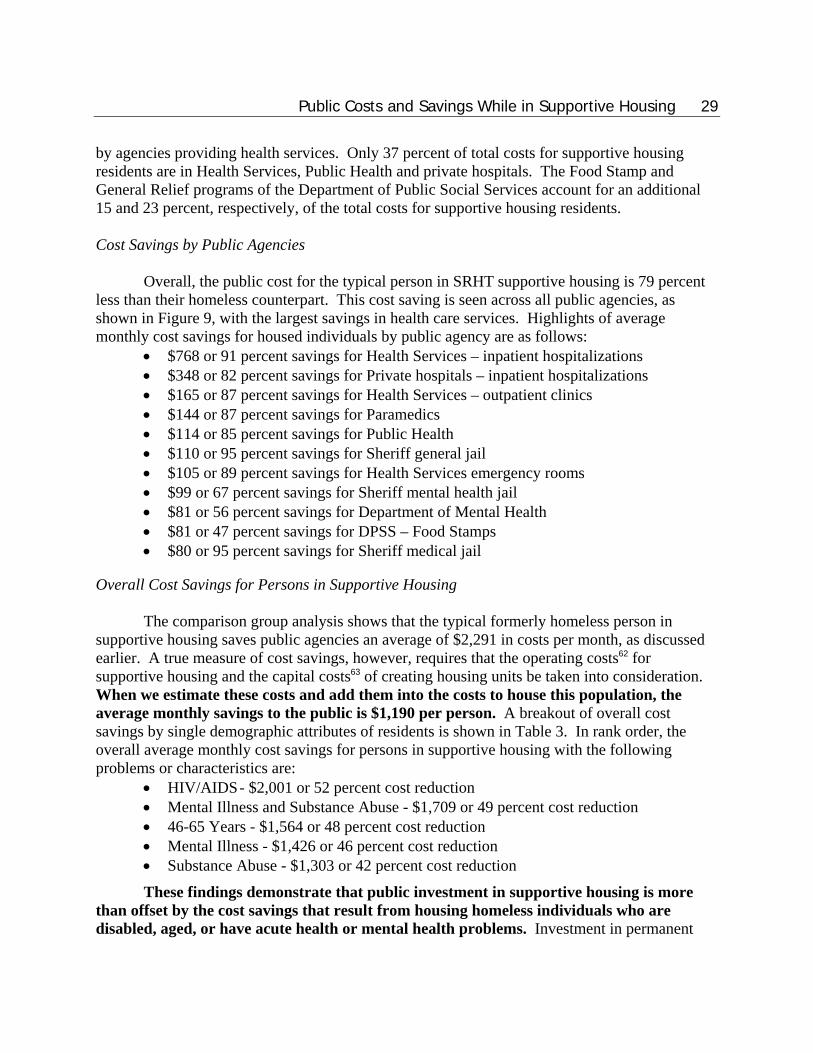
Public Costs and Savings While in Supportive Housing 29
by agencies providing health services. Only 37 percent of total costs for supportive housing residents are in Health Services, Public Health and private hospitals. The Food Stamp and General Relief programs of the Department of Public Social Services account for an additional 15 and 23 percent, respectively, of the total costs for supportive housing residents. Cost Savings by Public Agencies
Overall, the public cost for the typical person in SRHT supportive housing is 79 percent less than their homeless counterpart. This cost saving is seen across all public agencies, as shown in Figure 9, with the largest savings in health care services. Highlights of average monthly cost savings for housed individuals by public agency are as follows:
• $768 or 91 percent savings for Health Services – inpatient hospitalizations • $348 or 82 percent savings for Private hospitals – inpatient hospitalizations • $165 or 87 percent savings for Health Services – outpatient clinics • $144 or 87 percent savings for Paramedics • $114 or 85 percent savings for Public Health • $110 or 95 percent savings for Sheriff general jail • $105 or 89 percent savings for Health Services emergency rooms • $99 or 67 percent savings for Sheriff mental health jail • $81 or 56 percent savings for Department of Mental Health • $81 or 47 percent savings for DPSS – Food Stamps • $80 or 95 percent savings for Sheriff medical jail
Overall Cost Savings for Persons in Supportive Housing
The comparison group analysis shows that the typical formerly homeless person in supportive housing saves public agencies an average of $2,291 in costs per month, as discussed earlier. A true measure of cost savings, however, requires that the operating costs62 for supportive housing and the capital costs63 of creating housing units be taken into consideration. When we estimate these costs and add them into the costs to house this population, the average monthly savings to the public is $1,190 per person. A breakout of overall cost savings by single demographic attributes of residents is shown in Table 3. In rank order, the overall average monthly cost savings for persons in supportive housing with the following problems or characteristics are:
• HIV/AIDS - $2,001 or 52 percent cost reduction • Mental Illness and Substance Abuse - $1,709 or 49 percent cost reduction • 46-65 Years - $1,564 or 48 percent cost reduction • Mental Illness - $1,426 or 46 percent cost reduction • Substance Abuse - $1,303 or 42 percent cost reduction
These findings demonstrate that public investment in supportive housing is more than offset by the cost savings that result from housing homeless individuals who are disabled, aged, or have acute health or mental health problems. Investment in permanent
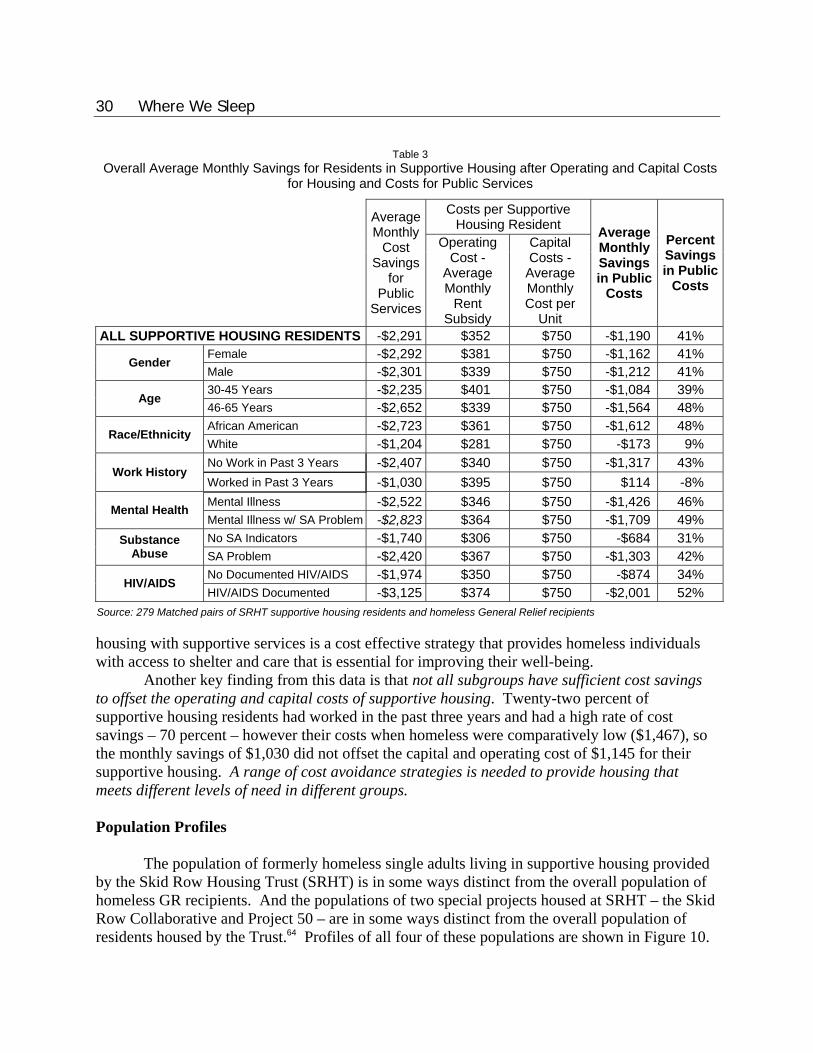
30 Where We Sleep
housing with supportive services is a cost effective strategy that provides homeless individuals with access to shelter and care that is essential for improving their well-being. Another key finding from this data is that not all subgroups have sufficient cost savings to offset the operating and capital costs of supportive housing. Twenty-two percent of supportive housing residents had worked in the past three years and had a high rate of cost savings – 70 percent – however their costs when homeless were comparatively low ($1,467), so the monthly savings of $1,030 did not offset the capital and operating cost of $1,145 for their supportive housing. A range of cost avoidance strategies is needed to provide housing that meets different levels of need in different groups. Population Profiles
The population of formerly homeless single adults living in supportive housing provided by the Skid Row Housing Trust (SRHT) is in some ways distinct from the overall population of homeless GR recipients. And the populations of two special projects housed at SRHT – the Skid Row Collaborative and Project 50 – are in some ways distinct from the overall population of residents housed by the Trust.64 Profiles of all four of these populations are shown in Figure 10.
Table 3 Overall Average Monthly Savings for Residents in Supportive Housing after Operating and Capital Costs
for Housing and Costs for Public Services
Costs per Supportive
Housing Resident
Average Monthly
Cost Savings
for Public
Services
Operating Cost -
Average Monthly
Rent Subsidy
Capital Costs -
Average Monthly Cost per
Unit
Average Monthly Savings in Public
Costs
Percent Savings in Public
Costs
ALL SUPPORTIVE HOUSING RESIDENTS -$2,291 $352 $750 -$1,190 41% Female -$2,292 $381 $750 -$1,162 41%
Gender Male -$2,301 $339 $750 -$1,212 41% 30-45 Years -$2,235 $401 $750 -$1,084 39%
Age 46-65 Years -$2,652 $339 $750 -$1,564 48% African American -$2,723 $361 $750 -$1,612 48%
Race/Ethnicity White -$1,204 $281 $750 -$173 9% No Work in Past 3 Years -$2,407 $340 $750 -$1,317 43%
Work History Worked in Past 3 Years -$1,030 $395 $750 $114 -8% Mental Illness -$2,522 $346 $750 -$1,426 46% Mental Health Mental Illness w/ SA Problem -$2,823 $364 $750 -$1,709 49% No SA Indicators -$1,740 $306 $750 -$684 31% Substance
Abuse SA Problem -$2,420 $367 $750 -$1,303 42% No Documented HIV/AIDS -$1,974 $350 $750 -$874 34%
HIV/AIDS HIV/AIDS Documented -$3,125 $374 $750 -$2,001 52%
Source: 279 Matched pairs of SRHT supportive housing residents and homeless General Relief recipients
Public Costs and Savings While in Supportive Housing 31
The Skid Row Collaborative was one of 11 national demonstration projects funded under the federal government’s Chronic Homelessness Initiative. It began in fall 2003 and ended in June 2007. It was organized by the Skid Row Housing Trust and Lamp Community, with support from the Corporation for Supportive Hous-ing.65 The Collaborative included twelve public and nonprofit agencies as partners in providing coordinated services and permanent housing to chronically homeless individuals.66 Client records were available for 85 former Skid Row Collaborative participants. Project 50 was initiated by the Los Angeles County Board of Supervisors with the goal of moving fifty of the most acutely vulnerable chronically homeless persons living in Skid Row into permanent housing with supportive services. A central component is provision of integrated supportive services by a team of county departments and community agencies.67 Housing is provided by the Skid Row Housing Trust. At the time of this study, client records were available for 44 participants in Project 50. SRHT Supportive Housing Residents
Compared to the overall population of homeless GR recipients, supportive housing residents are:
Figure 10 Profile of Homeless GR Recipients, Current Supportive Housing
Residents, SRC Participants, and Project 50 Participants
0% 20% 40% 60% 80% 100%
Asian/Pacific Islander
HIV/AIDS
Latino
DHS Inpatient
18-29 Years Old
Jail Mental Health
Worked in Past 3 Yrs.
Born Other Country
Jail Medical Facility
White
Veteran
DHS Emer. Rm. User
30-45 Years Old
Female
Probation Record
Jail History
Born in Other State
Born in California
Substance Abuse
African American
46+ Years Old
Male
No Work Past 3 Yrs.
Mental Illness
Skid RowCollaborative
Supportive HousingResidents
Project 50
General ReliefHomeless
Sources: 9,186 homeless General Relief recipients, 322 current residents of Skid Row Housing Trust, 85 Skid Row Collaborative participants, 44 Project 50 participants
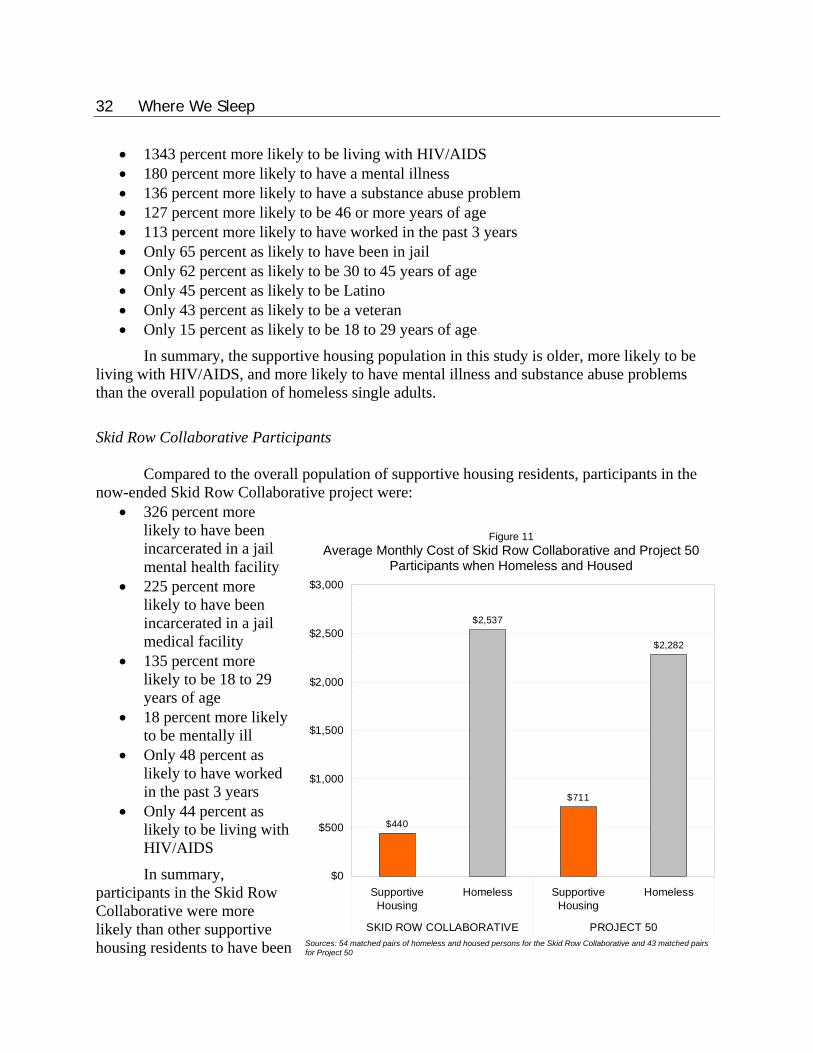
32 Where We Sleep
• 1343 percent more likely to be living with HIV/AIDS • 180 percent more likely to have a mental illness • 136 percent more likely to have a substance abuse problem • 127 percent more likely to be 46 or more years of age • 113 percent more likely to have worked in the past 3 years • Only 65 percent as likely to have been in jail • Only 62 percent as likely to be 30 to 45 years of age • Only 45 percent as likely to be Latino • Only 43 percent as likely to be a veteran • Only 15 percent as likely to be 18 to 29 years of age
In summary, the supportive housing population in this study is older, more likely to be living with HIV/AIDS, and more likely to have mental illness and substance abuse problems than the overall population of homeless single adults.
Skid Row Collaborative Participants Compared to the overall population of supportive housing residents, participants in the now-ended Skid Row Collaborative project were:
• 326 percent more likely to have been incarcerated in a jail mental health facility
• 225 percent more likely to have been incarcerated in a jail medical facility
• 135 percent more likely to be 18 to 29 years of age
• 18 percent more likely to be mentally ill
• Only 48 percent as likely to have worked in the past 3 years
• Only 44 percent as likely to be living with HIV/AIDS
In summary, participants in the Skid Row Collaborative were more likely than other supportive housing residents to have been
Figure 11 Average Monthly Cost of Skid Row Collaborative and Project 50
Participants when Homeless and Housed
$440
$2,537
$711
$2,282
$0
$500
$1,000
$1,500
$2,000
$2,500
$3,000
SupportiveHousing
Homeless SupportiveHousing
Homeless
SKID ROW COLLABORATIVE PROJECT 50Sources: 54 matched pairs of homeless and housed persons for the Skid Row Collaborative and 43 matched pairs for Project 50

Public Costs and Savings While in Supportive Housing 33
incarcerated in a mental health or medical jail facility, to be young adults, and they were less likely to have a recent work history or to be living with AIDS. Project 50 Participants Compared to the overall population of supportive housing residents, participants in the recently begun Project 50 are:
• 174 percent more likely to have been an inpatient at a county hospital • 100 percent more likely to have a probation record • 20 percent more likely to have been in jail • Only 41 percent as likely to have worked in the past 3 years
In summary, participants in Project 50 are more likely than other supportive housing residents to have a major health problem and a criminal record, and less likely to have an employment record. Cost Impacts of the Skid Row Collaborative and Project 50 Total Monthly Costs Looking at monthly costs for residents of the Skid Row Housing Trust that participated in the Skid Row Collaborative compared to costs for their com-parison group, and costs for Project 50 participants compared to costs for their comparison group (Figure 11), we see:68
• Skid Row Collaborative participants living in supportive housing had public costs that were only 17 percent of the costs of their matched-pair homeless counterparts - $440 vs. $2,537 per month.
• The public costs for Project 50 participants when they were homeless were three times greater than the costs of their
Figure 12 Distribution by Cost Decile of Monthly Public Costs when
Homeless for Four Study Populations
10%
10%
10%
10%
10%
10%
10%
10%
10%
10%
48%
11%
0%
2%
7%
5%
2%
2%
7%
16%
4%
2%
4%
4%
9%
8%
14%
15%
21%
20%
2%
2%
0%
2%
12%
5%
14%
9%
23%
30%
0% 10% 20% 30% 40% 50%
Lowest Decile$259
Second Decile$344
Third Decile$397
Fourth Decile$447
Fifth Decile$500
Sixth Decile$602
Seventh Decile$784
Eighth Decile$1,103
Ninth Decile$1,949
Highest Decile$8,803
Cos
t Dec
ile a
nd A
vera
ge M
onth
ly C
ost w
hen
Hom
eles
s
Skid RowCollaborative
All SRHT SupportiveHousing Residents
Project 50
All GR Homeless
Sources: 9,186 homeless General Relief recipients in Los Angeles County, matched-pair homeless comparison groups for 279 supportive housing residents of SRHT and 54 Skid Row Collaborative participants, and 44 Project 50 participants prior to entering housing
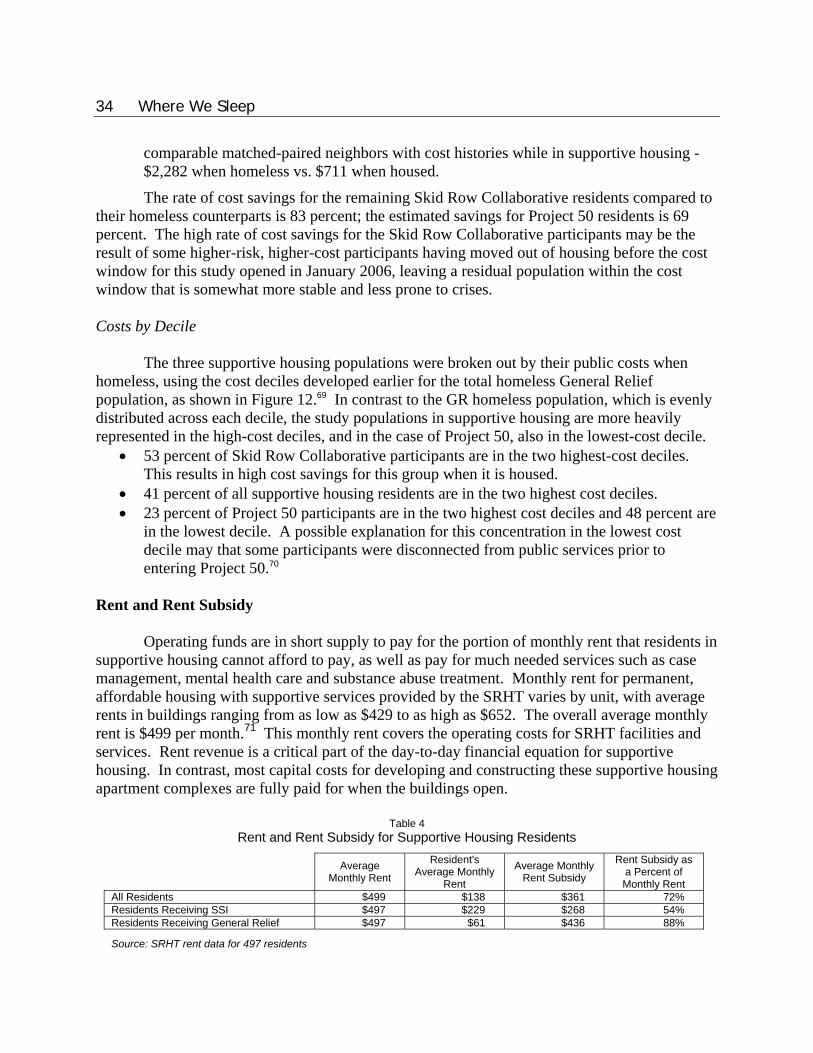
34 Where We Sleep
comparable matched-paired neighbors with cost histories while in supportive housing - $2,282 when homeless vs. $711 when housed.
The rate of cost savings for the remaining Skid Row Collaborative residents compared to their homeless counterparts is 83 percent; the estimated savings for Project 50 residents is 69 percent. The high rate of cost savings for the Skid Row Collaborative participants may be the result of some higher-risk, higher-cost participants having moved out of housing before the cost window for this study opened in January 2006, leaving a residual population within the cost window that is somewhat more stable and less prone to crises. Costs by Decile The three supportive housing populations were broken out by their public costs when homeless, using the cost deciles developed earlier for the total homeless General Relief population, as shown in Figure 12.69 In contrast to the GR homeless population, which is evenly distributed across each decile, the study populations in supportive housing are more heavily represented in the high-cost deciles, and in the case of Project 50, also in the lowest-cost decile.
• 53 percent of Skid Row Collaborative participants are in the two highest-cost deciles. This results in high cost savings for this group when it is housed.
• 41 percent of all supportive housing residents are in the two highest cost deciles. • 23 percent of Project 50 participants are in the two highest cost deciles and 48 percent are
in the lowest decile. A possible explanation for this concentration in the lowest cost decile may that some participants were disconnected from public services prior to entering Project 50.70
Rent and Rent Subsidy Operating funds are in short supply to pay for the portion of monthly rent that residents in supportive housing cannot afford to pay, as well as pay for much needed services such as case management, mental health care and substance abuse treatment. Monthly rent for permanent, affordable housing with supportive services provided by the SRHT varies by unit, with average rents in buildings ranging from as low as $429 to as high as $652. The overall average monthly rent is $499 per month.71 This monthly rent covers the operating costs for SRHT facilities and services. Rent revenue is a critical part of the day-to-day financial equation for supportive housing. In contrast, most capital costs for developing and constructing these supportive housing apartment complexes are fully paid for when the buildings open.
Table 4 Rent and Rent Subsidy for Supportive Housing Residents
Average Monthly Rent
Resident's Average Monthly
Rent
Average Monthly Rent Subsidy
Rent Subsidy as a Percent of Monthly Rent
All Residents $499 $138 $361 72% Residents Receiving SSI $497 $229 $268 54% Residents Receiving General Relief $497 $61 $436 88%
Source: SRHT rent data for 497 residents

Public Costs and Savings While in Supportive Housing 35
Given that the formerly homeless residents in these buildings often face significant physical, health and mental health barriers that prevent them from working, a large share of their income comes from federal, state and local programs and a large share of their rent is subsidized. Residents in units for which the SRHT has a Shelter Plus Care (SPC)72 rental subsidy contribute 30 percent of their gross income for rent. The gap between the monthly rent and the resident’s share of rent is filled by the SPC rental subsidy.
On average, residents contribute $138 for rent, which leaves the balance of $361 to be filled by subsidies. This subsidy accounts for 72 percent of the average resident’s monthly rent. There is a marked difference in the amount of subsidy required by residents who receive Federal assistance through the Supplement Security Income (SSI)73 program and those who receive aid through the County-funded General Relief program. A break-out of the monthly rent and rent subsidy for these residents are shown in Table 4.
The average SRHT resident with SSI contributes $229 for rent and requires a subsidy for only 54 percent of his/her monthly rent. The average resident with General Relief, however, contributes a modest $61 for rent and requires a subsidy for 88 percent of his/her rent. The effective result of providing higher rent subsidies for General Relief tenants is that fewer supportive housing residents can be housed with the limited amount of subsidy funds that are available.
Since General Relief tenants require an average subsidy of $436 a month, it costs $43,600 per month to subsidize the rent for 100 of these tenants. But since an average monthly subsidy of only $268 is required for SSI tenants, the same amount of subsidy funds required for 100 GR tenants will subsidize 162 SSI tenants. Moving disabled homeless persons off of GR and onto SSI increases the size of the homeless population that can be covered by housing subsidy funds by 62 percent.
An additional important benefit of qualifying tenants for SSI benefits is that their health care is then covered by Medi-Cal, which can be used to pay for more of the health and mental health services needed by tenants. If proposed state-level reforms are enacted, these funds can also be used to help offset case managements costs for supportive housing.74 These findings highlight the importance of Los Angeles County’s efforts to strengthen advocacy services to help physically and mentally disabled GR recipients apply for and obtain SSI benefits.75 Summary
The central question investigated in this study is: What is the public cost for people in supportive housing compared to similar people that are homeless?
The typical monthly cost for supportive housing residents is $605. The typical public cost for similar homeless persons is $2,897, five-times greater than their counterparts that are housed. This remarkable finding that public costs are reduced by four-fifths when homeless individuals entered supportive housing demonstrates that practical, tangible public benefits result from providing housing and services for vulnerable homeless individuals.
The stabilizing effect of housing plus supportive services is demonstrated by the $2,291 average monthly cost savings for the typical supportive housing resident in this study. This is a 79 percent reduction in public costs.

36 Where We Sleep
Costs for health care services provided by the county departments of Health Services and Public Health, together with private hospitals, account for 62 percent of total public costs for homeless residents before they enter supportive housing. After entering supportive housing, health care providers see the following reductions in costs for these individuals:
• County Health Services inpatient hospitalizations - 91 percent savings • County Health Services emergency rooms - 89 percent savings • County Health Services outpatient clinics - 87 percent savings • Paramedics - 87 percent savings • County Public Health - 85 percent savings • Private hospital inpatient hospitalizations - 82 percent savings
Not all subgroups have sufficient cost savings to offset the operating and capital costs of supportive housing. For example, supportive housing residents that had worked in the past three years had a high rate of cost savings, 70 percent; however their monthly savings of $1,030 did not offset the capital and operating costs for their supportive housing. A range of cost avoidance strategies is needed to provide housing that meets different levels of need in different groups.
Moving disabled homeless persons off of General Relief and onto SSI increases the size of the homeless population that can be covered by housing subsidy funds by 62 percent. An additional important benefit of qualifying tenants for SSI is that their health care is then covered by Medi-Cal, which can be used to pay for more of the health and mental health services they need.
Chapter 5
Tenure in Supportive Housing and Costs after Leaving
The retention of formerly homeless persons in supportive housing, particularly those with co-occurring substance abuse problems and mental illnesses, is a problem that universally challenges service providers.76 Housing providers are faced with the difficult task of helping stabilize the lives of individuals who often cycle through permanent housing, homelessness, hospitals, jails and temporary shelters. The inability to sustain long-term tenancy in supportive housing disrupts the continuity of care that is essential for individuals to benefit from services. Consequently, the retention of formerly homeless persons in supportive housing is a key factor for ensuring that individuals receive the type of care that meets their needs, as well as for providing benefits to the wider public. One such public benefit, which has been shown throughout this report, comes in the form of substantial cost savings that result from the housing and supportive services provided to vulnerable homeless individuals.
The study population of current and former Skid Row Housing Trust (SRHT) residents provides us with the opportunity to explore several issues related to tenure in housing. In the following sections we examine:
• The median monthly cost of housed individuals by quarter in residency • The point of departure for individuals who leave supportive housing • The cost of persons while housed in supportive housing and the cost of persons after
they have left supportive housing
Tenure and Costs
An examination of cost data by quarters in residency shows that cost savings for SRHT residents77 increase as individuals extend their stay in housing. The median monthly cost for residents in their earlier quarters in housing is substantially higher than their costs during later periods of their residency. Figure 13 shows the median78 monthly cost for SRHT residents by their quarter in residency. It is important to note that these costs do not include estimated costs for private hospital services and emergency medical transportation, which add an estimated 20 percent to the public costs of housed persons and are included in other cost analyses in this report.79 For the first 4 quarters in residency, median monthly costs are between $400 and $500. Thereafter, median monthly costs largely stay below $300.80 This trend of decreasing costs as tenure in residency increases suggests three conclusions: 1) factors of self-selection probably reduce the share of crisis-prone, higher-cost residents among the long-term population, 2) housing and continuity of supportive care are effective factors in stabilizing the lives of homeless persons, many of whom have mental illnesses and substance abuse problems, but when stabilized have less need for public services, and 3) cost savings can be increased if retention rates for residents are increased.
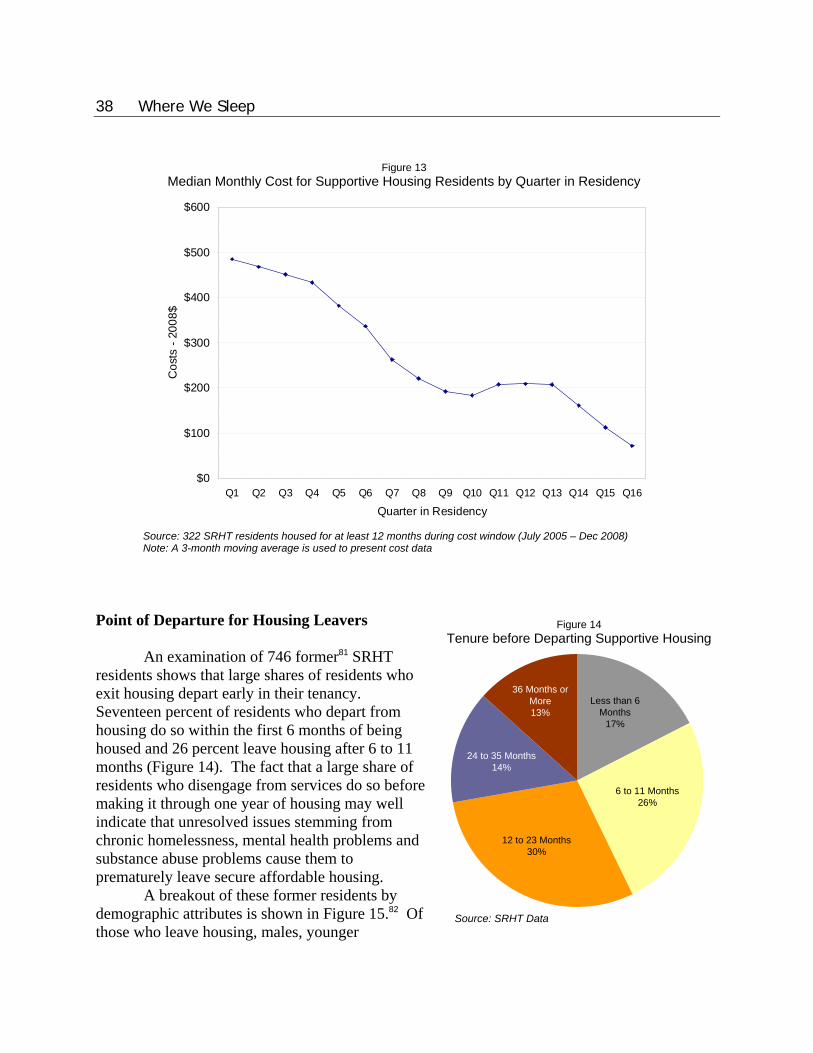
38 Where We Sleep
Point of Departure for Housing Leavers An examination of 746 former81 SRHT residents shows that large shares of residents who exit housing depart early in their tenancy. Seventeen percent of residents who depart from housing do so within the first 6 months of being housed and 26 percent leave housing after 6 to 11 months (Figure 14). The fact that a large share of residents who disengage from services do so before making it through one year of housing may well indicate that unresolved issues stemming from chronic homelessness, mental health problems and substance abuse problems cause them to prematurely leave secure affordable housing. A breakout of these former residents by demographic attributes is shown in Figure 15.82 Of those who leave housing, males, younger
Figure 14 Tenure before Departing Supportive Housing
Less than 6 Months
17%
6 to 11 Months26%
12 to 23 Months30%
24 to 35 Months14%
36 Months or More13%
Source: SRHT Data
Figure 13 Median Monthly Cost for Supportive Housing Residents by Quarter in Residency
$0
$100
$200
$300
$400
$500
$600
Q1 Q2 Q3 Q4 Q5 Q6 Q7 Q8 Q9 Q10 Q11 Q12 Q13 Q14 Q15 Q16
Quarter in Residency
Cos
ts -
2008
$
Source: 322 SRHT residents housed for at least 12 months during cost window (July 2005 – Dec 2008) Note: A 3-month moving average is used to present cost data

Public Costs After Housing 39
individuals, and persons with a history of substance abuse or incarceration are more likely to depart housing earlier in their residency rather than later. Highlights from this breakout include:
• Forty-four percent of males who exit supportive housing leave before making it through one year compared to 38 percent of females.
• A majority (54 percent) of young individuals (age 18 to 29) who exit supportive housing leave before reaching the 12-month mark compared to 38 percent of individuals over the age of 45.
• Forty-five percent of individuals with a history of substance abuse who exit supportive housing leave within one year compared to 39 percent of persons without substance abuse problems.
• Fifty-one percent of residents with an incarceration history who exit supportive housing leave within one year compared to 39 percent of residents without an incarceration history.
A further review of records for former SRHT residents shows that roughly a third of these departures are to move into other housing accommodations, which includes renting a room, apartment or house, moving in with a family member or friend, or moving into other housing designated for the homeless. Eight percent of residents depart housing to receive specific care to address medical, psychiatric or substance abuse problems. Most notably, over half of departures reflect undesirable outcomes in individual’s lives (disappearing, incarceration, nonpayment of
Figure 15 Tenure before Departing Supportive Housing by Individual Characteristics
0% 10% 20% 30% 40% 50% 60% 70% 80% 90% 100%
No Justice System
Justice System
No SA Indicators
Substance Abuse Problem
No Mental Health Problem
Mental Health Problems
18-29 Years
30-45 Years
46+ Years
Female
Male
Just
ice
Sys
tem
Sub
stan
ceA
buse
Men
tal
Hea
lthA
geG
ende
r
Less than 6 Months 6 to 11 Months 12 to 23 Months 24 to 35 Months 36 Months or More
Source: 746 former SRHT residents who left housing between January 2003 and March 2007

40 Where We Sleep
rent, and lease violations). The SRHT identified the following reasons for departure of 746 former residents:
• Housing opportunity - Renting 18 percent • Disappeared/unknown 15 percent • Incarceration 15 percent • Non-payment of rent 11 percent • Lease violations/non-compliance 11 percent • Housing opportunity – Staying with Family/Friend 8 percent • Substance abuse treatment facility 7 percent • Other 6 percent • Housing opportunity – Other 5 percent • Death 4 percent • Hospitalization 1 percent
The breakout of reasons for leaving housing by tenure, shown in Figure 16,83 reveals that
individuals who departed housing earlier in their tenure were more likely than those who left later in their tenure to have left because of incarceration or to have simply disappeared. A quarter of housing leavers who departed housing within the first 6 months left because of incarceration and 19 percent disappeared. Together, these two reasons account for the plurality of departures for former residents who departed within their first six months of housing.
Figure 16 Reasons for Leaving Supportive Housing by Tenure
0%
10%
20%
30%
40%
50%
60%
70%
80%
90%
100%
Less
than
6M
onth
s
6 to
11
Mon
ths
12 to
23
Mon
ths
24 to
35
Mon
ths
36 M
onth
s or
Mor
e
ALL
LE
AVE
RS
Other
Substance abuse treatment facility
Hospitalization
Housing opportunity - Other
Housing opportunity - Staying/Livingwith Family/Friend
Housing opportunity - Renting
Non-payment of rent
Lease violations/non-compliance
Death
Disappeared/Unknown
Incarceration
Source: 746 former SRHT residents who left housing between January 2003 and March 2007

Public Costs After Housing 41
Looking at the entire population of housing leavers, incarcerations and disappearances each accounted for 15 percent of departures. Underlying the varying shares of departure reasons for early-leavers and late-leavers is the fact that most individuals who depart from supportive housing do so for reasons that reflect negative outcomes in their life. A history of incarceration and substance abuse, combined with the vitality and independence of a young person, may well lead individuals to abruptly disconnect from services or fall back into previous behavior patterns that lead to incarceration. These same risk factors may also serve as barriers that prevent individuals from paying rent or complying with lease and program requirements resulting in premature departures from housing. While these finding are not surprising, they do underscore the need to target focused retention efforts on high-risk populations that are likely to depart early from housing and create significant public costs. Level of Service and Costs Given that residents largely leave housing for undesirable reasons and over 40 percent of residents who leave housing depart before the one-year mark, increasing the level of on-site services to meet residents’ needs may well yield net public cost saving. To further examine this issue of service levels and its impact on public cost, we examined two distinct sets of residents living in different SRHT facilities.
Figure 17 Average Monthly Costs by Departments for Residents in the Rainbow and St. George Apartments
and Comparable Residents in Other SRHT Facilities (Matched Pairs)
$0
$100
$200
$300
$400
$500
$600
$700
$800
Rainbow & St. George Other SRHT Facilities
Probation
Sheriff mental health jail
Sheriff medical jail
Sheriff general jail
LAHSA homeless services
GR Housing Vouchers
DPSS General Relief
DPSS Food Stamps
Paramedics
Public Health
Mental Health
Private hospitals-ER
Health Srv ER
Health Srv outpatient clinic
Private hospitals-inpatient
Health Srv hospital-inpatient
Source: SRHT Data
$484
$744

42 Where We Sleep
Residents in the Rainbow and St. George Apartments and Comparable Residents in Other Facilities SRHT offers a wider array of on-site services at its Rainbow and St. George apartments than at its other buildings. Residents in the two buildings receive higher levels of primary medical care and psychiatric services and benefit from a lower resident to case manager ratio.
Sixty-five Skid Row Housing Trust residents in the Rainbow and St. George apartments were paired (based on propensity scores) with comparable persons living in other SRHT buildings to examine whether higher levels of service result in discernable cost savings. The average monthly public cost for residents in the Rainbow and St. George Apartments is $484, as shown in Figure 17.84 The average cost for comparable residents in other SRHT facilities is $744, over 50 percent higher than costs for residents in the Rainbow and St. George. The benefits of offering higher levels of services are demonstrated by these cost savings. The breakout of costs by county department shows that the greatest cost savings were in health services. Highlights of the typical monthly cost savings for residents in the Rainbow and St. George apartments compared to residents in other SRHT buildings include:
• Los Angeles County Department of Health Services hospital-inpatient -$91 • Private hospitals-inpatient -$66 • Los Angeles County Department of outpatient clinic -$37 • Los Angeles County Sheriff’s mental health jail facilities/services -$29
Costs while Housed versus Costs after Housing
Comparison groups, formed through matched pairs based on propensity scores, were used to compare the costs of persons while in supportive housing to the cost of persons who left housing. Costs for persons who left supportive housing are derived from 238 persons who were housed for at least 12 months before exiting supportive housing and who also had at least 12 months out of SRHT housing during our cost window. The costs for persons while housed are derived from 238 SRHT residents who were housed for at least 12 months during the cost window of July 2005 through December 2008 for this study, and who were identified through their propensity scores as being closely matched to the individuals who had left housing.
This analysis shows average monthly public costs of $489 for persons while in supportive housing and $997 for persons out of housing in the months that they were homeless, or $735 in all post housing months, including both homeless and non-homeless months. Costs for housed persons are less than half of the costs of persons who left housing and entered homelessness, as shown in Figure 18.85 The breakout of costs by departments shows that cost increases after leaving housing are largely borne by health service agencies and incarceration facilities. Notable average monthly cost increases, comparing months housed to months homeless, are as follows:
• $142 increase for Health Services – inpatient hospitalizations • $126 increase for Sheriff mental health jail • $77 increase for Sheriff medial jail • $48 increase for Private hospitals • $26 increase for Sheriff general jail

Public Costs After Housing 43
Public costs for residents increase after they leave supportive housing, but costs for the overall population of housing leavers do not increase to the level that is typical for homeless General Relief recipients. Reasons for this include: 1) some people leave supportive housing for positive reasons rather than because of a crises and these individuals are likely to have continued low costs; 2) some of the incarcerated individuals are likely to have gone to state or federal facilities where their cost data was unavailable for this study; and 3) some of the individuals who re-united with their families are likely to have moved to locations outside of Los Angeles where their cost data was unavailable. When we break out people who left supportive housing for negative reasons (“problem leavers” in Figure 18) – criminal activity and incarceration, lease violations and noncompliance, nonpayment of rent, and simply disappearing – we see average monthly public costs of $1,111 in months when they are homeless. This is 128 percent more than the cost when this population is housed. The issues of retention rates and post-housing outcomes merit further investigation in a follow-on study. Findings about post-housing costs presented in this section should be taken with the caveat that uncertainties about the current location and circumstances of housing leavers may well have resulted in inclusion of cases for which data about actual costs was unavailable to this study. As a result, the average monthly cost for persons who left housing presented in this section may underestimate actual costs.
Figure 18 Average Monthly Costs for Persons while in Supportive Housing and for Persons after Exiting
Supportive Housing by Public Agency (Matched Pair)
$0$100$200$300$400$500$600$700$800$900
$1,000$1,100$1,200
Monthswhen
Housed
AllLeavers,
All MonthsAfter
LeavingHousing
All Leaversin MonthsHomeless
AfterLeavingHousing
ProblemLeavers,
All MonthsAfter
LeavingHousing
ProblemLeavers in
MonthsHomeless
AfterLeavingHousing
Probation
Sheriff mental health jail
Sheriff medical jail
Sheriff general jail
LAHSA homeless srv
GR Housing Vouchers
DPSS General Relief
DPSS Food Stamps
Paramedics
Public Health
Mental Health
Private hospitals-ER
Health Srv - ER
Health Srv outpatient clinic
Private hospitals-inpatient
Health Srv hospital-inpatient
$489
$735
$997
$807
$1,111
Source: 238 Matched Pairs from SRHT Data
44 Where We Sleep
Summary
Cost data for supportive housing residents shows that cost reductions increase as individuals extend their stay in housing. For the first 4 quarters in residency, median monthly public costs are between $400 and $500. Thereafter, median monthly costs largely stay below $300.
An examination of former supportive housing residents shows that large shares of residents who exit housing depart earlier rather than later in their tenancy. Over 40 percent of residents who depart from housing leave before reaching the one-year mark. Further examination of housing leavers shows that a majority of all departures reflect undesirable outcomes in individuals’ lives. This includes simply disappearing, incarceration, nonpayment of rent, and lease violations.
Supportive housing residents living in buildings with higher levels of primary medical care and psychiatric services and a lower ratio of residents to case managers had public costs that were $260 a month, or 35 percent, less than their matched-pair counterparts in buildings with lower levels of supportive services. Higher levels of supportive services may well pay for themselves through improved tenant outcomes.
Increases in public costs after residents leaving housing are largely borne by health service agencies and incarceration facilities.
Retention efforts should be targeted on high-risk populations that are likely to depart early from housing. The retention of formerly homeless persons in supportive housing is a key factor for ensuring that individuals receive the type of care that meets their needs, as well as for minimizing public costs.
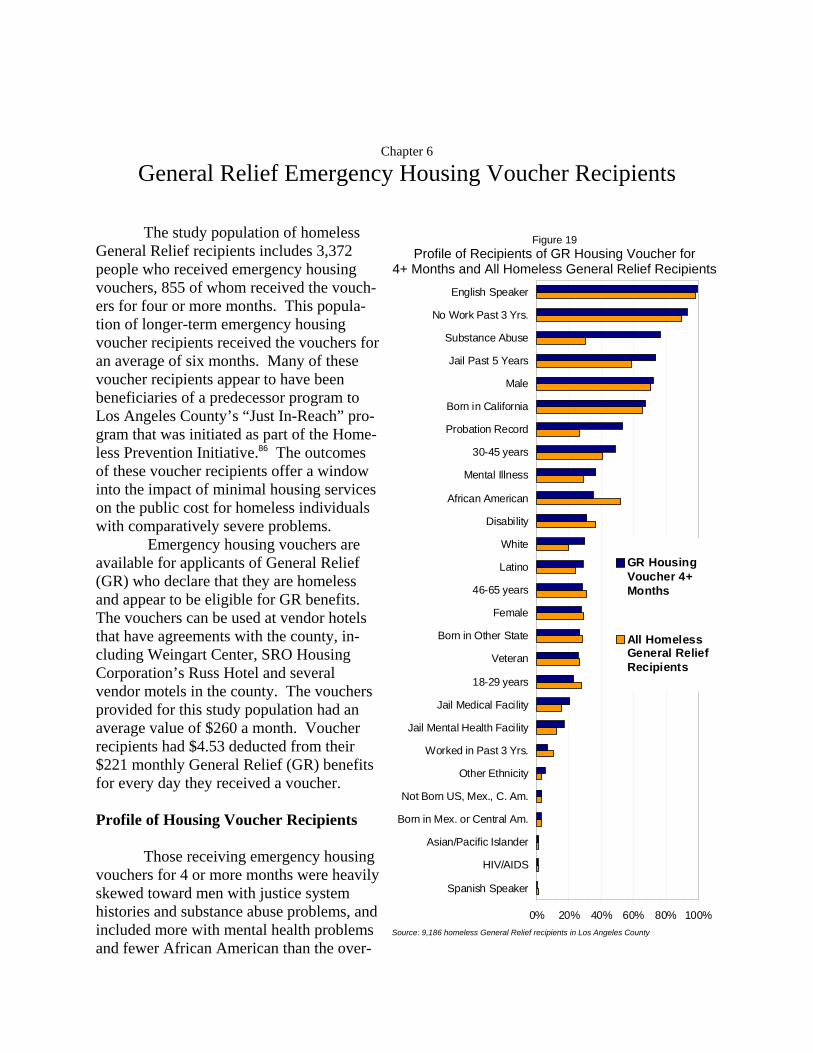
Chapter 6
General Relief Emergency Housing Voucher Recipients
The study population of homeless General Relief recipients includes 3,372 people who received emergency housing vouchers, 855 of whom received the vouch-ers for four or more months. This popula-tion of longer-term emergency housing voucher recipients received the vouchers for an average of six months. Many of these voucher recipients appear to have been beneficiaries of a predecessor program to Los Angeles County’s “Just In-Reach” pro-gram that was initiated as part of the Home-less Prevention Initiative.86 The outcomes of these voucher recipients offer a window into the impact of minimal housing services on the public cost for homeless individuals with comparatively severe problems.
Emergency housing vouchers are available for applicants of General Relief (GR) who declare that they are homeless and appear to be eligible for GR benefits. The vouchers can be used at vendor hotels that have agreements with the county, in-cluding Weingart Center, SRO Housing Corporation’s Russ Hotel and several vendor motels in the county. The vouchers provided for this study population had an average value of $260 a month. Voucher recipients had $4.53 deducted from their $221 monthly General Relief (GR) benefits for every day they received a voucher. Profile of Housing Voucher Recipients Those receiving emergency housing vouchers for 4 or more months were heavily skewed toward men with justice system histories and substance abuse problems, and included more with mental health problems and fewer African American than the over-
Figure 19 Profile of Recipients of GR Housing Voucher for
4+ Months and All Homeless General Relief Recipients
0% 20% 40% 60% 80% 100%
Spanish Speaker
HIV/AIDS
Asian/Pacific Islander
Born in Mex. or Central Am.
Not Born US, Mex., C. Am.
Other Ethnicity
Worked in Past 3 Yrs.
Jail Mental Health Facility
Jail Medical Facility
18-29 years
Veteran
Born in Other State
Female
46-65 years
Latino
White
Disability
African American
Mental Illness
30-45 years
Probation Record
Born in California
Male
Jail Past 5 Years
Substance Abuse
No Work Past 3 Yrs.
English Speaker
GR HousingVoucher 4+Months
All HomelessGeneral ReliefRecipients
Source: 9,186 homeless General Relief recipients in Los Angeles County

46 Where We Sleep
all population of homeless GR recipients, as shown in Figure 19.87
• 77 percent had docu-mented substance abuse problems vs. 30 percent for all homeless GR re-cipients
• 74 percent had been in jail in the past 5 years vs. 59 percent for all homeless GR recipients
• 53 percent had Proba-tion records vs. 26 for all homeless GR recipi-ents
• 37 percent had docu-mented mental illness problems vs. 29 percent for all homeless GR re-cipients
• 35 percent were African American compared to 52 percent for all homeless GR recipients
In summary, many indi-viduals in this population had significant problems that were likely to create above-average public costs. Costs When Housed and Homeless
The assistance provided to these GR voucher recipients included short-term basic housing and for some, short-term case management in developing post-jail transition plans. The cost of services received by different segments of this population when housed and homeless, as well as by the matched-pair comparison group when homeless,88 can be seen broken out by single variables in Tables A6-A8 of the Data Appendix, and is shown in Figure 20.89 A six-variable breakout of costs when homeless vs. the matched-pair comparison group when housed is provided in Data Appendix Table A9. Outcomes from this program are valuable for understanding the effectiveness of a low-cost housing program for different subgroups of homeless individuals.
While in voucher housing, this subgroup of GR recipients had average monthly costs of $1,302, which was 79 percent more than the typical cost of $728 for the total population of General Relief recipients in months when housed rather than homeless (Data Appendix Table
Figure 20 Monthly Costs When Homeless vs. When Not Homeless
$0 $1,000 $2,000 $3,000 $4,000 $5,000
Recent Work History
Latino
18-29 years
Born in California
Female
30-45 years
EVERYONE
Other Ethnicity
No Recent Work History
Male
Substance Abuse
White
Jail
Born in Other State
African American
46-65 years
Disability
Born Outside US
Mental Illness
Jail Medical Facility
Jail Mental Health Facility
HIV/AIDS
Voucher Recipientswhen Homeless
Matched-PairComparison Groupwhen Homeless
Voucher Recipientswhen Housed
Source: 9,186 homeless General Relief recipients in Los Angeles County, including 855 receiving General Relief emergency housing vouchers for 4+ months and the matched-pair comparison group for voucher recipients

Emergency Housing Vouchers 47
A3). These above-average costs likely reflect the greater prevalence of problems such as addiction and criminal histories in this group.
In the months when they were homeless, this group had average monthly costs of $1,524. Their matched-pair comparison group, a more reliable benchmark,90 had average monthly costs of $1,615 in months when homeless. The average monthly cost savings for this group when they were in voucher housing compared to months when they were homeless was $222, when compared to costs for the matched-pair comparison group in months when they were homeless the savings was $313. These savings roughly offset the cost of the housing vouchers provided to these individuals. When we look at where the GR voucher recipient group fell within the cost deciles for the entire population of homeless GR recipients, we see that they were heavily skewed toward the high cost end of the spectrum. Only 11 percent of these individuals were in the lowest cost half of the decile range and 89 percent were in the most expensive half of the range.91 Higher costs, of course, are concomitant to more severe problems.
Subgroups of GR voucher recipients with cost savings that exceeded the average $260 monthly cost of emergency housing vouchers, that is, whose cost while in housing was at least $260 less than the cost of their matched-pair comparison group when homeless, included:
• HIV/AIDS - monthly saving of $1,828, or 44 percent • Mental Illness - $688, or monthly saving of 27 percent • History in jail medical or mental health facility - monthly saving of $657, or 25 percent • No recent work history - monthly saving of $317, or 19 percent
Monthly Cost Trends when Homeless and Housed A month-by-month breakout of public costs for the GR voucher housing group covering 14 months before they were housed and 12 months during the time they were housed suggests cycles of pre-housing crises, followed by steadily
Figure 21 Monthly Public Costs Before and During GR Voucher Housing
3-month moving average, 2008 dollars
$0
$500
$1,000
$1,500
$2,000
$2,500
$3,000
$3,500
$4,000
$4,500
Pre
hous
ing
M14
Pre
hous
ing
M13
Pre
hous
ing
M12
Pre
hous
ing
M11
Pre
hous
ing
M10
Pre
hous
ing
M09
Pre
hous
ing
M08
Pre
hous
ing
M07
Pre
hous
ing
M06
Pre
hous
ing
M05
Pre
hous
ing
M04
Pre
hous
ing
M03
Pre
hous
ing
M02
Pre
hous
ing
M01
Hou
sed
M01
Hou
sed
M02
Hou
sed
M03
Hou
sed
M04
Hou
sed
M05
Hou
sed
M06
Hou
sed
M07
Hou
sed
M08
Hou
sed
M09
Hou
sed
M10
Hou
sed
M11
Hou
sed
M12
Average Monthly Costs Before Housing Average Monthly Cost While Housed
Source: 855 homeless General Relief recipients in LA County that received General Relief emergency housing vouchers for 4+ months

48 Where We Sleep
declining costs while housed (Figure 21).92 The month just prior to entering housing and the first month in housing provide reliable cost data because these months have large samples of records with cost information,93 however there are unexpected patterns in this cost data.
• There was a three-month build-up in costs prior to entering voucher housing, during which time costs increase 169 percent. One possible explanation is that major changes in the lives of homeless persons, such as seeking housing and services, are often demarcated by crises in which service utilization and public costs increase.
• During the first month in housing, public costs decreased 57 percent from the preceding month. Some or all of this decrease may be attributable to the stabilizing effect of being housed.
• There was an earlier spike in public costs 12 to 14 months prior to entering housing. This data is supported by a comparatively small number of records but may suggest cycles of crises in the lives of this population, many of whom were chronically homeless, intermittently incarcerated addicts.
This data raises the possibility that there are cy-cles of crisis associated with elevated public costs that precede entry into housing, underscoring the value of us-ing matched pairs identified through propensity scores to create cost comparison groups. The homeless half of the matched pairs will also have cycles of crises, but these cycles and the accom-panying elevated cost will be randomly distributed rather than possibly linked sequen-tially to entry into housing. Public Agencies Bearing the Costs of Homeless Voucher Recipients Costs in months when homeless, both for the GR voucher group and their matched-pair comparison group, along with costs dur-ing months in voucher housing are shown in Figure
Figure 22 Average Monthly Costs for General Relief Emergency Housing
Voucher Recipients by Service Provider – 2008 dollars
$0
$200
$400
$600
$800
$1,000
$1,200
$1,400
$1,600
$1,800
HomelessComparison
Group inMonths when
Homeless
VoucherHousing Groupin Months when
Homeless
VoucherHousing Groupin Months when
Housed
Probation
Sheriff mental health jail
Sheriff medical jail
Sheriff general jail
LAHSA homeless services
GR Housing Vouchers
DPSS General Relief
DPSS Food Stamps
Paramedics
Public Health
Mental Health
Private hospitals-ER
Health Services-ER
Health Srv outpatient clinic
Private hospitals-inpatient
Health Srv hospital-inpatient
Source: 855 homeless General Relief recipients with emergency housing vouchers for 4+ months and their matched-pair comparison group
$1,615
$1,524
$1,302

Emergency Housing Vouchers 49
22.94 The two measures of costs when homeless are mutually validating, with monthly costs when homeless for the voucher group coming within 6 percent of costs for their matched-pair homeless comparison group. Costs shown in Figure 22 are color coded into three broad categories – blue for heath costs, orange-yellow for public assistance costs, and green for justice system costs. Costs in all three categories went down when housed but the distribution of costs when homeless, as shown by the matched-pair comparison group, was similar to the distribution when housed.
• Total costs for health services went down 13 percent when housed; health services as a share of total costs shifted from 44 percent when homeless to 48 percent when housed.
• Total costs for public assistance went down 5 percent when housed; public assistance as a share of total costs shifted from 23 percent when homeless to 27 percent when housed.
• Total justice system costs went down 37 percent when housed; justice system costs as a share of total costs shifted from 33 percent when homeless to 26 percent when housed.
The modest, short-term investment in housing by the GR voucher program provided modest saving in public costs. Cost Savings from GR Emergency Housing Vouchers Compared to Savings from Supportive Housing for Specific Homeless Subgroups One of the difficulties of comparing the amount of cost saving in one program to savings in another program is that one group is likely to have more disabilities than the other group, making the groups and the resulting savings uncomparable. To address this problem we
Table 5 Comparison of Average Monthly Cost Change for Similar Individuals Living in General Relief Voucher
Housing and Supportive Housing
GR Housing-Voucher Recipients and Matched-Pair Comparison Group
Supportive Housing Residents and Matched-Pair Comparison Group
Characteristics
Homeless GR Recipients in
Matched Pairs with Voucher Recipients
GR Housing Voucher
Recipients for 4+ Months
Average Monthly
Cost Change when in Voucher Housing
Homeless GR Recipients in
Matched Pairs with Supportive Housing
Residents
Supportive Housing
Residents
Average Monthly
Cost Change when in
Supportive Housing
Gender Age
Group
Worked in Past 3 Years
Disability Status
Number in Home-
less Compari-
son Group
Average Monthly Cost for Home-
less Compari-
son Group
Number in GR
Voucher Housing Group
Average Monthly
Cost while in
GR Voucher Housing
GR Voucher Housing
Compared to Homeless
Comparison Group
Number in Home-
less Compar-
ison Group
Average Monthly Cost for Home-
less Compar-
ison Group
Number in
Support-ive
Housing Group
Average Monthly
Cost while in Support-
ive Housing
Supportive Housing
Compared to Homeless
Comparison Group
Female 46-65 No Disabled 34 $2,044 30 $2,835 $791 39% 30 $2,758 48 $603 -$2,155 -78%Male 30-45 No Disabled 83 $2,039 75 $1,713 -$325 -16% 66 $3,040 27 $783 -$2,258 -74%Male 46-65 No Disabled 63 $2,353 70 $1,467 -$886 -38% 58 $4,123 111 $710 -$3,414 -83%
AVERAGE $2,145 $2,005 -$140 -5% $3,307 $699 -$2,609 -78%Sources: Subgroups within 855 General Relief Housing Voucher recipients and their matched-pair homeless General Relief recipients, and within 279 supportive housing residents and their matched-pair homeless General Relief recipients

50 Where We Sleep
identified three subgroups defined by gender, age, work history, and disability status that each had enough records in the GR voucher program, the SRHT supportive housing program, and the matched-pair comparison groups for each program to produce reliable cost savings data. The cost data for this cross-program comparison is shown in Table 5. Even though there appear to be differences in the groups being compared (the SRHT residents are more likely to be mentally ill and therefore have higher public costs when homeless), these somewhat similar subgroups enable us to move closer to an apples-to-apples comparison. What we see is that the three GR housing voucher subgroups had average cost savings of 5 percent (the subgroup of older females had higher rather than lower costs while in voucher housing, substantially eroding overall savings for the three subgroups), whereas the same three subgroups in supportive housing had average cost savings of 78 percent. Savings for each subgroup were as follows:
• Females 40 to 65 years of age that have not worked in the past three years and are disabled: 39 percent cost increase while in voucher housing95 vs. 78 percent cost savings while in supportive housing
• Males 30 to 45 years of age that have not worked in the past three years and are disabled: 16 percent cost savings while in voucher housing vs. 74 percent savings while in supportive housing
• Males 46 to 55 years of age that have not worked in the past three years and are disabled: 38 percent cost savings while in voucher housing vs. 83 percent savings while in supportive housing
To the extent that we are able to isolate comparable subgroups and make cross-program comparisons of cost savings for these three subgroups of high-need, high-cost homeless individuals, the combination of supportive services and permanent housing that is provided by supportive housing yielded far greater savings than the minimal assistance of temporary housing provided by the voucher program. The level of assistance provided by supportive housing appears to have been a much more effective strategy for high-need homeless individuals, with the result that three-quarters of the public costs for their homeless counterparts were eliminated, whereas the voucher housing recipients saw only one-twentieth of the public costs for their homeless counterparts eliminated. New General Relief Housing Subsidy and Case Management Project
Los Angeles County’s Jail In-Reach pilot program has been modified to provide a monthly rental subsidy of up to $300 to be used in combination with $136 from GR grants (or $115 for shared housing situations) to pay for housing. Move-in assistance funds and access to supportive services for mental health and substance abuse issues are also provided. The program serves 900 chronically homeless GR recipients and individuals eligible for SSI benefits at any point in time on a first come, first served basis.96 This modified program with larger housing subsidies is called the General Relief Housing Subsidy and Case Management Project.
The county has used cost savings figures from the 2002 New York study by Culhane, Metraux and Hadley to extrapolate the cost savings that are likely to be generated by this redesigned program.97 Projected first-year savings are:
• Mental health and public health 15 to 25 percent

Emergency Housing Vouchers 51
• Health services 10 to 12 percent • Incarceration 20 to 30 percent
Taking into account the differing sizes of the underlying outlays in these different service areas, in aggregate, the projected cost savings represent about one-fifth of total public costs without this intervention. This is consistent with the level of savings shown by this study to be associated with the Jail In-Reach program and appears to be a realistic projection of savings that can be expected to result from the General Relief Housing Subsidy and Case Management Project. Summary
Shallow, short-term housing subsidies for chronically homeless, intermittently incarcerated addicts produce cost savings that offset the cost of the subsidies. However, these cost savings, which are typically one-fifth of the public costs in months when this population is homeless, are far smaller than the four-fifths savings achieved through larger subsidies provided for supportive housing residents in the form of permanent housing and case management.
The two measures of homeless costs provided by the GR voucher group and their matched-pair comparison in months when each was homeless are mutually validating. Costs for the voucher group were within 6 percent of costs for the matched-pair comparison group. Cost benchmarks provided by matched-pair comparison groups are probably the most reliable, but because of their similarity, both appear credible.
A cross-program comparison of cost savings for three high-need, high-cost subgroups that are represented both in the GR housing voucher program and the SRHT supportive housing program show average cost savings of 5 percent for the three subgroups when in GR voucher housing and average savings of 78 percent when in supportive housing. The savings for these high-need groups resulting from supportive housing appear to be several orders of magnitude greater than savings resulting from the much lower investment provided by GR housing vouchers.
There may well be cyclical variation in public costs for homeless residents associated with fluctuations in the severity of mental illness, jail recidivism and relapse into addiction. It may be the case that there are cost spikes at crisis or transition points in the lives of homeless individuals. Better information about movement into and out of homelessness, and into and out of public caseloads is needed to support more effective interventions for reducing costs and improving life prospects for homeless residents.

52 Where We Sleep
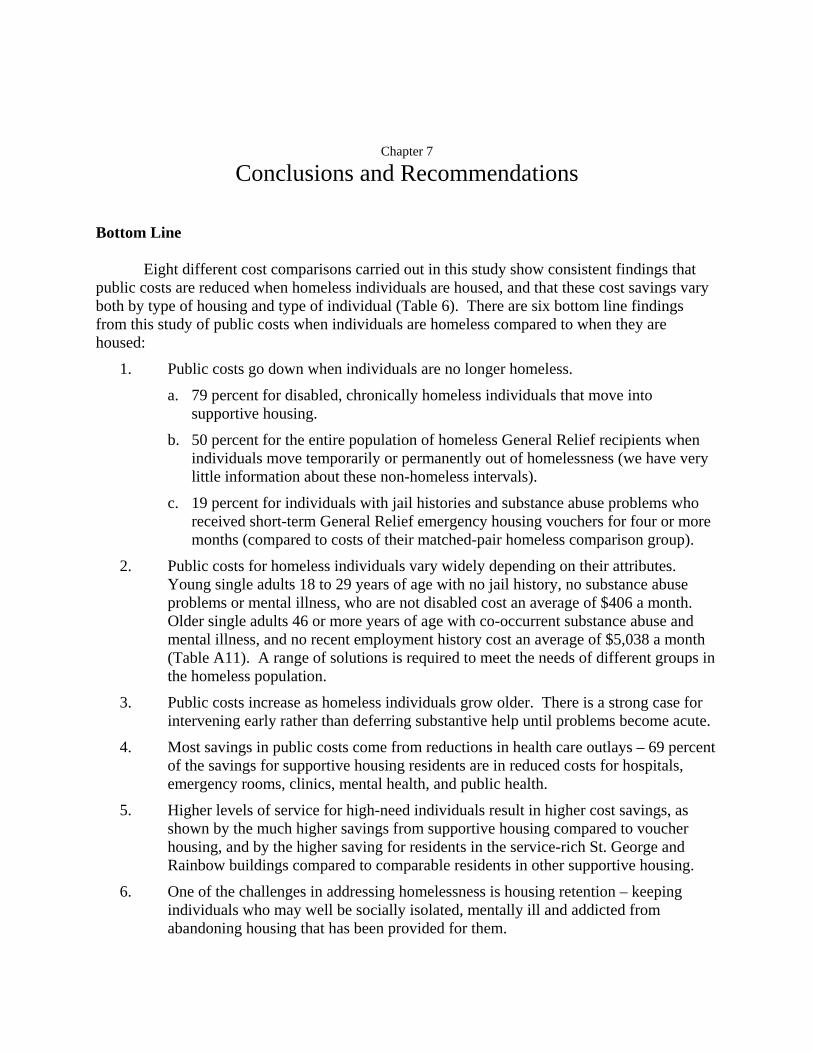
Chapter 7
Conclusions and Recommendations
Bottom Line Eight different cost comparisons carried out in this study show consistent findings that public costs are reduced when homeless individuals are housed, and that these cost savings vary both by type of housing and type of individual (Table 6). There are six bottom line findings from this study of public costs when individuals are homeless compared to when they are housed:
1. Public costs go down when individuals are no longer homeless.
a. 79 percent for disabled, chronically homeless individuals that move into supportive housing.
b. 50 percent for the entire population of homeless General Relief recipients when individuals move temporarily or permanently out of homelessness (we have very little information about these non-homeless intervals).
c. 19 percent for individuals with jail histories and substance abuse problems who received short-term General Relief emergency housing vouchers for four or more months (compared to costs of their matched-pair homeless comparison group).
2. Public costs for homeless individuals vary widely depending on their attributes. Young single adults 18 to 29 years of age with no jail history, no substance abuse problems or mental illness, who are not disabled cost an average of $406 a month. Older single adults 46 or more years of age with co-occurrent substance abuse and mental illness, and no recent employment history cost an average of $5,038 a month (Table A11). A range of solutions is required to meet the needs of different groups in the homeless population.
3. Public costs increase as homeless individuals grow older. There is a strong case for intervening early rather than deferring substantive help until problems become acute.
4. Most savings in public costs come from reductions in health care outlays – 69 percent of the savings for supportive housing residents are in reduced costs for hospitals, emergency rooms, clinics, mental health, and public health.
5. Higher levels of service for high-need individuals result in higher cost savings, as shown by the much higher savings from supportive housing compared to voucher housing, and by the higher saving for residents in the service-rich St. George and Rainbow buildings compared to comparable residents in other supportive housing.
6. One of the challenges in addressing homelessness is housing retention – keeping individuals who may well be socially isolated, mentally ill and addicted from abandoning housing that has been provided for them.
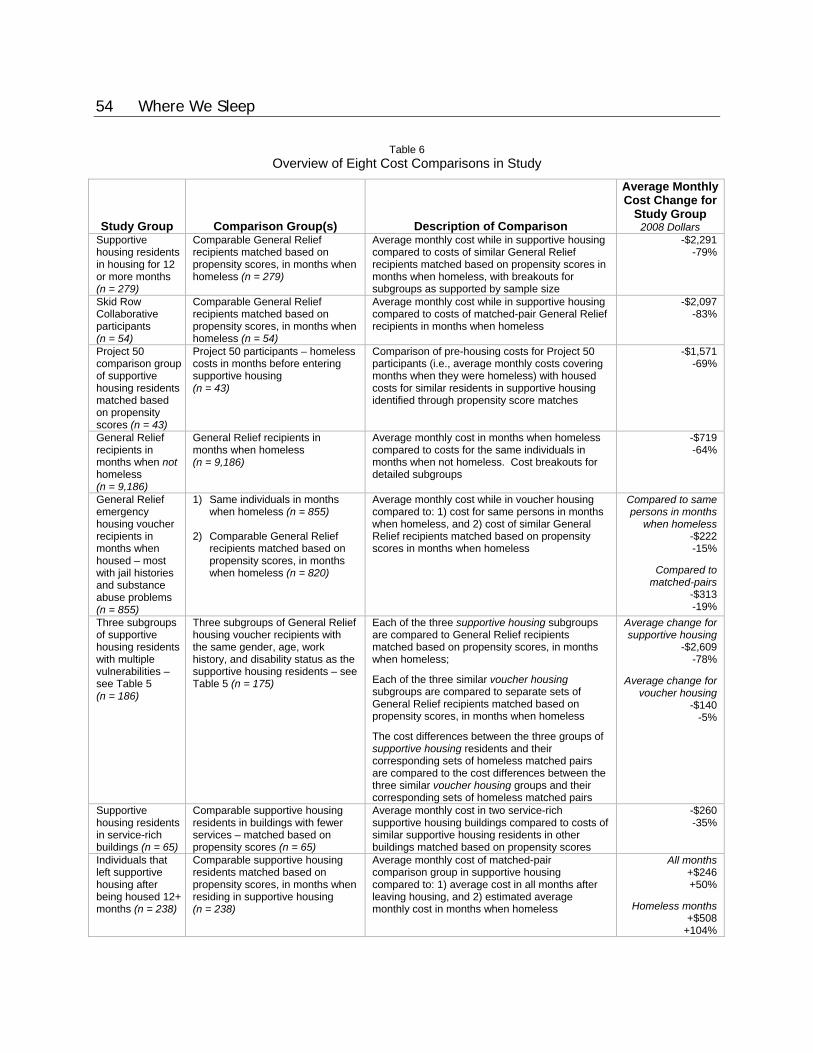
54 Where We Sleep
Table 6 Overview of Eight Cost Comparisons in Study
Study Group Comparison Group(s) Description of Comparison
Average Monthly Cost Change for
Study Group 2008 Dollars
Supportive housing residents in housing for 12 or more months (n = 279)
Comparable General Relief recipients matched based on propensity scores, in months when homeless (n = 279)
Average monthly cost while in supportive housing compared to costs of similar General Relief recipients matched based on propensity scores in months when homeless, with breakouts for subgroups as supported by sample size
-$2,291 -79%
Skid Row Collaborative participants (n = 54)
Comparable General Relief recipients matched based on propensity scores, in months when homeless (n = 54)
Average monthly cost while in supportive housing compared to costs of matched-pair General Relief recipients in months when homeless
-$2,097 -83%
Project 50 comparison group of supportive housing residents matched based on propensity scores (n = 43)
Project 50 participants – homeless costs in months before entering supportive housing (n = 43)
Comparison of pre-housing costs for Project 50 participants (i.e., average monthly costs covering months when they were homeless) with housed costs for similar residents in supportive housing identified through propensity score matches
-$1,571 -69%
General Relief recipients in months when not homeless (n = 9,186)
General Relief recipients in months when homeless (n = 9,186)
Average monthly cost in months when homeless compared to costs for the same individuals in months when not homeless. Cost breakouts for detailed subgroups
-$719 -64%
General Relief emergency housing voucher recipients in months when housed – most with jail histories and substance abuse problems (n = 855)
1) Same individuals in months when homeless (n = 855)
2) Comparable General Relief
recipients matched based on propensity scores, in months when homeless (n = 820)
Average monthly cost while in voucher housing compared to: 1) cost for same persons in months when homeless, and 2) cost of similar General Relief recipients matched based on propensity scores in months when homeless
Compared to same persons in months
when homeless -$222 -15%
Compared to
matched-pairs -$313 -19%
Three subgroups of supportive housing residents with multiple vulnerabilities – see Table 5 (n = 186)
Three subgroups of General Relief housing voucher recipients with the same gender, age, work history, and disability status as the supportive housing residents – see Table 5 (n = 175)
Each of the three supportive housing subgroups are compared to General Relief recipients matched based on propensity scores, in months when homeless;
Each of the three similar voucher housing subgroups are compared to separate sets of General Relief recipients matched based on propensity scores, in months when homeless
The cost differences between the three groups of supportive housing residents and their corresponding sets of homeless matched pairs are compared to the cost differences between the three similar voucher housing groups and their corresponding sets of homeless matched pairs
Average change for supportive housing
-$2,609 -78%
Average change for
voucher housing -$140
-5%
Supportive housing residents in service-rich buildings (n = 65)
Comparable supportive housing residents in buildings with fewer services – matched based on propensity scores (n = 65)
Average monthly cost in two service-rich supportive housing buildings compared to costs of similar supportive housing residents in other buildings matched based on propensity scores
-$260 -35%
Individuals that left supportive housing after being housed 12+ months (n = 238)
Comparable supportive housing residents matched based on propensity scores, in months when residing in supportive housing (n = 238)
Average monthly cost of matched-pair comparison group in supportive housing compared to: 1) average cost in all months after leaving housing, and 2) estimated average monthly cost in months when homeless
All months +$246 +50%
Homeless months
+$508 +104%
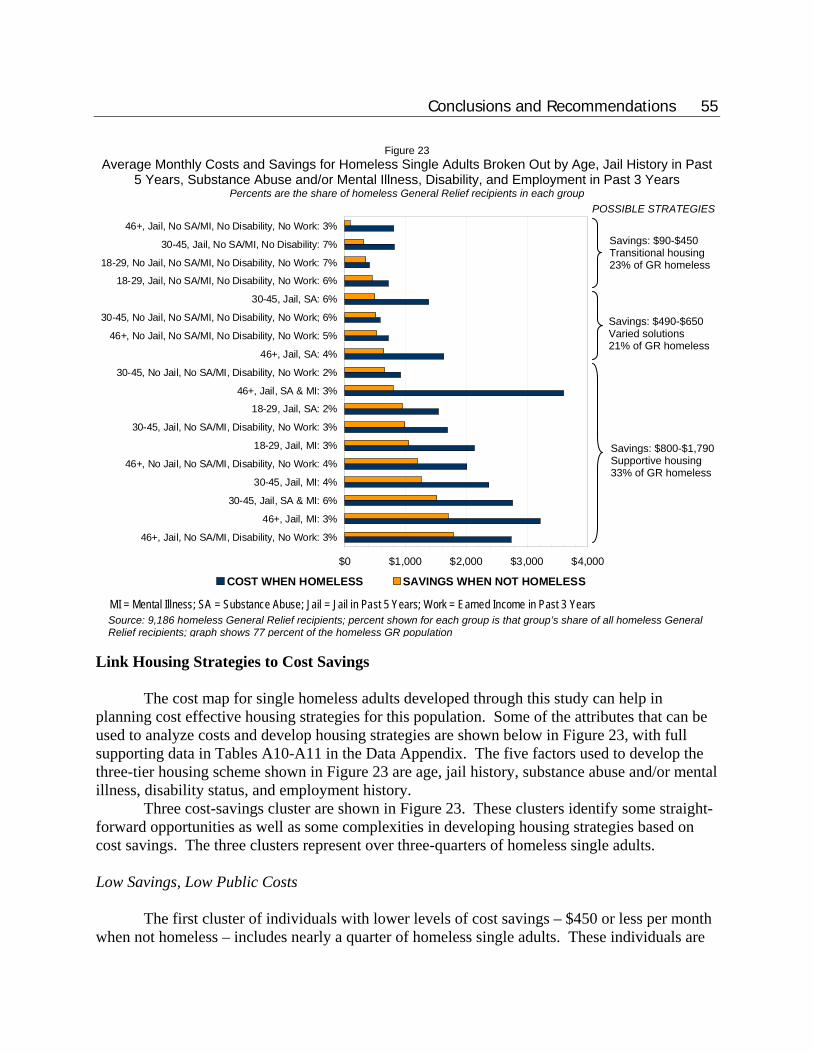
Conclusions and Recommendations 55
Link Housing Strategies to Cost Savings
The cost map for single homeless adults developed through this study can help in planning cost effective housing strategies for this population. Some of the attributes that can be used to analyze costs and develop housing strategies are shown below in Figure 23, with full supporting data in Tables A10-A11 in the Data Appendix. The five factors used to develop the three-tier housing scheme shown in Figure 23 are age, jail history, substance abuse and/or mental illness, disability status, and employment history.
Three cost-savings cluster are shown in Figure 23. These clusters identify some straight-forward opportunities as well as some complexities in developing housing strategies based on cost savings. The three clusters represent over three-quarters of homeless single adults. Low Savings, Low Public Costs
The first cluster of individuals with lower levels of cost savings – $450 or less per month when not homeless – includes nearly a quarter of homeless single adults. These individuals are
Figure 23 Average Monthly Costs and Savings for Homeless Single Adults Broken Out by Age, Jail History in Past
5 Years, Substance Abuse and/or Mental Illness, Disability, and Employment in Past 3 Years Percents are the share of homeless General Relief recipients in each group
$0 $1,000 $2,000 $3,000 $4,000
46+, Jail, No SA/MI, Disability, No Work: 3%
46+, Jail, MI: 3%
30-45, Jail, SA & MI: 6%
30-45, Jail, MI: 4%
46+, No Jail, No SA/MI, Disability, No Work: 4%
18-29, Jail, MI: 3%
30-45, Jail, No SA/MI, Disability, No Work: 3%
18-29, Jail, SA: 2%
46+, Jail, SA & MI: 3%
30-45, No Jail, No SA/MI, Disability, No Work: 2%
46+, Jail, SA: 4%
46+, No Jail, No SA/MI, No Disability, No Work: 5%
30-45, No Jail, No SA/MI, No Disability, No Work; 6%
30-45, Jail, SA: 6%
18-29, Jail, No SA/MI, No Disability, No Work: 6%
18-29, No Jail, No SA/MI, No Disability, No Work: 7%
30-45, Jail, No SA/MI, No Disability: 7%
46+, Jail, No SA/MI, No Disability, No Work: 3%
COST WHEN HOMELESS SAVINGS WHEN NOT HOMELESS
MI = Mental Illness; SA = Substance Abuse; Jail = Jail in Past 5 Years; Work = Earned Income in Past 3 Years Source: 9,186 homeless General Relief recipients; percent shown for each group is that group’s share of all homeless General Relief recipients; graph shows 77 percent of the homeless GR population
POSSIBLE STRATEGIES
Savings: $90-$450 Transitional housing 23% of GR homeless
Savings: $800-$1,790Supportive housing 33% of GR homeless
Savings: $490-$650 Varied solutions 21% of GR homeless

56 Where We Sleep
candidates for transitional housing provided by emergency shelters or General Relief housing vouchers. Most of these individuals have comparatively few problems – no substance abuse, no mental illness, no disability. Most have not worked in the past three years and most have spent time in jail in the past five years. It is very important to reconnect employable individuals in this population, particularly younger individuals, with the labor market.98 These individuals are not candidates for SSI, so their primary opportunity for a sustaining income is through employment. Moderate Savings, Moderate to High Public Costs The second cluster of individuals with moderate cost savings – $500 to $650 per month when not homeless – includes roughly a fifth of homeless single adults. None of the groups in this cluster shows evidence of having disabilities that would qualify them for SSI. This cluster breaks into two cohorts with similar age ranges but different characteristics:
• The two groups with jail history in the past 5 years, no substance abuse or mental illness problems, no disabilities, and no employment history in the past 3 years – people 30 to 45 years of age and 46 or more years of age – have modest public costs that go down 82 percent when they are not known to be homeless. These individuals appear to have comparatively stable life styles but limited earning capacity. They are candidates for affordable housing.
• The two groups with jail histories and substance abuse problems – people 30 to 45 years of age and 46 or more years of age – have high public costs that go down only 37 percent when they are not known to be homeless. Many individuals in these two groups are difficult to connect with stable life styles, ongoing sources of income and permanent housing. The high public costs they incur when homeless – roughly $1,500 a month – suggest that targeted drug rehabilitation and/or probation programs may be cost-effective supplements to housing programs.
Disabilities plus Medium to High Savings and Medium to High Public Costs
The third cluster of individuals with moderate to high cost savings – $800 to $1,790 per month when not homeless – includes a third of homeless single adults. All have cost savings when not homeless that are sufficient to offset the operating costs and rent subsidies for supportive housing. The average cost savings for these groups when they find respite from homelessness is 54 percent. Supportive housing has been shown to produce higher rates of cost saving for these groups, so actual savings are likely to be greater when supportive housing is provided. All but one of the groups in this cluster have disabilities, either physical disabilities or mental illness that might qualify them for SSI. The two-part strategy for this cluster is:
• Intensive efforts to qualify individuals for SSI • Referral to supportive housing providers
The remaining 23 percent of homeless single adults not shown in Figure 23 fall into smaller groups. The principles for assessing cost saving prospects and service needs, and making appropriate housing and service referrals are the same as for the three major clusters. First, build on strengths, including youth, work history, good health, and (not in the study data

Conclusions and Recommendations 57
set) education and family supports. Second, realistically assess limitations: age, disconnection from work, health problems, disabilities, mental illness, substance abuse, incarceration history, educational limitations, and absence of family supports. Strengthen Government-Housing Partnerships and Leverage Resources Public agencies and housing providers that serve homeless individuals have important shared interests. This network of organizations and the homeless people they serve will benefit from closer collaboration. Recent progress in strengthening collaboration for addressing homelessness in Los Angeles has been documented by Martha Burt.99 An important caveat, however, is that this collaboration may take forms other than transferring public cost savings to help pay for more housing. Public agencies, particularly health care providers, are able to avoid cost they otherwise would incur when disabled homeless individuals receive permanent housing and supportive services. However, it is difficult to convert these savings into fungible cash that can be reallocated to underwrite supportive housing. This is because the demand for these agencies’ services often exceeds the number of people they are able to serve. The homeless person who is not served may simply open up a hospital bed or a jail cell for the next person in line for these services. The reason for public agencies to collaborate is their need to find housing for their clients that will reduce public costs and improve the quality of life for those clients. The reason for housing provider to collaborate is their need for public agencies to provide a wide array of on-site services for their residents as well as to refer screened and appropriate clients. Public agency support is needed by housing providers to furnish services that will help residents achieve stability, address problems in their lives and remain in housing. These services include:
• On-site mental health services. • On-site drug and alcohol rehabilitation services. • On-site primary health care with access to specialty care. • Expanded and more effective efforts to qualify disabled homeless adults for SS.I
Current tenants who are already residing in housing, have disabilities, but are receiving only General Relief .
New referrals for housing of clients who have already been qualified for SSI. • Advocacy of state efforts to add a waiver to the State Medicaid Plan to enable federal
funding of Medi-Cal reimbursement for case management, transportation, vocational services, outreach and engagement strategies, and linkage to permanent housing for Medi-Cal eligible homeless persons.100 These reimbursements will make it possible to provide much needed services for SSI-eligible residents in supportive housing.
Improve Retention Rates for Individuals in Supportive Housing Many homeless individuals who receive supportive housing make decisions, or are propelled by life events, to abandon the safe harbor provided by their housing. Often the reasons for their departure are unfavorable – incarceration, serious lease violations, nonpayment

58 Where We Sleep
of rent, or simply disappearing. These individuals are likely to create much higher public costs and have diminished life quality after leaving housing. Supportive housing organizations need to be able to provide higher levels of on-site services to improve retention rates. It would help to modify HUD regulations to allow tenant mobility among supportive housing buildings.101 Individuals with above-average risks of leaving housing as well as their service needs can be identified. Needs that should be addressed through active, on-site collaboration from public agencies in delivering services and through broader coverage of supportive services for SSI-eligible residents through Medi-Cal reform include:
• Providing tenants who are at high risk of leaving housing with services targeted to their needs. These high-risk groups include: Residents with co-occurrent mental health and substance abuse problems Residents who have been incarcerated Young adults
• Providing mental health, substance abuse services and primary health care on-site at each building
• Lowering the ratio of case managers to residents • Providing more training for case managers to raise skill and knowledge levels
Increase the Supply of Supportive Housing Los Angeles County has far less supportive housing than is needed to shelter its disabled homeless population. This housing inventory can be expanded in three ways.
1. New construction is very capital intensive but often necessary in order to have residential facilities with enough office and meeting space to provide high levels of on-site services. It will be necessary to continue building these service-intensive residential facilities to house the most vulnerable homeless individuals.
2. Master leases provide a pay-as-you go method for obtaining blocks of housing units or housing complexes. This is a highly advantageous strategy for locking in housing prices when they are most affordable, as they are now in the current recession. To the extent that public cost savings can actually be made fungible or housing funds for groups such as General Relief recipients are available, this is an advantageous time to negotiate long-term leases. Some facilities available for lease may also have office and meeting space for on-site services. Other facilities may
Figure 24 Las Americas Hotel
Placed in service in 1992, 61 Units (42 Subsidized)
37%
34%
29%
0%
10%
20%
30%
40%
50%
60%
70%
80%
90%
100%
Tax C reditE quity(P rivate) ‐$1,288,409
L oan fromS tate ofC alifornia ‐C HRP ‐R ‐$1,520,000
L oan fromC RA ‐$1,681,000
$4,489,409
Source: Skid Row Housing Trust
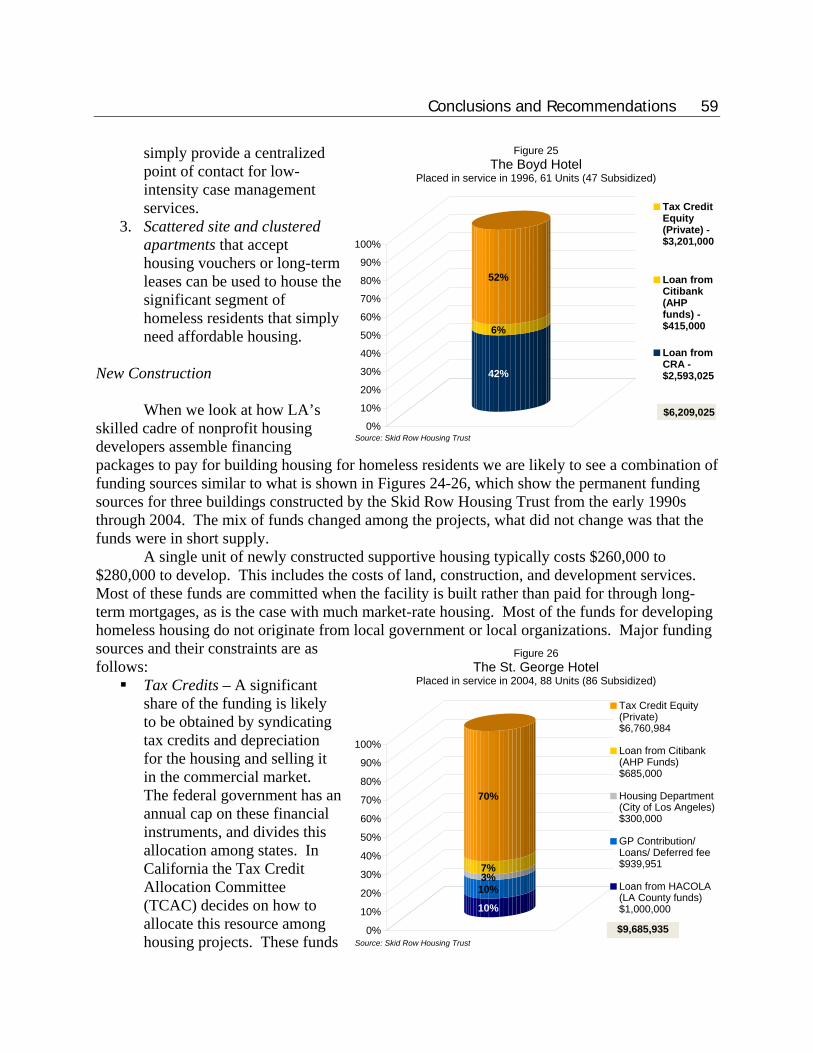
Conclusions and Recommendations 59
simply provide a centralized point of contact for low-intensity case management services.
3. Scattered site and clustered apartments that accept housing vouchers or long-term leases can be used to house the significant segment of homeless residents that simply need affordable housing.
New Construction
When we look at how LA’s skilled cadre of nonprofit housing developers assemble financing packages to pay for building housing for homeless residents we are likely to see a combination of funding sources similar to what is shown in Figures 24-26, which show the permanent funding sources for three buildings constructed by the Skid Row Housing Trust from the early 1990s through 2004. The mix of funds changed among the projects, what did not change was that the funds were in short supply.
A single unit of newly constructed supportive housing typically costs $260,000 to $280,000 to develop. This includes the costs of land, construction, and development services. Most of these funds are committed when the facility is built rather than paid for through long-term mortgages, as is the case with much market-rate housing. Most of the funds for developing homeless housing do not originate from local government or local organizations. Major funding sources and their constraints are as follows:
Tax Credits – A significant share of the funding is likely to be obtained by syndicating tax credits and depreciation for the housing and selling it in the commercial market. The federal government has an annual cap on these financial instruments, and divides this allocation among states. In California the Tax Credit Allocation Committee (TCAC) decides on how to allocate this resource among housing projects. These funds
Figure 25 The Boyd Hotel
Placed in service in 1996, 61 Units (47 Subsidized)
42%
6%
52%
0%
10%
20%
30%
40%
50%
60%
70%
80%
90%
100%
Tax CreditEquity(Private) -$3,201,000
Loan fromCitibank(AHPfunds) -$415,000
Loan fromCRA -$2,593,025
$6,209,025
Source: Skid Row Housing Trust
Figure 26 The St. George Hotel
Placed in service in 2004, 88 Units (86 Subsidized)
10%
10%3%7%
70%
0%
10%
20%
30%
40%
50%
60%
70%
80%
90%
100%
Tax Credit Equity(Private)$6,760,984
Loan from Citibank(AHP Funds)$685,000
Housing Department(City of Los Angeles)$300,000
GP Contribution/Loans/ Deferred fee$939,951
Loan from HACOLA(LA County funds)$1,000,000
$9,685,935Source: Skid Row Housing Trust
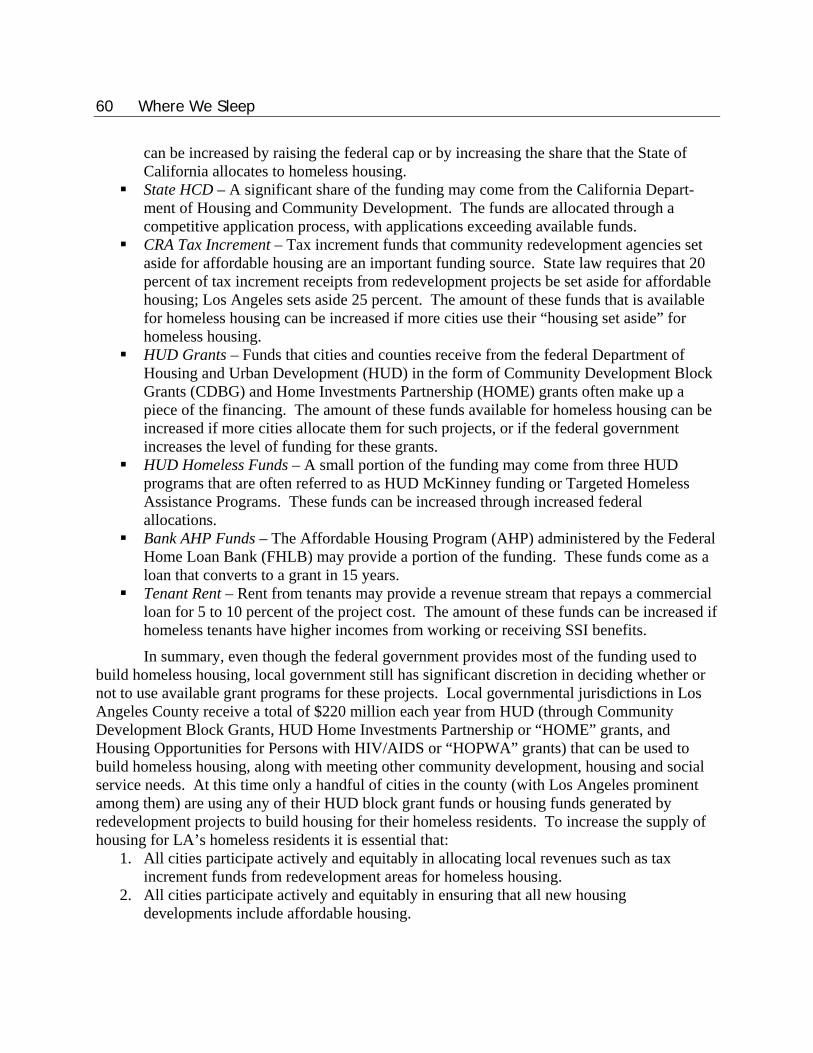
60 Where We Sleep
can be increased by raising the federal cap or by increasing the share that the State of California allocates to homeless housing.
State HCD – A significant share of the funding may come from the California Depart-ment of Housing and Community Development. The funds are allocated through a competitive application process, with applications exceeding available funds.
CRA Tax Increment – Tax increment funds that community redevelopment agencies set aside for affordable housing are an important funding source. State law requires that 20 percent of tax increment receipts from redevelopment projects be set aside for affordable housing; Los Angeles sets aside 25 percent. The amount of these funds that is available for homeless housing can be increased if more cities use their “housing set aside” for homeless housing.
HUD Grants – Funds that cities and counties receive from the federal Department of Housing and Urban Development (HUD) in the form of Community Development Block Grants (CDBG) and Home Investments Partnership (HOME) grants often make up a piece of the financing. The amount of these funds available for homeless housing can be increased if more cities allocate them for such projects, or if the federal government increases the level of funding for these grants.
HUD Homeless Funds – A small portion of the funding may come from three HUD programs that are often referred to as HUD McKinney funding or Targeted Homeless Assistance Programs. These funds can be increased through increased federal allocations.
Bank AHP Funds – The Affordable Housing Program (AHP) administered by the Federal Home Loan Bank (FHLB) may provide a portion of the funding. These funds come as a loan that converts to a grant in 15 years.
Tenant Rent – Rent from tenants may provide a revenue stream that repays a commercial loan for 5 to 10 percent of the project cost. The amount of these funds can be increased if homeless tenants have higher incomes from working or receiving SSI benefits.
In summary, even though the federal government provides most of the funding used to build homeless housing, local government still has significant discretion in deciding whether or not to use available grant programs for these projects. Local governmental jurisdictions in Los Angeles County receive a total of $220 million each year from HUD (through Community Development Block Grants, HUD Home Investments Partnership or “HOME” grants, and Housing Opportunities for Persons with HIV/AIDS or “HOPWA” grants) that can be used to build homeless housing, along with meeting other community development, housing and social service needs. At this time only a handful of cities in the county (with Los Angeles prominent among them) are using any of their HUD block grant funds or housing funds generated by redevelopment projects to build housing for their homeless residents. To increase the supply of housing for LA’s homeless residents it is essential that:
1. All cities participate actively and equitably in allocating local revenues such as tax increment funds from redevelopment areas for homeless housing.
2. All cities participate actively and equitably in ensuring that all new housing developments include affordable housing.
Conclusions and Recommendations 61
3. All cities make increasing use of block grant funds and state and federal financing tools for developing affordable housing.
4. State and federal agencies increase the level of financing that is available to local government and nonprofit developers to build homeless housing.
5. New dedicated funding sources are created to augment limited existing development funding.
Produce Information for Developing Comprehensive Strategies and Improving Outcomes
Los Angeles needs to get its arms around its homeless population – by getting enough information to understand who they are and what they require, and by acting on that information to provide shelter. Information that will have direct importance for effective housing strategies includes:
• A clearer understanding of the size and composition of the homeless population. • Cycles in and out of homelessness – where do people go, how do they cope, how
are public costs impacted? • Duration of homelessness – what is the breakout of the homeless population in
terms of the length of time people are homeless? • Homeless families – how many families are homeless? What are their
characteristics? What impact do they have on different human service systems? How long are they homeless? Do they have multiple cycles of homeless? How are children affected?
• Spanish-speaking and immigrant homeless individuals – what services do they draw on? How long are they homeless? What are their characteristics? What are their paths into and out of homelessness?
• Housing leavers – where do they go, what are their costs? Summary
The cost map for single homeless adults developed through this study can guide cost effective housing strategies. Three clusters that account for three-quarters of homeless single adults are:
1. Individuals with low public costs and comparatively few problems who need transitional housing. It is very important to reconnect employable individuals in this population, particularly younger individuals, with the labor market.
2. Individuals with moderate to high public costs, some of whom simply need affordable housing. Others have jail histories and substance abuse problems, but no disabilities, and require services that are more intensive.
3. The third cluster, with moderate to high public costs and disabilities make up a third of this population and are candidates for supportive housing.
It is important to expand the role of public agencies in providing on-site services for supportive housing, including mental health and drug and alcohol services, and SSI advocacy.
62 Where We Sleep
Supportive housing organizations need to be able to provide higher levels of on-site services to improve retention rates. Individuals with above-average risks of leaving housing include those that have co-occurrent mental health and substance abuse problems, those with jail histories, and young adults.
Los Angeles County has far less supportive housing than is needed to shelter its disabled homeless population. This housing inventory can be expanded through new construction, master leases, and scattered site rentals. All three approaches need to be expanded. There is a window of opportunity for affordable master leases in the currently less expensive housing market.
Los Angeles needs to get its arms around its homeless population – by getting enough information to understand who they are and what they require, and by acting on that information to provide shelter. This includes the size and composition of the population, cycles and duration of homelessness, family and immigrant homelessness, and outcomes for those who leave housing.
Appendix 1
Propensity Score Matching Gerald Sumner, Project Statistician
In examining the effects a particular program has on its participants, a comparison group of non-participants is invaluable. But if selection of participants has not been random, then personal characteristics (e.g., the demographic profile) of participants may vary systematically from those of non-participants in ways that confound (or bias) the measurement of program effects. For example, the prevalence of disability may be higher among program participants. The solution is to assemble a sub-group of non-participants who collectively resemble (i.e., “are balanced with”) the participant group with respect to the confounding characteristics, or “covariates”.
If these covariate effects can be captured in just three or four variables, then selection of a comparison group of non-participants may be straightforward. Otherwise, it may be useful to use instead a single function of the several covariates. One way of doing this is to create what is called “propensity scores”. A propensity score reflects an individual’s probability of being selected into the program, given the respective individual’s covariate profile. The idea is that if you match a participant and a non-participant who share the same propensity, you in effect have an approximate match with respect to the covariates that are important for measuring program effect. Not only will the treatment and comparison groups resemble, but the one-to-one matching enables matched-pair analysis, which often is statistically more efficient than group comparisons. Briefly,
The basic idea of a propensity score is to replace a collection of confounding covariates in any observational study with one function of these covariates. It can be used to balance confounding covariates in treatment group and control group, therefore to reduce election bias in observational studies, where the investigator has no control over the treatment assignment. (Yang, Stemkowski and Saunders)
Typically, propensity scores are created by applying logistic regression to the combined
population of participants and non-participants, with “participation” (“yes” or “no”) as the dependent variable, and the covariates as independent variables. Covariates that are categorical can be specified as dummy variable sets. Predicted probabilities are a standard output of logistic regression.
Having decided to employ propensity scores, and to use a particular model (e.g., logistic regression) to create them, one must decide on the covariates to specify. Covariates that are themselves affected by the program must be excluded. Generally, covariates of interest are those that influence selection into the program and/or influence program outcomes. It may be that some relevant covariates are unobservable, or even unknown, so the analyst can only hope that the specification collectively reflects the important confounding effects. At the same time, it is best to avoid the multi-collinearities of too many covariates that may result in a statistically unstable model.

64 Where We Sleep
After the propensity scores are estimated, one should compare their separate distributions
for participants and non-participants to verify that the two groups overlap enough to find matches for all or most participants.
There are various versions of the actual procedure for matching. Some versions use non-replacement (restricting non-participants to only one matched pair) while others permit replacement. Some involve matching multiple non-participants to each participant. There is also the question of how close two propensity scores must be to qualify as a match. The choice of matching algorithm involves tradeoffs relating to precision of results, ability to find matches for all participants, ease of implementing the matching, and ease of analysis.
Matching on propensities is a powerful technique with limitations. In this study, the logistic regressions that produced the propensities were very tight, meaning that almost all covariates used were highly significant, and there was very little intercorrelation among covariates. As a tool in this and other studies, propensity scores are a way of incorporating a large number of descriptors into the process of selecting a comparison group, but an admission of failure at being able to match on those descriptors exactly. The resulting pairs match only in a statistical sense. For pairs with high scores, these matches are quite strong, but for pairs with low scores the matches may be weak. For example, some housed cases will actually have low propensity scores. They will be matched with unhoused cases that have the same scores. There may be numerous permutations of descriptors that produce the same low score. Summary of Propensity Score Matching for this Study
Propensity score matching were implemented for four participant groups: 1. General Relief emergency housing voucher recipients 2. Skid Row Housing Trust residents 3. Non-housed former residents of the Skid Row Housing Trust 4. Program 50 clients within the Skid Row Housing Trust
Propensity Score Estimation
For each group, stepwise logistic regression was employed, with covariates drawn from the following possibilities, all categorical variables:
• Gender • Ethnicity (African American, Latino, Other) • Nativity (U.S., non-U.S.) • Language (Spanish, English) • Age group • Veteran status • Jail or probation record • Hospital-jail record (in medical or mental health facility)
Propensity Score Matching 65
• Employment earnings record • Mental disability • Record of substance abuse • Physical disability • HIV/AIDS status
The particular choice of covariates for each group depended on examination of covariate stability (as measured by significance levels) and percentage of correct predictions. Matching Propensity Scores
The matching was implemented with a modification of an SPSS routine written by John Painter in 2004.102 The result might be characterized as multi-pass caliper non-replacement matching. The data set is first sorted by participant/non-participant, then by propensity score, and then in random sequence within score. Beginning with the first participant record, all non-participant records are searched for the closest match. If the difference in scores for the closest match is within a specified limit, or “caliper”, an eligible match is declared, and the matching non-participant is removed from consideration for subsequent matches. If the difference is outside the caliper, no match is declared. Then the same procedure is repeated for the second participant, and so on.
Participants that remain unmatched at the end of this process are then submitted to a second pass of the procedure. If need be, the procedure is repeated three or more times, with broader caliper ranges. Eventually, all participants are matched except outliers that have no reasonably close matches among the non-participants. Because of the multiple passes, some non-participants may be matched to more than one participant, so the procedure ultimately is with replacement. Housing Voucher Recipients
The comparison population for voucher recipients (four months or more) was drawn from among cases in the ALP dataset. Of these, 820 participants and 5683 non-participants remained after screening out: recipients of fewer than four months of voucher housing, recipients of any transitional housing, persons over 65, extremely high-cost cases, languages other than English or Spanish, and missing ethnic or nativity information. The selected covariates were substance abuse, ethnicity, physical disability, employment, Hospital-jail, and language.
Matching was accomplished with two passes, with caliper limits set at .01 and .02, respectively. Matches were obtained for all 820 participants. Skid Row Housing Trust Residents
The comparison population for SRHT clients was drawn from among cases in the ALP dataset. Of these, 712 participants and 9030 non-participants remained after screening out persons over 65 and cases with missing ethnicity information. The selected covariates were
66 Where We Sleep
HIV, mental disability, jail/probation, substance abuse, ethnicity, physical disability, veteran, and Hospital-jail.
Matching was accomplished with six passes, with caliper limits set at .01, .02, .05, .05, .05, and .10, respectively. Matches were obtained for 652 of the 712 participants.
Non-housed Former Residents of Skid Row Housing Trust
The comparison population for former SRHT clients with at least 12 months of housing and at least 12 months of post-housing cost data was drawn from among SRHT clients with at least 12 months of housing and at least 12 months of cost data while housed. Of these, 266 participants and 199 non-participants remained after screening out persons over 65 and cases with missing ethnicity information. The selected covariates were physical disability, mental disability, substance abuse, and jail/probation.
Matching was accomplished with three passes, with caliper limits set at .01, .20, and .20, respectively. Matches were obtained for 253 of the 266 participants. Program 50 Clients
The comparison population for Program 50 clients was drawn from among SRHT clients with at least 24 months of housing and at least 12 months of cost data while housed. Of these, 44 participants and 249 non-participants remained after screening out persons over 65 and cases with missing ethnicity information. The selected covariates were jail/probation, age, ethnicity, and mental disability.
Matching was accomplished with two passes, with caliper limits set at .01 and .20, respectively. Matches were obtained for 43 of the 44 participants.. Outcomes of Matches
The results of propensity score matches for each of the four match groups were reviewed by dividing the pairs into treatment and comparison groups and then comparing the respective distributions with respect to the covariates that went into the logistic regressions. This makes it possible to assess whether the propensities actually translated into comparable demographics and attributes.
The within-group distributions for the respective covariates for the four housed types are shown in Table A1. Within each type, the distributions for covariates used to estimate the respective propensities can be compared. The distributions are separate for treatment group, comparison group, and for the 'pool' from which matched comparisons were selected. As can be seen in the table, treatment and comparison groups are very much alike, whereas they both differ from the respective 'pools'.

Propensity Score Matching 67
Table A1
Within-Group Distributions for Housed, Matched Unhoused, and Unhoused Pool The 'pools' from which unhoused matches are drawn are different for each housed group
General Relief Recipients with Emergency Housing Vouchers for 4+ Months Matched with Homeless General Relief Recipients Housed Unhoused Unhoused Group Matches Pool n 820 820 5,683 Ethnicity AfAmer 35 35 56 Latino 29 29 24 Other 36 36 20 Language Spanish 0 0 2 English 100 100 98 Med/MH Jail yes 31 31 19 no 69 69 81 Employment yes 7 6 11 no 93 94 89 SubstanceAbuse yes 77 77 18 no 23 23 82 PhysicalDisability yes 31 31 36 no 69 69 65 Current and Former Skid Row Housing Trust Residents Matched with Homeless General Relief Recipients Housed Unhoused Unhoused Group Matches Pool n 712 652 9,065 Ethnicity AfAmer 73 73 52 Latino 10 7 24 Other 18 20 24 Veteran yes 10 15 27 no 90 85 73 Jail/Probation yes 25 42 62 no 75 58 39 Med/MH Jail yes 0 17 23 no 100 81 77 MentalDisability yes 75 78 29 no 25 22 71 SubstanceAbuse yes 68 75 31 no 32 25 69 PhysicalDisability yes 78 79 37 no 22 21 64 HIV yes 20 21 1 no 80 79 99
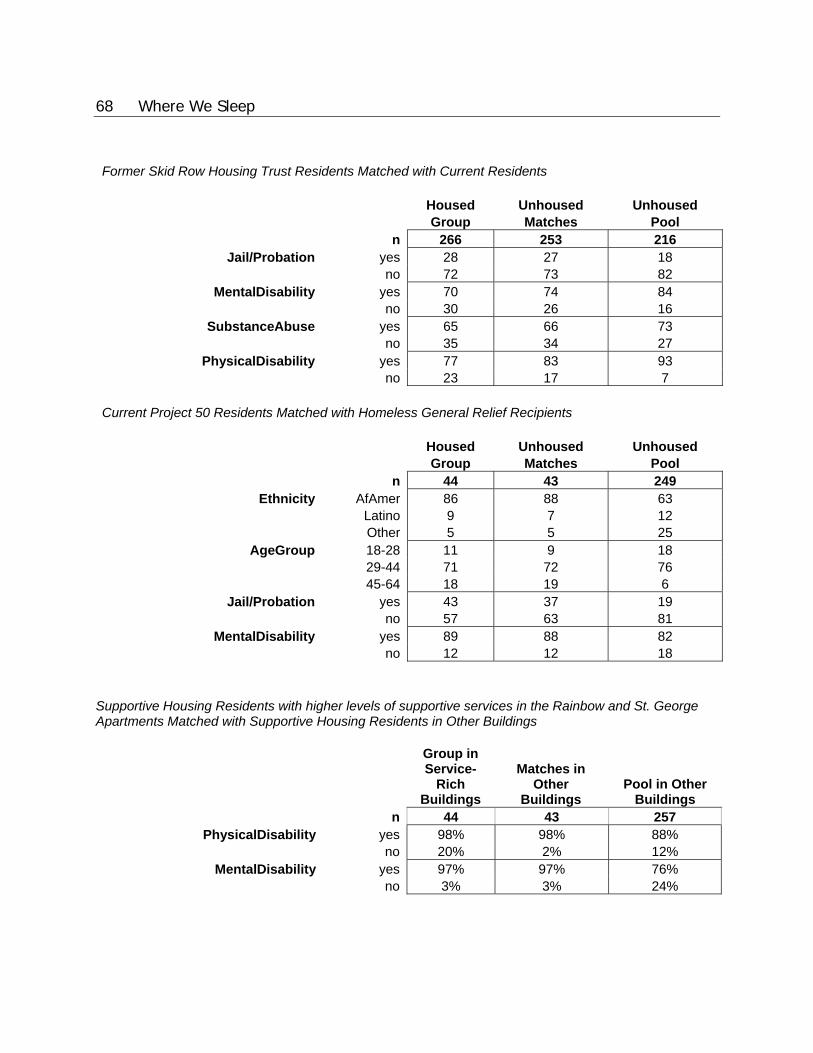
68 Where We Sleep
Former Skid Row Housing Trust Residents Matched with Current Residents Housed Unhoused Unhoused Group Matches Pool n 266 253 216 Jail/Probation yes 28 27 18 no 72 73 82 MentalDisability yes 70 74 84 no 30 26 16 SubstanceAbuse yes 65 66 73 no 35 34 27 PhysicalDisability yes 77 83 93 no 23 17 7 Current Project 50 Residents Matched with Homeless General Relief Recipients Housed Unhoused Unhoused Group Matches Pool n 44 43 249 Ethnicity AfAmer 86 88 63 Latino 9 7 12 Other 5 5 25 AgeGroup 18-28 11 9 18 29-44 71 72 76 45-64 18 19 6 Jail/Probation yes 43 37 19 no 57 63 81 MentalDisability yes 89 88 82 no 12 12 18
Supportive Housing Residents with higher levels of supportive services in the Rainbow and St. George Apartments Matched with Supportive Housing Residents in Other Buildings
Group in Service-
Rich Buildings
Matches in Other
Buildings Pool in Other
Buildings n 44 43 257 PhysicalDisability yes 98% 98% 88% no 20% 2% 12% MentalDisability yes 97% 97% 76% no 3% 3% 24%

Appendix 2
Data Tables Appendix
The following eleven tables provide detailed information about public costs for different subgroups of homeless individuals, in different housed or unhoused settings, often accompanied by breakouts of the costs incurred by each public agency that served them. Information in each table is summarized below.
Table Number
Chapter Reference
Description
A2 3 Average monthly costs of 9,186 Los Angeles County General Relief recipients when they are homeless, with subgroups broken out by six attributes: gender, age, work history, disability, mental illness, and substance abuse, with costs by public agency.
A3 3 Average monthly costs of 9,186 Los Angeles County General Relief Recipients when they are not homeless, with subgroups broken out by six attributes: gender, age, work history, disability, mental illness, and substance abuse, with costs by public agency.
A4 3 Monthly costs of 9,186 Los Angeles County General Relief recipients when they are homeless, with costs broken out separately by each descriptor in the study database, and with costs by public agency.
A5 3 Monthly costs of 9,186 Los Angeles County General Relief recipients when they are not homeless, with costs broken out separately by each descriptor in the study database, and with costs by public agency.
A6 6 Monthly costs of 855 Los Angeles County General Relief recipients that received emergency housing vouchers for 4+ consecutive months when they were housed, with costs broken out separately by each descriptor in the study database, and with costs by public agency.
A7 6 Monthly costs when homeless of 820 matched-pair comparison group members identified through propensity scores as comparable to the General Relief recipients that received emergency housing vouchers for 4+ consecutive months, with costs broken out separately by each descriptor in the study database, and with costs by public agency.
A8 6 Monthly costs of 855 Los Angeles County General Relief recipients that received emergency housing vouchers for 4+ consecutive months when they were homeless, with costs broken out separately by each descriptor in the study database, and with costs by public agency.

70 Where We Sleep
Table Number
Chapter Reference Description
A9 6 Average monthly costs of subgroups broken out by six attributes: gender, age, work history, disability, mental illness, and substance abuse, with data for both the 855 Los Angeles County General Relief recipients that received emergency housing vouchers for 4+ consecutive months when they were housed, and their matched pair comparison group in months when homeless.
A10 7 Average monthly costs of 9,186 Los Angeles County General Relief recipients when they are homeless, with subgroups broken out by five attributes: age, jail history in past 5 years, substance abuse and/or mental illness, disability, and whether employed in past 3 years, with costs by public agency.
A11 7 Average monthly costs of 9,186 Los Angeles County General Relief recipients when they are not homeless, with subgroups broken out by five attributes: age, jail history in past 5 years, substance abuse and/or mental illness, disability, and whether employed in past 3 years, with costs by public agency.
Note: Table A1, “Within-Group Distributions for Housed, Matched Unhoused, and Unhoused Pool,” is referenced in Appendix 1: Propensity Score Matching, and also appears there.

App
endi
x 2
- Dat
a Ta
ble
A2
Six
-Var
iabl
e B
reak
outs
of A
vera
ge M
onth
ly C
osts
of 9
,186
Los
Ang
eles
Cou
nty
Gen
eral
Rel
ief R
ecip
ient
s in
Mon
ths
whe
n H
omel
ess
Sub
grou
ps d
efin
ed b
y ge
nder
, age
, wor
k hi
stor
y, d
isab
ility
, men
tal i
llnes
s, a
nd s
ubst
ance
abu
seC
osts
for J
anua
ry 2
006
thro
ugh
Oct
ober
200
7, C
onve
rted
to 2
008
Dol
lars
Sm
all s
ubpo
pula
tions
(<25
) with
less
relia
ble
data
are
hig
hlig
hted
GR
OU
P
Number of Persons
Percent of Months Homeless
LA Co Dept Health Srv hospital-inpatient
LA Co Dept Health Srv outpatient clinic
LA Co Dept Health Srv emergency room
LA Co Mental Health
LA Co Public Health
LA Co DPSS Food Stamps
LA Co DPSS General Relief
LA Co DPSS GR Housing Vouchers
LAHSA homeless srv.
LA Co Probation Dept
LA Co Sheriff general jail facilities/services
LA Co Sheriff medical jail facilities/services
LA Co Sheriff mental health jail facilities/srv
Private hospitals-inpatient
Private hospitals-emergency room
Emergency Medical Transportation
Total Average Monthly Cost when Homeless
Eve
ryon
e9,
186
46%
$230
$58
$42
$38
$74
$165
$176
$65
$1$1
0$1
20$1
09$1
49$1
21$2
8$5
9$1
,446
Fem
ale
2,66
545
%$1
27$7
2$4
5$5
2$7
7$1
63$1
79$6
1$2
$8$5
4$1
4$5
9$1
21$2
9$6
2$1
,126
18-2
9 ye
ars
970
40%
$46
$28
$24
$37
$67
$156
$174
$47
$1$6
$34
$2$3
3$5
0$1
5$3
1$7
52N
o R
ecen
t Wor
k H
isto
ry84
239
%$5
1$2
8$2
5$4
0$6
9$1
58$1
75$4
8$1
$6$3
7$3
$38
$56
$16
$33
$782
No
Dis
abili
ty68
937
%$3
8$2
2$2
0$1
4$7
2$1
56$1
71$4
8$1
$6$3
5$2
$14
$50
$13
$27
$689
No
Men
tal I
llnes
s55
536
%$2
7$2
0$1
1$0
$54
$156
$174
$42
$0$5
$27
$0$0
$28
$8$1
7$5
69N
o S
ubst
ance
Abu
se47
237
%$1
9$1
9$9
$0$0
$157
$189
$17
$0$3
$21
$0$0
$17
$7$1
3$4
71S
ubst
ance
Abu
se83
29%
$77
$21
$22
$0$3
60$1
55$8
8$1
80$0
$15
$57
$0$0
$90
$19
$41
$1,1
26M
enta
l Illn
ess
134
40%
$84
$34
$58
$72
$146
$155
$158
$74
$3$1
2$7
1$1
1$7
0$1
43$3
1$6
7$1
,188
No
Sub
stan
ce A
buse
8241
%$7
7$3
2$3
5$6
8$0
$153
$192
$28
$0$6
$49
$12
$3$1
21$2
4$5
3$8
53S
ubst
ance
Abu
se52
39%
$95
$38
$93
$78
$377
$160
$105
$148
$6$2
0$1
07$1
1$1
75$1
76$4
1$8
8$1
,717
Dis
abili
ty15
347
%$1
07$5
1$4
7$1
57$5
5$1
66$1
92$5
0$0
$6$4
4$5
$146
$85
$30
$61
$1,2
02N
o M
enta
l Illn
ess
9044
%$4
8$5
2$2
0$0
$53
$171
$189
$53
$0$4
$25
$0$0
$58
$17
$35
$726
No
Sub
stan
ce A
buse
7848
%$5
5$3
0$1
8$0
$0$1
72$2
05$2
6$0
$1$2
6$0
$0$6
7$1
5$3
2$6
47S
ubst
ance
Abu
se12
17%
$0$1
97$2
9$0
$397
$166
$84
$232
$0$2
2$1
9$0
$0$0
$31
$57
$1,2
35M
enta
l Illn
ess
6352
%$1
93$4
9$8
6$3
80$5
8$1
58$1
97$4
5$1
$9$7
1$1
1$3
55$1
24$4
8$9
7$1
,882
No
Sub
stan
ce A
buse
4353
%$1
27$6
1$9
2$3
32$0
$160
$207
$25
$1$4
$31
$1$4
44$1
59$4
8$1
00$1
,791
Sub
stan
ce A
buse
2049
%$3
35$2
4$7
3$4
83$1
82$1
56$1
76$8
9$1
$22
$156
$33
$162
$49
$47
$90
$2,0
78R
ecen
t Wor
k H
isto
ry12
848
%$1
1$3
3$1
5$1
5$5
9$1
44$1
71$3
4$4
$7$1
6$1
$2$7
$11
$20
$551
No
Dis
abili
ty10
847
%$1
3$3
1$1
3$5
$70
$143
$166
$39
$1$7
$18
$1$2
$8$9
$17
$544
No
Men
tal I
llnes
s88
47%
$0$3
3$1
0$0
$10
$139
$172
$30
$1$5
$8$0
$0$0
$6$1
0$4
23N
o S
ubst
ance
Abu
se78
48%
$0$3
0$3
$0$0
$139
$181
$16
$1$2
$9$0
$0$0
$2$3
$387
Sub
stan
ce A
buse
1042
%$0
$56
$64
$0$9
0$1
33$1
04$1
35$1
$23
$0$0
$0$0
$35
$64
$704
Men
tal I
llnes
s20
44%
$73
$24
$27
$25
$331
$161
$141
$81
$3$1
8$6
3$8
$12
$44
$23
$45
$1,0
78N
o S
ubst
ance
Abu
se14
52%
$104
$15
$22
$21
$0$1
50$1
86$6
$4$1
4$9
0$1
1$1
7$6
3$1
5$3
2$7
49S
ubst
ance
Abu
se6
25%
$0$4
6$3
9$3
3$1
,103
$187
$37
$254
$0$2
6$0
$0$0
$0$4
2$7
6$1
,844
Dis
abili
ty20
58%
$0$4
3$2
7$7
0$2
$150
$197
$9$2
0$4
$4$0
$0$0
$22
$41
$590
No
Men
tal I
llnes
s10
49%
$0$7
7$4
1$0
$0$1
60$1
71$9
$0$8
$3$0
$0$0
$36
$67
$572
No
Sub
stan
ce A
buse
1049
%$0
$77
$41
$0$0
$160
$171
$9$0
$8$3
$0$0
$0$3
6$6
7$5
72S
ubst
ance
Abu
se0
..
..
..
..
..
..
Data Table A2 71

App
endi
x 2
- Dat
a Ta
ble
A2
(con
t.)
GR
OU
P
Number of Persons
Percent of Months Homeless
LA Co Dept Health Srv hospital-inpatient
LA Co Dept Health Srv outpatient clinic
LA Co Dept Health Srv emergency room
LA Co Mental Health
LA Co Public Health
LA Co DPSS Food Stamps
LA Co DPSS General Relief
LA Co DPSS GR Housing Vouchers
LAHSA homeless srv.
LA Co Probation Dept
LA Co Sheriff general jail facilities/services
LA Co Sheriff medical jail facilities/services
LA Co Sheriff mental health jail facilities/srv
Private hospitals-inpatient
Private hospitals-emergency room
Emergency Medical Transportation
Total Average Monthly Cost when Homeless
No
Men
tal I
llnes
s10
49%
$0$7
7$4
1$0
$0$1
60$1
71$9
$0$8
$3$0
$0$0
$36
$67
$572
No
Sub
stan
ce A
buse
1049
%$0
$77
$41
$0$0
$160
$171
$9$0
$8$3
$0$0
$0$3
6$6
7$5
72S
ubst
ance
Abu
se0
..
..
..
..
..
..
Men
tal I
llnes
s10
66%
$0$9
$13
$140
$4$1
40$2
24$9
$39
$0$5
$0$0
$0$8
$15
$608
No
Sub
stan
ce A
buse
770
%$0
$11
$13
$108
$0$1
53$2
42$1
3$1
3$0
$7$0
$0$0
$7$1
2$5
80S
ubst
ance
Abu
se3
56%
$0$5
$13
$214
$13
$112
$182
$0$1
02$0
$0$0
$0$0
$12
$23
$674
30-4
5 ye
ars
938
44%
$125
$83
$52
$63
$89
$162
$172
$80
$2$1
1$7
7$2
2$1
02$1
22$3
4$7
1$1
,267
No
Rec
ent W
ork
His
tory
836
44%
$132
$82
$55
$67
$88
$163
$173
$82
$2$1
1$8
0$2
3$1
07$1
27$3
6$7
6$1
,305
No
Dis
abili
ty51
037
%$4
3$6
3$3
8$5
2$1
11$1
59$1
56$1
00$0
$12
$80
$33
$71
$56
$25
$50
$1,0
50N
o M
enta
l Illn
ess
342
36%
$18
$44
$26
$0$1
03$1
60$1
66$7
8$0
$10
$55
$43
$0$2
9$2
0$3
8$7
89N
o S
ubst
ance
Abu
se23
039
%$3
$24
$13
$0$0
$162
$190
$35
$0$3
$35
$51
$0$1
7$1
0$2
0$5
64S
ubst
ance
Abu
se11
232
%$4
9$8
8$5
2$0
$314
$156
$115
$166
$0$2
3$9
5$2
8$0
$53
$39
$75
$1,2
51M
enta
l Illn
ess
168
37%
$93
$101
$62
$158
$127
$158
$138
$146
$1$1
6$1
31$1
3$2
15$1
11$3
7$7
5$1
,582
No
Sub
stan
ce A
buse
6845
%$5
1$1
06$5
2$6
9$0
$160
$206
$75
$0$6
$117
$0$5
5$5
6$3
4$6
6$1
,053
Sub
stan
ce A
buse
100
32%
$122
$97
$69
$219
$214
$156
$91
$195
$1$2
3$1
40$2
1$3
24$1
49$3
9$8
2$1
,942
Dis
abili
ty32
654
%$2
72$1
12$8
1$9
0$5
3$1
68$2
00$5
3$4
$10
$81
$7$1
64$2
38$5
4$1
15$1
,702
No
Men
tal I
llnes
s13
255
%$2
84$1
02$4
3$0
$47
$165
$201
$42
$2$1
1$1
14$6
$0$2
19$2
8$6
7$1
,332
No
Sub
stan
ce A
buse
8056
%$2
52$8
2$2
7$0
$0$1
65$2
20$1
5$3
$3$7
9$8
$0$2
07$1
9$5
0$1
,130
Sub
stan
ce A
buse
5252
%$3
32$1
33$6
9$0
$119
$165
$172
$84
$0$2
4$1
67$3
$0$2
38$4
2$9
4$1
,642
Men
tal I
llnes
s19
454
%$2
65$1
20$1
06$1
52$5
7$1
70$1
99$6
1$5
$10
$59
$8$2
75$2
50$7
1$1
48$1
,955
No
Sub
stan
ce A
buse
100
59%
$194
$76
$103
$161
$0$1
69$2
34$3
4$1
$5$5
4$0
$311
$168
$67
$135
$1,7
13S
ubst
ance
Abu
se94
49%
$340
$166
$109
$142
$118
$171
$161
$89
$9$1
4$6
4$1
6$2
37$3
37$7
5$1
62$2
,212
Rec
ent W
ork
His
tory
102
46%
$62
$91
$27
$34
$93
$156
$163
$66
$1$1
2$4
8$1
0$6
2$8
7$1
6$3
5$9
63N
o D
isab
ility
6343
%$1
6$8
9$1
6$2
1$1
01$1
60$1
48$7
4$1
$14
$61
$16
$94
$26
$7$1
5$8
61N
o M
enta
l Illn
ess
4344
%$2
3$9
3$7
$0$1
22$1
62$1
66$4
8$0
$18
$77
$24
$0$3
8$5
$13
$796
No
Sub
stan
ce A
buse
2947
%$3
4$3
7$1
1$0
$0$1
60$1
71$7
$0$6
$22
$35
$0$5
6$8
$19
$566
Sub
stan
ce A
buse
1439
%$0
$210
$0$3
75$1
68$1
55$1
31$0
$44
$191
$0$0
$0$0
$0$1
,274
Men
tal I
llnes
s20
41%
$0$8
1$3
4$6
6$5
6$1
56$1
11$1
32$1
$6$2
7$0
$297
$0$1
1$2
1$1
,001
No
Sub
stan
ce A
buse
943
%$0
$108
$41
$44
$0$1
52$1
77$3
2$0
$0$5
$0$0
$0$1
8$3
3$6
10S
ubst
ance
Abu
se11
39%
$0$6
0$2
8$8
4$1
02$1
59$5
7$2
15$3
$11
$46
$0$5
41$0
$6$1
1$1
,321
Dis
abili
ty39
50%
$137
$92
$45
$56
$80
$150
$187
$53
$2$8
$26
$0$9
$186
$29
$67
$1,1
26N
o M
enta
l Illn
ess
2149
%$2
54$3
3$4
9$0
$81
$153
$196
$27
$3$1
2$2
2$0
$0$3
45$2
8$7
5$1
,277
No
Sub
stan
ce A
buse
1850
%$9
9$3
5$2
6$0
$0$1
49$2
07$1
8$3
$13
$26
$0$0
$77
$11
$26
$691
Sub
stan
ce A
buse
345
%$1
,184
$20
$192
$0$5
64$1
78$1
35$7
7$0
$0$0
$0$0
$1,9
49$1
25$3
67$4
,792
Men
tal I
llnes
s18
51%
$0$1
62$3
9$1
22$8
0$1
47$1
75$8
3$0
$4$3
1$0
$19
$0$3
2$5
8$9
50N
o S
ubst
ance
Abu
se9
62%
$0$2
3$1
93$0
$165
$219
$0$0
$0$1
4$0
$38
$0$0
$0$6
53S
ubst
ance
Abu
se9
41%
$0$3
01$7
8$5
0$1
59$1
28$1
32$1
66$0
$7$4
8$0
$0$0
$63
$116
$1,2
48
72 Where We Sleep

App
endi
x 2
- Dat
a Ta
ble
A2
(con
t.)
GR
OU
P
Number of Persons
Percent of Months Homeless
LA Co Dept Health Srv hospital-inpatient
LA Co Dept Health Srv outpatient clinic
LA Co Dept Health Srv emergency room
LA Co Mental Health
LA Co Public Health
LA Co DPSS Food Stamps
LA Co DPSS General Relief
LA Co DPSS GR Housing Vouchers
LAHSA homeless srv.
LA Co Probation Dept
LA Co Sheriff general jail facilities/services
LA Co Sheriff medical jail facilities/services
LA Co Sheriff mental health jail facilities/srv
Private hospitals-inpatient
Private hospitals-emergency room
Emergency Medical Transportation
Total Average Monthly Cost when Homeless
46-6
5 ye
ars
741
53%
$239
$118
$65
$59
$75
$172
$194
$57
$2$8
$52
$20
$40
$216
$42
$93
$1,4
52N
o R
ecen
t Wor
k H
isto
ry63
654
%$2
58$1
16$6
9$6
2$7
9$1
73$1
96$5
7$2
$8$5
4$2
1$4
7$2
29$4
5$1
00$1
,516
No
Dis
abili
ty28
248
%$1
83$7
1$3
6$2
1$7
7$1
74$1
79$5
4$1
$6$4
3$0
$25
$177
$26
$61
$1,1
33N
o M
enta
l Illn
ess
226
49%
$191
$62
$23
$0$4
0$1
75$1
83$4
5$1
$6$3
4$0
$0$1
47$1
6$4
0$9
63N
o S
ubst
ance
Abu
se18
352
%$2
15$4
9$1
7$0
$0$1
76$1
99$1
3$1
$2$2
3$0
$0$1
36$1
2$3
1$8
74S
ubst
ance
Abu
se43
34%
$89
$117
$49
$0$2
10$1
69$1
13$1
79$0
$22
$84
$0$0
$195
$34
$77
$1,3
40M
enta
l Illn
ess
5644
%$1
49$1
06$8
9$1
08$2
26$1
72$1
65$8
8$0
$6$7
7$0
$124
$298
$68
$146
$1,8
22N
o S
ubst
ance
Abu
se37
49%
$192
$126
$89
$121
$0$1
62$1
99$6
0$0
$3$4
8$0
$187
$384
$70
$156
$1,7
99S
ubst
ance
Abu
se19
36%
$66
$69
$89
$81
$666
$193
$97
$142
$1$1
3$1
33$0
$0$1
28$6
3$1
24$1
,866
Dis
abili
ty35
458
%$3
18$1
52$9
4$9
5$8
0$1
73$2
10$5
9$3
$9$6
3$3
8$6
4$2
71$6
1$1
31$1
,820
No
Men
tal I
llnes
s19
858
%$9
9$1
29$4
5$0
$62
$172
$211
$47
$1$7
$52
$0$0
$131
$31
$66
$1,0
54N
o S
ubst
ance
Abu
se14
660
%$1
14$1
21$4
0$0
$0$1
68$2
32$1
9$0
$1$2
5$0
$0$1
42$2
8$6
2$9
52S
ubst
ance
Abu
se52
53%
$57
$153
$59
$0$2
37$1
85$1
53$1
27$1
$22
$129
$0$0
$101
$39
$78
$1,3
41M
enta
l Illn
ess
156
57%
$596
$182
$157
$215
$103
$173
$208
$75
$6$1
2$7
6$8
6$1
45$4
49$9
8$2
12$2
,793
No
Sub
stan
ce A
buse
8661
%$3
82$1
75$7
8$1
96$0
$179
$238
$31
$9$5
$69
$50
$182
$326
$51
$118
$2,0
89S
ubst
ance
Abu
se70
53%
$859
$190
$255
$239
$229
$166
$172
$127
$3$2
0$8
5$1
30$1
00$5
99$1
56$3
29$3
,659
Rec
ent W
ork
His
tory
105
50%
$124
$130
$40
$38
$55
$165
$178
$62
$5$6
$38
$14
$0$1
37$2
2$5
1$1
,067
No
Dis
abili
ty66
47%
$0$9
6$3
2$5
0$7
6$1
65$1
61$7
4$1
$6$4
4$2
2$0
$0$1
6$3
0$7
73N
o M
enta
l Illn
ess
4845
%$0
$48
$32
$0$1
00$1
64$1
62$7
1$2
$4$5
1$3
0$0
$0$1
4$2
6$7
04N
o S
ubst
ance
Abu
se39
46%
$0$1
8$1
2$0
$0$1
69$1
80$4
2$2
$0$5
5$3
7$0
$0$6
$12
$533
Sub
stan
ce A
buse
941
%$0
$179
$118
$0$5
31$1
41$8
8$1
96$0
$21
$34
$0$0
$0$4
9$8
9$1
,445
Men
tal I
llnes
s18
53%
$0$2
24$3
3$1
82$1
4$1
68$1
58$8
1$0
$12
$23
$0$0
$0$2
1$3
9$9
57N
o S
ubst
ance
Abu
se11
44%
$0$2
21$2
8$9
6$0
$166
$167
$94
$0$1
3$6
$0$0
$0$2
3$4
2$8
55S
ubst
ance
Abu
se7
67%
$0$2
29$4
1$3
17$3
5$1
72$1
45$6
0$0
$12
$50
$0$0
$0$1
9$3
5$1
,116
Dis
abili
ty39
55%
$335
$187
$54
$19
$20
$165
$208
$41
$11
$6$3
0$0
$0$3
68$3
3$8
7$1
,564
No
Men
tal I
llnes
s27
57%
$325
$174
$26
$0$1
9$1
67$1
98$4
6$1
$2$3
7$0
$0$2
41$2
0$5
4$1
,310
No
Sub
stan
ce A
buse
1861
%$0
$61
$10
$0$0
$165
$233
$18
$1$0
$7$0
$0$0
$8$1
4$5
16S
ubst
ance
Abu
se9
49%
$974
$402
$59
$0$5
8$1
72$1
28$1
03$2
$5$9
7$0
$0$7
22$4
5$1
33$2
,900
Men
tal I
llnes
s12
52%
$358
$217
$115
$62
$22
$159
$230
$30
$35
$16
$13
$0$0
$653
$62
$160
$2,1
34N
o S
ubst
ance
Abu
se8
44%
$205
$113
$116
$93
$0$1
56$2
12$4
3$5
2$8
$0$0
$0$3
40$6
1$1
36$1
,536
Sub
stan
ce A
buse
467
%$6
63$4
25$1
15$2
$67
$165
$265
$5$0
$32
$40
$0$0
$1,2
79$6
4$2
07$3
,330
Mal
e6,
521
46%
$273
$52
$41
$33
$74
$166
$175
$67
$1$1
0$1
47$1
47$1
86$1
21$2
7$5
8$1
,577
18-2
9 ye
ars
1,59
042
%$6
7$2
4$2
3$3
1$6
5$1
59$1
60$6
1$1
$13
$160
$142
$160
$52
$15
$32
$1,1
66N
o R
ecen
t Wor
k H
isto
ry1,
448
41%
$74
$25
$24
$32
$71
$160
$157
$64
$1$1
3$1
68$1
55$1
73$5
7$1
5$3
2$1
,220
No
Dis
abili
ty1,
117
38%
$29
$18
$16
$23
$70
$158
$150
$66
$1$1
3$1
56$1
27$9
9$1
9$1
1$2
1$9
77N
o M
enta
l Illn
ess
891
37%
$17
$14
$9$0
$42
$158
$154
$56
$0$1
1$1
28$8
8$0
$12
$7$1
4$7
12N
o S
ubst
ance
Abu
se72
639
%$9
$12
$8$0
$0$1
57$1
72$2
4$0
$7$1
21$8
6$0
$7$6
$12
$621
Data Table A2 73

App
endi
x 2
- Dat
a Ta
ble
A2
(con
t.)
GR
OU
P
Number of Persons
Percent of Months Homeless
LA Co Dept Health Srv hospital-inpatient
LA Co Dept Health Srv outpatient clinic
LA Co Dept Health Srv emergency room
LA Co Mental Health
LA Co Public Health
LA Co DPSS Food Stamps
LA Co DPSS General Relief
LA Co DPSS GR Housing Vouchers
LAHSA homeless srv.
LA Co Probation Dept
LA Co Sheriff general jail facilities/services
LA Co Sheriff medical jail facilities/services
LA Co Sheriff mental health jail facilities/srv
Private hospitals-inpatient
Private hospitals-emergency room
Emergency Medical Transportation
Total Average Monthly Cost when Homeless
Sub
stan
ce A
buse
165
29%
$51
$25
$14
$0$2
29$1
61$7
2$1
98$0
$32
$161
$95
$0$3
8$1
1$2
3$1
,111
Men
tal I
llnes
s22
641
%$7
7$3
4$4
3$1
15$1
81$1
62$1
34$1
03$2
$18
$264
$283
$488
$43
$26
$50
$2,0
22N
o S
ubst
ance
Abu
se13
346
%$8
6$1
9$3
7$8
1$0
$150
$163
$44
$1$1
2$3
33$3
21$7
14$5
2$2
3$4
6$2
,082
Sub
stan
ce A
buse
9335
%$6
4$5
5$5
2$1
63$4
41$1
79$9
2$1
87$4
$25
$167
$229
$165
$29
$30
$57
$1,9
37D
isab
ility
331
52%
$226
$47
$48
$63
$73
$164
$183
$58
$2$1
5$2
08$2
46$4
23$1
87$3
0$6
8$2
,042
No
Men
tal I
llnes
s19
752
%$2
03$4
0$2
6$0
$86
$162
$185
$60
$2$1
5$1
84$6
6$0
$161
$19
$46
$1,2
55N
o S
ubst
ance
Abu
se15
455
%$1
33$3
0$1
5$0
$0$1
63$2
11$2
7$2
$7$1
23$6
1$0
$57
$11
$24
$863
Sub
stan
ce A
buse
4338
%$4
54$7
6$6
7$0
$392
$158
$94
$179
$3$4
1$4
03$8
5$0
$534
$46
$123
$2,6
57M
enta
l Illn
ess
134
53%
$258
$56
$80
$157
$54
$166
$180
$55
$3$1
4$2
45$5
11$1
,046
$225
$46
$101
$3,1
99N
o S
ubst
ance
Abu
se93
56%
$242
$54
$46
$58
$0$1
66$2
12$1
9$2
$13
$279
$715
$605
$117
$35
$72
$2,6
36S
ubst
ance
Abu
se41
46%
$296
$61
$158
$380
$178
$165
$106
$137
$4$1
9$1
66$5
0$2
,045
$471
$73
$167
$4,4
76R
ecen
t Wor
k H
isto
ry14
247
%$0
$22
$19
$19
$3$1
53$1
87$3
4$0
$9$7
8$1
2$3
3$0
$14
$26
$610
No
Dis
abili
ty12
346
%$0
$19
$14
$3$3
$152
$185
$35
$0$1
0$8
7$1
4$2
9$0
$11
$20
$583
No
Men
tal I
llnes
s10
444
%$0
$19
$13
$0$3
$152
$187
$31
$0$1
0$8
6$9
$0$0
$10
$18
$538
No
Sub
stan
ce A
buse
9345
%$0
$19
$14
$0$0
$152
$189
$24
$0$9
$80
$0$0
$0$1
1$2
0$5
17S
ubst
ance
Abu
se11
41%
$0$2
0$5
$0$2
4$1
51$1
72$8
9$0
$17
$141
$85
$0$0
$5$9
$718
Men
tal I
llnes
s19
53%
$0$1
8$2
1$1
8$6
$152
$175
$56
$1$1
2$9
1$4
4$1
91$0
$16
$29
$829
No
Sub
stan
ce A
buse
1357
%$0
$15
$21
$22
$0$1
52$1
87$3
0$1
$9$3
6$4
0$2
79$0
$13
$24
$828
Sub
stan
ce A
buse
642
%$0
$25
$21
$12
$18
$154
$148
$114
$0$1
7$2
09$5
1$0
$0$2
1$3
9$8
29D
isab
ility
1956
%$0
$39
$50
$126
$1$1
64$1
99$2
9$0
$4$1
8$0
$56
$0$3
5$6
3$7
85N
o M
enta
l Illn
ess
1157
%$0
$25
$24
$0$1
$146
$197
$34
$0$7
$22
$0$0
$0$1
9$3
4$5
09N
o S
ubst
ance
Abu
se10
56%
$0$2
8$2
6$0
$0$1
46$2
00$3
8$0
$8$2
4$0
$0$0
$20
$38
$528
Sub
stan
ce A
buse
164
%$0
$0$0
$10
$144
$169
$0$0
$0$0
$0$0
$0$0
$0$3
22M
enta
l Illn
ess
855
%$0
$59
$87
$300
$0$1
90$2
01$2
2$0
$0$1
4$0
$132
$0$5
6$1
04$1
,164
No
Sub
stan
ce A
buse
558
%$0
$53
$12
$321
$0$1
83$1
63$1
2$0
$0$1
5$0
$211
$0$9
$17
$996
Sub
stan
ce A
buse
348
%$0
$67
$211
$265
$0$2
02$2
66$3
8$0
$0$1
2$0
$0$0
$135
$248
$1,4
4330
-45
year
s2,
833
44%
$162
$48
$40
$35
$82
$165
$175
$72
$1$1
1$1
61$1
47$1
75$1
11$2
7$5
7$1
,468
No
Rec
ent W
ork
His
tory
2,56
043
%$1
66$4
8$4
2$3
6$8
0$1
65$1
75$7
5$1
$11
$165
$156
$189
$115
$28
$59
$1,5
10N
o D
isab
ility
1,63
437
%$4
7$3
0$2
7$1
5$8
8$1
63$1
61$8
3$0
$11
$157
$125
$129
$53
$18
$37
$1,1
45N
o M
enta
l Illn
ess
1,27
235
%$3
1$2
6$1
6$0
$79
$162
$163
$80
$0$1
0$1
32$7
5$0
$40
$12
$25
$853
No
Sub
stan
ce A
buse
939
37%
$36
$20
$14
$0$0
$161
$187
$41
$0$5
$121
$73
$0$4
9$1
0$2
1$7
39S
ubst
ance
Abu
se33
331
%$1
6$4
4$2
4$0
$302
$167
$97
$188
$0$2
3$1
62$8
1$0
$16
$19
$36
$1,1
76M
enta
l Illn
ess
362
44%
$101
$42
$64
$69
$119
$164
$153
$94
$1$1
5$2
45$3
00$5
84$9
9$3
9$7
9$2
,169
No
Sub
stan
ce A
buse
168
49%
$49
$41
$58
$69
$0$1
62$1
90$4
1$0
$9$2
90$3
52$5
95$5
1$3
4$6
7$2
,008
Sub
stan
ce A
buse
194
41%
$146
$43
$68
$69
$222
$167
$120
$140
$2$2
1$2
06$2
55$5
75$1
39$4
3$9
0$2
,308
74 Where We Sleep

App
endi
x 2
- Dat
a Ta
ble
A2
(con
t.)
GR
OU
P
Number of Persons
Percent of Months Homeless
LA Co Dept Health Srv hospital-inpatient
LA Co Dept Health Srv outpatient clinic
LA Co Dept Health Srv emergency room
LA Co Mental Health
LA Co Public Health
LA Co DPSS Food Stamps
LA Co DPSS General Relief
LA Co DPSS GR Housing Vouchers
LAHSA homeless srv.
LA Co Probation Dept
LA Co Sheriff general jail facilities/services
LA Co Sheriff medical jail facilities/services
LA Co Sheriff mental health jail facilities/srv
Private hospitals-inpatient
Private hospitals-emergency room
Emergency Medical Transportation
Total Average Monthly Cost when Homeless
Dis
abili
ty92
654
%$3
76$8
0$6
8$7
1$6
7$1
69$1
99$6
0$1
$10
$180
$211
$294
$225
$44
$97
$2,1
54N
o M
enta
l Illn
ess
522
53%
$356
$84
$36
$0$8
1$1
70$1
94$6
3$0
$10
$166
$112
$0$1
58$2
6$5
8$1
,515
No
Sub
stan
ce A
buse
352
55%
$410
$81
$30
$0$0
$173
$214
$41
$0$5
$114
$93
$0$1
57$2
2$5
2$1
,392
Sub
stan
ce A
buse
170
48%
$244
$89
$49
$0$2
48$1
63$1
53$1
10$1
$22
$275
$153
$0$1
59$3
3$7
1$1
,770
Men
tal I
llnes
s40
456
%$4
01$7
6$1
10$1
64$4
9$1
69$2
05$5
5$3
$10
$196
$340
$674
$312
$68
$148
$2,9
80N
o S
ubst
ance
Abu
se21
159
%$2
63$6
1$8
0$8
7$0
$169
$231
$29
$1$6
$168
$352
$830
$166
$47
$98
$2,5
88S
ubst
ance
Abu
se19
353
%$5
52$9
2$1
44$2
48$1
03$1
70$1
75$8
3$5
$15
$228
$326
$503
$471
$92
$202
$3,4
07R
ecen
t Wor
k H
isto
ry27
351
%$1
30$4
9$2
4$3
2$9
3$1
59$1
80$4
8$3
$10
$122
$62
$39
$71
$17
$37
$1,0
78N
o D
isab
ility
196
49%
$146
$41
$16
$29
$66
$157
$174
$47
$4$9
$135
$42
$21
$73
$12
$27
$999
No
Men
tal I
llnes
s16
248
%$7
7$4
2$1
3$0
$79
$158
$174
$48
$4$9
$106
$50
$0$5
1$1
0$2
2$8
45N
o S
ubst
ance
Abu
se12
149
%$6
4$3
5$1
3$0
$0$1
58$1
87$2
6$4
$8$1
05$9
$0$6
1$9
$21
$700
Sub
stan
ce A
buse
4143
%$1
18$6
4$1
4$0
$313
$156
$137
$112
$3$1
5$1
12$1
70$0
$22
$13
$26
$1,2
74M
enta
l Illn
ess
3453
%$4
70$3
4$3
1$1
69$5
$151
$172
$43
$4$8
$274
$4$1
21$1
77$2
1$5
1$1
,734
No
Sub
stan
ce A
buse
2154
%$1
3$3
7$1
9$5
0$0
$160
$164
$9$2
$2$2
44$0
$159
$55
$12
$26
$951
Sub
stan
ce A
buse
1352
%$1
,209
$27
$52
$360
$13
$136
$186
$99
$6$1
7$3
21$9
$59
$375
$36
$93
$2,9
99D
isab
ility
7757
%$9
0$7
0$4
2$4
0$1
62$1
67$1
97$5
1$0
$11
$88
$114
$86
$66
$31
$62
$1,2
78N
o M
enta
l Illn
ess
4758
%$4
7$5
5$2
7$0
$129
$159
$195
$35
$0$9
$104
$176
$0$2
6$2
1$4
1$1
,024
No
Sub
stan
ce A
buse
3657
%$6
2$6
8$3
2$0
$0$1
61$2
00$2
2$0
$7$9
5$2
30$0
$34
$24
$47
$982
Sub
stan
ce A
buse
1160
%$0
$13
$11
$0$5
51$1
53$1
79$7
8$1
$13
$135
$0$0
$0$1
1$2
1$1
,164
Men
tal I
llnes
s30
56%
$158
$95
$65
$102
$214
$179
$200
$75
$0$1
6$6
3$1
6$2
21$1
30$4
7$9
5$1
,675
No
Sub
stan
ce A
buse
1557
%$0
$38
$24
$114
$0$1
72$2
43$4
7$0
$5$1
3$0
$179
$0$1
5$2
7$8
78S
ubst
ance
Abu
se15
55%
$315
$151
$105
$91
$428
$186
$157
$102
$0$2
6$1
12$3
2$2
63$2
60$7
9$1
63$2
,471
46-6
5 ye
ars
2,07
052
%$5
85$8
0$5
5$3
0$7
0$1
73$1
86$6
3$2
$8$1
18$1
54$2
25$1
89$3
7$8
1$2
,055
No
Rec
ent W
ork
His
tory
1,87
252
%$6
36$7
9$5
8$2
9$7
4$1
74$1
86$6
5$1
$8$1
25$1
63$2
42$1
99$3
8$8
4$2
,161
No
Dis
abili
ty88
347
%$1
21$4
5$3
1$1
5$7
0$1
75$1
59$7
8$1
$8$1
09$7
0$1
12$8
7$2
1$4
5$1
,148
No
Men
tal I
llnes
s71
746
%$8
7$4
5$2
0$0
$64
$175
$160
$78
$0$8
$99
$36
$0$6
6$1
5$3
3$8
84N
o S
ubst
ance
Abu
se52
749
%$8
2$3
7$1
4$0
$0$1
75$1
80$4
3$0
$3$8
4$2
1$0
$44
$11
$22
$717
Sub
stan
ce A
buse
190
39%
$100
$66
$36
$0$2
41$1
74$1
03$1
76$1
$20
$138
$78
$0$1
25$2
8$6
1$1
,346
Men
tal I
llnes
s16
648
%$2
66$4
9$8
1$8
1$9
6$1
73$1
58$8
0$4
$11
$155
$218
$597
$178
$46
$98
$2,2
90N
o S
ubst
ance
Abu
se92
52%
$364
$38
$81
$86
$0$1
76$1
81$4
0$0
$6$1
42$2
59$6
63$1
64$4
8$1
00$2
,348
Sub
stan
ce A
buse
7444
%$1
44$6
2$8
2$7
4$2
15$1
69$1
31$1
29$8
$16
$170
$166
$515
$196
$45
$96
$2,2
18D
isab
ility
989
57%
$1,0
97$1
09$8
1$4
1$7
7$1
74$2
10$5
3$2
$8$1
39$2
46$3
59$2
98$5
3$1
19$3
,065
No
Men
tal I
llnes
s64
858
%$1
,201
$99
$47
$0$7
3$1
75$2
11$4
9$1
$7$1
30$1
49$0
$247
$33
$77
$2,4
99N
o S
ubst
ance
Abu
se47
360
%$1
,552
$92
$43
$0$0
$177
$225
$34
$1$4
$118
$136
$0$2
56$3
1$7
4$2
,744
Sub
stan
ce A
buse
175
51%
$251
$118
$56
$0$2
72$1
69$1
73$9
0$0
$14
$162
$185
$0$2
23$3
8$8
6$1
,838
Men
tal I
llnes
s34
156
%$8
99$1
27$1
47$1
19$8
5$1
71$2
06$6
0$3
$11
$158
$430
$1,0
40$3
95$9
2$1
97$4
,142
No
Sub
stan
ce A
buse
182
56%
$510
$127
$107
$92
$0$1
73$2
24$4
6$2
$8$1
58$3
48$1
,382
$233
$68
$141
$3,6
20
Data Table A2 75

App
endi
x 2
- Dat
a Ta
ble
A2
(con
t.)
GR
OU
P
Number of Persons
Percent of Months Homeless
LA Co Dept Health Srv hospital-inpatient
LA Co Dept Health Srv outpatient clinic
LA Co Dept Health Srv emergency room
LA Co Mental Health
LA Co Public Health
LA Co DPSS Food Stamps
LA Co DPSS General Relief
LA Co DPSS GR Housing Vouchers
LAHSA homeless srv.
LA Co Probation Dept
LA Co Sheriff general jail facilities/services
LA Co Sheriff medical jail facilities/services
LA Co Sheriff mental health jail facilities/srv
Private hospitals-inpatient
Private hospitals-emergency room
Emergency Medical Transportation
Total Average Monthly Cost when Homeless
Sub
stan
ce A
buse
159
56%
$1,3
45$1
27$1
92$1
50$1
82$1
69$1
86$7
6$4
$14
$157
$524
$649
$581
$120
$262
$4,7
39R
ecen
t Wor
k H
isto
ry19
852
%$9
7$9
3$3
5$4
3$3
1$1
61$1
86$4
8$5
$8$5
1$6
3$5
9$1
01$2
3$5
0$1
,055
No
Dis
abili
ty12
248
%$9
4$7
0$2
5$5
4$2
0$1
56$1
87$4
7$1
$8$6
2$5
3$2
8$8
1$1
7$3
7$9
41N
o M
enta
l Illn
ess
9947
%$7
6$7
0$1
5$0
$17
$158
$188
$47
$1$8
$39
$26
$0$4
0$1
1$2
3$7
20N
o S
ubst
ance
Abu
se80
47%
$74
$53
$11
$0$0
$156
$197
$40
$1$6
$33
$22
$0$1
1$9
$16
$629
Sub
stan
ce A
buse
1947
%$8
8$1
41$3
1$0
$89
$168
$152
$72
$1$1
7$6
4$4
4$0
$163
$22
$52
$1,1
03M
enta
l Illn
ess
2353
%$1
68$6
8$6
7$2
89$3
1$1
48$1
83$4
7$2
$8$1
61$1
71$1
48$2
59$4
4$9
8$1
,892
No
Sub
stan
ce A
buse
1649
%$0
$23
$19
$13
$0$1
45$2
03$3
5$0
$4$1
26$0
$213
$0$1
6$2
9$8
24S
ubst
ance
Abu
se7
62%
$553
$172
$178
$920
$102
$154
$137
$75
$6$1
7$2
41$5
62$0
$851
$107
$258
$4,3
33D
isab
ility
7659
%$1
02$1
31$5
3$2
4$4
9$1
68$1
85$5
0$1
2$7
$34
$77
$108
$133
$33
$70
$1,2
38N
o M
enta
l Illn
ess
5262
%$1
32$1
15$4
6$0
$39
$169
$193
$50
$15
$7$3
1$1
4$0
$159
$28
$62
$1,0
61N
o S
ubst
ance
Abu
se34
62%
$127
$137
$41
$0$0
$173
$215
$30
$22
$0$1
6$2
2$0
$129
$22
$49
$981
Sub
stan
ce A
buse
1860
%$1
43$7
3$5
5$0
$113
$163
$151
$89
$3$2
0$5
8$0
$0$2
17$3
9$8
7$1
,212
Men
tal I
llnes
s24
53%
$38
$167
$68
$76
$71
$166
$168
$50
$4$8
$39
$214
$342
$77
$45
$88
$1,6
21N
o S
ubst
ance
Abu
se10
55%
$0$2
04$2
7$1
40$0
$153
$166
$14
$3$7
$20
$3$3
6$0
$27
$50
$851
Sub
stan
ce A
buse
1453
%$6
4$1
40$9
7$3
0$1
22$1
76$1
70$7
6$5
$9$5
3$3
65$5
60$1
33$5
8$1
15$2
,172
76 Where We Sleep

App
endi
x 2
- Dat
a Ta
ble
A3
Six
-Var
iabl
e B
reak
outs
of A
vera
ge M
onth
ly C
osts
of 9
,186
Los
Ang
eles
Cou
nty
Gen
eral
Rel
ief R
ecip
ient
s in
Mon
ths
whe
n N
ot
Hom
eles
sS
ubgr
oups
def
ined
by
gend
er, a
ge, w
ork
hist
ory,
dis
abili
ty, m
enta
l illn
ess,
and
sub
stan
ce a
buse
Cos
ts fo
r Jan
uary
200
6 th
roug
h O
ctob
er 2
007,
Con
verte
d to
200
8 D
olla
rsS
mal
l sub
popu
latio
ns (<
25) w
ith le
ss re
liabl
e da
ta a
re h
ighl
ight
ed
GR
OU
P
Number of Persons
LA Co Dept Health Srv hospital-inpatient
LA Co Dept Health Srv outpatient clinic
LA Co Dept Health Srv emergency room
LA Co Dept Mental Health
LA Co Dept Public Health
LA Co Dept Public Social Srv Food Stamps
LA Co Dept Public Social Srv General Relief
LA Co Probation Dept
LA Co Sheriff general jail facilities/services
LA Co Sheriff medical jail facilities/services
LA Co Sheriff mental health jail facilities/srv
Private hospitals-inpatient
Private hospitals-emergency room
Emergency Medical Transportation
Total Average Monthly Cost when Not Homeless
Difference: Not Homeless minus Homeless
Eve
ryon
e9,
186
$152
$32
$24
$28
$62
$22
$24
$9$8
3$8
1$7
8$8
6$1
5$3
3$7
28-$
719
Fem
ale
2,66
5$1
03$3
8$2
3$3
3$6
5$2
5$2
9$7
$47
$10
$56
$67
$14
$31
$549
-$57
718
-29
year
s97
0$1
9$1
8$9
$20
$37
$15
$15
$6$3
4$3
$26
$25
$7$1
5$2
49-$
503
No
Rec
ent W
ork
His
tory
842
$20
$18
$9$2
1$3
9$1
4$1
4$6
$35
$3$2
8$2
8$7
$14
$254
-$52
8N
o D
isab
ility
689
$15
$15
$8$1
0$4
0$1
2$1
1$6
$32
$0$6
$24
$6$1
3$1
98-$
491
No
Men
tal I
llnes
s55
5$1
3$1
4$7
$0$2
8$1
1$1
0$4
$29
$0$0
$19
$5$1
1$1
50-$
419
No
Sub
stan
ce A
buse
472
$14
$14
$6$0
$0$7
$8$3
$13
$0$0
$16
$5$1
0$9
6-$
374
Sub
stan
ce A
buse
83$1
3$1
0$1
1$0
$186
$28
$16
$15
$115
$0$0
$33
$9$1
9$4
55-$
671
Men
tal I
llnes
s13
4$2
2$2
2$1
1$5
4$9
3$1
8$1
5$1
2$4
8$0
$29
$47
$9$1
9$3
97-$
791
No
Sub
stan
ce A
buse
82$2
1$1
6$1
0$6
1$0
$14
$15
$6$3
0$0
$16
$45
$8$1
7$2
57-$
596
Sub
stan
ce A
buse
52$2
4$3
1$1
2$4
4$2
40$2
5$1
5$2
0$7
6$0
$50
$50
$10
$22
$619
-$1,
098
Dis
abili
ty15
3$4
2$2
9$1
5$6
7$3
1$2
3$2
8$7
$47
$16
$128
$44
$10
$22
$509
-$69
3N
o M
enta
l Illn
ess
90$4
$18
$6$0
$10
$17
$21
$5$3
5$4
$0$1
1$4
$9$1
44-$
582
No
Sub
stan
ce A
buse
78$0
$13
$4$0
$0$1
5$2
0$2
$22
$0$0
$0$3
$6$8
5-$
563
Sub
stan
ce A
buse
12$3
0$5
1$1
4$0
$78
$31
$27
$24
$118
$32
$0$8
1$1
3$3
0$5
29-$
706
Men
tal I
llnes
s63
$98
$45
$29
$164
$62
$31
$38
$11
$65
$33
$313
$91
$18
$40
$1,0
38-$
845
No
Sub
stan
ce A
buse
43$1
42$6
0$3
4$1
62$0
$25
$30
$3$1
7$4
8$2
83$1
33$2
1$4
8$1
,005
-$78
7S
ubst
ance
Abu
se20
$0$1
2$1
6$1
68$2
02$4
6$5
5$2
8$1
74$0
$381
$0$1
3$2
3$1
,118
-$96
0R
ecen
t Wor
k H
isto
ry12
8$9
$17
$12
$16
$22
$24
$24
$9$2
6$0
$17
$11
$9$1
7$2
12-$
339
No
Dis
abili
ty10
8$1
1$1
7$7
$6$2
7$2
0$1
8$9
$31
$0$0
$13
$4$9
$171
-$37
3N
o M
enta
l Illn
ess
88$1
3$1
8$6
$0$2
3$1
6$1
3$7
$32
$0$0
$16
$4$9
$156
-$26
7N
o S
ubst
ance
Abu
se78
$15
$12
$7$0
$0$1
4$1
0$5
$30
$0$0
$18
$5$1
0$1
26-$
261
Sub
stan
ce A
buse
10$0
$65
$0$2
02$3
0$3
0$2
0$4
5$0
$0$0
$0$0
$391
-$31
3M
enta
l Illn
ess
20$0
$12
$9$3
4$4
3$4
1$4
3$2
0$2
6$0
$0$0
$5$9
$242
-$83
6N
o S
ubst
ance
Abu
se14
$0$7
$14
$32
$0$2
5$3
0$1
6$2
0$0
$0$0
$7$1
3$1
65-$
585
Sub
stan
ce A
buse
6$0
$23
$37
$137
$74
$73
$27
$38
$0$0
$0$0
$0$4
08-$
1,43
6D
isab
ility
20$0
$21
$40
$68
$0$4
6$5
7$7
$2$0
$106
$0$3
1$5
7$4
32-$
158
Data Table A3 77

App
endi
x 2
- Dat
a Ta
ble
A3
(con
t.)
GR
OU
P
Number of Persons
LA Co Dept Health Srv hospital-inpatient
LA Co Dept Health Srv outpatient clinic
LA Co Dept Health Srv emergency room
LA Co Dept Mental Health
LA Co Dept Public Health
LA Co Dept Public Social Srv Food Stamps
LA Co Dept Public Social Srv General Relief
LA Co Probation Dept
LA Co Sheriff general jail facilities/services
LA Co Sheriff medical jail facilities/services
LA Co Sheriff mental health jail facilities/srv
Private hospitals-inpatient
Private hospitals-emergency room
Emergency Medical Transportation
Total Average Monthly Cost when Not Homeless
Difference: Not Homeless minus Homeless
No
Men
tal I
llnes
s10
$0$3
1$3
2$0
$0$3
5$3
3$8
$0$0
$0$0
$25
$46
$210
-$36
2N
o S
ubst
ance
Abu
se10
$0$3
1$3
2$0
$0$3
5$3
3$8
$0$0
$0$0
$25
$46
$210
-$36
2S
ubst
ance
Abu
se0
..
..
..
..
..
Men
tal I
llnes
s10
$0$1
0$4
8$1
35$0
$56
$81
$5$3
$0$2
12$0
$37
$67
$655
$47
No
Sub
stan
ce A
buse
7$0
$10
$33
$104
$0$5
2$7
5$8
$5$0
$303
$0$3
0$5
5$6
73$9
4S
ubst
ance
Abu
se3
$0$1
0$8
1$2
09$0
$67
$96
$0$0
$0$0
$0$5
3$9
7$6
12-$
6230
-45
year
s93
8$1
29$4
3$2
8$4
0$9
5$2
7$3
2$1
0$6
8$9
$40
$82
$18
$39
$660
-$60
7N
o R
ecen
t Wor
k H
isto
ry83
6$1
35$4
0$2
9$4
3$9
8$2
6$3
0$1
0$7
2$1
0$4
4$8
0$1
9$4
0$6
75-$
629
No
Dis
abili
ty51
0$5
5$2
1$1
6$1
5$1
02$1
8$1
8$1
0$7
2$1
1$3
3$4
5$1
1$2
3$4
51-$
600
No
Men
tal I
llnes
s34
2$7
4$2
2$1
1$0
$89
$14
$13
$8$6
0$1
1$0
$51
$7$1
7$3
77-$
412
No
Sub
stan
ce A
buse
230
$81
$19
$10
$0$0
$10
$10
$3$3
1$1
2$0
$45
$6$1
4$2
42-$
322
Sub
stan
ce A
buse
112
$60
$27
$12
$0$2
69$2
3$1
8$1
9$1
19$9
$0$6
3$9
$22
$652
-$59
9M
enta
l Illn
ess
168
$16
$18
$27
$47
$130
$25
$30
$13
$98
$12
$101
$35
$18
$35
$604
-$97
9N
o S
ubst
ance
Abu
se68
$17
$17
$24
$27
$0$1
8$2
7$7
$60
$0$8
$36
$21
$40
$302
-$75
1S
ubst
ance
Abu
se10
0$1
4$1
8$2
9$6
1$2
18$3
0$3
2$1
7$1
24$2
0$1
63$3
4$1
6$3
2$8
07-$
1,13
5D
isab
ility
326
$269
$71
$51
$90
$90
$38
$51
$10
$73
$8$6
3$1
33$3
1$6
6$1
,044
-$65
9N
o M
enta
l Illn
ess
132
$150
$77
$36
$0$8
4$3
2$3
8$1
0$7
4$5
$0$1
14$2
3$5
1$6
92-$
640
No
Sub
stan
ce A
buse
80$2
41$6
7$2
6$0
$0$2
6$3
3$4
$44
$4$0
$149
$15
$37
$644
-$48
6S
ubst
ance
Abu
se52
$17
$92
$49
$0$2
05$4
0$4
4$1
8$1
17$6
$0$6
0$3
7$7
2$7
59-$
884
Men
tal I
llnes
s19
4$3
53$6
7$6
2$1
53$9
5$4
3$6
0$9
$72
$11
$107
$147
$36
$76
$1,2
90-$
665
No
Sub
stan
ce A
buse
100
$105
$55
$40
$133
$0$3
9$6
0$6
$35
$0$1
61$7
2$2
3$4
7$7
77-$
936
Sub
stan
ce A
buse
94$6
11$8
0$8
5$1
75$1
94$4
7$5
9$1
4$1
10$2
2$5
0$2
27$4
9$1
06$1
,829
-$38
3R
ecen
t Wor
k H
isto
ry10
2$7
8$7
4$2
3$1
6$7
2$3
8$4
6$9
$28
$0$3
$101
$15
$34
$537
-$42
5N
o D
isab
ility
63$3
9$5
5$1
8$1
0$7
1$3
2$3
5$1
0$1
4$0
$0$7
7$1
4$3
0$4
06-$
455
No
Men
tal I
llnes
s43
$58
$54
$13
$0$8
2$2
2$2
8$1
2$2
0$0
$0$1
13$8
$23
$434
-$36
2N
o S
ubst
ance
Abu
se29
$84
$32
$7$0
$0$1
5$2
1$3
$16
$0$0
$168
$6$2
3$3
76-$
190
Sub
stan
ce A
buse
14$0
$102
$27
$0$2
58$3
7$4
5$3
0$2
8$0
$0$0
$13
$25
$564
-$71
0M
enta
l Illn
ess
20$0
$56
$26
$32
$50
$52
$49
$7$3
$0$0
$0$2
5$4
6$3
46-$
656
No
Sub
stan
ce A
buse
9$0
$51
$32
$56
$0$5
4$5
2$0
$0$0
$0$0
$30
$55
$329
-$28
1S
ubst
ance
Abu
se11
$0$6
0$2
2$1
2$9
1$5
1$4
7$1
3$5
$0$0
$0$2
1$3
8$3
59-$
963
Dis
abili
ty39
$143
$107
$31
$26
$74
$47
$64
$7$5
1$0
$9$1
39$1
6$3
9$7
53-$
374
No
Men
tal I
llnes
s21
$87
$74
$24
$0$6
6$4
3$5
4$8
$58
$0$0
$77
$16
$35
$542
-$73
5N
o S
ubst
ance
Abu
se18
$101
$74
$28
$0$0
$46
$56
$10
$68
$0$0
$90
$18
$40
$532
-$15
9S
ubst
ance
Abu
se3
$0$7
1$0
$461
$23
$44
$0$0
$0$0
$0$0
$0$5
99-$
4,19
3
78 Where We Sleep

App
endi
x 2
- Dat
a Ta
ble
A3
(con
t.)
GR
OU
P
Number of Persons
LA Co Dept Health Srv hospital-inpatient
LA Co Dept Health Srv outpatient clinic
LA Co Dept Health Srv emergency room
LA Co Dept Mental Health
LA Co Dept Public Health
LA Co Dept Public Social Srv Food Stamps
LA Co Dept Public Social Srv General Relief
LA Co Probation Dept
LA Co Sheriff general jail facilities/services
LA Co Sheriff medical jail facilities/services
LA Co Sheriff mental health jail facilities/srv
Private hospitals-inpatient
Private hospitals-emergency room
Emergency Medical Transportation
Total Average Monthly Cost when Not Homeless
Difference: Not Homeless minus Homeless
Men
tal I
llnes
s18
$216
$150
$40
$60
$86
$52
$76
$5$4
1$0
$20
$212
$16
$45
$1,0
20$6
9N
o S
ubst
ance
Abu
se9
$0$3
7$7
7$0
$42
$63
$0$6
2$0
$47
$0$0
$0$3
27-$
325
Sub
stan
ce A
buse
9$3
83$2
38$6
8$4
8$1
52$6
0$8
7$9
$24
$0$0
$423
$33
$90
$1,6
15$3
6746
-65
year
s74
1$1
87$6
2$3
4$3
9$6
7$3
7$4
6$6
$38
$21
$120
$105
$20
$44
$826
-$62
7N
o R
ecen
t Wor
k H
isto
ry63
6$1
96$5
9$3
3$4
2$6
1$3
5$4
3$6
$42
$24
$141
$106
$19
$42
$849
-$66
7N
o D
isab
ility
282
$175
$37
$12
$8$3
8$1
9$2
1$5
$41
$0$1
31$2
7$7
$14
$535
-$59
9N
o M
enta
l Illn
ess
226
$218
$34
$8$0
$39
$15
$15
$4$3
0$0
$0$3
4$4
$10
$412
-$55
1N
o S
ubst
ance
Abu
se18
3$2
54$2
6$4
$0$0
$11
$11
$1$1
2$0
$0$2
5$2
$6$3
52-$
522
Sub
stan
ce A
buse
43$7
5$6
5$2
4$0
$195
$34
$30
$18
$102
$0$0
$71
$13
$29
$655
-$68
5M
enta
l Illn
ess
56$0
$51
$28
$38
$35
$36
$47
$7$8
5$0
$656
$0$1
5$2
8$1
,027
-$79
5N
o S
ubst
ance
Abu
se37
$0$5
6$1
7$1
1$0
$32
$47
$4$4
4$0
$195
$0$1
0$1
9$4
35-$
1,36
4S
ubst
ance
Abu
se19
$0$4
3$4
6$8
7$9
7$4
4$4
6$1
2$1
58$0
$1,4
81$0
$25
$46
$2,0
86$2
20D
isab
ility
354
$214
$76
$50
$69
$80
$47
$62
$7$4
4$4
4$1
49$1
68$2
9$6
4$1
,104
-$71
7N
o M
enta
l Illn
ess
198
$103
$63
$24
$0$6
6$4
1$5
2$4
$36
$29
$0$9
8$1
6$3
6$5
68-$
485
No
Sub
stan
ce A
buse
146
$93
$49
$19
$0$0
$28
$38
$1$1
9$0
$0$9
5$1
3$3
1$3
86-$
566
Sub
stan
ce A
buse
52$1
30$1
04$3
6$0
$249
$74
$92
$15
$82
$108
$0$1
06$2
4$5
2$1
,073
-$26
8M
enta
l Illn
ess
156
$359
$93
$84
$160
$98
$56
$74
$11
$54
$65
$342
$258
$45
$100
$1,7
99-$
994
No
Sub
stan
ce A
buse
86$4
01$1
11$4
2$1
36$0
$55
$78
$5$3
6$1
11$7
6$1
54$2
1$4
9$1
,274
-$81
5S
ubst
ance
Abu
se70
$309
$73
$132
$188
$213
$57
$70
$18
$76
$11
$653
$385
$74
$163
$2,4
22-$
1,23
6R
ecen
t Wor
k H
isto
ry10
5$1
35$7
7$4
3$2
7$1
00$4
8$5
9$6
$11
$0$2
$99
$27
$57
$691
-$37
6N
o D
isab
ility
66$1
4$3
7$2
5$2
6$8
6$4
2$4
8$5
$9$0
$3$2
1$1
1$2
2$3
51-$
423
No
Men
tal I
llnes
s48
$19
$29
$5$0
$59
$44
$53
$1$1
2$0
$0$2
9$4
$10
$267
-$43
7N
o S
ubst
ance
Abu
se39
$24
$11
$7$0
$0$4
0$4
7$0
$6$0
$0$3
6$6
$13
$189
-$34
4S
ubst
ance
Abu
se9
$0$1
06$0
$313
$59
$80
$8$3
7$0
$0$0
$0$0
$604
-$84
2M
enta
l Illn
ess
18$0
$61
$80
$98
$162
$38
$34
$14
$2$0
$13
$0$3
0$5
5$5
86-$
370
No
Sub
stan
ce A
buse
11$0
$95
$6$1
23$0
$48
$55
$12
$3$0
$23
$0$3
$6$3
73-$
482
Sub
stan
ce A
buse
7$0
$13
$182
$62
$394
$23
$4$1
6$0
$0$0
$0$7
1$1
31$8
97-$
219
Dis
abili
ty39
$346
$147
$76
$30
$125
$57
$79
$8$1
4$0
$0$2
31$5
4$1
15$1
,281
-$28
3N
o M
enta
l Illn
ess
27$3
30$9
8$6
0$0
$43
$46
$57
$2$2
0$0
$0$1
54$4
2$8
8$9
39-$
371
No
Sub
stan
ce A
buse
18$4
69$1
04$5
6$0
$0$4
3$5
0$0
$0$0
$0$1
74$3
8$8
2$1
,016
$500
Sub
stan
ce A
buse
9$8
4$8
7$6
5$0
$120
$50
$68
$5$5
6$0
$0$1
14$5
0$1
01$8
00-$
2,10
0M
enta
l Illn
ess
12$3
79$2
49$1
07$9
3$2
97$8
1$1
24$2
0$0
$0$0
$406
$80
$175
$2,0
10-$
124
No
Sub
stan
ce A
buse
8$2
46$4
1$1
00$1
02$0
$89
$130
$10
$0$0
$0$4
06$7
3$1
63$1
,359
-$17
6S
ubst
ance
Abu
se4
$645
$666
$120
$73
$890
$64
$112
$40
$0$0
$0$4
06$9
4$2
01$3
,311
-$18
Data Table A3 79

App
endi
x 2
- Dat
a Ta
ble
A3
(con
t.)
GR
OU
P
Number of Persons
LA Co Dept Health Srv hospital-inpatient
LA Co Dept Health Srv outpatient clinic
LA Co Dept Health Srv emergency room
LA Co Dept Mental Health
LA Co Dept Public Health
LA Co Dept Public Social Srv Food Stamps
LA Co Dept Public Social Srv General Relief
LA Co Probation Dept
LA Co Sheriff general jail facilities/services
LA Co Sheriff medical jail facilities/services
LA Co Sheriff mental health jail facilities/srv
Private hospitals-inpatient
Private hospitals-emergency room
Emergency Medical Transportation
Total Average Monthly Cost when Not Homeless
Difference: Not Homeless minus Homeless
Mal
e6,
521
$172
$29
$24
$25
$61
$21
$22
$9$9
8$1
11$8
6$9
3$1
5$3
3$8
01-$
776
18-2
9 ye
ars
1,59
0$1
08$1
4$2
0$4
2$3
8$1
4$1
3$1
2$1
15$1
04$7
5$6
2$1
0$2
3$6
50-$
516
No
Rec
ent W
ork
His
tory
1,44
8$1
17$1
4$2
2$4
5$3
9$1
4$1
2$1
2$1
16$1
09$7
9$6
5$1
1$2
4$6
79-$
541
No
Dis
abili
ty1,
117
$33
$8$8
$18
$36
$11
$8$1
1$1
16$1
18$4
8$2
3$5
$12
$457
-$52
0N
o M
enta
l Illn
ess
891
$11
$7$3
$0$2
8$1
0$8
$10
$99
$63
$0$1
0$2
$5$2
57-$
455
No
Sub
stan
ce A
buse
726
$5$6
$3$0
$0$8
$7$6
$84
$68
$0$9
$2$5
$204
-$41
8S
ubst
ance
Abu
se16
5$3
8$1
0$4
$0$1
54$2
0$1
2$2
6$1
63$4
1$0
$13
$3$7
$492
-$61
9M
enta
l Illn
ess
226
$120
$11
$26
$87
$68
$16
$12
$17
$186
$332
$236
$77
$17
$37
$1,2
42-$
780
No
Sub
stan
ce A
buse
133
$42
$6$2
1$3
7$0
$4$6
$12
$213
$455
$340
$24
$14
$28
$1,2
03-$
879
Sub
stan
ce A
buse
93$2
33$2
0$3
5$1
60$1
65$3
3$2
0$2
3$1
46$1
54$8
5$1
53$2
1$4
9$1
,297
-$64
0D
isab
ility
331
$419
$35
$73
$145
$47
$25
$27
$13
$116
$78
$193
$205
$29
$68
$1,4
73-$
569
No
Men
tal I
llnes
s19
7$1
6$2
2$9
$0$4
2$2
2$2
2$1
3$9
9$1
14$0
$12
$6$1
1$3
89-$
866
No
Sub
stan
ce A
buse
154
$21
$25
$10
$0$0
$21
$23
$7$6
3$1
27$0
$16
$6$1
2$3
30-$
532
Sub
stan
ce A
buse
43$0
$15
$5$0
$177
$26
$19
$33
$214
$73
$0$0
$4$8
$575
-$2,
082
Men
tal I
llnes
s13
4$1
,002
$52
$165
$356
$55
$28
$35
$13
$141
$25
$473
$488
$64
$151
$3,0
47-$
152
No
Sub
stan
ce A
buse
93$5
94$4
9$3
7$4
7$0
$22
$34
$9$1
47$2
6$2
33$1
28$2
1$4
8$1
,394
-$1,
242
Sub
stan
ce A
buse
41$1
,871
$60
$429
$1,0
12$1
70$4
2$3
6$2
3$1
29$2
3$9
82$1
,304
$160
$386
$6,6
27$2
,151
Rec
ent W
ork
His
tory
142
$18
$14
$7$1
2$2
7$1
7$2
2$8
$96
$52
$33
$34
$4$1
0$3
55-$
255
No
Dis
abili
ty12
3$2
1$1
7$5
$1$3
1$1
5$1
9$9
$105
$54
$39
$40
$4$1
0$3
69-$
214
No
Men
tal I
llnes
s10
4$2
5$1
7$5
$0$2
1$1
2$1
5$9
$100
$8$0
$47
$4$1
1$2
74-$
265
No
Sub
stan
ce A
buse
93$2
8$1
6$6
$0$0
$11
$14
$8$8
3$9
$0$5
2$5
$12
$243
-$27
4S
ubst
ance
Abu
se11
$0$2
5$0
$195
$24
$19
$23
$246
$0$0
$0$0
$0$5
32-$
186
Men
tal I
llnes
s19
$0$1
5$6
$7$8
5$3
3$4
4$9
$129
$301
$248
$0$5
$9$8
89$6
0N
o S
ubst
ance
Abu
se13
$0$8
$5$2
$0$2
8$4
6$6
$117
$440
$362
$0$3
$5$1
,022
$193
Sub
stan
ce A
buse
6$0
$31
$8$1
7$2
68$4
3$4
0$1
4$1
54$0
$0$0
$9$1
6$6
01-$
229
Dis
abili
ty19
$0$0
$17
$81
$0$2
8$3
7$4
$43
$44
$0$0
$3$6
$264
-$52
1N
o M
enta
l Illn
ess
11$0
$0$0
$0$6
$10
$7$6
9$7
6$0
$0$0
$0$1
69-$
341
No
Sub
stan
ce A
buse
10$0
$0$0
$0$7
$11
$8$2
1$0
$0$0
$0$0
$47
-$48
1S
ubst
ance
Abu
se1
$0$0
$0$0
$0$0
$0$5
53$8
36$0
$0$0
$0$1
,389
$1,0
67M
enta
l Illn
ess
8$0
$0$3
9$1
93$0
$59
$74
$0$7
$0$0
$0$8
$14
$394
-$77
0N
o S
ubst
ance
Abu
se5
$0$0
$63
$268
$0$7
1$8
3$0
$10
$0$0
$0$1
2$2
3$5
31-$
466
Sub
stan
ce A
buse
3$0
$0$6
7$0
$40
$60
$0$0
$0$0
$0$0
$0$1
66-$
1,27
630
-45
year
s2,
833
$118
$26
$22
$21
$59
$21
$21
$9$1
02$1
20$8
0$6
5$1
3$2
9$7
06-$
762
No
Rec
ent W
ork
His
tory
2,56
0$1
27$2
6$2
2$2
1$5
9$2
0$2
1$9
$102
$127
$88
$69
$14
$30
$736
-$77
4
80 Where We Sleep
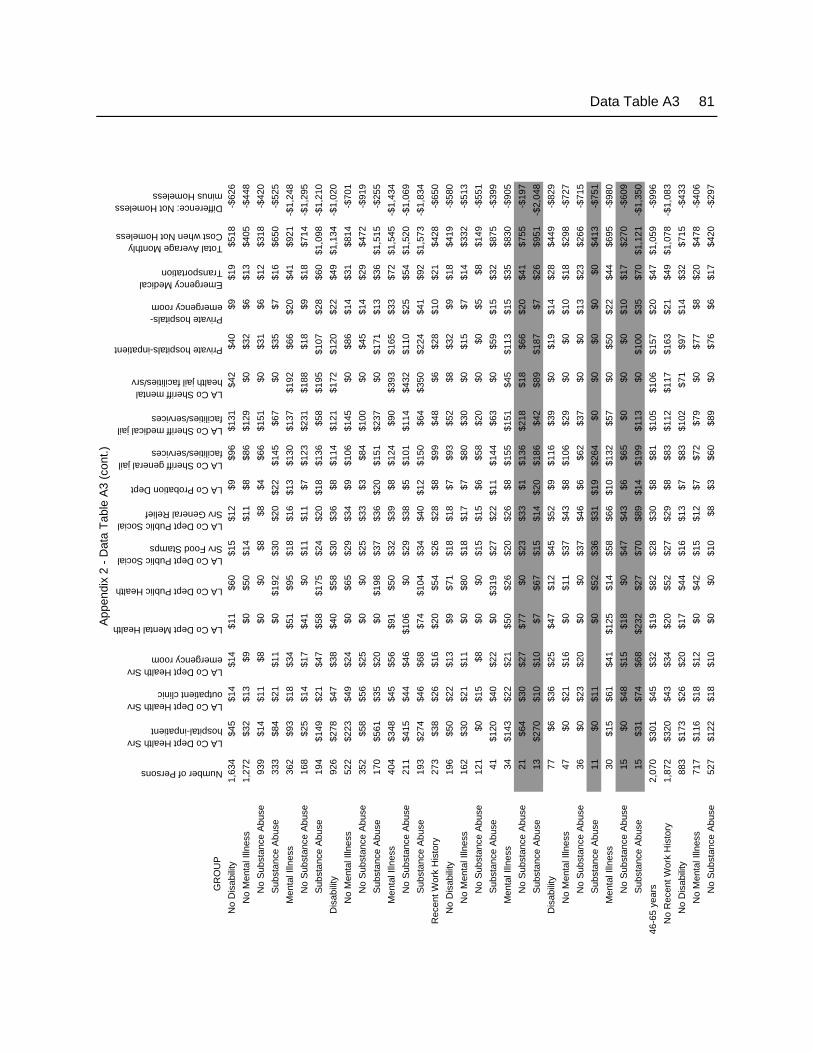
App
endi
x 2
- Dat
a Ta
ble
A3
(con
t.)
GR
OU
P
Number of Persons
LA Co Dept Health Srv hospital-inpatient
LA Co Dept Health Srv outpatient clinic
LA Co Dept Health Srv emergency room
LA Co Dept Mental Health
LA Co Dept Public Health
LA Co Dept Public Social Srv Food Stamps
LA Co Dept Public Social Srv General Relief
LA Co Probation Dept
LA Co Sheriff general jail facilities/services
LA Co Sheriff medical jail facilities/services
LA Co Sheriff mental health jail facilities/srv
Private hospitals-inpatient
Private hospitals-emergency room
Emergency Medical Transportation
Total Average Monthly Cost when Not Homeless
Difference: Not Homeless minus Homeless
No
Dis
abili
ty1,
634
$45
$14
$14
$11
$60
$15
$12
$9$9
6$1
31$4
2$4
0$9
$19
$518
-$62
6N
o M
enta
l Illn
ess
1,27
2$3
2$1
3$9
$0$5
0$1
4$1
1$8
$86
$129
$0$3
2$6
$13
$405
-$44
8N
o S
ubst
ance
Abu
se93
9$1
4$1
1$8
$0$0
$8$8
$4$6
6$1
51$0
$31
$6$1
2$3
18-$
420
Sub
stan
ce A
buse
333
$84
$21
$11
$0$1
92$3
0$2
0$2
2$1
45$6
7$0
$35
$7$1
6$6
50-$
525
Men
tal I
llnes
s36
2$9
3$1
8$3
4$5
1$9
5$1
8$1
6$1
3$1
30$1
37$1
92$6
6$2
0$4
1$9
21-$
1,24
8N
o S
ubst
ance
Abu
se16
8$2
5$1
4$1
7$4
1$0
$11
$11
$7$1
23$2
31$1
88$1
8$9
$18
$714
-$1,
295
Sub
stan
ce A
buse
194
$149
$21
$47
$58
$175
$24
$20
$18
$136
$58
$195
$107
$28
$60
$1,0
98-$
1,21
0D
isab
ility
926
$278
$47
$38
$40
$58
$30
$36
$8$1
14$1
21$1
72$1
20$2
2$4
9$1
,134
-$1,
020
No
Men
tal I
llnes
s52
2$2
23$4
9$2
4$0
$65
$29
$34
$9$1
06$1
45$0
$86
$14
$31
$814
-$70
1N
o S
ubst
ance
Abu
se35
2$5
8$5
6$2
5$0
$0$2
5$3
3$3
$84
$100
$0$4
5$1
4$2
9$4
72-$
919
Sub
stan
ce A
buse
170
$561
$35
$20
$0$1
98$3
7$3
6$2
0$1
51$2
37$0
$171
$13
$36
$1,5
15-$
255
Men
tal I
llnes
s40
4$3
48$4
5$5
6$9
1$5
0$3
2$3
9$8
$124
$90
$393
$165
$33
$72
$1,5
45-$
1,43
4N
o S
ubst
ance
Abu
se21
1$4
15$4
4$4
6$1
06$0
$29
$38
$5$1
01$1
14$4
32$1
10$2
5$5
4$1
,520
-$1,
069
Sub
stan
ce A
buse
193
$274
$46
$68
$74
$104
$34
$40
$12
$150
$64
$350
$224
$41
$92
$1,5
73-$
1,83
4R
ecen
t Wor
k H
isto
ry27
3$3
8$2
6$1
6$2
0$5
4$2
6$2
8$8
$99
$48
$6$2
8$1
0$2
1$4
28-$
650
No
Dis
abili
ty19
6$5
0$2
2$1
3$9
$71
$18
$18
$7$9
3$5
2$8
$32
$9$1
8$4
19-$
580
No
Men
tal I
llnes
s16
2$3
0$2
1$1
1$0
$80
$18
$17
$7$8
0$3
0$0
$15
$7$1
4$3
32-$
513
No
Sub
stan
ce A
buse
121
$0$1
5$8
$0$0
$15
$15
$6$5
8$2
0$0
$0$5
$8$1
49-$
551
Sub
stan
ce A
buse
41$1
20$4
0$2
2$0
$319
$27
$22
$11
$144
$63
$0$5
9$1
5$3
2$8
75-$
399
Men
tal I
llnes
s34
$143
$22
$21
$50
$26
$20
$26
$8$1
55$1
51$4
5$1
13$1
5$3
5$8
30-$
905
No
Sub
stan
ce A
buse
21$6
4$3
0$2
7$7
7$0
$23
$33
$1$1
36$2
18$1
8$6
6$2
0$4
1$7
55-$
197
Sub
stan
ce A
buse
13$2
70$1
0$1
0$7
$67
$15
$14
$20
$186
$42
$89
$187
$7$2
6$9
51-$
2,04
8D
isab
ility
77$6
$36
$25
$47
$12
$45
$52
$9$1
16$3
9$0
$19
$14
$28
$449
-$82
9N
o M
enta
l Illn
ess
47$0
$21
$16
$0$1
1$3
7$4
3$8
$106
$29
$0$0
$10
$18
$298
-$72
7N
o S
ubst
ance
Abu
se36
$0$2
3$2
0$0
$0$3
7$4
6$6
$62
$37
$0$0
$13
$23
$266
-$71
5S
ubst
ance
Abu
se11
$0$1
1$0
$52
$36
$31
$19
$264
$0$0
$0$0
$0$4
13-$
751
Men
tal I
llnes
s30
$15
$61
$41
$125
$14
$58
$66
$10
$132
$57
$0$5
0$2
2$4
4$6
95-$
980
No
Sub
stan
ce A
buse
15$0
$48
$15
$18
$0$4
7$4
3$6
$65
$0$0
$0$1
0$1
7$2
70-$
609
Sub
stan
ce A
buse
15$3
1$7
4$6
8$2
32$2
7$7
0$8
9$1
4$1
99$1
13$0
$100
$35
$70
$1,1
21-$
1,35
046
-65
year
s2,
070
$301
$45
$32
$19
$82
$28
$30
$8$8
1$1
05$1
06$1
57$2
0$4
7$1
,059
-$99
6N
o R
ecen
t Wor
k H
isto
ry1,
872
$320
$43
$34
$20
$52
$27
$29
$8$8
3$1
12$1
17$1
63$2
1$4
9$1
,078
-$1,
083
No
Dis
abili
ty88
3$1
73$2
6$2
0$1
7$4
4$1
6$1
3$7
$83
$102
$71
$97
$14
$32
$715
-$43
3N
o M
enta
l Illn
ess
717
$116
$18
$12
$0$4
2$1
5$1
2$7
$72
$79
$0$7
7$8
$20
$478
-$40
6N
o S
ubst
ance
Abu
se52
7$1
22$1
8$1
0$0
$0$1
0$8
$3$6
0$8
9$0
$76
$6$1
7$4
20-$
297
Data Table A3 81

App
endi
x 2
- Dat
a Ta
ble
A3
(con
t.)
GR
OU
P
Number of Persons
LA Co Dept Health Srv hospital-inpatient
LA Co Dept Health Srv outpatient clinic
LA Co Dept Health Srv emergency room
LA Co Dept Mental Health
LA Co Dept Public Health
LA Co Dept Public Social Srv Food Stamps
LA Co Dept Public Social Srv General Relief
LA Co Probation Dept
LA Co Sheriff general jail facilities/services
LA Co Sheriff medical jail facilities/services
LA Co Sheriff mental health jail facilities/srv
Private hospitals-inpatient
Private hospitals-emergency room
Emergency Medical Transportation
Total Average Monthly Cost when Not Homeless
Difference: Not Homeless minus Homeless
Sub
stan
ce A
buse
190
$100
$19
$18
$0$1
56$2
8$2
1$1
7$1
05$5
2$0
$78
$13
$29
$633
-$71
3M
enta
l Illn
ess
166
$428
$58
$57
$94
$54
$22
$20
$10
$129
$203
$386
$185
$37
$81
$1,7
64-$
526
No
Sub
stan
ce A
buse
92$5
08$3
6$4
5$1
16$0
$19
$20
$6$1
26$3
56$2
38$2
33$2
6$6
4$1
,791
-$55
7S
ubst
ance
Abu
se74
$333
$83
$72
$68
$118
$26
$21
$14
$133
$20
$564
$124
$51
$102
$1,7
30-$
488
Dis
abili
ty98
9$4
58$6
0$4
7$2
2$5
9$3
7$4
4$8
$84
$122
$161
$221
$27
$65
$1,4
16-$
1,64
9N
o M
enta
l Illn
ess
648
$572
$55
$31
$0$5
2$3
7$4
5$7
$75
$97
$0$2
25$1
8$4
9$1
,266
-$1,
233
No
Sub
stan
ce A
buse
473
$465
$51
$26
$0$0
$34
$42
$4$6
8$7
2$0
$210
$15
$43
$1,0
30-$
1,71
4S
ubst
ance
Abu
se17
5$8
56$6
5$4
5$0
$190
$46
$54
$15
$95
$162
$0$2
67$2
6$6
7$1
,888
$50
Men
tal I
llnes
s34
1$2
41$6
9$7
6$6
3$7
2$3
8$4
3$9
$101
$171
$467
$212
$44
$96
$1,7
02-$
2,43
9N
o S
ubst
ance
Abu
se18
2$1
50$4
5$2
7$5
1$0
$36
$47
$7$9
2$8
3$5
27$9
2$1
7$3
7$1
,211
-$2,
408
Sub
stan
ce A
buse
159
$347
$98
$135
$78
$157
$39
$38
$12
$110
$276
$396
$350
$75
$162
$2,2
73-$
2,46
6R
ecen
t Wor
k H
isto
ry19
8$1
20$6
2$1
4$1
1$3
57$3
2$3
5$7
$63
$40
$2$1
05$9
$24
$882
-$17
3N
o D
isab
ility
122
$122
$57
$16
$7$2
9$2
2$2
4$6
$81
$22
$3$7
0$1
1$2
5$4
94-$
447
No
Men
tal I
llnes
s99
$103
$49
$8$0
$30
$24
$25
$6$6
1$2
7$0
$22
$6$1
2$3
71-$
348
No
Sub
stan
ce A
buse
80$1
28$4
7$6
$0$0
$23
$21
$4$6
2$0
$0$2
7$5
$10
$333
-$29
6S
ubst
ance
Abu
se19
$0$5
5$1
4$0
$150
$29
$42
$14
$56
$133
$0$0
$11
$20
$526
-$57
7M
enta
l Illn
ess
23$2
01$9
2$4
9$3
7$2
4$1
5$1
7$9
$165
$1$1
4$2
78$3
2$7
8$1
,011
-$88
1N
o S
ubst
ance
Abu
se16
$224
$62
$55
$6$0
$10
$14
$5$2
29$0
$20
$332
$35
$88
$1,0
79$2
55S
ubst
ance
Abu
se7
$149
$161
$33
$109
$79
$27
$23
$17
$19
$4$0
$155
$24
$55
$854
-$3,
479
Dis
abili
ty76
$118
$70
$11
$17
$888
$48
$55
$7$3
4$7
1$0
$162
$6$2
2$1
,508
$270
No
Men
tal I
llnes
s52
$52
$49
$9$0
$15
$42
$44
$8$3
1$3
7$0
$31
$5$1
2$3
34-$
727
No
Sub
stan
ce A
buse
34$7
9$5
3$3
$0$0
$26
$36
$1$3
2$0
$0$4
8$3
$9$2
91-$
690
Sub
stan
ce A
buse
18$0
$41
$19
$0$4
3$7
2$5
8$2
2$2
9$1
10$0
$0$9
$16
$419
-$79
3M
enta
l Illn
ess
24$2
60$1
17$1
5$5
4$2
,786
$61
$78
$4$3
9$1
43$0
$447
$8$4
5$4
,057
$2,4
36N
o S
ubst
ance
Abu
se10
$0$1
61$4
$72
$0$5
5$5
7$3
$60
$0$0
$0$4
$8$4
24-$
427
Sub
stan
ce A
buse
14$4
60$8
3$2
4$4
1$4
,929
$65
$94
$4$2
4$2
53$0
$766
$10
$72
$6,8
25$4
,653
82 Where We Sleep

App
endi
x 2
- Dat
a Ta
ble
A4
Sin
gle
Var
iabl
e B
reak
outs
of A
vera
ge M
onth
ly C
osts
of 9
,186
Los
Ang
eles
Cou
nty
Gen
eral
Rel
ief R
ecip
ient
s in
Mon
ths
whe
n H
omel
ess
Cos
ts fo
r Jan
uary
200
6 th
roug
h O
ctob
er 2
007,
Con
verte
d to
200
8 D
olla
rsS
mal
l sub
popu
latio
ns (<
25) w
ith le
ss re
liabl
e da
ta a
re h
ighl
ight
ed
Number of Persons
Percent of Months Homeless
LA Co Dept Health Srv hospital-inpatient
LA Co Dept Health Srv outpatient clinic
LA Co Dept Health Srv emergency room
LA Co Dept Mental Health
LA Co Dept Public Health
LA Co Dept Public Social Srv Food Stamps
LA Co Dept Public Social Srv General Relief
LA Co Dept Public Social Srv GR Housing Vouchers
LAHSA homeless services
LA Co Probation Dept
LA Co Sheriff general jail facilities/services
LA Co Sheriff medical jail facilities/services
LA Co Sheriff mental health jail facilities/srv
Private hospitals-inpatient
Private hospitals-emergency room
Emergency Medical Transportation
Total Average Monthly Cost when Homeless
GE
ND
ER
Fem
ale
2,66
545
%$1
27$7
2$4
5$5
2$7
7$1
63$1
79$6
1$2
$8$5
4$1
4$5
9$1
21$2
9$6
2$1
,126
Mal
e6,
521
46%
$273
$52
$41
$33
$74
$166
$175
$67
$1$1
0$1
47$1
47$1
86$1
21$2
7$5
8$1
,577
AG
E 18-2
9 ye
ars
2,56
041
%$5
9$2
6$2
3$3
3$6
6$1
58$1
65$5
6$1
$10
$112
$89
$112
$51
$15
$32
$1,0
0930
-45
year
s3,
771
44%
$153
$57
$43
$42
$83
$164
$174
$74
$1$1
1$1
40$1
16$1
57$1
14$2
9$6
0$1
,418
46-6
5 ye
ars
2,81
152
%$4
94$9
0$5
8$3
8$7
1$1
73$1
88$6
2$2
$8$1
00$1
18$1
76$1
96$3
8$8
4$1
,896
EM
PLO
YM
EN
TN
o R
ecen
t Wor
k H
isto
ry8,
233
45%
$248
$57
$44
$39
$76
$166
$176
$67
$1$1
0$1
26$1
17$1
63$1
28$2
9$6
2$1
,508
Rec
ent W
ork
His
tory
953
50%
$79
$65
$27
$31
$58
$157
$180
$47
$3$9
$69
$35
$35
$67
$18
$37
$916
DIS
AB
ILIT
YN
o D
isab
ility
5,82
640
%$6
1$3
6$2
5$2
1$7
7$1
62$1
62$7
1$1
$10
$113
$77
$84
$56
$17
$35
$1,0
08D
isab
ility
3,
360
55%
$523
$96
$71
$67
$70
$170
$201
$56
$2$1
0$1
31$1
64$2
62$2
35$4
6$1
02$2
,207
ME
NTA
L IL
LNE
SS
No
Men
tal I
llnes
s6,
544
44%
$197
$49
$23
$0$6
5$1
64$1
76$6
1$1
$9$1
03$6
2$0
$83
$16
$36
$1,0
44M
enta
l Illn
ess
2,64
250
%$3
12$8
2$9
0$1
33$9
8$1
66$1
77$7
6$3
$12
$161
$224
$519
$217
$56
$117
$2,4
43S
UB
STA
NC
E A
BU
SE
No
Sub
stan
ce A
buse
6,40
047
%$2
18$4
7$2
9$2
3$0
$164
$197
$33
$1$5
$103
$95
$130
$87
$20
$42
$1,1
94S
ubst
ance
Abu
se
2,78
642
%$2
58$8
4$7
2$7
4$2
46$1
66$1
29$1
40$2
$20
$158
$139
$194
$199
$46
$99
$2,0
25JU
STI
CE
SY
STE
MN
o ja
il or
pro
batio
n3,
605
44%
$247
$66
$35
$39
$39
$169
$190
$53
$2$0
$0$0
$0$1
15$2
3$5
1$1
,030
Jail
and/
or P
roba
tion
5,58
147
%$2
19$5
3$4
6$3
8$9
8$1
62$1
67$7
3$1
$16
$197
$179
$246
$125
$30
$65
$1,7
15P
RO
BA
TIO
NN
o P
roba
tion
Rec
ord
6,78
946
%$1
99$5
7$3
9$3
9$4
6$1
66$1
86$5
1$1
$0$8
4$8
2$9
9$1
19$2
6$5
5$1
,250
Pro
batio
n R
ecor
d2,
397
45%
$318
$62
$50
$37
$155
$162
$148
$105
$1$3
7$2
21$1
83$2
91$1
28$3
3$7
0$2
,002
JAIL N
o Ja
il3,
791
44%
$237
$67
$34
$38
$42
$169
$189
$55
$2$2
$0$0
$0$1
11$2
3$5
0$1
,018
Jail
5,39
547
%$2
25$5
2$4
8$3
8$9
7$1
62$1
67$7
2$1
$15
$204
$185
$254
$128
$31
$66
$1,7
48
Data Table A4 83

Number of Persons
Percent of Months Homeless
LA Co Dept Health Srv hospital-inpatient
LA Co Dept Health Srv outpatient clinic
LA Co Dept Health Srv emergency room
LA Co Dept Mental Health
LA Co Dept Public Health
LA Co Dept Public Social Srv Food Stamps
LA Co Dept Public Social Srv General Relief
LA Co Dept Public Social Srv GR Housing Vouchers
LAHSA homeless services
LA Co Probation Dept
LA Co Sheriff general jail facilities/services
LA Co Sheriff medical jail facilities/services
LA Co Sheriff mental health jail facilities/srv
Private hospitals-inpatient
Private hospitals-emergency room
Emergency Medical Transportation
Total Average Monthly Cost when Homeless
JAIL
ME
DIC
AL
FAC
ILIT
YN
o Ja
il M
edic
al F
acili
ty7,
771
45%
$225
$60
$38
$39
$72
$166
$178
$64
$1$8
$80
$0$9
7$1
10$2
5$5
5$1
,220
Jail
Med
ical
Fac
ility
1,41
549
%$2
59$4
8$6
1$3
5$8
7$1
59$1
64$7
0$1
$18
$337
$705
$439
$180
$40
$86
$2,6
90JA
IL M
EN
TAL
HE
ALT
H F
AC
ILIT
YN
o Ja
il M
enta
l Hea
lth F
acili
ty8,
060
45%
$231
$59
$36
$29
$73
$165
$177
$64
$1$9
$96
$63
$0$1
09$2
4$5
2$1
,189
Jail
Men
tal H
ealth
Fac
ility
1,12
649
%$2
27$5
4$8
3$1
05$8
2$1
62$1
69$7
5$2
$18
$290
$436
$1,2
19$2
06$5
1$1
08$3
,289
HIV
/AID
SN
o H
IV/A
IDS
9,10
146
%$2
24$5
6$4
2$3
8$7
4$1
65$1
76$6
5$1
$10
$118
$108
$148
$116
$27
$59
$1,4
27H
IV/A
IDS
85
51%
$958
$350
$80
$42
$161
$164
$188
$59
$2$1
2$2
78$1
21$2
46$6
60$5
4$1
46$3
,522
VE
TER
AN
Not
Vet
eran
6,72
746
%$2
58$5
9$4
3$3
8$7
1$1
66$1
76$6
5$1
$10
$118
$118
$151
$127
$28
$61
$1,4
89V
eter
an2,
459
46%
$154
$57
$39
$39
$84
$163
$176
$65
$2$1
0$1
25$8
4$1
46$1
05$2
6$5
5$1
,330
LAN
GU
AG
EE
nglis
h sp
eake
r9,
031
46%
$232
$58
$42
$38
$75
$165
$176
$66
$1$1
0$1
21$1
09$1
52$1
21$2
8$5
9$1
,453
Spa
nish
spe
aker
141
49%
$116
$83
$38
$24
$29
$163
$207
$32
$6$3
$28
$76
$26
$135
$27
$59
$1,0
50S
peak
s ot
her l
angu
age
1454
%$0
$107
$33
$52
$81
$147
$203
$33
$1$2
8$2
53$0
$0$0
$10
$19
$970
NA
TIV
ITY
Bor
n in
Cal
iforn
ia5,
999
45%
$217
$53
$39
$34
$75
$163
$173
$64
$1$1
1$1
27$9
6$1
21$1
01$2
6$5
4$1
,354
Bor
n in
Oth
er S
tate
2,61
847
%$2
79$6
7$4
7$4
5$7
6$1
69$1
83$6
5$2
$8$1
15$1
57$2
11$1
67$3
1$6
9$1
,692
Bor
n in
Oth
er C
ount
ry28
044
%$2
15$7
0$5
5$6
7$6
9$1
68$1
90$8
0$1
$9$8
3$2
3$2
44$1
60$3
2$7
0$1
,536
Bor
n in
Mex
ico
or C
entra
l Am
.28
446
%$8
0$8
3$4
3$4
1$5
9$1
69$1
75$6
2$4
$9$5
3$1
6$8
5$8
5$3
4$6
9$1
,068
ETH
NIC
ITY
Afri
can
Am
eric
an4,
795
48%
$301
$61
$41
$30
$39
$162
$188
$44
$1$8
$130
$163
$192
$117
$28
$59
$1,5
65A
sian
/Pac
ific
Isla
nder
9244
%$4
59$3
5$4
5$1
34$4
2$1
66$1
67$7
9$0
$12
$77
$40
$45
$470
$29
$87
$1,8
87La
tino
2,18
143
%$1
28$4
8$3
5$3
1$1
11$1
63$1
68$7
4$1
$11
$126
$37
$63
$102
$25
$52
$1,1
75W
hite
1,81
542
%$1
74$6
4$4
8$6
2$1
23$1
75$1
58$1
02$1
$12
$94
$56
$143
$140
$30
$64
$1,4
46
App
endi
x 2
- Dat
a Ta
ble
A4
(con
t.) 84 Where We Sleep

App
endi
x 2
- Dat
a Ta
ble
A5
Sin
gle
Var
iabl
e B
reak
outs
of A
vera
ge M
onth
ly C
osts
of 9
,186
Los
Ang
eles
Cou
nty
Gen
eral
Rel
ief R
ecip
ient
s in
Mon
ths
whe
n N
ot H
omel
ess
C
osts
for J
anua
ry 2
006
thro
ugh
Oct
ober
200
7, C
onve
rted
to 2
008
Dol
lars
S
mal
l sub
popu
latio
ns (<
25) w
ith le
ss re
liabl
e da
ta a
re h
ighl
ight
ed
Number of Persons
LA Co Dept Health Srv hospital-inpatient
LA Co Dept Health Srv outpatient clinic
LA Co Dept Health Srv emergency room
LA Co Dept Mental Health
LA Co Dept Public Health
LA Co Dept Public Social Srv Food Stamps
LA Co Dept Public Social Srv General Relief
LA Co Probation Dept
LA Co Sheriff general jail facilities/services
LA Co Sheriff medical jail facilities/services
LA Co Sheriff mental health jail facilities/srv
Private hospitals-inpatient
Private hospitals-emergency room
Emergency Medical Transportation
Total Average Monthly Cost when Homeless
Difference: Not Homeless minus Homeless
GE
ND
ER
Fem
ale
2,66
5$1
03$3
8$2
3$3
3$6
5$2
5$2
9$7
$47
$10
$56
$67
$14
$31
$549
-$57
7M
ale
6,52
1$1
72$2
9$2
4$2
5$6
1$2
1$2
2$9
$98
$111
$86
$93
$15
$33
$801
-$77
6A
GE 18
-29
year
s2,
560
$74
$15
$16
$34
$37
$15
$14
$10
$84
$65
$56
$48
$9$2
0$4
97-$
512
30-4
5 ye
ars
3,77
1$1
21$3
0$2
3$2
6$6
8$2
2$2
4$9
$94
$92
$70
$69
$15
$32
$695
-$72
346
-65
year
s2,
811
$271
$49
$32
$24
$78
$30
$34
$7$7
0$8
3$1
10$1
43$2
0$4
6$9
98-$
898
EM
PLO
YM
EN
TN
o R
ecen
t Wor
k H
isto
ry8,
233
$163
$31
$25
$29
$56
$22
$23
$9$8
6$8
7$8
6$8
9$1
5$3
4$7
52-$
755
Rec
ent W
ork
His
tory
953
$62
$41
$17
$16
$115
$29
$33
$8$6
4$3
0$1
0$5
8$1
1$2
4$5
19-$
397
DIS
AB
ILIT
YN
o D
isab
ility
5,82
6$6
6$1
8$1
3$1
3$5
2$1
5$1
4$9
$82
$79
$42
$43
$9$1
9$4
74-$
534
Dis
abili
ty
3,36
0$3
10$5
6$4
4$5
4$8
0$3
5$4
3$9
$86
$86
$142
$160
$25
$57
$1,1
85-$
1,02
1M
EN
TAL
ILLN
ES
SN
o M
enta
l Illn
ess
6,54
4$1
16$2
6$1
3$0
$47
$19
$20
$8$7
3$7
0$0
$60
$8$2
0$4
80-$
564
Men
tal I
llnes
s 2,
642
$242
$46
$53
$97
$100
$31
$35
$11
$109
$110
$274
$149
$30
$65
$1,3
52-$
1,09
1S
UB
STA
NC
E A
BU
SE
No
Sub
stan
ce A
buse
6,40
0$1
13$2
7$1
5$1
6$0
$17
$20
$5$6
5$8
3$5
5$6
0$9
$22
$508
-$68
6S
ubst
ance
Abu
se
2,78
6$2
41$4
3$4
4$5
3$2
04$3
4$3
3$1
8$1
25$7
8$1
29$1
44$2
6$5
8$1
,230
-$79
6JU
STI
CE
SY
STE
MN
o ja
il or
pro
batio
n3,
605
$177
$33
$17
$28
$28
$20
$22
$0$0
$0$0
$71
$10
$24
$429
-$60
1Ja
il an
d/or
Pro
batio
n5,
581
$136
$31
$28
$27
$84
$24
$25
$14
$137
$134
$128
$96
$17
$39
$920
-$79
5P
RO
BA
TIO
NN
o P
roba
tion
Rec
ord
6,78
9$1
66$3
1$2
0$2
7$3
2$2
1$2
3$0
$49
$54
$51
$83
$12
$29
$597
-$65
3P
roba
tion
Rec
ord
2,39
7$1
12$3
4$3
5$2
9$1
49$2
8$2
7$3
3$1
81$1
60$1
53$9
3$2
0$4
4$1
,098
-$90
4JA
IL No
Jail
3,79
1$1
76$3
3$1
7$2
8$3
0$2
0$2
3$2
$0$0
$0$7
3$1
0$2
4$4
36-$
582
Data Table A5 85

Number of Persons
LA Co Dept Health Srv hospital-inpatient
LA Co Dept Health Srv outpatient clinic
LA Co Dept Health Srv emergency room
LA Co Dept Mental Health
LA Co Dept Public Health
LA Co Dept Public Social Srv Food Stamps
LA Co Dept Public Social Srv General Relief
LA Co Probation Dept
LA Co Sheriff general jail facilities/services
LA Co Sheriff medical jail facilities/services
LA Co Sheriff mental health jail facilities/srv
Private hospitals-inpatient
Private hospitals-emergency room
Emergency Medical Transportation
Total Average Monthly Cost when Homeless
Difference: Not Homeless minus Homeless
Jail
5,39
5$1
35$3
0$2
9$2
8$8
5$2
4$2
5$1
4$1
42$1
38$1
32$9
5$1
8$3
9$9
32-$
815
JAIL
ME
DIC
AL
FAC
ILIT
YN
o Ja
il M
edic
al F
acili
ty7,
771
$144
$32
$22
$27
$62
$22
$24
$7$5
7$0
$44
$75
$13
$29
$558
-$66
2Ja
il M
edic
al F
acili
ty1,
415
$196
$31
$36
$29
$65
$23
$23
$15
$229
$530
$265
$144
$23
$52
$1,6
62-$
1,02
8JA
IL M
EN
TAL
HE
ALT
H F
AC
ILIT
YN
o Ja
il M
enta
l Hea
lth F
acili
ty8,
060
$154
$32
$20
$21
$53
$22
$24
$8$6
9$6
7$0
$79
$13
$29
$589
-$60
0Ja
il M
enta
l Hea
lth F
acili
ty1,
126
$141
$27
$52
$79
$125
$24
$24
$15
$187
$190
$640
$138
$28
$61
$1,7
31-$
1,55
9H
IV/A
IDS
No
HIV
/AID
S9,
101
$149
$30
$24
$27
$62
$22
$24
$9$8
3$8
2$7
8$8
4$1
4$3
2$7
19-$
707
HIV
/AID
S
85$5
40$2
07$5
1$6
0$3
9$3
6$4
3$1
0$1
57$7
1$4
7$2
52$3
3$7
9$1
,626
-$1,
896
VE
TER
AN
Not
Vet
eran
6,72
7$1
46$3
1$2
3$2
5$6
4$2
2$2
4$8
$84
$77
$77
$80
$14
$31
$705
-$78
3V
eter
an2,
459
$170
$33
$27
$35
$58
$24
$26
$9$8
2$9
4$7
9$1
00$1
6$3
6$7
89-$
541
LAN
GU
AG
EE
nglis
h sp
eake
r9,
031
$152
$31
$24
$28
$63
$22
$24
$9$8
4$8
3$7
6$8
6$1
5$3
3$7
28-$
725
Spa
nish
spe
aker
141
$190
$33
$22
$5$3
$32
$40
$3$1
9$2
0$2
08$1
09$1
3$3
2$7
29-$
321
Spe
aks
othe
r lan
guag
e14
$0$1
18$4
5$3
7$1
9$2
1$2
8$2
3$8
5$9
$0$0
$30
$54
$469
-$50
0N
ATI
VIT
YB
orn
in C
alifo
rnia
5,99
9$1
35$3
0$2
4$2
7$6
8$2
1$2
2$9
$90
$86
$76
$86
$15
$33
$724
-$62
9B
orn
in O
ther
Sta
te2,
618
$196
$35
$23
$23
$51
$24
$27
$7$7
6$8
4$7
3$8
6$1
4$3
2$7
50-$
942
Bor
n in
Oth
er C
ount
ry28
0$1
27$3
6$2
6$7
6$5
8$2
7$3
3$8
$45
$25
$174
$95
$16
$35
$780
-$75
5B
orn
in M
exic
o or
Cen
tral A
m.
284
$140
$34
$23
$26
$38
$27
$28
$9$4
6$1
0$5
4$7
6$1
4$3
0$5
54-$
513
ETH
NIC
ITY
Afri
can
Am
eric
an4,
795
$136
$35
$24
$23
$40
$22
$26
$7$8
6$1
19$8
6$7
3$1
4$3
2$7
22-$
843
Asi
an/P
acifi
c Is
land
er92
$1,0
21$2
3$1
4$6
1$2
9$1
9$2
4$1
0$5
3$2
1$1
62$1
06$1
0$2
6$1
,580
-$30
8La
tino
2,18
1$1
19$2
6$2
1$1
9$9
3$2
2$2
2$1
0$9
2$3
1$6
0$9
0$1
4$3
2$6
51-$
524
Whi
te1,
815
$175
$32
$25
$43
$83
$24
$22
$10
$69
$51
$69
$115
$15
$36
$769
-$67
7
App
endi
x 2
- Dat
a Ta
ble
A5
(con
t.)
86 Where We Sleep

App
endi
x 2
- Dat
a Ta
ble
A6
S
ingl
e-V
aria
ble
Bre
akou
ts o
f Ave
rage
Mon
thly
Cos
ts in
Mon
ths
they
wer
e H
ouse
d fo
r 855
Los
Ang
eles
Cou
nty
Gen
eral
Rel
ief R
ecip
ient
s th
at R
ecei
ved
Em
erge
ncy
Hou
sing
Vou
cher
s fo
r 4+
Con
secu
tive
Mon
ths
S
ubgr
oups
by
ethn
icity
, nat
ivity
, jai
l his
tory
, gen
der,
age,
wor
k hi
stor
y, d
isab
ility
, men
tal i
llnes
s, s
ubst
ance
abu
se, a
nd H
IV/A
IDS
C
osts
for J
anua
ry 2
006
thro
ugh
Oct
ober
200
7, C
onve
rted
to 2
008
Dol
lars
S
mal
l sub
popu
latio
ns (<
25) w
ith le
ss re
liabl
e da
ta a
re h
ighl
ight
ed
GR
OU
P
Number of Persons
Percent of Months Homeless
LA Co Dept Health Srv hospital-inpatient
LA Co Dept Health Srv outpatient clinic
LA Co Dept Health Srv emergency room
LA Co Dept Mental Health
LA Co Dept Public Health
DPSS Food Stamps
DPSS General Relief
DPSS GR Housing Vouchers
LA Co Probation
LA Co Sheriff general jail facilities/services
LA Co Sheriff medical jail facilities/services
LA Co Sheriff mental health jail facilities/srv
Private hospitals-inpatient
Private hospitals-emergency room
Emergency Medical Transportation
Total Average Monthly Cost when Housed
Difference re Matched-Pair Comparison Group
Difference Re Same Persons Not Housed
EV
ER
YO
NE
820
29%
8147
3539
258
5532
260
2412
684
101
$93
$21
$46
$1,3
02-$
313
-$22
2E
THN
ICIT
YA
frica
n A
mer
ican
288
36%
9874
4539
282
6242
260
1914
314
014
4$1
02$2
6$5
6$1
,534
-$33
9-$
265
Asi
an/P
acifi
c Is
land
er10
24%
09
322
624
1626
143
228
9879
4$0
$0$0
$1,7
02$9
80$6
72La
tino
236
26%
6737
2631
225
5431
257
2813
139
20$6
1$1
8$3
8$1
,064
-$13
1-$
213
Whi
te24
325
%78
2931
4826
549
2226
125
8568
116
$117
$19
$43
$1,2
57-$
459
-$14
6O
ther
4324
%68
3337
3824
657
2526
029
197
3512
$97
$24
$52
$1,2
10-$
584
-$61
7N
ATI
VIT
YC
alifo
rnia
553
30%
9138
3444
266
5229
260
2512
679
96$1
05$2
0$4
4$1
,311
-$16
8-$
230
Oth
er S
tate
219
30%
6671
3628
238
6134
259
1913
084
94$7
6$2
3$4
8$1
,269
-$58
5-$
303
Oth
er C
ount
ry26
26%
2732
3523
299
5435
264
3414
013
933
6$3
9$2
8$5
4$1
,538
-$2,
201
$488
Mex
ico
and
Cen
tral A
mer
ica
2217
%32
5344
3719
870
6026
035
7711
320
$47
$30
$58
$1,1
34$5
35-$
50JA
IL H
ISTO
RY
No
Jail
215
24%
2349
2346
221
5830
261
50
00
$42
$14
$28
$801
-$33
4-$
263
Jail
605
31%
101
4639
3727
154
3225
931
171
113
137
$111
$24
$52
$1,4
81-$
310
-$20
6JA
IL M
ED
ICA
L FA
CIL
ITY
No
Jail
Med
ical
Fac
ility
654
28%
6248
3440
261
5532
259
2393
047
$83
$21
$44
$1,1
03-$
236
-$22
0Ja
il M
edic
al F
acili
ty16
634
%15
245
3734
246
5431
261
3125
941
131
2$1
33$2
4$5
3$2
,083
-$62
6-$
233
JAIL
ME
NTA
L H
EA
LTH
FA
CIL
ITY
No
Jail
Men
tal H
ealth
Fac
ility
679
28%
4647
3035
271
5633
260
2411
287
0$6
1$1
9$3
9$1
,118
-$12
8-$
166
Jail
Men
tal H
ealth
Fac
ility
141
36%
248
4859
6119
650
2725
928
198
6559
0$2
47$3
5$8
1$2
,190
-$1,
140
-$48
9G
EN
DE
RFe
mal
e22
628
%72
6337
5431
858
4325
824
9127
27$1
24$2
4$5
4$1
,273
-$20
8-$
233
Mal
e59
430
%84
4134
3423
554
2826
024
140
105
129
$81
$20
$43
$1,3
13-$
367
-$21
8A
GE 18
-29
year
s18
923
%88
2718
4319
648
2225
729
124
4610
1$7
6$1
1$2
5$1
,112
-$19
2-$
340
30-4
5 ye
ars
398
30%
6937
3040
288
5231
259
2513
399
78$7
5$1
9$4
0$1
,277
-$33
4-$
139
Data Table A6 87

GR
OU
P
Number of Persons
Percent of Months Homeless
LA Co Dept Health Srv hospital-inpatient
LA Co Dept Health Srv outpatient clinic
LA Co Dept Health Srv emergency room
LA Co Dept Mental Health
LA Co Dept Public Health
DPSS Food Stamps
DPSS General Relief
DPSS GR Housing Vouchers
LA Co Probation
LA Co Sheriff general jail facilities/services
LA Co Sheriff medical jail facilities/services
LA Co Sheriff mental health jail facilities/srv
Private hospitals-inpatient
Private hospitals-emergency room
Emergency Medical Transportation
Total Average Monthly Cost when Housed
Difference re Matched-Pair Comparison Group
Difference Re Same Persons Not Housed
46-6
5 ye
ars
233
33%
9480
5634
256
6641
263
2011
688
140
$137
$34
$73
$1,4
98-$
396
-$26
9W
OR
K H
ISTO
RY
No
Rec
ent W
ork
His
tory
765
29%
8646
3639
263
5531
260
2512
883
108
$100
$22
$48
$1,3
30-$
317
-$18
5R
ecen
t Wor
k H
isto
ry55
36%
070
1937
189
5444
263
2098
860
$0$1
1$1
9$9
10-$
225
-$74
4D
ISA
BIL
ITY
No
Dis
abili
ty56
426
%64
3321
2023
648
2426
024
120
5992
$60
$13
$29
$1,1
04-$
280
-$10
5D
isab
ility
256
36%
116
7766
8030
770
4825
926
140
137
122
$166
$39
$84
$1,7
38-$
384
-$48
0M
EN
TAL
ILLN
ES
SN
o M
enta
l Illn
ess
519
27%
2735
120
260
5326
260
2512
410
00
$34
$9$1
8$9
82-$
30-$
143
Men
tal I
llnes
s30
132
%17
368
7310
725
559
4226
024
130
5527
5$1
94$4
4$9
4$1
,853
-$68
8-$
357
SU
BS
TAN
CE
AB
US
EN
o S
ubst
ance
Abu
se19
029
%12
3617
90
5023
265
1312
656
90$1
6$1
2$2
2$7
47-$
635
-$27
8S
ubst
ance
Abu
se63
029
%10
151
4048
335
5734
258
2812
692
104
$116
$24
$53
$1,4
68-$
217
-$20
6H
IV/A
IDS
No
HIV
/AID
S81
329
%80
4434
3926
055
3126
024
125
8497
$93
$21
$46
$1,2
93-$
294
-$20
3H
IV/A
IDS
742
%16
538
674
114
6260
5725
338
249
253
8$1
55$4
3$9
0$2
,285
-$1,
828
-$2,
445
App
endi
x 2
- Dat
a Ta
ble
A6
(con
t.)88 Where We Sleep

App
endi
x 2
- Dat
a Ta
ble
A7
S
ingl
e-V
aria
ble
Bre
akou
ts o
f Ave
rage
Mon
thly
Cos
ts in
Mon
ths
they
wer
e H
omel
ess
for 8
20 M
atch
ed-P
air G
roup
Mem
bers
Iden
tifie
d th
roug
h P
rope
nsity
Sco
res
as C
ompa
rabl
e to
Los
Ang
eles
Cou
nty
Gen
eral
Rel
ief R
ecip
ient
s th
at R
ecei
ved
Em
erge
ncy
Hou
sing
V
ouch
ers
for 4
+ C
onse
cutiv
e M
onth
s
Sub
grou
ps b
y et
hnic
ity, n
ativ
ity, j
ail h
isto
ry, g
ende
r, ag
e, w
ork
hist
ory,
dis
abili
ty, m
enta
l illn
ess,
sub
stan
ce a
buse
, and
HIV
/AID
S
Cos
ts fo
r Jan
uary
200
6 th
roug
h O
ctob
er 2
007,
Con
verte
d to
200
8 D
olla
rs
Sm
all s
ubpo
pula
tions
(<25
) with
less
relia
ble
data
are
hig
hlig
hted
GR
OU
P
Number of Persons
Percent of Months Homeless
LA Co Health Srv hospital-inpatient
LA Co Health Srv outpatient clinic
LA Co Health Srv emergency room
LA Co Dept Mental Health
LA Co Public Health
DPSS Food Stamps
DPSS General Relief
LAHSA homeless srv.
LA Co Probation
LA Co Sheriff general jail facilities/services
LA Co Sheriff medical jail facilities/services
LA Co Sheriff mental health jail facilities/srv
Private hospitals-inpatient
Private hospitals-emergency room
Emergency Medical Transportation
Total Average Monthly Cost when Homeless
EV
ER
YO
NE
820
52%
183
6049
5093
160
205
114
153
149
220
$181
$31
$69
$1,6
15E
THN
ICIT
YA
frica
n A
mer
ican
288
53%
211
6550
3237
156
209
114
175
318
313
$180
$34
$75
$1,8
73A
sian
/Pac
ific
Isla
nder
641
%0
019
112
817
520
61
138
00
$0$0
$0$7
21La
tino
239
51%
153
3733
4513
216
319
51
1413
625
47$1
45$2
1$4
8$1
,195
Whi
te25
551
%18
372
5565
120
163
211
113
154
8229
2$2
03$3
1$7
1$1
,716
Oth
er32
45%
189
8911
893
7814
918
70
795
118
139
$299
$74
$157
$1,7
94N
ATI
VIT
YC
alifo
rnia
586
51%
132
5048
4886
160
203
115
149
149
218
$128
$30
$63
$1,4
79O
ther
Sta
te19
855
%34
270
4739
123
161
207
211
168
173
90$3
09$3
2$8
1$1
,853
Oth
er C
ount
ry22
48%
229
230
118
201
4817
820
60
1317
832
1,57
0$5
40$5
6$1
40$3
,739
Mex
ico
and
Cen
tral A
mer
ica
1451
%0
449
3528
151
235
07
620
11$0
$6$1
0$5
99JA
IL H
ISTO
RY
No
Jail
220
49%
179
9747
7961
166
214
13
00
0$1
87$3
0$6
8$1
,134
Jail
600
53%
184
4650
3910
415
820
11
1720
920
430
0$1
78$3
1$6
9$1
,791
JAIL
ME
DIC
AL
FAC
ILIT
YN
o Ja
il M
edic
al F
acili
ty65
551
%16
065
4754
9916
120
81
1211
30
161
$163
$30
$66
$1,3
39Ja
il M
edic
al F
acili
ty16
553
%27
241
5731
6915
719
00
2131
374
045
4$2
50$3
4$8
0$2
,709
JAIL
ME
NTA
L H
EA
LTH
FA
CIL
ITY
No
Jail
Men
tal H
ealth
Fac
ility
675
51%
164
5943
4297
159
203
112
122
103
0$1
55$2
7$6
0$1
,246
Jail
Men
tal H
ealth
Fac
ility
145
57%
271
6577
8674
165
210
220
299
363
1,24
3$2
98$4
8$1
09$3
,330
Data Table A7 89

GR
OU
P
Number of Persons
Percent of Months Homeless
LA Co Health Srv hospital-inpatient
LA Co Health Srv outpatient clinic
LA Co Health Srv emergency room
LA Co Dept Mental Health
LA Co Public Health
DPSS Food Stamps
DPSS General Relief
LAHSA homeless srv.
LA Co Probation
LA Co Sheriff general jail facilities/services
LA Co Sheriff medical jail facilities/services
LA Co Sheriff mental health jail facilities/srv
Private hospitals-inpatient
Private hospitals-emergency room
Emergency Medical Transportation
Total Average Monthly Cost when Homeless
GE
ND
ER
Fem
ale
269
50%
244
7349
4011
215
520
61
1111
617
120
$233
$30
$72
$1,4
81M
ale
551
52%
153
5349
5484
163
204
115
171
213
268
$155
$31
$67
$1,6
80A
GE 18
-29
year
s20
046
%68
2938
5741
152
184
015
159
148
267
$77
$22
$47
$1,3
0430
-45
year
s39
150
%15
161
4552
105
159
208
114
190
148
249
$138
$28
$62
$1,6
1046
-65
year
s22
959
%33
884
6539
118
170
217
212
8415
212
9$3
43$4
1$1
00$1
,894
WO
RK
HIS
TOR
YN
o R
ecen
t Wor
k H
isto
ry76
851
%19
461
5051
9016
020
51
1415
615
121
9$1
91$3
2$7
1$1
,647
Rec
ent W
ork
His
tory
5257
%14
4125
3012
816
219
82
1510
411
423
4$2
2$1
6$3
0$1
,135
DIS
AB
ILIT
YN
o D
isab
ility
564
47%
134
4141
3610
115
719
30
1415
170
228
$137
$25
$56
$1,3
85D
isab
ility
256
62%
291
102
6679
7416
822
92
1315
632
220
2$2
77$4
2$9
7$2
,122
ME
NTA
L IL
LNE
SS
No
Men
tal I
llnes
s49
749
%11
746
280
8715
919
80
1412
468
0$1
06$2
0$4
4$1
,013
Men
tal I
llnes
s32
356
%28
481
8112
610
116
221
42
1419
727
455
8$2
94$4
7$1
07$2
,541
SU
BS
TAN
CE
AB
US
EN
o S
ubst
ance
Abu
se19
048
%10
051
3244
016
920
90
810
319
629
3$1
09$2
2$4
7$1
,381
Sub
stan
ce A
buse
630
53%
208
6354
5112
115
820
31
1516
813
519
8$2
02$3
3$7
5$1
,685
HIV
/AID
SN
o H
IV/A
IDS
811
52%
175
5748
5094
160
204
114
150
150
218
$171
$30
$67
$1,5
87H
IV/A
IDS
954
%90
631
814
019
316
122
90
846
185
373
$1,0
65$9
5$2
50$4
,113
App
endi
x 2
- Dat
a Ta
ble
A7
(con
t.) 90 Where We Sleep

App
endi
x 2
- Dat
a Ta
ble
A8
S
ingl
e-V
aria
ble
Bre
akou
ts o
f Ave
rage
Mon
thly
Cos
ts in
Mon
ths
they
wer
e H
omel
ess
for 8
55 L
os A
ngel
es C
ount
y G
ener
al R
elie
f Rec
ipie
nts
that
R
ecei
ved
Em
erge
ncy
Hou
sing
Vou
cher
s fo
r 4+
Con
secu
tive
Mon
ths
S
ubgr
oups
by
ethn
icity
, nat
ivity
, jai
l his
tory
, gen
der,
age,
wor
k hi
stor
y, d
isab
ility
, men
tal i
llnes
s, s
ubst
ance
abu
se, a
nd H
IV/A
IDS
C
osts
for J
anua
ry 2
006
thro
ugh
Oct
ober
200
7, C
onve
rted
to 2
008
Dol
lars
S
mal
l sub
popu
latio
ns (<
25) w
ith le
ss re
liabl
e da
ta a
re h
ighl
ight
ed
GR
OU
P
Number of Persons
Percent of Months Homeless
LA Co Dept Health Srv hospital-inpatient
LA Co Dept Health Srv outpatient clinic
LA Co Dept Health Srv emergency room
LA Co Dept Mental Health
LA Co Dept Public Health
LA Co Dept Public Social Srv Food Stamps
LA Co Dept Public Social Srv General Relief
LA Co Dept Public Social Srv GR Housing Vouchers
LAHSA homeless srv.
LA Co Probation Dept
LA Co Sheriff general jail facilities/services
LA Co Sheriff medical jail facilities/services
LA Co Sheriff mental health jail facilities/srv
Private hospitals-inpatient
Private hospitals-emergency room
Emergency Medical Transportation
Total Average Monthly Cost when Homeless
EV
ER
YO
NE
820
29%
112
9864
5538
617
235
440
2898
6512
4$1
11$4
4$8
8$1
,524
ETH
NIC
ITY
Afri
can
Am
eric
an28
836
%19
213
769
7029
816
753
521
2314
415
074
$213
$50
$106
$1,7
99A
sian
/Pac
ific
Isla
nder
1024
%0
3637
122
613
712
100
3715
50
277
$0$3
6$6
6$1
,029
Latin
o23
626
%49
7747
3548
117
024
400
3187
2459
$51
$35
$68
$1,2
78W
hite
243
25%
7975
6760
392
181
2642
030
6013
216
$41
$42
$80
$1,4
03O
ther
4324
%12
690
105
5744
817
722
400
3058
4026
4$1
85$6
1$1
25$1
,827
NA
TIV
ITY
Cal
iforn
ia55
330
%92
8867
6336
717
335
440
2910
151
161
$131
$45
$92
$1,5
40O
ther
Sta
te21
930
%18
712
255
3840
817
037
471
2310
811
658
$84
$39
$78
$1,5
72O
ther
Cou
ntry
2626
%0
8757
3151
516
529
270
3712
00
$0$3
2$5
8$1
,050
Mex
ico
and
Cen
tral A
mer
ica
2217
%0
109
7852
474
177
243
027
290
0$0
$68
$125
$1,1
85JA
IL H
ISTO
RY
No
Jail
215
24%
6199
4258
375
178
2640
05
00
0$8
6$3
0$6
2$1
,063
Jail
605
31%
130
9771
5438
917
038
460
3613
389
168
$120
$48
$97
$1,6
87JA
IL M
ED
ICA
L FA
CIL
ITY
No
Jail
Med
ical
Fac
ility
654
28%
8010
067
5739
917
332
430
2565
049
$95
$46
$90
$1,3
23Ja
il M
edic
al F
acili
ty16
634
%23
688
4947
332
166
4451
037
230
323
422
$176
$36
$79
$2,3
16JA
IL M
EN
TAL
HE
ALT
H F
AC
ILIT
YN
o Ja
il M
enta
l Hea
lth F
acili
ty67
928
%88
9855
3340
517
332
420
2771
440
$100
$38
$77
$1,2
84Ja
il M
enta
l Hea
lth F
acili
ty14
136
%22
797
103
160
289
169
4856
032
230
169
722
$167
$69
$139
$2,6
79G
EN
DE
RFe
mal
e22
628
%68
148
9792
444
165
2937
026
5910
52$1
02$5
9$1
16$1
,506
Mal
e59
430
%12
878
5141
363
175
3747
028
114
8615
1$1
15$3
8$7
7$1
,531
AG
E 18-2
9 ye
ars
189
23%
4947
5292
510
176
1850
031
676
181
$80
$31
$62
$1,4
5230
-45
year
s39
830
%10
887
5444
345
169
3644
128
119
9695
$68
$40
$79
$1,4
15
Data Table A8 91

GR
OU
P
Number of Persons
Percent of Months Homeless
LA Co Dept Health Srv hospital-inpatient
LA Co Dept Health Srv outpatient clinic
LA Co Dept Health Srv emergency room
LA Co Dept Mental Health
LA Co Dept Public Health
LA Co Dept Public Social Srv Food Stamps
LA Co Dept Public Social Srv General Relief
LA Co Dept Public Social Srv GR Housing Vouchers
LAHSA homeless srv.
LA Co Probation Dept
LA Co Sheriff general jail facilities/services
LA Co Sheriff medical jail facilities/services
LA Co Sheriff mental health jail facilities/srv
Private hospitals-inpatient
Private hospitals-emergency room
Emergency Medical Transportation
Total Average Monthly Cost when Homeless
46-6
5 ye
ars
233
33%
168
156
8944
353
174
4541
024
8861
129
$210
$60
$125
$1,7
67W
OR
K H
ISTO
RY
No
Rec
ent W
ork
His
tory
765
29%
112
9564
5737
917
334
440
2896
6212
5$1
13$4
4$8
8$1
,514
Rec
ent W
ork
His
tory
5536
%11
213
362
3147
416
145
491
2312
511
110
8$8
7$4
4$8
6$1
,654
DIS
AB
ILIT
YN
o D
isab
ility
564
26%
2675
4531
398
173
2642
027
9245
78$5
5$3
2$6
2$1
,209
Dis
abili
ty25
636
%30
114
710
310
835
717
053
511
2811
310
922
6$2
35$7
0$1
44$2
,217
ME
NTA
L IL
LNE
SS
No
Men
tal I
llnes
s51
927
%35
8739
041
517
231
410
2884
570
$49
$30
$58
$1,1
26M
enta
l Illn
ess
301
32%
243
116
106
151
334
172
4151
026
124
8033
8$2
19$6
8$1
40$2
,210
SU
BS
TAN
CE
AB
US
EN
o S
ubst
ance
Abu
se19
029
%64
9440
620
170
4235
014
115
110
117
$72
$30
$60
$1,0
25S
ubst
ance
Abu
se63
029
%12
699
7153
502
173
3347
132
9352
126
$123
$48
$96
$1,6
74H
IV/A
IDS
No
HIV
/AID
S81
329
%10
395
6355
386
172
3444
028
9564
124
$101
$43
$87
$1,4
96H
IV/A
IDS
742
%1,
075
424
115
4335
514
760
541
3843
824
710
3$1
,302
$83
$245
$4,7
30
App
endi
x 2
- Dat
a Ta
ble
A8
(con
t.)92 Where We Sleep
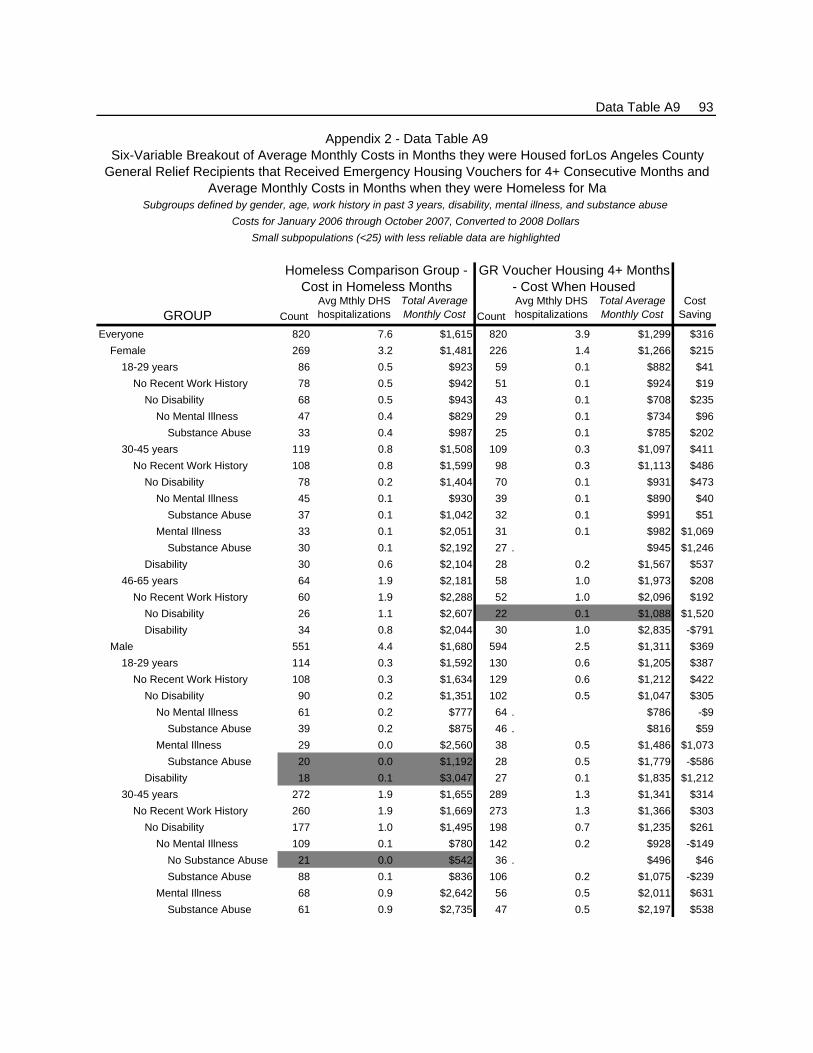
Appendix 2 - Data Table A9Six-Variable Breakout of Average Monthly Costs in Months they were Housed forLos Angeles County
General Relief Recipients that Received Emergency Housing Vouchers for 4+ Consecutive Months and Average Monthly Costs in Months when they were Homeless for Ma
Subgroups defined by gender, age, work history in past 3 years, disability, mental illness, and substance abuseCosts for January 2006 through October 2007, Converted to 2008 Dollars
Small subpopulations (<25) with less reliable data are highlighted
Homeless Comparison Group - Cost in Homeless Months
GR Voucher Housing 4+ Months - Cost When Housed
GROUP CountAvg Mthly DHS hospitalizations
Total Average Monthly Cost Count
Avg Mthly DHS hospitalizations
Total Average Monthly Cost
Cost Saving
Everyone 820 7.6 $1,615 820 3.9 $1,299 $316Female 269 3.2 $1,481 226 1.4 $1,266 $215
18-29 years 86 0.5 $923 59 0.1 $882 $41No Recent Work History 78 0.5 $942 51 0.1 $924 $19
No Disability 68 0.5 $943 43 0.1 $708 $235No Mental Illness 47 0.4 $829 29 0.1 $734 $96
Substance Abuse 33 0.4 $987 25 0.1 $785 $20230-45 years 119 0.8 $1,508 109 0.3 $1,097 $411
No Recent Work History 108 0.8 $1,599 98 0.3 $1,113 $486No Disability 78 0.2 $1,404 70 0.1 $931 $473
No Mental Illness 45 0.1 $930 39 0.1 $890 $40Substance Abuse 37 0.1 $1,042 32 0.1 $991 $51
Mental Illness 33 0.1 $2,051 31 0.1 $982 $1,069Substance Abuse 30 0.1 $2,192 27 . $945 $1,246
Disability 30 0.6 $2,104 28 0.2 $1,567 $53746-65 years 64 1.9 $2,181 58 1.0 $1,973 $208
No Recent Work History 60 1.9 $2,288 52 1.0 $2,096 $192No Disability 26 1.1 $2,607 22 0.1 $1,088 $1,520Disability 34 0.8 $2,044 30 1.0 $2,835 -$791
Male 551 4.4 $1,680 594 2.5 $1,311 $36918-29 years 114 0.3 $1,592 130 0.6 $1,205 $387
No Recent Work History 108 0.3 $1,634 129 0.6 $1,212 $422No Disability 90 0.2 $1,351 102 0.5 $1,047 $305
No Mental Illness 61 0.2 $777 64 . $786 -$9Substance Abuse 39 0.2 $875 46 . $816 $59
Mental Illness 29 0.0 $2,560 38 0.5 $1,486 $1,073Substance Abuse 20 0.0 $1,192 28 0.5 $1,779 -$586
Disability 18 0.1 $3,047 27 0.1 $1,835 $1,21230-45 years 272 1.9 $1,655 289 1.3 $1,341 $314
No Recent Work History 260 1.9 $1,669 273 1.3 $1,366 $303No Disability 177 1.0 $1,495 198 0.7 $1,235 $261
No Mental Illness 109 0.1 $780 142 0.2 $928 -$149No Substance Abuse 21 0.0 $542 36 . $496 $46Substance Abuse 88 0.1 $836 106 0.2 $1,075 -$239
Mental Illness 68 0.9 $2,642 56 0.5 $2,011 $631Substance Abuse 61 0.9 $2,735 47 0.5 $2,197 $538
Data Table A9 93
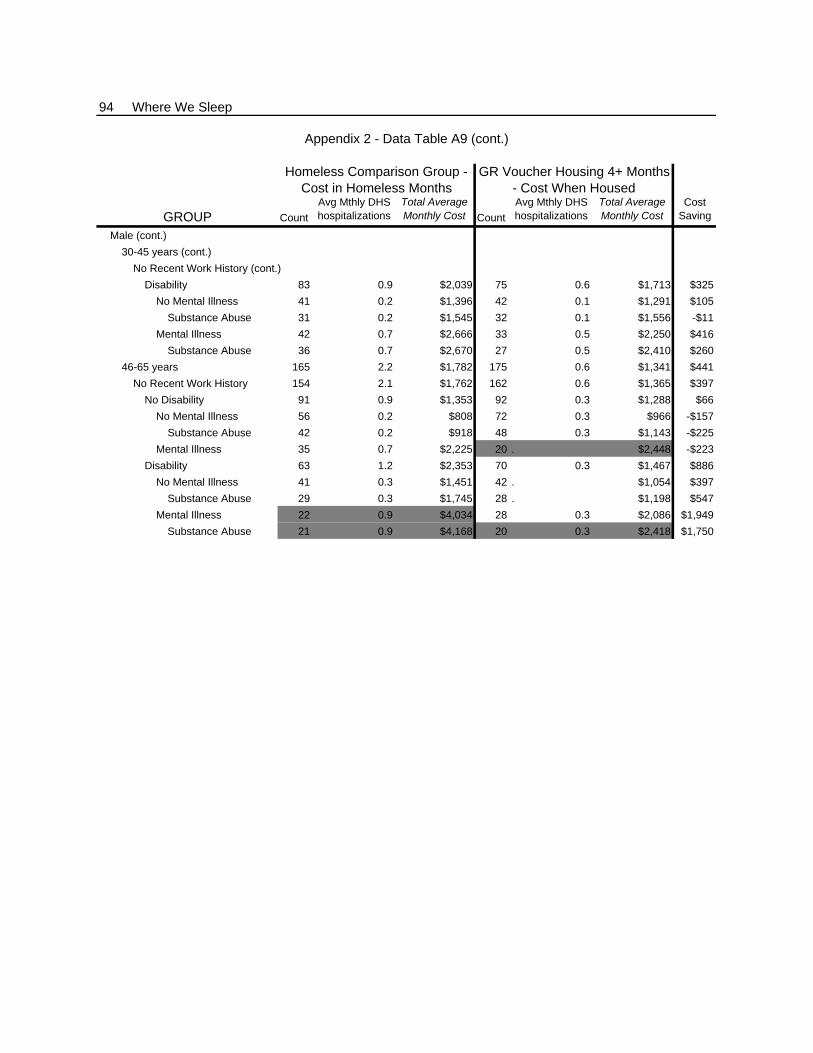
Appendix 2 - Data Table A9 (cont.)
Homeless Comparison Group - Cost in Homeless Months
GR Voucher Housing 4+ Months - Cost When Housed
GROUP CountAvg Mthly DHS hospitalizations
Total Average Monthly Cost Count
Avg Mthly DHS hospitalizations
Total Average Monthly Cost
Cost Saving
Male (cont.)30-45 years (cont.)
No Recent Work History (cont.)Disability 83 0.9 $2,039 75 0.6 $1,713 $325
No Mental Illness 41 0.2 $1,396 42 0.1 $1,291 $105Substance Abuse 31 0.2 $1,545 32 0.1 $1,556 -$11
Mental Illness 42 0.7 $2,666 33 0.5 $2,250 $416Substance Abuse 36 0.7 $2,670 27 0.5 $2,410 $260
46-65 years 165 2.2 $1,782 175 0.6 $1,341 $441No Recent Work History 154 2.1 $1,762 162 0.6 $1,365 $397
No Disability 91 0.9 $1,353 92 0.3 $1,288 $66No Mental Illness 56 0.2 $808 72 0.3 $966 -$157
Substance Abuse 42 0.2 $918 48 0.3 $1,143 -$225Mental Illness 35 0.7 $2,225 20 . $2,448 -$223
Disability 63 1.2 $2,353 70 0.3 $1,467 $886No Mental Illness 41 0.3 $1,451 42 . $1,054 $397
Substance Abuse 29 0.3 $1,745 28 . $1,198 $547Mental Illness 22 0.9 $4,034 28 0.3 $2,086 $1,949
Substance Abuse 21 0.9 $4,168 20 0.3 $2,418 $1,750
94 Where We Sleep

Sub
grou
ps d
efin
ed b
y ag
e, ja
il hi
stor
y in
pas
t 5 y
ears
, sub
stan
ce a
buse
(SA
) and
/or m
enta
l illn
ess
(MI),
dis
abili
ty, a
nd w
heth
er
empl
oyed
in p
ast 3
yea
rs
GR
OU
P
Number of Persons
Percent of Months Homeless
LA Co Dept Health Srv hospital-inpatient
LA Co Dept Health Srv outpatient clinic
LA Co Dept Health Srv emergency room
LA Co Mental Health
LA Co Public Health
LA Co DPSS Food Stamps
LA Co DPSS General Relief
LA Co DPSS GR Housing Vouchers
LAHSA homeless srv.
LA Co Probation Dept
LA Co Sheriff general jail facilities/services
LA Co Sheriff medical jail facilities/services
LA Co Sheriff mental health jail facilities/srv
Private hospitals-inpatient
Private hospitals-emergency room
Emergency Medical Transportation
Total Average Monthly Cost when Homeless
Eve
ryon
e9,
186
46%
$230
$58
$42
$38
$74
$165
$176
$65
$1$1
0$1
20$1
09$1
49$1
21$2
8$5
9$1
,446
18-2
92,
568
41%
$59
$26
$23
$33
$66
$158
$165
$55
$1$1
0$1
12$8
9$1
12$5
1$1
5$3
2$1
,007
No
Jail
1,06
338
%$3
1$2
7$1
5$2
7$2
9$1
61$1
76$4
4$1
$2$0
$0$0
$23
$10
$21
$566
Nei
ther
SA
or M
I81
338
%$1
9$2
1$9
$0$0
$160
$189
$19
$0$1
$0$0
$0$1
1$7
$14
$451
No
Dis
abili
ty69
936
%$0
$18
$8$0
$0$1
58$1
86$1
8$0
$2$0
$0$0
$1$5
$10
$406
No
Wor
k60
735
%$0
$16
$7$0
$0$1
59$1
85$1
8$0
$2$0
$0$0
$1$5
$10
$405
Rec
ent W
ork
9243
%$0
$26
$10
$0$0
$151
$186
$20
$1$1
$0$0
$0$0
$7$1
3$4
14D
isab
ility
114
51%
$132
$43
$21
$0$0
$170
$210
$22
$0$1
$0$0
$0$6
8$1
8$3
7$7
22N
o W
ork
103
50%
$146
$41
$20
$0$0
$170
$208
$24
$0$1
$0$0
$0$7
5$1
6$3
5$7
35R
ecen
t Wor
k11
57%
$0$6
6$3
8$0
$0$1
70$2
31$8
$0$0
$0$0
$0$0
$33
$60
$607
Sub
stan
ce A
buse
9625
%$0
$25
$11
$0$2
03$1
73$6
6$2
04$1
$6$0
$0$0
$0$7
$12
$707
No
Dis
abili
ty89
26%
$0$2
0$1
1$0
$184
$172
$63
$205
$0$6
$0$0
$0$0
$7$1
3$6
82N
o W
ork
8324
%$0
$17
$5$0
$198
$176
$58
$214
$0$6
$0$0
$0$0
$3$6
$684
Rec
ent W
ork
643
%$0
$53
$106
$0$0
$117
$123
$85
$2$0
$0$0
$0$0
$58
$107
$650
Dis
abili
ty7
23%
$0$8
6$0
$437
$189
$108
$187
$13
$0$0
$0$0
$0$0
$0$1
,021
No
Wor
k7
23%
$0$8
6$0
$437
$189
$108
$187
$13
$0$0
$0$0
$0$0
$0$1
,021
Rec
ent W
ork
0.
..
..
..
..
..
.M
enta
l Illn
ess
112
46%
$132
$56
$42
$146
$0$1
62$2
06$3
0$0
$1$0
$0$0
$85
$28
$57
$946
No
Dis
abili
ty67
43%
$35
$36
$39
$98
$0$1
59$2
00$3
6$0
$1$0
$0$0
$44
$25
$49
$722
No
Wor
k61
42%
$38
$39
$41
$104
$0$1
59$2
02$3
9$0
$1$0
$0$0
$48
$26
$51
$749
Rec
ent W
ork
652
%$0
$7$2
2$3
6$0
$164
$172
$0$2
$0$0
$0$0
$0$1
6$2
9$4
47
Data Table A10 95
Five
-Var
iabl
e B
reak
outs
of A
vera
ge M
onth
ly C
osts
of 9
,186
Los
Ang
eles
Cou
nty
Gen
eral
Rel
ief R
ecip
ient
s in
M
onth
s w
hen
Hom
eles
s
App
endi
x 2
- Dat
a Ta
ble
A10
Cos
ts fo
r Jan
uary
200
6 th
roug
h O
ctob
er 2
007,
Con
verte
d to
200
8 D
olla
rsS
mal
l sub
popu
latio
ns (<
25) w
ith le
ss re
liabl
e da
ta a
re h
ighl
ight
ed

GR
OU
PNumber of Persons
Percent of Months Homeless
LA Co Dept Health Srv hospital-inpatient
LA Co Dept Health Srv outpatient clinic
LA Co Dept Health Srv emergency room
LA Co Mental Health
LA Co Public Health
LA Co DPSS Food Stamps
LA Co DPSS General Relief
LA Co DPSS GR Housing Vouchers
LAHSA homeless srv.
LA Co Probation Dept
LA Co Sheriff general jail facilities/services
LA Co Sheriff medical jail facilities/services
LA Co Sheriff mental health jail facilities/srv
Private hospitals-inpatient
Private hospitals-emergency room
Emergency Medical Transportation
Total Average Monthly Cost when Homeless
Dis
abili
ty45
51%
$277
$85
$46
$218
$0$1
66$2
16$2
3$0
$1$0
$0$0
$148
$32
$68
$1,2
81N
o W
ork
3847
%$3
28$9
2$5
3$2
10$0
$165
$216
$26
$0$1
$0$0
$0$1
75$3
6$7
9$1
,380
Rec
ent W
ork
770
%$0
$49
$13
$262
$0$1
73$2
16$8
$0$0
$0$0
$0$0
$7$1
2$7
40B
oth
SA
and
MI
4235
%$5
6$6
1$5
9$3
03$2
60$1
59$9
2$1
88$1
1$2
$0$0
$0$1
55$3
4$7
3$1
,454
No
Dis
abili
ty28
29%
$84
$37
$46
$198
$295
$162
$61
$236
$4$3
$0$0
$0$2
32$2
6$6
5$1
,450
No
Wor
k25
31%
$95
$31
$52
$214
$163
$156
$69
$215
$5$3
$0$0
$0$2
60$2
9$7
2$1
,364
Rec
ent W
ork
314
%$0
$91
$66
$1,3
92$2
09$0
$405
$0$0
$0$0
$0$0
$0$0
$2,1
63D
isab
ility
1447
%$0
$109
$84
$512
$192
$153
$153
$94
$25
$0$0
$0$0
$0$4
9$9
1$1
,461
No
Wor
k9
49%
$0$1
46$7
2$6
60$2
94$1
54$1
15$1
33$5
$0$0
$0$0
$0$3
6$6
6$1
,680
Rec
ent W
ork
544
%$0
$43
$106
$245
$8$1
50$2
21$2
3$6
1$0
$0$0
$0$0
$74
$136
$1,0
67Ja
il1,
505
43%
$79
$25
$29
$37
$92
$156
$158
$64
$1$1
6$1
91$1
52$1
91$7
1$1
9$3
9$1
,319
Nei
ther
SA
or M
I81
645
%$3
1$1
5$1
1$0
$0$1
54$1
78$2
5$0
$9$1
56$8
8$0
$22
$8$1
6$7
14N
o D
isab
ility
678
43%
$22
$14
$10
$0$0
$153
$173
$24
$0$9
$157
$92
$0$1
8$8
$15
$694
No
Wor
k59
742
%$2
6$1
3$1
0$0
$0$1
54$1
71$2
4$0
$9$1
64$1
05$0
$20
$8$1
5$7
18R
ecen
t Wor
k81
49%
$0$2
2$1
0$0
$0$1
44$1
85$2
1$0
$12
$100
$0$0
$0$8
$14
$517
Dis
abili
ty13
855
%$7
0$2
1$1
4$0
$0$1
61$2
05$2
9$2
$9$1
54$6
8$0
$45
$10
$22
$812
No
Wor
k12
955
%$7
5$2
0$1
3$0
$0$1
63$2
10$2
8$2
$9$1
62$7
3$0
$49
$9$2
1$8
35R
ecen
t Wor
k9
47%
$0$3
5$2
9$0
$0$1
32$1
29$4
2$0
$17
$31
$0$0
$0$2
3$4
2$4
80S
ubst
ance
Abu
se22
933
%$1
50$4
4$3
1$0
$310
$152
$92
$178
$0$3
7$2
20$8
9$0
$160
$24
$56
$1,5
42N
o D
isab
ility
180
33%
$82
$27
$21
$0$2
91$1
51$9
2$1
76$0
$35
$182
$93
$0$7
6$1
8$3
8$1
,283
No
Wor
k16
532
%$8
9$2
7$2
3$0
$311
$150
$88
$181
$0$3
6$1
90$9
5$0
$83
$19
$41
$1,3
33R
ecen
t Wor
k15
41%
$0$3
1$3
$0$7
8$1
53$1
46$1
21$0
$28
$103
$63
$0$0
$4$7
$736
Dis
abili
ty49
35%
$399
$103
$66
$0$3
79$1
55$9
1$1
87$1
$42
$358
$74
$0$4
69$4
8$1
22$2
,495
No
Wor
k48
35%
$407
$105
$67
$0$3
87$1
55$9
0$1
91$1
$43
$365
$76
$0$4
79$4
9$1
24$2
,540
Rec
ent W
ork
164
%$0
$0$0
$10
$144
$169
$0$0
$0$0
$0$0
$0$0
$0$3
22
96 Where We SleepA
ppen
dix
2 - D
ata
Tabl
e A
10 (c
ont.)

GR
OU
PNumber of Persons
Percent of Months Homeless
LA Co Dept Health Srv hospital-inpatient
LA Co Dept Health Srv outpatient clinic
LA Co Dept Health Srv emergency room
LA Co Mental Health
LA Co Public Health
LA Co DPSS Food Stamps
LA Co DPSS General Relief
LA Co DPSS GR Housing Vouchers
LAHSA homeless srv.
LA Co Probation Dept
LA Co Sheriff general jail facilities/services
LA Co Sheriff medical jail facilities/services
LA Co Sheriff mental health jail facilities/srv
Private hospitals-inpatient
Private hospitals-emergency room
Emergency Medical Transportation
Total Average Monthly Cost when Homeless
Men
tal I
llnes
s27
850
%$1
16$2
6$4
3$8
1$0
$154
$182
$29
$2$1
3$2
78$3
99$6
31$9
3$2
8$5
8$2
,134
No
Dis
abili
ty17
546
%$9
6$1
8$3
3$5
9$0
$148
$167
$35
$1$1
4$2
85$2
53$5
66$8
5$2
1$4
5$1
,827
No
Wor
k15
445
%$1
00$1
8$3
5$6
5$0
$148
$163
$37
$1$1
4$3
13$2
83$6
18$9
1$2
2$4
8$1
,956
Rec
ent W
ork
2155
%$6
9$1
7$2
1$1
7$0
$147
$191
$23
$3$1
5$8
2$3
2$1
84$4
2$1
4$2
8$8
85D
isab
ility
103
58%
$150
$41
$61
$119
$0$1
63$2
08$1
9$3
$12
$266
$646
$742
$108
$39
$79
$2,6
56N
o W
ork
9858
%$1
58$4
3$6
3$1
20$0
$164
$208
$19
$3$1
3$2
79$6
79$7
69$1
13$4
0$8
2$2
,752
Rec
ent W
ork
558
%$0
$0$1
2$1
06$0
$155
$200
$19
$18
$0$2
5$0
$211
$0$9
$17
$772
Bot
h S
A a
nd M
I18
240
%$1
50$4
5$8
9$1
84$3
70$1
71$1
13$1
48$4
$26
$177
$137
$613
$141
$45
$93
$2,5
05N
o D
isab
ility
129
37%
$66
$50
$68
$108
$458
$174
$104
$160
$4$2
8$1
73$1
72$1
89$4
2$3
5$6
8$1
,898
No
Wor
k12
037
%$7
1$5
3$7
0$1
15$4
71$1
75$1
02$1
64$5
$27
$176
$182
$204
$45
$35
$67
$1,9
61R
ecen
t Wor
k9
40%
$0$1
6$4
0$8
$284
$158
$124
$110
$0$2
9$1
40$3
4$0
$0$4
2$7
7$1
,061
Dis
abili
ty53
48%
$355
$32
$141
$368
$156
$164
$134
$117
$2$2
3$1
88$5
1$1
,643
$383
$69
$155
$3,9
81N
o W
ork
5247
%$3
62$3
2$1
41$3
71$1
59$1
63$1
32$1
19$2
$23
$191
$52
$1,6
75$3
90$6
9$1
55$4
,038
Rec
ent W
ork
195
%$0
$0$1
42$2
10$0
$188
$241
$0$0
$0$3
6$0
$0$0
$71
$131
$1,0
1830
-45
3,77
144
%$1
53$5
7$4
3$4
2$8
3$1
64$1
74$7
4$1
$11
$140
$116
$157
$114
$29
$60
$1,4
18N
o Ja
il1,
326
41%
$97
$64
$35
$45
$54
$168
$187
$67
$1$2
$0$0
$0$8
7$2
4$5
0$8
81N
eith
er S
A o
r MI
864
41%
$78
$41
$15
$0$0
$165
$199
$40
$1$1
$0$0
$0$7
8$1
1$2
6$6
56N
o D
isab
ility
648
36%
$47
$22
$13
$0$0
$162
$190
$43
$1$1
$0$0
$0$6
8$1
0$2
3$5
80N
o W
ork
580
34%
$48
$22
$14
$0$0
$163
$191
$44
$0$1
$0$0
$0$7
0$1
0$2
3$5
85R
ecen
t Wor
k68
45%
$40
$30
$9$0
$0$1
57$1
83$3
0$7
$2$0
$0$0
$53
$7$1
6$5
32D
isab
ility
216
55%
$171
$98
$21
$0$0
$174
$227
$34
$1$2
$0$0
$0$1
06$1
5$3
5$8
84N
o W
ork
196
55%
$189
$100
$22
$0$0
$176
$226
$36
$1$2
$0$0
$0$1
17$1
5$3
7$9
21R
ecen
t Wor
k20
59%
$0$8
1$1
7$0
$0$1
57$2
29$1
1$3
$4$0
$0$0
$0$8
$15
$526
Sub
stan
ce A
buse
156
34%
$212
$111
$23
$0$3
65$1
70$1
26$1
81$0
$8$0
$0$0
$106
$20
$44
$1,3
65N
o D
isab
ility
108
27%
$45
$87
$19
$0$4
79$1
68$1
06$2
16$0
$7$0
$0$0
$8$1
9$3
5$1
,190
No
Wor
k96
26%
$0$6
1$2
1$0
$460
$170
$100
$221
$0$7
$0$0
$0$0
$21
$38
$1,1
00R
ecen
t Wor
k12
38%
$403
$289
$3$0
$629
$153
$160
$174
$0$1
3$0
$0$0
$74
$3$1
0$1
,910
Data Table A10 97A
ppen
dix
2 - D
ata
Tabl
e A
10 (c
ont.)
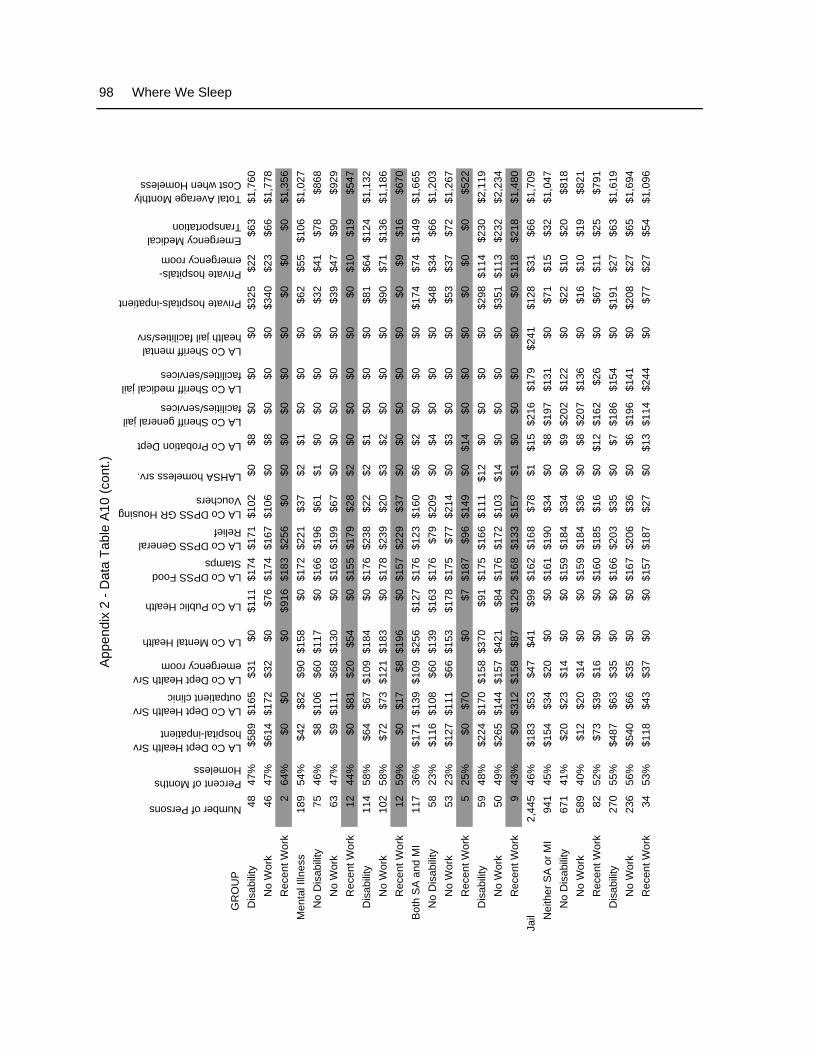
GR
OU
PNumber of Persons
Percent of Months Homeless
LA Co Dept Health Srv hospital-inpatient
LA Co Dept Health Srv outpatient clinic
LA Co Dept Health Srv emergency room
LA Co Mental Health
LA Co Public Health
LA Co DPSS Food Stamps
LA Co DPSS General Relief
LA Co DPSS GR Housing Vouchers
LAHSA homeless srv.
LA Co Probation Dept
LA Co Sheriff general jail facilities/services
LA Co Sheriff medical jail facilities/services
LA Co Sheriff mental health jail facilities/srv
Private hospitals-inpatient
Private hospitals-emergency room
Emergency Medical Transportation
Total Average Monthly Cost when Homeless
Dis
abili
ty48
47%
$589
$165
$31
$0$1
11$1
74$1
71$1
02$0
$8$0
$0$0
$325
$22
$63
$1,7
60N
o W
ork
4647
%$6
14$1
72$3
2$0
$76
$174
$167
$106
$0$8
$0$0
$0$3
40$2
3$6
6$1
,778
Rec
ent W
ork
264
%$0
$0$0
$916
$183
$256
$0$0
$0$0
$0$0
$0$0
$0$1
,356
Men
tal I
llnes
s18
954
%$4
2$8
2$9
0$1
58$0
$172
$221
$37
$2$1
$0$0
$0$6
2$5
5$1
06$1
,027
No
Dis
abili
ty75
46%
$8$1
06$6
0$1
17$0
$166
$196
$61
$1$0
$0$0
$0$3
2$4
1$7
8$8
68N
o W
ork
6347
%$9
$111
$68
$130
$0$1
68$1
99$6
7$0
$0$0
$0$0
$39
$47
$90
$929
Rec
ent W
ork
1244
%$0
$81
$20
$54
$0$1
55$1
79$2
8$2
$0$0
$0$0
$0$1
0$1
9$5
47D
isab
ility
114
58%
$64
$67
$109
$184
$0$1
76$2
38$2
2$2
$1$0
$0$0
$81
$64
$124
$1,1
32N
o W
ork
102
58%
$72
$73
$121
$183
$0$1
78$2
39$2
0$3
$2$0
$0$0
$90
$71
$136
$1,1
86R
ecen
t Wor
k12
59%
$0$1
7$8
$196
$0$1
57$2
29$3
7$0
$0$0
$0$0
$0$9
$16
$670
Bot
h S
A a
nd M
I11
736
%$1
71$1
39$1
09$2
56$1
27$1
76$1
23$1
60$6
$2$0
$0$0
$174
$74
$149
$1,6
65N
o D
isab
ility
5823
%$1
16$1
08$6
0$1
39$1
63$1
76$7
9$2
09$0
$4$0
$0$0
$48
$34
$66
$1,2
03N
o W
ork
5323
%$1
27$1
11$6
6$1
53$1
78$1
75$7
7$2
14$0
$3$0
$0$0
$53
$37
$72
$1,2
67R
ecen
t Wor
k5
25%
$0$7
0$0
$7$1
87$9
6$1
49$0
$14
$0$0
$0$0
$0$0
$522
Dis
abili
ty59
48%
$224
$170
$158
$370
$91
$175
$166
$111
$12
$0$0
$0$0
$298
$114
$230
$2,1
19N
o W
ork
5049
%$2
65$1
44$1
57$4
21$8
4$1
76$1
72$1
03$1
4$0
$0$0
$0$3
51$1
13$2
32$2
,234
Rec
ent W
ork
943
%$0
$312
$158
$87
$129
$168
$133
$157
$1$0
$0$0
$0$0
$118
$218
$1,4
80Ja
il2,
445
46%
$183
$53
$47
$41
$99
$162
$168
$78
$1$1
5$2
16$1
79$2
41$1
28$3
1$6
6$1
,709
Nei
ther
SA
or M
I94
145
%$1
54$3
4$2
0$0
$0$1
61$1
90$3
4$0
$8$1
97$1
31$0
$71
$15
$32
$1,0
47N
o D
isab
ility
671
41%
$20
$23
$14
$0$0
$159
$184
$34
$0$9
$202
$122
$0$2
2$1
0$2
0$8
18N
o W
ork
589
40%
$12
$20
$14
$0$0
$159
$184
$36
$0$8
$207
$136
$0$1
6$1
0$1
9$8
21R
ecen
t Wor
k82
52%
$73
$39
$16
$0$0
$160
$185
$16
$0$1
2$1
62$2
6$0
$67
$11
$25
$791
Dis
abili
ty27
055
%$4
87$6
3$3
5$0
$0$1
66$2
03$3
5$0
$7$1
86$1
54$0
$191
$27
$63
$1,6
19N
o W
ork
236
56%
$540
$66
$35
$0$0
$167
$206
$36
$0$6
$196
$141
$0$2
08$2
7$6
5$1
,694
Rec
ent W
ork
3453
%$1
18$4
3$3
7$0
$0$1
57$1
87$2
7$0
$13
$114
$244
$0$7
7$2
7$5
4$1
,096
98 Where We SleepA
ppen
dix
2 - D
ata
Tabl
e A
10 (c
ont.)

GR
OU
PNumber of Persons
Percent of Months Homeless
LA Co Dept Health Srv hospital-inpatient
LA Co Dept Health Srv outpatient clinic
LA Co Dept Health Srv emergency room
LA Co Mental Health
LA Co Public Health
LA Co DPSS Food Stamps
LA Co DPSS General Relief
LA Co DPSS GR Housing Vouchers
LAHSA homeless srv.
LA Co Probation Dept
LA Co Sheriff general jail facilities/services
LA Co Sheriff medical jail facilities/services
LA Co Sheriff mental health jail facilities/srv
Private hospitals-inpatient
Private hospitals-emergency room
Emergency Medical Transportation
Total Average Monthly Cost when Homeless
Sub
stan
ce A
buse
580
39%
$77
$60
$40
$0$2
64$1
62$1
22$1
44$1
$27
$222
$109
$0$7
1$2
8$5
7$1
,383
No
Dis
abili
ty39
234
%$2
8$5
2$3
1$0
$261
$162
$106
$164
$1$2
8$1
83$9
4$0
$29
$23
$45
$1,2
07N
o W
ork
349
33%
$31
$53
$34
$0$2
63$1
62$1
02$1
72$0
$28
$185
$86
$0$3
2$2
5$4
8$1
,221
Rec
ent W
ork
4343
%$0
$49
$13
$0$2
45$1
61$1
36$1
01$3
$25
$169
$162
$0$0
$12
$21
$1,0
96D
isab
ility
188
50%
$181
$77
$59
$0$2
70$1
60$1
55$1
02$1
$25
$303
$139
$0$1
58$3
8$8
1$1
,750
No
Wor
k17
650
%$1
73$8
1$5
9$0
$254
$161
$155
$103
$1$2
6$3
15$1
48$0
$136
$38
$79
$1,7
30R
ecen
t Wor
k12
55%
$296
$17
$58
$0$4
93$1
54$1
55$9
0$1
$11
$124
$0$0
$487
$42
$111
$2,0
39M
enta
l Illn
ess
412
54%
$192
$52
$59
$63
$0$1
63$2
11$3
8$0
$9$2
50$3
24$7
68$1
30$3
6$7
6$2
,371
No
Dis
abili
ty19
149
%$6
0$4
2$5
0$4
7$0
$159
$190
$41
$0$1
0$3
24$3
09$5
60$5
8$2
8$5
6$1
,934
No
Wor
k17
348
%$6
5$4
2$5
2$4
7$0
$159
$193
$45
$0$1
1$3
28$3
42$5
99$5
8$2
9$5
8$2
,026
Rec
ent W
ork
1855
%$1
5$4
4$2
9$4
5$0
$160
$161
$8$0
$3$2
87$0
$185
$64
$16
$34
$1,0
50D
isab
ility
221
59%
$306
$62
$68
$77
$0$1
66$2
30$3
5$0
$7$1
86$3
36$9
47$1
93$4
3$9
3$2
,749
No
Wor
k20
959
%$3
23$6
2$7
0$7
6$0
$165
$229
$36
$0$7
$195
$355
$987
$204
$45
$97
$2,8
54R
ecen
t Wor
k12
59%
$0$4
8$2
2$9
1$0
$182
$240
$21
$0$7
$27
$0$2
53$0
$10
$18
$918
Bot
h S
A a
nd M
I51
247
%$3
51$8
0$9
5$1
45$1
75$1
63$1
44$1
15$3
$22
$216
$228
$535
$299
$60
$131
$2,7
63N
o D
isab
ility
260
42%
$190
$49
$68
$126
$216
$159
$119
$147
$2$2
5$2
26$1
99$5
80$1
69$4
2$8
9$2
,406
No
Wor
k24
141
%$1
40$5
1$6
9$1
13$2
28$1
61$1
18$1
46$2
$26
$224
$214
$597
$162
$43
$90
$2,3
85R
ecen
t Wor
k19
52%
$827
$35
$51
$295
$66
$136
$135
$153
$6$1
4$2
46$6
$354
$256
$28
$70
$2,6
80D
isab
ility
252
52%
$516
$112
$123
$163
$133
$168
$170
$83
$4$1
8$2
06$2
58$4
89$4
33$7
9$1
75$3
,130
No
Wor
k23
752
%$5
28$1
10$1
27$1
69$1
13$1
68$1
70$8
2$5
$17
$211
$272
$504
$443
$81
$180
$3,1
81R
ecen
t Wor
k15
53%
$315
$145
$57
$69
$446
$163
$157
$107
$0$3
0$1
41$3
2$2
63$2
60$4
5$1
02$2
,332
46+
2,84
752
%$4
88$8
9$5
7$3
7$7
1$1
72$1
88$6
2$2
$8$1
00$1
17$1
74$1
94$3
8$8
3$1
,880
No
Jail
1,40
251
%$5
28$1
00$4
7$4
0$4
0$1
75$2
00$5
3$3
$1$0
$0$0
$201
$31
$71
$1,4
89N
eith
er S
A o
r MI
951
53%
$478
$74
$26
$0$0
$174
$211
$30
$2$1
$0$0
$0$1
55$1
8$4
4$1
,213
No
Dis
abili
ty53
448
%$1
28$3
8$1
4$0
$0$1
73$1
92$3
0$1
$1$0
$0$0
$71
$11
$24
$683
NoN
o W
ork
453
49%
$151
$39
$15
$0$0
$175
$191
$27
$1$1
$0$0
$0$8
3$1
1$2
7$7
20R
ecen
t Wor
k81
43%
$0$3
5$9
$0$0
$163
$200
$50
$2$2
$0$0
$0$0
$6$1
2$4
78
Data Table A10 99A
ppen
dix
2 - D
ata
Tabl
e A
10 (c
ont.)
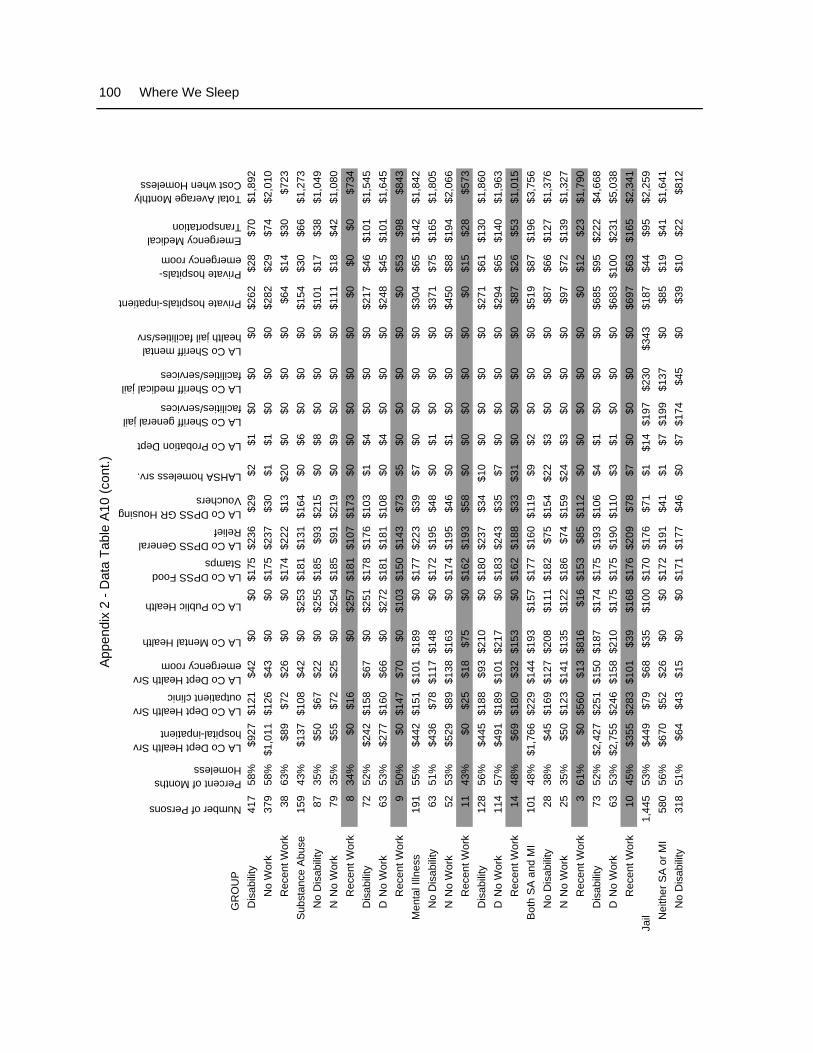
GR
OU
PNumber of Persons
Percent of Months Homeless
LA Co Dept Health Srv hospital-inpatient
LA Co Dept Health Srv outpatient clinic
LA Co Dept Health Srv emergency room
LA Co Mental Health
LA Co Public Health
LA Co DPSS Food Stamps
LA Co DPSS General Relief
LA Co DPSS GR Housing Vouchers
LAHSA homeless srv.
LA Co Probation Dept
LA Co Sheriff general jail facilities/services
LA Co Sheriff medical jail facilities/services
LA Co Sheriff mental health jail facilities/srv
Private hospitals-inpatient
Private hospitals-emergency room
Emergency Medical Transportation
Total Average Monthly Cost when Homeless
Dis
abili
ty41
758
%$9
27$1
21$4
2$0
$0$1
75$2
36$2
9$2
$1$0
$0$0
$262
$28
$70
$1,8
92N
o W
ork
379
58%
$1,0
11$1
26$4
3$0
$0$1
75$2
37$3
0$1
$1$0
$0$0
$282
$29
$74
$2,0
10R
ecen
t Wor
k38
63%
$89
$72
$26
$0$0
$174
$222
$13
$20
$0$0
$0$0
$64
$14
$30
$723
Sub
stan
ce A
buse
159
43%
$137
$108
$42
$0$2
53$1
81$1
31$1
64$0
$6$0
$0$0
$154
$30
$66
$1,2
73N
o D
isab
ility
8735
%$5
0$6
7$2
2$0
$255
$185
$93
$215
$0$8
$0$0
$0$1
01$1
7$3
8$1
,049
NoN
o W
ork
7935
%$5
5$7
2$2
5$0
$254
$185
$91
$219
$0$9
$0$0
$0$1
11$1
8$4
2$1
,080
Rec
ent W
ork
834
%$0
$16
$0$2
57$1
81$1
07$1
73$0
$0$0
$0$0
$0$0
$0$7
34D
isab
ility
7252
%$2
42$1
58$6
7$0
$251
$178
$176
$103
$1$4
$0$0
$0$2
17$4
6$1
01$1
,545
DiN
o W
ork
6353
%$2
77$1
60$6
6$0
$272
$181
$181
$108
$0$4
$0$0
$0$2
48$4
5$1
01$1
,645
Rec
ent W
ork
950
%$0
$147
$70
$0$1
03$1
50$1
43$7
3$5
$0$0
$0$0
$0$5
3$9
8$8
43M
enta
l Illn
ess
191
55%
$442
$151
$101
$189
$0$1
77$2
23$3
9$7
$0$0
$0$0
$304
$65
$142
$1,8
42N
o D
isab
ility
6351
%$4
36$7
8$1
17$1
48$0
$172
$195
$48
$0$1
$0$0
$0$3
71$7
5$1
65$1
,805
NoN
o W
ork
5253
%$5
29$8
9$1
38$1
63$0
$174
$195
$46
$0$1
$0$0
$0$4
50$8
8$1
94$2
,066
Rec
ent W
ork
1143
%$0
$25
$18
$75
$0$1
62$1
93$5
8$0
$0$0
$0$0
$0$1
5$2
8$5
73D
isab
ility
128
56%
$445
$188
$93
$210
$0$1
80$2
37$3
4$1
0$0
$0$0
$0$2
71$6
1$1
30$1
,860
DiN
o W
ork
114
57%
$491
$189
$101
$217
$0$1
83$2
43$3
5$7
$0$0
$0$0
$294
$65
$140
$1,9
63R
ecen
t Wor
k14
48%
$69
$180
$32
$153
$0$1
62$1
88$3
3$3
1$0
$0$0
$0$8
7$2
6$5
3$1
,015
Bot
h S
A a
nd M
I10
148
%$1
,766
$229
$144
$193
$157
$177
$160
$119
$9$2
$0$0
$0$5
19$8
7$1
96$3
,756
No
Dis
abili
ty28
38%
$45
$169
$127
$208
$111
$182
$75
$154
$22
$3$0
$0$0
$87
$66
$127
$1,3
76N
oNo
Wor
k25
35%
$50
$123
$141
$135
$122
$186
$74
$159
$24
$3$0
$0$0
$97
$72
$139
$1,3
27R
ecen
t Wor
k3
61%
$0$5
60$1
3$8
16$1
6$1
53$8
5$1
12$0
$0$0
$0$0
$0$1
2$2
3$1
,790
Dis
abili
ty73
52%
$2,4
27$2
51$1
50$1
87$1
74$1
75$1
93$1
06$4
$1$0
$0$0
$685
$95
$222
$4,6
68D
iNo
Wor
k63
53%
$2,7
55$2
46$1
58$2
10$1
75$1
75$1
90$1
10$3
$1$0
$0$0
$683
$100
$231
$5,0
38R
ecen
t Wor
k10
45%
$355
$283
$101
$39
$168
$176
$209
$78
$7$0
$0$0
$0$6
97$6
3$1
65$2
,341
Jail
1,44
553
%$4
49$7
9$6
8$3
5$1
00$1
70$1
76$7
1$1
$14
$197
$230
$343
$187
$44
$95
$2,2
59N
eith
er S
A o
r MI
580
56%
$670
$52
$26
$0$0
$172
$191
$41
$1$7
$199
$137
$0$8
5$1
9$4
1$1
,641
No
Dis
abili
ty31
851
%$6
4$4
3$1
5$0
$0$1
71$1
77$4
6$0
$7$1
74$4
5$0
$39
$10
$22
$812
100 Where We SleepA
ppen
dix
2 - D
ata
Tabl
e A
10 (c
ont.)

GR
OU
PNumber of Persons
Percent of Months Homeless
LA Co Dept Health Srv hospital-inpatient
LA Co Dept Health Srv outpatient clinic
LA Co Dept Health Srv emergency room
LA Co Mental Health
LA Co Public Health
LA Co DPSS Food Stamps
LA Co DPSS General Relief
LA Co DPSS GR Housing Vouchers
LAHSA homeless srv.
LA Co Probation Dept
LA Co Sheriff general jail facilities/services
LA Co Sheriff medical jail facilities/services
LA Co Sheriff mental health jail facilities/srv
Private hospitals-inpatient
Private hospitals-emergency room
Emergency Medical Transportation
Total Average Monthly Cost when Homeless
No
Wor
k27
751
%$5
2$4
1$1
5$0
$0$1
74$1
77$5
0$0
$7$1
82$4
0$0
$41
$10
$22
$811
Rec
ent W
ork
4152
%$1
44$5
2$1
5$0
$0$1
53$1
78$2
0$0
$8$1
16$7
7$0
$22
$10
$20
$815
Dis
abili
ty26
263
%$1
,406
$64
$40
$0$0
$174
$208
$36
$1$7
$229
$248
$0$1
41$3
0$6
5$2
,648
DiN
o W
ork
248
63%
$1,4
82$5
5$4
0$0
$0$1
75$2
07$3
4$2
$7$2
39$2
59$0
$141
$30
$65
$2,7
37R
ecen
t Wor
k14
60%
$67
$214
$42
$0$0
$159
$219
$61
$0$1
$49
$54
$0$1
39$2
5$5
6$1
,084
Sub
stan
ce A
buse
359
46%
$170
$107
$51
$0$2
35$1
68$1
38$1
22$1
$23
$190
$134
$0$1
82$3
5$7
8$1
,634
No
Dis
abili
ty17
641
%$1
15$9
2$4
9$0
$227
$166
$115
$148
$1$2
6$1
78$8
9$0
$150
$35
$76
$1,4
65N
oNo
Wor
k15
639
%$1
19$7
7$4
5$0
$228
$168
$111
$155
$1$2
6$1
91$9
5$0
$150
$34
$74
$1,4
73R
ecen
t Wor
k20
50%
$83
$208
$83
$0$2
21$1
51$1
41$8
7$1
$25
$76
$41
$0$1
55$4
3$9
0$1
,405
Dis
abili
ty18
352
%$2
23$1
21$5
2$0
$242
$170
$161
$97
$1$2
1$2
02$1
77$0
$213
$35
$80
$1,7
96D
iNo
Wor
k16
551
%$1
79$1
12$5
3$0
$259
$170
$163
$96
$1$2
0$2
12$1
97$0
$174
$35
$77
$1,7
47R
ecen
t Wor
k18
60%
$630
$201
$49
$0$9
1$1
74$1
44$1
04$1
$23
$107
$0$0
$578
$35
$105
$2,2
40M
enta
l Illn
ess
253
55%
$330
$92
$77
$53
$0$1
68$2
04$4
7$1
$12
$205
$362
$1,3
39$1
75$5
0$1
04$3
,217
No
Dis
abili
ty93
50%
$141
$65
$43
$47
$0$1
67$1
81$4
8$0
$9$1
82$2
57$7
67$6
3$3
0$5
9$2
,058
NoN
o W
ork
7750
%$1
70$4
6$4
6$5
1$0
$171
$180
$45
$0$8
$193
$310
$882
$76
$32
$63
$2,2
74R
ecen
t Wor
k16
49%
$0$1
58$2
6$2
7$0
$148
$185
$59
$0$1
3$1
29$0
$213
$0$2
1$3
8$1
,018
Dis
abili
ty16
058
%$4
40$1
07$9
7$5
6$0
$168
$217
$46
$2$1
3$2
19$4
23$1
,672
$240
$61
$130
$3,8
91D
iNo
Wor
k15
658
%$4
47$1
07$9
4$5
7$0
$169
$218
$48
$2$1
3$2
23$4
34$1
,712
$237
$60
$128
$3,9
48R
ecen
t Wor
k4
56%
$167
$106
$187
$1$0
$127
$182
$3$2
$34
$50
$8$9
0$3
75$1
01$2
12$1
,644
Bot
h S
A a
nd M
I25
354
%$4
54$9
0$1
77$1
47$2
39$1
67$1
67$9
2$3
$21
$194
$450
$618
$442
$110
$232
$3,6
04N
o D
isab
ility
7947
%$1
84$5
0$7
2$1
25$3
34$1
69$1
44$1
13$1
$20
$217
$206
$483
$259
$45
$101
$2,5
22N
oNo
Wor
k68
44%
$157
$41
$62
$53
$375
$169
$142
$122
$0$2
0$2
23$1
81$5
61$2
13$4
0$8
8$2
,447
Rec
ent W
ork
1165
%$3
52$1
02$1
36$5
65$8
3$1
66$1
56$5
5$4
$18
$185
$358
$0$5
41$7
7$1
80$2
,979
Dis
abili
ty17
457
%$5
77$1
08$2
25$1
57$1
96$1
66$1
78$8
2$4
$22
$183
$561
$679
$525
$139
$292
$4,0
95D
iNo
Wor
k16
656
%$6
05$1
08$2
31$1
65$2
04$1
66$1
78$8
5$4
$22
$187
$557
$664
$551
$143
$302
$4,1
70R
ecen
t Wor
k8
70%
$0$1
04$1
01$5
$37
$170
$169
$38
$0$3
1$1
12$6
38$9
80$0
$54
$100
$2,5
39
Data Table A10 101A
ppen
dix
2 - D
ata
Tabl
e A
10 (c
ont.)

102 Where We Sleep

App
endi
x 2
- Dat
a Ta
ble
A11
Five
-Var
iabl
e B
reak
outs
of A
vera
ge M
onth
ly C
osts
of 9
,186
Los
Ang
eles
Cou
nty
Gen
eral
Rel
ief R
ecip
ient
s in
M
onth
s w
hen
Not
Hom
eles
sS
ubgr
oups
def
ined
by
age,
jail
hist
ory
in p
ast 5
yea
rs, s
ubst
ance
abu
se (S
A) a
nd/o
r men
tal i
llnes
s (M
I), d
isab
ility
, and
whe
ther
em
ploy
ed in
pas
t 3 y
ears
Cos
ts fo
r Jan
uary
200
6 th
roug
h O
ctob
er 2
007,
Con
verte
d to
200
8 D
olla
rsS
mal
l sub
popu
latio
ns (<
25) w
ith le
ss re
liabl
e da
ta a
re h
ighl
ight
ed
GR
OU
P
Number of Persons
LA Co Dept Health Srv hospital-inpatient
LA Co Dept Health Srv outpatient clinic
LA Co Dept Health Srv emergency room
LA Co Dept Mental Health
LA Co Dept Public Health
LA Co Dept Public Social Srv Food Stamps
LA Co Dept Public Social Srv General Relief
LA Co Probation Dept
LA Co Sheriff general jail facilities/services
LA Co Sheriff medical jail facilities/services
LA Co Sheriff mental health jail facilities/srv
Private hospitals-inpatient
Private hospitals-emergency room
Emergency Medical Transportation
Total Average Monthly Cost when Not Homeless
Difference: Not Homeless minus Homeless
Eve
ryon
e9,
186
$152
$32
$24
$28
$62
$22
$24
$9$8
3$8
1$7
8$8
6$1
5$3
3$7
28-$
719
18-2
92,
568
$73
$15
$16
$34
$37
$15
$14
$10
$83
$65
$56
$48
$9$2
0$4
95-$
512
No
Jail
1,06
3$1
08$1
1$8
$29
$22
$12
$11
$1$0
$0$0
$28
$5$1
1$2
47-$
319
Nei
ther
SA
or M
I81
3$1
5$1
0$5
$0$0
$9$9
$1$0
$0$0
$17
$3$7
$76
-$37
5N
o D
isab
ility
699
$13
$9$4
$0$0
$8$7
$2$0
$0$0
$16
$3$6
$68
-$33
8N
o W
ork
607
$11
$8$4
$0$0
$7$6
$2$0
$0$0
$10
$3$5
$55
-$35
0R
ecen
t Wor
k92
$28
$18
$6$0
$0$1
5$1
3$1
$0$0
$0$5
3$4
$12
$150
-$26
4D
isab
ility
114
$27
$13
$11
$0$0
$16
$19
$1$0
$0$0
$21
$7$1
4$1
28-$
594
No
Wor
k10
3$3
0$1
1$9
$0$0
$14
$18
$1$0
$0$0
$24
$5$1
1$1
22-$
613
Rec
ent W
ork
11$0
$28
$29
$0$0
$32
$30
$0$0
$0$0
$0$2
3$4
2$1
84-$
423
Sub
stan
ce A
buse
96$4
$12
$7$0
$162
$27
$14
$4$0
$0$0
$10
$6$1
1$2
58-$
449
No
Dis
abili
ty89
$0$1
1$6
$0$1
69$2
8$1
4$4
$0$0
$0$0
$5$9
$245
-$43
7N
o W
ork
83$0
$7$7
$0$1
75$2
8$1
5$4
$0$0
$0$0
$5$1
0$2
52-$
433
Rec
ent W
ork
6$0
$64
$0$7
3$1
9$0
$0$0
$0$0
$0$0
$0$1
57-$
494
Dis
abili
ty7
$51
$25
$18
$0$8
4$2
4$2
2$0
$0$0
$0$1
39$1
7$4
0$4
20-$
601
No
Wor
k7
$51
$25
$18
$0$8
4$2
4$2
2$0
$0$0
$0$1
39$1
7$4
0$4
20-$
601
Rec
ent W
ork
0.
..
..
..
..
.M
enta
l Illn
ess
112
$411
$22
$24
$110
$0$1
1$1
3$0
$0$0
$0$5
2$1
3$2
7$6
82-$
265
No
Dis
abili
ty67
$0$6
$8$3
2$0
$9$8
$0$0
$0$0
$0$7
$12
$83
-$63
9N
o W
ork
61$0
$7$7
$31
$0$8
$7$0
$0$0
$0$0
$6$1
2$7
8-$
671
Rec
ent W
ork
6$0
$0$1
6$5
2$0
$20
$15
$0$0
$0$0
$0$1
0$1
9$1
33-$
314
Data Table A11 103

App
endi
x 2
- Dat
a Ta
ble
A11
(con
t.)
GR
OU
PNumber of Persons
LA Co Dept Health Srv hospital-inpatient
LA Co Dept Health Srv outpatient clinic
LA Co Dept Health Srv emergency room
LA Co Dept Mental Health
LA Co Dept Public Health
LA Co Dept Public Social Srv Food Stamps
LA Co Dept Public Social Srv General Relief
LA Co Probation Dept
LA Co Sheriff general jail facilities/services
LA Co Sheriff medical jail facilities/services
LA Co Sheriff mental health jail facilities/srv
Private hospitals-inpatient
Private hospitals-emergency room
Emergency Medical Transportation
Total Average Monthly Cost when Not Homeless
Difference: Not Homeless minus Homeless
Dis
abili
ty45
$1,0
36$4
6$4
8$2
29$0
$13
$19
$1$0
$0$0
$129
$22
$49
$1,5
92$3
11N
o W
ork
38$1
,232
$54
$45
$233
$0$1
4$2
0$1
$0$0
$0$1
53$2
1$4
9$1
,820
$440
Rec
ent W
ork
7$0
$0$6
3$2
11$0
$12
$18
$0$0
$0$0
$0$2
7$4
9$3
80-$
360
Bot
h S
A a
nd M
I42
$1,3
54$1
6$2
7$4
56$1
74$3
4$3
4$1
$0$0
$0$2
32$1
9$5
0$2
,398
$945
No
Dis
abili
ty28
$0$1
5$1
0$1
93$1
98$2
6$1
7$2
$0$0
$0$0
$9$1
6$4
85-$
965
No
Wor
k25
$0$1
3$1
1$2
14$1
96$1
6$4
$2$0
$0$0
$0$1
0$1
8$4
85-$
880
Rec
ent W
ork
3$0
$29
$20
$208
$109
$122
$0$0
$0$0
$0$0
$0$4
88-$
1,67
4D
isab
ility
14$4
,271
$20
$67
$1,0
21$1
23$5
2$7
2$0
$0$0
$0$6
96$3
8$1
19$6
,478
$5,0
17N
o W
ork
9$6
,940
$29
$78
$1,5
55$1
99$4
4$5
8$0
$0$0
$0$1
,083
$42
$153
$10,
182
$8,5
02R
ecen
t Wor
k5
$0$6
$49
$166
$0$6
4$9
3$0
$0$0
$0$0
$32
$58
$467
-$59
9Ja
il1,
505
$49
$18
$22
$37
$48
$17
$16
$15
$143
$111
$96
$62
$12
$26
$672
-$64
7N
eith
er S
A o
r MI
816
$6$1
4$6
$0$0
$11
$11
$9$1
10$8
4$0
$11
$4$8
$273
-$44
1N
o D
isab
ility
678
$7$1
1$5
$0$0
$9$9
$9$1
15$7
4$0
$13
$4$8
$264
-$43
1N
o W
ork
597
$6$1
1$5
$0$0
$8$8
$8$1
13$8
3$0
$13
$4$8
$268
-$45
0R
ecen
t Wor
k81
$14
$9$6
$0$0
$9$1
2$1
3$1
25$1
0$0
$17
$5$1
0$2
30-$
286
Dis
abili
ty13
8$0
$27
$7$0
$0$2
1$2
4$9
$83
$137
$0$0
$4$8
$321
-$49
1N
o W
ork
129
$0$2
9$7
$0$0
$22
$25
$9$8
8$1
47$0
$0$5
$9$3
40-$
494
Rec
ent W
ork
9$0
$0$0
$0$8
$12
$17
$23
$0$0
$0$0
$0$6
0-$
420
Sub
stan
ce A
buse
229
$32
$15
$6$0
$166
$22
$16
$32
$223
$49
$0$2
1$5
$10
$596
-$94
6N
o D
isab
ility
180
$40
$13
$6$0
$167
$21
$15
$32
$221
$37
$0$2
7$5
$11
$594
-$68
9N
o W
ork
165
$44
$11
$6$0
$159
$20
$13
$32
$222
$41
$0$2
9$5
$12
$595
-$73
8R
ecen
t Wor
k15
$0$3
5$0
$249
$30
$33
$31
$210
$0$0
$0$0
$0$5
88-$
148
Dis
abili
ty49
$0$2
2$5
$0$1
63$2
7$2
0$3
5$2
28$8
9$0
$0$5
$9$6
02-$
1,89
3N
o W
ork
48$0
$23
$5$0
$166
$28
$20
$36
$221
$73
$0$0
$5$9
$586
-$1,
954
Rec
ent W
ork
1$0
$0$0
$0$0
$0$0
$553
$836
$0$0
$0$0
$1,3
89$1
,067
Men
tal I
llnes
s27
8$6
8$2
4$2
3$4
1$0
$18
$25
$12
$170
$262
$317
$68
$16
$34
$1,0
78-$
1,05
6N
o D
isab
ility
175
$42
$11
$19
$47
$0$1
0$1
4$1
4$1
88$3
83$2
96$3
9$1
3$2
6$1
,102
-$72
5N
o W
ork
154
$47
$11
$20
$52
$0$8
$10
$14
$201
$396
$304
$45
$14
$29
$1,1
51-$
805
104 Where We Sleep

App
endi
x 2
- Dat
a Ta
ble
A11
(con
t.)
GR
OU
PNumber of Persons
LA Co Dept Health Srv hospital-inpatient
LA Co Dept Health Srv outpatient clinic
LA Co Dept Health Srv emergency room
LA Co Dept Mental Health
LA Co Dept Public Health
LA Co Dept Public Social Srv Food Stamps
LA Co Dept Public Social Srv General Relief
LA Co Probation Dept
LA Co Sheriff general jail facilities/services
LA Co Sheriff medical jail facilities/services
LA Co Sheriff mental health jail facilities/srv
Private hospitals-inpatient
Private hospitals-emergency room
Emergency Medical Transportation
Total Average Monthly Cost when Not Homeless
Difference: Not Homeless minus Homeless
Rec
ent W
ork
21$0
$10
$7$6
$0$2
9$4
4$1
5$8
9$2
86$2
35$0
$4$7
$732
-$15
3D
isab
ility
103
$114
$50
$32
$30
$0$3
2$4
5$1
0$1
38$4
4$3
56$1
15$2
1$4
7$1
,032
-$1,
624
No
Wor
k98
$121
$51
$32
$25
$0$2
7$3
8$1
0$1
45$4
6$3
52$1
21$2
1$4
7$1
,037
-$1,
716
Rec
ent W
ork
5$0
$14
$21
$118
$0$1
27$1
63$1
1$1
7$0
$424
$0$1
7$3
1$9
42$1
70B
oth
SA
and
MI
182
$235
$32
$114
$241
$187
$36
$27
$27
$150
$84
$318
$333
$48
$111
$1,9
42-$
562
No
Dis
abili
ty12
9$1
79$2
6$2
8$9
4$1
92$3
4$2
2$2
6$1
45$1
11$8
1$1
30$1
8$4
1$1
,128
-$77
0N
o W
ork
120
$192
$26
$30
$98
$191
$33
$22
$26
$147
$120
$88
$140
$18
$44
$1,1
75-$
786
Rec
ent W
ork
9$0
$26
$6$2
9$2
01$4
1$3
4$2
7$1
28$0
$0$0
$6$1
1$5
10-$
551
Dis
abili
ty53
$371
$46
$324
$601
$174
$42
$39
$28
$163
$18
$895
$825
$121
$281
$3,9
28-$
53N
o W
ork
52$3
78$4
7$3
30$6
12$1
78$4
3$3
9$2
8$1
66$1
8$9
12$8
41$1
24$2
87$4
,004
-$33
Rec
ent W
ork
1$0
$0$0
$0$0
$0$0
$0$0
$0$0
$0$0
$0-$
1,01
830
-45
3,77
1$1
21$3
0$2
3$2
6$6
8$2
2$2
4$9
$94
$92
$70
$69
$15
$32
$695
-$72
3N
o Ja
il1,
326
$126
$31
$20
$24
$38
$19
$22
$2$0
$0$0
$53
$12
$26
$374
-$50
8N
eith
er S
A o
r MI
864
$33
$20
$10
$0$0
$11
$12
$1$0
$0$0
$14
$6$1
1$1
18-$
538
No
Dis
abili
ty64
8$2
2$9
$4$0
$0$8
$7$1
$0$0
$0$8
$3$5
$67
-$51
3N
o W
ork
580
$24
$8$4
$0$0
$7$6
$1$0
$0$0
$9$2
$5$6
7-$
519
Rec
ent W
ork
68$0
$19
$8$0
$0$1
1$1
2$1
$0$0
$0$0
$6$1
0$6
7-$
465
Dis
abili
ty21
6$6
9$5
5$3
0$0
$0$2
2$2
8$2
$0$0
$0$3
0$1
5$2
9$2
78-$
606
No
Wor
k19
6$6
6$5
1$3
0$0
$0$2
2$2
9$1
$0$0
$0$2
5$1
5$2
9$2
66-$
654
Rec
ent W
ork
20$9
1$8
8$2
9$0
$0$2
2$1
9$4
$0$0
$0$8
1$1
7$3
7$3
88-$
138
Sub
stan
ce A
buse
156
$229
$44
$12
$0$2
43$3
6$3
1$8
$0$0
$0$1
16$7
$21
$748
-$61
7N
o D
isab
ility
108
$19
$40
$8$0
$225
$30
$22
$7$0
$0$0
$18
$5$1
1$3
85-$
804
No
Wor
k96
$21
$29
$9$0
$238
$31
$23
$6$0
$0$0
$20
$6$1
2$3
95-$
705
Rec
ent W
ork
12$0
$137
$5$0
$111
$18
$17
$8$0
$0$0
$0$3
$6$3
06-$
1,60
4D
isab
ility
48$7
28$5
5$2
2$0
$287
$51
$52
$10
$0$0
$0$3
35$1
1$4
4$1
,596
-$16
4N
o W
ork
46$7
45$5
6$2
3$0
$278
$53
$53
$11
$0$0
$0$3
50$1
1$4
6$1
,624
-$15
4R
ecen
t Wor
k2
$0$0
$0$7
03$0
$0$0
$0$0
$0$0
$0$0
$703
-$65
3
Data Table A11 105

App
endi
x 2
- Dat
a Ta
ble
A11
(con
t.)
GR
OU
PNumber of Persons
LA Co Dept Health Srv hospital-inpatient
LA Co Dept Health Srv outpatient clinic
LA Co Dept Health Srv emergency room
LA Co Dept Mental Health
LA Co Dept Public Health
LA Co Dept Public Social Srv Food Stamps
LA Co Dept Public Social Srv General Relief
LA Co Probation Dept
LA Co Sheriff general jail facilities/services
LA Co Sheriff medical jail facilities/services
LA Co Sheriff mental health jail facilities/srv
Private hospitals-inpatient
Private hospitals-emergency room
Emergency Medical Transportation
Total Average Monthly Cost when Not Homeless
Difference: Not Homeless minus Homeless
Men
tal I
llnes
s18
9$1
97$4
4$3
7$7
6$0
$29
$45
$0$0
$0$0
$56
$26
$52
$562
-$46
5N
o D
isab
ility
75$1
6$2
7$3
7$4
7$0
$17
$24
$0$0
$0$0
$32
$31
$58
$289
-$57
8N
o W
ork
63$1
9$2
5$3
7$4
7$0
$13
$20
$0$0
$0$0
$38
$30
$58
$287
-$64
2R
ecen
t Wor
k12
$0$4
0$3
9$4
8$0
$34
$44
$0$0
$0$0
$0$3
4$6
3$3
00-$
247
Dis
abili
ty11
4$3
23$5
5$3
7$9
7$0
$38
$59
$1$0
$0$0
$72
$23
$47
$752
-$38
0N
o W
ork
102
$357
$58
$41
$99
$0$3
8$5
9$1
$0$0
$0$8
1$2
6$5
3$8
12-$
374
Rec
ent W
ork
12$0
$26
$69
$0$3
8$6
1$0
$0$0
$0$0
$0$0
$193
-$47
7B
oth
SA
and
MI
117
$565
$68
$79
$153
$105
$41
$52
$2$0
$0$0
$259
$46
$103
$1,4
74-$
191
No
Dis
abili
ty58
$197
$28
$33
$80
$131
$34
$37
$4$0
$0$0
$93
$21
$44
$701
-$50
2N
o W
ork
53$1
50$2
3$3
4$8
5$1
37$3
3$3
4$3
$0$0
$0$5
5$2
1$4
2$6
16-$
652
Rec
ent W
ork
5$7
02$7
9$2
5$2
5$6
4$5
1$6
9$1
6$0
$0$0
$487
$19
$69
$1,6
06$1
,084
Dis
abili
ty59
$945
$111
$129
$229
$79
$48
$67
$1$0
$0$0
$422
$71
$160
$2,2
62$1
43N
o W
ork
50$1
,053
$83
$144
$264
$81
$45
$61
$1$0
$0$0
$422
$78
$172
$2,4
05$1
71R
ecen
t Wor
k9
$383
$254
$53
$48
$65
$67
$95
$1$0
$0$0
$423
$34
$93
$1,5
15$3
6Ja
il2,
445
$119
$30
$25
$27
$84
$24
$25
$13
$144
$143
$108
$78
$16
$35
$869
-$84
0N
eith
er S
A o
r MI
941
$49
$28
$15
$0$0
$17
$19
$6$1
20$1
97$0
$66
$10
$23
$549
-$49
9N
o D
isab
ility
671
$30
$17
$12
$0$0
$11
$11
$7$1
14$2
20$0
$58
$9$2
0$5
08-$
310
No
Wor
k58
9$3
0$1
7$1
3$0
$0$1
0$1
0$6
$117
$245
$0$5
8$9
$21
$536
-$28
6R
ecen
t Wor
k82
$30
$18
$7$0
$0$1
8$1
9$1
0$9
3$3
0$0
$59
$4$1
2$3
00-$
491
Dis
abili
ty27
0$9
7$5
6$2
1$0
$0$3
1$4
1$6
$136
$137
$0$8
5$1
4$3
1$6
54-$
964
No
Wor
k23
6$1
12$6
3$2
1$0
$0$2
7$3
6$5
$141
$152
$0$9
8$1
4$3
2$7
03-$
991
Rec
ent W
ork
34$0
$12
$19
$0$0
$51
$67
$9$1
01$3
9$0
$0$1
3$2
4$3
35-$
760
Sub
stan
ce A
buse
580
$169
$30
$18
$0$2
06$3
0$2
4$2
3$1
77$1
13$0
$61
$13
$28
$890
-$49
3N
o D
isab
ility
392
$97
$22
$14
$0$2
21$2
8$2
0$2
4$1
74$6
6$0
$49
$10
$21
$744
-$46
3N
o W
ork
349
$94
$21
$12
$0$2
04$2
7$1
8$2
5$1
77$6
7$0
$48
$9$1
9$7
22-$
499
Rec
ent W
ork
43$1
15$3
4$2
8$0
$355
$32
$31
$18
$146
$60
$0$5
7$1
8$3
7$9
28-$
168
Dis
abili
ty18
8$3
24$4
6$2
7$0
$174
$34
$34
$21
$183
$213
$0$8
5$1
9$4
2$1
,203
-$54
7N
o W
ork
176
$347
$47
$29
$0$1
79$3
4$3
4$2
2$1
81$2
28$0
$91
$21
$45
$1,2
57-$
473
106 Where We Sleep

App
endi
x 2
- Dat
a Ta
ble
A11
(con
t.)
GR
OU
PNumber of Persons
LA Co Dept Health Srv hospital-inpatient
LA Co Dept Health Srv outpatient clinic
LA Co Dept Health Srv emergency room
LA Co Dept Mental Health
LA Co Dept Public Health
LA Co Dept Public Social Srv Food Stamps
LA Co Dept Public Social Srv General Relief
LA Co Probation Dept
LA Co Sheriff general jail facilities/services
LA Co Sheriff medical jail facilities/services
LA Co Sheriff mental health jail facilities/srv
Private hospitals-inpatient
Private hospitals-emergency room
Emergency Medical Transportation
Total Average Monthly Cost when Not Homeless
Difference: Not Homeless minus Homeless
Rec
ent W
ork
12$0
$27
$0$1
00$3
6$3
7$1
6$2
20$0
$0$0
$0$0
$435
-$1,
604
Men
tal I
llnes
s41
2$1
65$2
9$3
0$8
0$0
$23
$28
$8$1
31$1
65$3
39$6
5$1
6$3
3$1
,111
-$1,
260
No
Dis
abili
ty19
1$2
9$1
4$1
4$3
9$0
$15
$16
$9$1
44$2
27$1
69$2
3$7
$15
$720
-$1,
214
No
Wor
k17
3$2
4$1
1$1
3$3
3$0
$13
$13
$9$1
43$2
24$1
85$1
8$6
$13
$707
-$1,
319
Rec
ent W
ork
18$7
5$3
4$2
2$8
6$0
$31
$36
$1$1
59$2
54$2
1$7
7$1
5$3
3$8
45-$
205
Dis
abili
ty22
1$2
84$4
3$4
4$1
16$0
$31
$39
$7$1
19$1
10$4
89$1
00$2
3$4
9$1
,457
-$1,
292
No
Wor
k20
9$3
00$4
2$4
6$1
22$0
$30
$39
$7$1
19$1
17$5
15$1
06$2
4$5
1$1
,517
-$1,
337
Rec
ent W
ork
12$0
$61
$19
$9$0
$52
$40
$7$1
23$0
$30
$0$1
2$2
2$3
76-$
542
Bot
h S
A a
nd M
I51
2$1
55$3
5$5
0$6
6$1
68$3
2$3
3$1
8$1
64$5
8$2
49$1
29$3
0$6
5$1
,251
-$1,
512
No
Dis
abili
ty26
0$8
6$1
9$4
0$5
0$1
93$2
5$2
2$2
0$1
60$5
3$2
13$8
2$2
4$5
0$1
,037
-$1,
370
No
Wor
k24
1$9
3$1
9$4
3$5
3$2
02$2
5$2
2$2
1$1
62$5
5$2
25$8
8$2
5$5
2$1
,085
-$1,
300
Rec
ent W
ork
19$0
$21
$13
$5$8
2$2
7$1
8$1
6$1
30$2
9$6
1$0
$12
$22
$436
-$2,
244
Dis
abili
ty25
2$2
29$5
2$6
0$8
3$1
41$3
9$4
6$1
5$1
69$6
4$2
88$1
79$3
6$8
0$1
,479
-$1,
651
No
Wor
k23
7$2
41$5
1$5
9$7
3$1
44$3
7$4
3$1
5$1
66$6
1$3
06$1
84$3
7$8
0$1
,497
-$1,
683
Rec
ent W
ork
15$3
1$6
3$7
7$2
32$8
3$6
5$8
4$1
9$2
15$1
13$0
$100
$34
$69
$1,1
85-$
1,14
746
+2,
847
$268
$49
$32
$24
$78
$30
$34
$7$6
9$8
2$1
08$1
42$1
9$4
6$9
89-$
891
No
Jail
1,40
2$2
82$5
4$2
1$3
0$2
9$2
8$3
3$1
$0$0
$0$1
25$1
2$3
1$6
45-$
844
Nei
ther
SA
or M
I95
1$2
20$3
9$1
4$0
$0$2
0$2
3$1
$0$0
$0$1
00$8
$22
$447
-$76
6N
o D
isab
ility
534
$80
$22
$5$0
$0$1
2$1
1$1
$0$0
$0$5
0$3
$10
$195
-$48
8N
oNo
Wor
k45
3$8
5$2
2$6
$0$0
$8$7
$0$0
$0$0
$54
$3$1
0$1
97-$
523
Rec
ent W
ork
81$5
2$2
3$5
$0$0
$30
$32
$1$0
$0$0
$29
$4$9
$184
-$29
4D
isab
ility
417
$409
$61
$25
$0$0
$31
$40
$1$0
$0$0
$165
$15
$39
$784
-$1,
109
DiN
o W
ork
379
$430
$61
$25
$0$0
$32
$41
$1$0
$0$0
$173
$14
$39
$815
-$1,
195
Rec
ent W
ork
38$2
08$6
1$2
4$0
$0$2
3$2
8$0
$0$0
$0$8
2$1
8$3
9$4
83-$
240
Sub
stan
ce A
buse
159
$740
$46
$28
$0$1
61$4
3$4
1$4
$0$0
$0$1
91$1
6$4
3$1
,314
$40
No
Dis
abili
ty87
$25
$24
$12
$0$1
40$3
3$2
4$6
$0$0
$0$2
2$7
$14
$307
-$74
1N
oNo
Wor
k79
$28
$22
$11
$0$1
28$3
2$2
2$6
$0$0
$0$2
5$6
$13
$292
-$78
9R
ecen
t Wor
k8
$0$4
4$2
0$0
$258
$49
$48
$0$0
$0$0
$0$1
5$2
7$4
60-$
274
Data Table A11 107
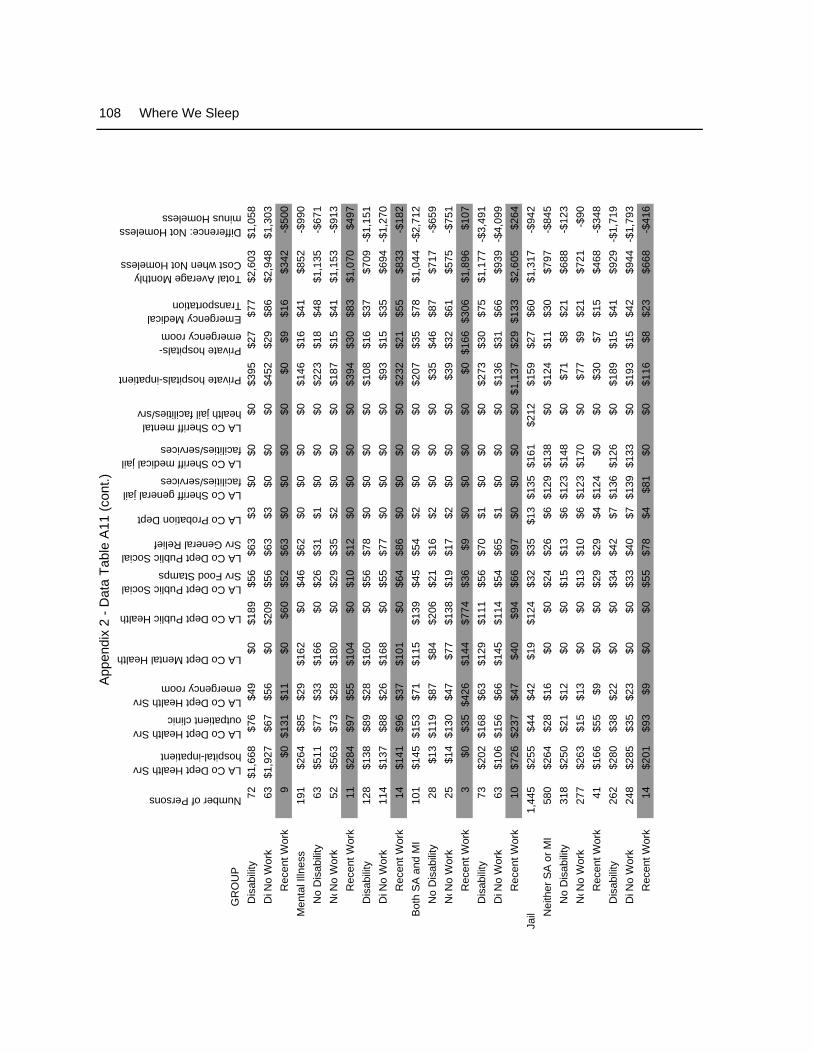
App
endi
x 2
- Dat
a Ta
ble
A11
(con
t.)
GR
OU
PNumber of Persons
LA Co Dept Health Srv hospital-inpatient
LA Co Dept Health Srv outpatient clinic
LA Co Dept Health Srv emergency room
LA Co Dept Mental Health
LA Co Dept Public Health
LA Co Dept Public Social Srv Food Stamps
LA Co Dept Public Social Srv General Relief
LA Co Probation Dept
LA Co Sheriff general jail facilities/services
LA Co Sheriff medical jail facilities/services
LA Co Sheriff mental health jail facilities/srv
Private hospitals-inpatient
Private hospitals-emergency room
Emergency Medical Transportation
Total Average Monthly Cost when Not Homeless
Difference: Not Homeless minus Homeless
Dis
abili
ty72
$1,6
68$7
6$4
9$0
$189
$56
$63
$3$0
$0$0
$395
$27
$77
$2,6
03$1
,058
DiN
o W
ork
63$1
,927
$67
$56
$0$2
09$5
6$6
3$3
$0$0
$0$4
52$2
9$8
6$2
,948
$1,3
03R
ecen
t Wor
k9
$0$1
31$1
1$0
$60
$52
$63
$0$0
$0$0
$0$9
$16
$342
-$50
0M
enta
l Illn
ess
191
$264
$85
$29
$162
$0$4
6$6
2$0
$0$0
$0$1
46$1
6$4
1$8
52-$
990
No
Dis
abili
ty63
$511
$77
$33
$166
$0$2
6$3
1$1
$0$0
$0$2
23$1
8$4
8$1
,135
-$67
1N
oNo
Wor
k52
$563
$73
$28
$180
$0$2
9$3
5$2
$0$0
$0$1
87$1
5$4
1$1
,153
-$91
3R
ecen
t Wor
k11
$284
$97
$55
$104
$0$1
0$1
2$0
$0$0
$0$3
94$3
0$8
3$1
,070
$497
Dis
abili
ty12
8$1
38$8
9$2
8$1
60$0
$56
$78
$0$0
$0$0
$108
$16
$37
$709
-$1,
151
DiN
o W
ork
114
$137
$88
$26
$168
$0$5
5$7
7$0
$0$0
$0$9
3$1
5$3
5$6
94-$
1,27
0R
ecen
t Wor
k14
$141
$96
$37
$101
$0$6
4$8
6$0
$0$0
$0$2
32$2
1$5
5$8
33-$
182
Bot
h S
A a
nd M
I10
1$1
45$1
53$7
1$1
15$1
39$4
5$5
4$2
$0$0
$0$2
07$3
5$7
8$1
,044
-$2,
712
No
Dis
abili
ty28
$13
$119
$87
$84
$206
$21
$16
$2$0
$0$0
$35
$46
$87
$717
-$65
9N
oNo
Wor
k25
$14
$130
$47
$77
$138
$19
$17
$2$0
$0$0
$39
$32
$61
$575
-$75
1R
ecen
t Wor
k3
$0$3
5$4
26$1
44$7
74$3
6$9
$0$0
$0$0
$0$1
66$3
06$1
,896
$107
Dis
abili
ty73
$202
$168
$63
$129
$111
$56
$70
$1$0
$0$0
$273
$30
$75
$1,1
77-$
3,49
1D
iNo
Wor
k63
$106
$156
$66
$145
$114
$54
$65
$1$0
$0$0
$136
$31
$66
$939
-$4,
099
Rec
ent W
ork
10$7
26$2
37$4
7$4
0$9
4$6
6$9
7$0
$0$0
$0$1
,137
$29
$133
$2,6
05$2
64Ja
il1,
445
$255
$44
$42
$19
$124
$32
$35
$13
$135
$161
$212
$159
$27
$60
$1,3
17-$
942
Nei
ther
SA
or M
I58
0$2
64$2
8$1
6$0
$0$2
4$2
6$6
$129
$138
$0$1
24$1
1$3
0$7
97-$
845
No
Dis
abili
ty31
8$2
50$2
1$1
2$0
$0$1
5$1
3$6
$123
$148
$0$7
1$8
$21
$688
-$12
3N
oNo
Wor
k27
7$2
63$1
5$1
3$0
$0$1
3$1
0$6
$123
$170
$0$7
7$9
$21
$721
-$90
Rec
ent W
ork
41$1
66$5
5$9
$0$0
$29
$29
$4$1
24$0
$0$3
0$7
$15
$468
-$34
8D
isab
ility
262
$280
$38
$22
$0$0
$34
$42
$7$1
36$1
26$0
$189
$15
$41
$929
-$1,
719
DiN
o W
ork
248
$285
$35
$23
$0$0
$33
$40
$7$1
39$1
33$0
$193
$15
$42
$944
-$1,
793
Rec
ent W
ork
14$2
01$9
3$9
$0$0
$55
$78
$4$8
1$0
$0$1
16$8
$23
$668
-$41
6
108 Where We Sleep
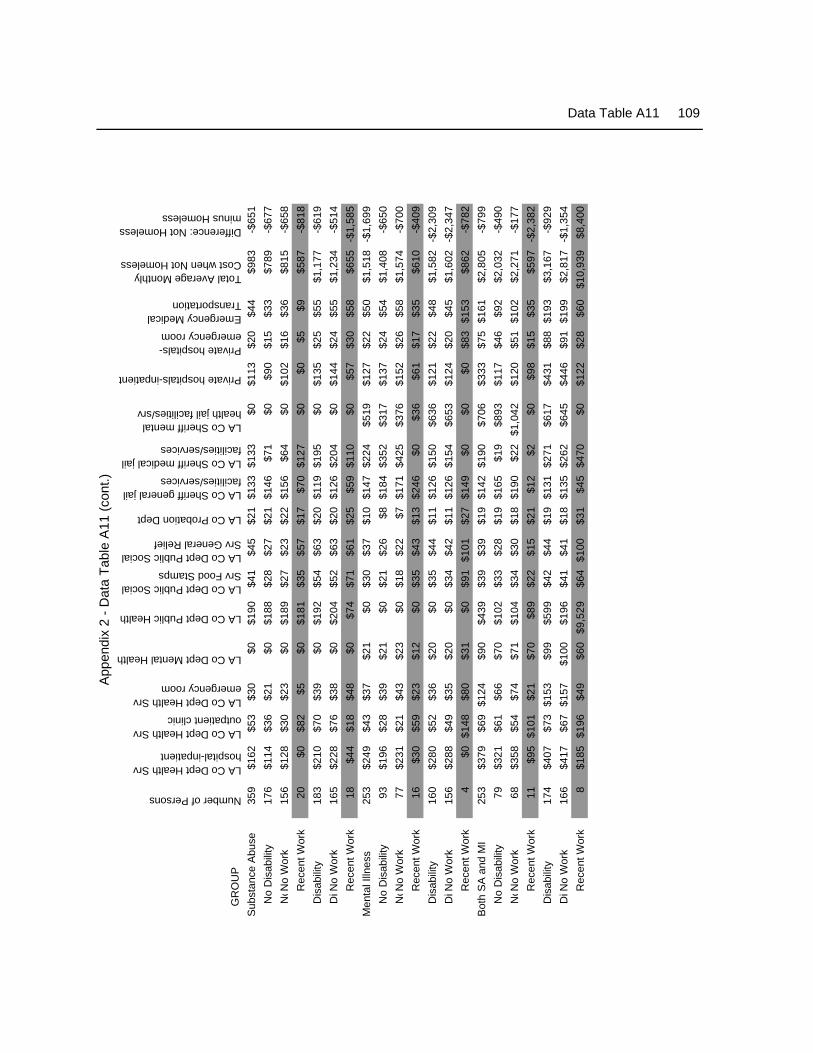
App
endi
x 2
- Dat
a Ta
ble
A11
(con
t.)
GR
OU
PNumber of Persons
LA Co Dept Health Srv hospital-inpatient
LA Co Dept Health Srv outpatient clinic
LA Co Dept Health Srv emergency room
LA Co Dept Mental Health
LA Co Dept Public Health
LA Co Dept Public Social Srv Food Stamps
LA Co Dept Public Social Srv General Relief
LA Co Probation Dept
LA Co Sheriff general jail facilities/services
LA Co Sheriff medical jail facilities/services
LA Co Sheriff mental health jail facilities/srv
Private hospitals-inpatient
Private hospitals-emergency room
Emergency Medical Transportation
Total Average Monthly Cost when Not Homeless
Difference: Not Homeless minus Homeless
Sub
stan
ce A
buse
359
$162
$53
$30
$0$1
90$4
1$4
5$2
1$1
33$1
33$0
$113
$20
$44
$983
-$65
1N
o D
isab
ility
176
$114
$36
$21
$0$1
88$2
8$2
7$2
1$1
46$7
1$0
$90
$15
$33
$789
-$67
7N
oNo
Wor
k15
6$1
28$3
0$2
3$0
$189
$27
$23
$22
$156
$64
$0$1
02$1
6$3
6$8
15-$
658
Rec
ent W
ork
20$0
$82
$5$0
$181
$35
$57
$17
$70
$127
$0$0
$5$9
$587
-$81
8D
isab
ility
183
$210
$70
$39
$0$1
92$5
4$6
3$2
0$1
19$1
95$0
$135
$25
$55
$1,1
77-$
619
DiN
o W
ork
165
$228
$76
$38
$0$2
04$5
2$6
3$2
0$1
26$2
04$0
$144
$24
$55
$1,2
34-$
514
Rec
ent W
ork
18$4
4$1
8$4
8$0
$74
$71
$61
$25
$59
$110
$0$5
7$3
0$5
8$6
55-$
1,58
5M
enta
l Illn
ess
253
$249
$43
$37
$21
$0$3
0$3
7$1
0$1
47$2
24$5
19$1
27$2
2$5
0$1
,518
-$1,
699
No
Dis
abili
ty93
$196
$28
$39
$21
$0$2
1$2
6$8
$184
$352
$317
$137
$24
$54
$1,4
08-$
650
NoN
o W
ork
77$2
31$2
1$4
3$2
3$0
$18
$22
$7$1
71$4
25$3
76$1
52$2
6$5
8$1
,574
-$70
0R
ecen
t Wor
k16
$30
$59
$23
$12
$0$3
5$4
3$1
3$2
46$0
$36
$61
$17
$35
$610
-$40
9D
isab
ility
160
$280
$52
$36
$20
$0$3
5$4
4$1
1$1
26$1
50$6
36$1
21$2
2$4
8$1
,582
-$2,
309
DiN
o W
ork
156
$288
$49
$35
$20
$0$3
4$4
2$1
1$1
26$1
54$6
53$1
24$2
0$4
5$1
,602
-$2,
347
Rec
ent W
ork
4$0
$148
$80
$31
$0$9
1$1
01$2
7$1
49$0
$0$0
$83
$153
$862
-$78
2B
oth
SA
and
MI
253
$379
$69
$124
$90
$439
$39
$39
$19
$142
$190
$706
$333
$75
$161
$2,8
05-$
799
No
Dis
abili
ty79
$321
$61
$66
$70
$102
$33
$28
$19
$165
$19
$893
$117
$46
$92
$2,0
32-$
490
NoN
o W
ork
68$3
58$5
4$7
4$7
1$1
04$3
4$3
0$1
8$1
90$2
2$1
,042
$120
$51
$102
$2,2
71-$
177
Rec
ent W
ork
11$9
5$1
01$2
1$7
0$8
9$2
2$1
5$2
1$1
2$2
$0$9
8$1
5$3
5$5
97-$
2,38
2D
isab
ility
174
$407
$73
$153
$99
$599
$42
$44
$19
$131
$271
$617
$431
$88
$193
$3,1
67-$
929
DiN
o W
ork
166
$417
$67
$157
$100
$196
$41
$41
$18
$135
$262
$645
$446
$91
$199
$2,8
17-$
1,35
4R
ecen
t Wor
k8
$185
$196
$49
$60
$9,5
29$6
4$1
00$3
1$4
5$4
70$0
$122
$28
$60
$10,
939
$8,4
00
Data Table A11 109

110 Where We Sleep

Appendix 3
Protection of Human Subjects
The research design and protocol for protection of human subjects for this project was reviewed and approved by the Economic Roundtable Institutional Review Board (IRB) as a level 3 project, with more than minimal risk for human subjects. Documentation for the IRB review process is available at: http://www.economicrt.org/irb/. However, in the course of the project the risk level was reduced by producing all linked records with information about services from county departments, including health services, in de-identified form without any information that can be used to identify specific individuals. The project team covered by this research protocol includes Economic Roundtable staff and consultants, the Los Angeles County Chief Executive Office (a subcontractor for this project), participating County departments, and Skid Row Collaborative member agencies. The Los Angeles County Department of County Counsel developed an informed consent document for requesting approval from residents of the Skid Row Housing Trust for access to their records from the county departments of Health, Public Health, Mental Health, Probation, Public Social Services, and Sheriff’s Custody Division, as well as from the Los Angeles Homeless Services Authority and the Skid Row Collaborative, which included the Skid Row Housing Trust, Lamp Community, and JWCH. Residents of the Skid Row Housing Trust (SRHT) with 18 or more months of housing were invited to participate in meetings where refreshments were provided and the study was explained. Seventeen meetings were held with residents at 14 different SRHT residential buildings. Those participating in these discussions received a $10 gift card for a restaurant, grocery store, bookstore, Starbucks, or telephone calling card as compensation for the time spent in the meeting, whether or not they agree to sign the informed consent document. The eleven page informed consent document was carefully reviewed, page-by-page, to inform prospective project participants of the objectives of the research, the procedures to be followed, the risks and potential benefits, the types of data that would be obtained from each public agency, and enable them to freely consent or decline to participate. The meetings were then opened for questions and discussion. Individuals who agreed to sign the informed consent document were also requested to complete a one page questionnaire that provided additional information about them. Of the 252 residents participating in these meetings, 246 decided to sign the informed consent document. Following this strong response from residents, SRHT concurred with the research team’s recommendation to expand the study population by providing information about additional residents in de-identified format. This decision complemented parallel discussions with the County Chief Executive Office, Service Integration Branch (CEO-SIB) in which it was determined that the county data linkage process would encounter fewer obstacles if the data linkage process was conducted on a de-identified basis. CEO-SIB used probabilistic record matching software to create de-identified linked records for the study group from SRHT supportive housing and also a large comparison group of General Relief recipients. Records in both data sets were de-identified and contained linked records from all of the agencies providing data for this project.

112 Where We Sleep
Access to data from this project is limited only to those with a need to know. The records of housed individuals and the comparison group are in de-identified format. Only authorized researchers are allowed access to this data and only for approved research activities. All members of the research team have been instructed regarding the constraints for handling and disclosing data and the sanctions against unauthorized use or disclosures found in the law as well as Economic Roundtable policies. All members of the research team have completed HIPPA training and signed confidentiality agreements.
Computers that store project data are password protected by alpha-numeric passwords that are unique to each computer and known only by the assigned, authorized computer user and the data manager. Computer media used to store confidential data (diskette, CD-ROM, tape back-up) are kept secure in a locked facility with 24-hour security. In publishing information, no individual whose identity was obtained through confidential sources has been identified. Geographic identities have been specified only in areas that include five or more individuals in order to protect confidentiality. Cells with fifteen or fewer subjects have been analyzed to determine if there is any risk of identifying subjects, and if any risk was identified the cells have been rolled up with other cells to a more aggregate level. All work products containing any material derived from confidential data have been reviewed to ensure that they comply fully with these policies as well as the terms of the applicable confidentiality agreements prior to distribution or public release.
End Notes 1 Los Angeles’ Skid Row Collaborative was a grantee of the federal Chronic Homeless Initiative. In 2003, Los Angeles was one of eleven jurisdictions awarded grant funding for a new federal Initiative. Coordinated by the U.S. Interagency Council on the Homeless, the Collaborative Initiative to Help End Chronic Homelessness (CHI), was funded by the Department of Housing and Urban Development (HUD), the Department of Health and Human Services (HHS), Substance Abuse and Mental Health Administration, and the Department of Veterans Affairs (VA). The Skid Row Collaborative, the Los Angeles CHI grantee, was a partnership of 14 public and private organizations serving homeless individuals in downtown Los Angeles. Led by the Skid Row Housing Trust and Lamp Community, the Skid Row Collaborative met its goal of housing 62 individuals who were chronically homeless on Skid Row. The Collaborative provided mental health and substance abuse services, primary healthcare and veterans’ services to promote self-sufficiency and residential stability through permanent supportive housing. 2 General Relief (GR) is a Los Angeles County program that helps people who have almost no money. GR is a very limited program with many requirements. It is administered by the Los Angeles County Department of Public Social Services (DPSS). The basic monthly cash aid is $221 per month. Emergency housing vouchers for vendor hotels are available for applicants of General Relief who declare that they are homeless and appear to be eligible for GR benefits. The vouchers can be used at vendor hotels that have agreements with the county, including Weingart Center, SRO’s Russ Hotel, and other vendor motels in the county. The vouchers typically are issued for part of a month and had an average value of $260 a month. Recipients of vouchers have $4.53 deducted from their $221 monthly General Relief benefits for every day that they received a voucher. 3 Culhane, D.P., Metraux, S. and Hadley, TR. (2002) Public service reductions associated with the placement of homeless people with severe mental illness in supportive housing. Housing Policy Debate 13(1) pp 107-163. 4 Culhane, D.P. (2008) The costs of homelessness: A Perspective from the United States, European Journal of Homelessness, Volume 2, December 2008 pp 97-114. Byrnes, T and Culhane, D.P. Limits and opportunities to cost analyses of homelessness, Encyclopedia of Homelessness (forthcoming). 5 Byrnes, T and Culhane, D.P. Limits and opportunities to cost analyses of homelessness, Encyclopedia of Homelessness (forthcoming). 6 Culhane, D.P., Parker, W.D., Poppe, et al (2007) Accountability, cost-effectiveness, and program performance: progress since 1998. U.S. Interagency Council on Homelessness, 2007 National Symposium on Homelessness Research. 7 Culhane, D.P. (2008) The costs of homelessness: A Perspective from the United States, European Journal of Homelessness, Volume 2, December 2008 p. 105. 8 Ibid p. 104. 9 This study is indebted to Daniel Chandler for recommending that a comparison group be created using propensity scores. For additional information about the process of identifying matched pairs of individuals based on propensity scores, see Appendix 1, Propensity Score Matching, by Gerald Sumner, project statistician. 10 Burt, Martha; Aron, L.; and Lee, E. (2001) Helping America’s Homeless: Emergency Shelter or Affordable Housing? Washington, D.C., The Urban Institute Press, p. 2.
114 Where We Sleep
11 Early investigations of the longitudinal homeless population include Culhane, Dennis P.; and Randall Kuhn (1995), Patterns and Determinants of Shelter Utilization Among Single Adults in New York and Philadelphia: A Longitudinal Analysis of Homelessness, Annual Meeting of the Eastern Sociological Association, Philadelphia, PA. 12 For a recent estimate of the fluctuation in the point-in-time homeless population in relation to fluctuations in poverty, see Economic Roundtable, Ebbing Tides in the Golden State (2009), pp. 58-59, www.economicrt.org. 13 The 2005, 2007 and 2009 homeless counts conducted by the Los Angeles Homeless Services Authority showed 12, 17 and 37 percent, respectively, of homeless persons to be living in sheltered settings http://www.lahsa.org/homelessness_data/reports.asp. This is much higher than other major cities; for example, Philadelphia and New York shelter more than 90 percent of their homeless populations, and San Francisco shelters almost 60 percent. Wolch, J., Warshawsky, D., Blasi, G., et al, 2008 Report Card on Homelessness in Los Angeles, Inter-University Consortium Against Homelessness, http://www.bringlahome.org/docs/HomelessReportCard_v7.pdf 14 All population estimates are for all of Los Angeles County, including cities that are not part of the Los Angeles Homeless Service Authority’s (LAHSA) Continuum of Care. Data from the 2005 and 2007 LAHSA counts has been extrapolated to include the entire county. Data for all of Los Angeles County in 2009 was provided by LAHSA. Data for the estimates is taken from:
Economic Roundtable Report prepared for Bring LA Home (2004), Homeless in Los Angeles: Final Research http://www.economicrt.org/publications.html
Los Angeles Homeless Services Authority (2005), 2005 Greater Los Angeles Homeless Count http://www.lahsa.org/homelessness_data/reports.asp
Los Angeles Homeless Services Authority (2007), 2007 Greater Los Angeles Homeless Count http://www.lahsa.org/homelessness_data/reports.asp
Los Angeles Homeless Services Authority (2009), Briefing paper hand distributed October 27, 2009. 15 Annual poverty populations are produced by the Economic Roundtable based on Current Population Survey data for Los Angeles County. The Current Population Survey obtains information about income in the preceding year; the poverty population data shown in Table 1 aligns data with the reference year of the survey. For further discussion of poverty projections see Economic Roundtable (2009), Ebbing Tides in the Golden State, pp 51-54, www.economicrt.org. 16 Economic Roundtable(2004), Homeless in Los Angeles: Final Research Report, pp 69-75, http://www.economicrt.org/publications.html 17 The 2002 estimated counted individuals as chronically homeless only if they had been homeless for 12 or more months. HUD’s definition includes individuals with a disabling condition who have been continually homeless for one year or more, or have experienced four or more episodes of homelessness within the past 3 years. 18 Los Angeles Homeless Services Authority (2005), 2005 Greater Los Angeles Homeless Count, p. 95, http://www.lahsa.org/homelessness_data/reports.asp 19 Los Angeles Homeless Services Authority (2007), 2007 Greater Los Angeles Homeless Count, pp 131-137, http://www.lahsa.org/homelessness_data/reports.asp 20 Information about the methodology used in the 2007 count is from the Los Angeles Homeless Services Authority, 2007 Greater Los Angeles Homeless Count, p. 36. The methodology used is from Burt, M. R. and Wilkins, C. (2005), Estimating the Need: Projecting from Point-in-Time to Annual Estimates of the Number of Homeless People in a Community and Using this Information to Plan for Permanent Supportive Housing, Corporation for Supportive Housing, pp. 10-11, http://www.csh.org/index.cfm/?fuseaction=Page.viewPage&pageID=3518.
End Notes 115
21 U.S. Department of Housing and Urban Development, Office of Community Planning and Development, reporting on 2005 data (2007) The Annual Homeless Assessment Report to Congress. Washington, DC. 22 The report on the 2009 count, 2009 Greater Los Angeles Homeless Count Report, http://www.lahsa.org/, does not explain how the annual estimate was produced but given the low number it appears likely that it was produced using the same national formula that was used in 2007. 23 Cost data from some county departments such as the Sheriff extends back to the 1990s, but complete cost data for all departments is limited to 22-month window for General Relief recipients and the 42-month window for Skid Row Housing Trust residents. 24 The complex task of linking client records with records in the six county departments and the Los Angeles Homeless Services Authority was carried out by the Service Integration Branch of Los Angeles County’s Chief Executive Office. 25 Ten hospitals were identified within a 3-mile geographic radius of downtown Los Angeles. The ratio of visits by downtown Los Angeles homeless residents to private hospitals as compared to county hospitals was determined using hospital discharge records from the California Office of Statewide Health Planning and Development (OSHPD). OSHPD records were extracted for inpatient hospitalizations of homeless patients from 2005 through 2007. The ratio of discharges from private hospitals to discharges from county hospitals was found to be 0.6195 to 1. The average cost per discharge of homeless residents from private hospitals was found to be $31,469 in 2008 dollars (the comparable cost for county discharges was $35,284). These hospitalization and cost ratios were applied to county Department of Health Services inpatient hospital discharges of homeless residents in order to estimate the number and cost of homeless discharges for county hospitals. Since only 4.6 percent of the homeless General Relief recipients in this study were hospitalized in a county Department of Health Services hospital during a month when they were homeless within the cost window for this study (and 3.2 percent in a month when they were not homeless), these estimates of private hospitalization costs could only be applied to groups within the study population, not to individuals. Hospitalizations are semi-random events that occur to a small minority of individuals, but they are the most significant factor overall factor in the public cost of homelessness. Because most people aren't hospitalized, the costs for private hospitalizations could not be estimated on an individual basis, but they could be estimated on a group basis - based on the frequency with which members of a group are inpatients in county hospitals. Unless otherwise noted, all cost and cost savings estimates in this study are based on group data that includes estimates of private hospital inpatient and emergency room costs and emergency medical transportation costs. 26 Individuals were classified as homeless in any month in which one or more of the following four conditions were met: a) their mailing address was an office of the Los Angeles County Department of Public Social Services or a homeless shelter, b) they received a General Relief emergency housing voucher, c) they received services funded by the Los Angeles Homeless Services Authority, or d) they began a jail stint immediately following a month in which they were homeless. 27 The Adult Linkages Project (ALP) has created a data integration system that links service records across Los Angeles County departments using procedures that comply with confidentiality laws. Focusing on indigent adults participating in Los Angeles County’s General Relief Program, the ALP links their administrative records across eight departments in order to provide each of these agencies with information on client needs, service gaps, service costs, and utilization patterns. The overall objective of the ALP is to provide policymakers with empirical information that can support the enhancement of existing programs for indigent adults and advance social policy making in Los Angeles County. The ALP uses an anonymous record linkage method to integrate data across departments. The ALP record linkage method addresses the legal obstacles involved in sharing confidential

116 Where We Sleep
information by de-identifying personal information provided in administrative data. Random project IDs are generated for each participant. These markers do not identify any client personally. 28 For every month in the 22-month cost window, each ALP record was coded for whether the person was homeless in that month. The criteria for coding a record as homelessness in a particular month were: 1) a CEO-SIB flag indicating that the address for a person’s GR check that month was a DPSS office or homeless shelter, 2) receipt of a General Relief emergency housing voucher in that month, 3) receipt of services funded by the Los Angeles Homeless Services Authoity in that month, or 4) a person doing a stint in jail immediately following a month in which one of the first three flags indicated they were homeless. Where events covered only part of a month, they were rounded up or down to full months, depending on whether the event lasted more or less than half a month. Two totals of the costs from each department were created for each record, one total for months that they were homeless and the other total for months when they were not coded as homeless. The homeless total was divided by the number of months the person was homeless, and the non-homeless total by the number of months they were not coded as homeless. Thus, the 309 people who were coded as homeless all 22 months did not have any non-homeless costs shown; all of the other records have one average monthly cost for months when they were homeless and a second average monthly cost for months when they were not coded as homeless. 29 On November 20, 2007, the Los Angeles County Board of Supervisors approved an agreement with Common Ground of New York to provide training and technical assistance to the County to initiate and implement a demonstration program known as "Project 50" to provide housing and supportive services to the 50 most vulnerable single adults living in the historic district of downtown Los Angeles known as Skid Row. At the time of this study, client records were available for 44 participants. Comparison group matches based on propensity scores were made for 43 participants; one participant was an outlier and there was not a comparable match. Comparison group data is based on the 43 matched pairs with comparable propensity scores. Data for Project 50 participants is for months when they were homeless, before entering Project 50. Data for the comparison group is from comparable individuals who are housed by the Skid Row Housing Trust. On December 7, 2007, from 10:00 p.m. until 2:00 a.m. County employees from the Departments of Health Services (DHS), Mental Health (DMH), Public Health (DPH), and Public Social Services (DPSS), the CEO, the Board of Supervisors and staff from LAHSA, the VA, and others conducted the count of the homeless persons living on the streets of Skid Row. Beginning on December 10, 2007, the same volunteers worked for nine (9) consecutive days, between 4:00 a.m. and 6:00 a.m. to develop a registry of all the Skid Row homeless street dwellers that were willing to be surveyed. Through that process, the group counted 471 people and successfully interviewed 350 of them. The 50 most vulnerable were identified by Common Ground through the application of a vulnerability index to the survey data. These individuals, or when they could not be found, others that followed them on the list, were offered permanent supportive housing provided by the Skid Row Housing Trust. 30 There were 43 participants in the Skid Row Collaborative who were in housing for at least 12 months during the 42-month window in which cost data is available for residents of the Skid Row Housing Trust. Comparison group data is based on the 43 matched pairs with comparable propensity scores. Data for Skid Row Collaborative participants is for months when they were receiving housing and services provided by this project. Data for the comparison group is from comparable General Relief recipients during months when they were homeless. 31 For additional discussion of propensity scores see: Dehejia, R.H. and Wahba, S.(2002), "Propensity Score Matching Methods for Non-Experimental Causal Studies", Review of Economics and Statistics, 84(1), 151-161; amd Caliendo, M. and Kopeinig, S. (2006), "Some Practical Guidance for the Implementation of Propensity Score Matching, Journal of Economic Surveys.
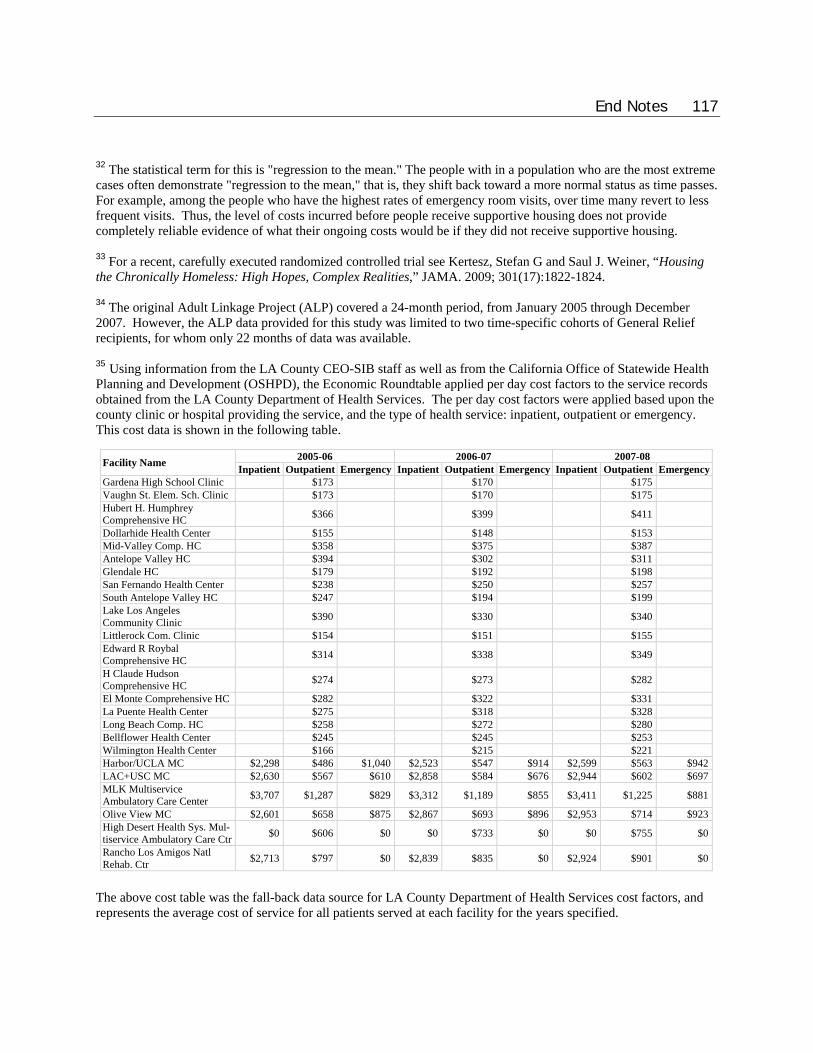
End Notes 117
32 The statistical term for this is "regression to the mean." The people with in a population who are the most extreme cases often demonstrate "regression to the mean," that is, they shift back toward a more normal status as time passes. For example, among the people who have the highest rates of emergency room visits, over time many revert to less frequent visits. Thus, the level of costs incurred before people receive supportive housing does not provide completely reliable evidence of what their ongoing costs would be if they did not receive supportive housing. 33 For a recent, carefully executed randomized controlled trial see Kertesz, Stefan G and Saul J. Weiner, “Housing the Chronically Homeless: High Hopes, Complex Realities,” JAMA. 2009; 301(17):1822-1824. 34 The original Adult Linkage Project (ALP) covered a 24-month period, from January 2005 through December 2007. However, the ALP data provided for this study was limited to two time-specific cohorts of General Relief recipients, for whom only 22 months of data was available. 35 Using information from the LA County CEO-SIB staff as well as from the California Office of Statewide Health Planning and Development (OSHPD), the Economic Roundtable applied per day cost factors to the service records obtained from the LA County Department of Health Services. The per day cost factors were applied based upon the county clinic or hospital providing the service, and the type of health service: inpatient, outpatient or emergency. This cost data is shown in the following table.
2005-06 2006-07 2007-08 Facility Name Inpatient Outpatient Emergency Inpatient Outpatient Emergency Inpatient Outpatient EmergencyGardena High School Clinic $173 $170 $175 Vaughn St. Elem. Sch. Clinic $173 $170 $175 Hubert H. Humphrey Comprehensive HC $366 $399 $411
Dollarhide Health Center $155 $148 $153 Mid-Valley Comp. HC $358 $375 $387 Antelope Valley HC $394 $302 $311 Glendale HC $179 $192 $198 San Fernando Health Center $238 $250 $257 South Antelope Valley HC $247 $194 $199 Lake Los Angeles Community Clinic $390 $330 $340
Littlerock Com. Clinic $154 $151 $155 Edward R Roybal Comprehensive HC $314 $338 $349
H Claude Hudson Comprehensive HC $274 $273 $282
El Monte Comprehensive HC $282 $322 $331 La Puente Health Center $275 $318 $328 Long Beach Comp. HC $258 $272 $280 Bellflower Health Center $245 $245 $253 Wilmington Health Center $166 $215 $221 Harbor/UCLA MC $2,298 $486 $1,040 $2,523 $547 $914 $2,599 $563 $942LAC+USC MC $2,630 $567 $610 $2,858 $584 $676 $2,944 $602 $697MLK Multiservice Ambulatory Care Center $3,707 $1,287 $829 $3,312 $1,189 $855 $3,411 $1,225 $881
Olive View MC $2,601 $658 $875 $2,867 $693 $896 $2,953 $714 $923High Desert Health Sys. Mul-tiservice Ambulatory Care Ctr $0 $606 $0 $0 $733 $0 $0 $755 $0
Rancho Los Amigos Natl Rehab. Ctr $2,713 $797 $0 $2,839 $835 $0 $2,924 $901 $0
The above cost table was the fall-back data source for LA County Department of Health Services cost factors, and represents the average cost of service for all patients served at each facility for the years specified.

118 Where We Sleep
For DHS inpatient service records containing either an ICD-9 procedure code or diagnosis code, the Economic Roundtable superseded these cost factors with cost data from another data source: Patient Discharge Data from OSHPD. Inpatient health records from OSHPD were compiled spanning the years 2005-2007 where the patient was determined to be homeless. (OSHPD’s Patient Discharge Data contains a variable for the patient’s 5-digit ZIP Code of residence, PAT_ZIP; homeless patients are assigned a zip code of ZZZZZ.) This homeless-specific data set for Los Angeles County contained over 17,000 inpatient discharge records with ICD-9 procedure and diagnosis codes. The charges recorded in this data set covers all services rendered during the length of stay for patient care at the facility, based on the hospital's full established rates (before contractual adjustments). The Economic Roundtable then created a per day cost factor from this OSHPD data, and calculated average daily costs for all ICD-9 procedure and diagnosis codes. For procedures where there was not cost data from OSHPD records, the Economic Roundtable used the information from Los Angeles County CEO-SIB staff in the table above. 36 The ratio of visits by downtown Los Angeles homeless residents to private hospitals as compared to county hospitals within a 3-mile radius of downtown Los Angeles was determined using hospital discharge records from the California Office of Statewide Health Planning and Development (OSHPD). The ten hospitals were California Hospital Medical Center - Los Angeles, Pacific Alliance Medical Center, Good Samaritan Hospital-Los Angeles, Promise Hospital of East Los Angeles-East L.A. Campus, Kaiser Foundation Hospital - Mental Health Center, White Memorial Medical Center, USC Kenneth Norris, Jr. Cancer Hospital, Los Angeles County-USC Medical Center, USC University Hospital – Norfolk, USC University Hospital – San Pablo Street. OSHPD records were extracted for inpatient hospitalizations of homeless patients from 2005 through 2007. The ratio of discharges from private hospitals to discharges from county hospitals was found to be 0.6195 to 1. The average cost per discharge of homeless residents from private hospitals was found to be $31,469 in 2008 dollars (the comparable cost for county discharges was $35,284). These hospitalization and cost ratios were applied to county Department of Health Services inpatient hospital discharges of homeless residents in order to estimate the number and cost of homeless discharges for county hospitals. Since only 4.6 percent of the homeless General Relief recipients in this study were hospitalized in a county Department of Health Services hospital during a month when they were homeless within the cost window for this study (and 3.2 percent in a month when they were not homeless), these estimates of private hospitalization costs could not be applied to individuals, but only to groups within the study population - based on the frequency with which members of the group are inpatients in county hospitals. Unless otherwise noted, all cost and cost savings estimates in this study are based on group data that includes estimates of private hospital inpatient and emergency room costs and emergency medical transportation costs. 37 Homeless visits to private hospital emergency rooms compared to county hospital emergency rooms were assumed to be the same ratio as homeless admissions to private hospitals compared to county hospitals: 0.6195. The cost ratio for private emergency visits compared to county emergency room visits was assumed to be proportionate to the cost differential for homeless discharges from private hospitals compared to county hospitals, which is 0.8919 to 1. Since only 17.3 percent of the homeless General Relief recipients in this study visited a county Department of Health Services hospital emergency room during a month when they were homeless within the cost window for this study (and 11.6 percent in a month when they were not homeless), these estimates of private emergency room visits could only be applied to groups within the study population, not to individuals. 38 Cost estimates for emergency medical transportation assumed that there was one one-way trip for each hospital admission or emergency room visit. No estimates were made of paramedic services provided to homeless individuals who were not taken to hospitals. The estimated cost was $850 per transport. This figure is based on Daniel Chandler’s interview with Captain Douglas of the LA City Fire Department, which provides paramedic services in the Skid Row Area. 39 The cost factors for the county Department of Public Health were: $8.50 per day for Outpatient Services, $63 per day for Residential Services, $360 per day for Detoxification Services, and $8.50 per day for other services.

End Notes 119
40 Costs for Food Stamp and General Relief (but not emergency housing voucher) benefits provided by the Department of Public Social Services include administrative costs in addition to the amount of benefits provided to recipients. Administrative cost factors were taken from the report, Spending on County Human Services Programs in California: An Evaluation of Economic Impacts, Jon Haveman, Beacon Economics, 2009, p. 3. The combined statewide costs for program administration and direct benefits to recipients provided in this report show the overall cost of the Food Stamp program to be 129 percent of the direct benefits provided to recipients. 41 The ratio of total program costs to direct benefits for recipients is assumed to be the same for General Relief as for CalWORKs. Based on the Beacon Hill report (preceding endnote), the combined statewide costs for program administration and direct benefits to recipients is 168 percent of the direct benefits provided to recipients. 42 Only the actual voucher amount is included in cost estimates for General Relief emergency housing vouchers. The average voucher amount is $266 per month. 43 Only a partial inventory of services funded by the Los Angeles Homeless Services Authority (LAHSA) is included in this study. This inventory includes only services rendered by agencies that participate in the Consortium of Care’s Homeless Management Information System (HMIS). The cost factors for these services include only the share funded by LAHSA, leaving out matching operational and capital costs. The cost factors that were used are as follows:
Emergency Shelter (1) Winter Shelter (1) Transitional Housing (2) Permanent Housing (2)Bed Night w/o meals 15.85 19.46 Breakfast 1.20 1.62 Dinner 1.80 2.42 Total Bed Night Cost 18.85 23.50 32.88 32.88 Case Management (3) 24.88 24.88 24.88 24.88 Vouchers (1) 63.64 63.64 N/A N/A
(1) Calculated based on the average costs per day of LAHSA's 2008-2009 service providers (2) Calculated based upon an average annual participant cost of $12,000 (3) Represents the estimated for case management services (1 hour average session) 44 The cost factors for individuals on probation were $2.63 per day in fiscal year 2007-2008, and $2.76 per day in fiscal year 2008-2009. 45 Sheriff’s Department booking costs for fiscal years 2005-2006, 2006-2007, and 2007-2008 were, respectively $427, $553 and $629. Costs for incarceration in general jail facilities for these three fiscal years were, respectively, $64, $83, and $92 per day. 46 Sheriff’s Department costs for incarceration in medical or mental health jail facilities were $840 per day in fiscal year 2005-2006, and $1,093 per day in fiscal years 2006-2007 and 2007-2008. 47 Some uninsured visits by General Relief recipients to non-county outpatient clinics that were paid for by the Los Angeles County Department of Health Services (DHS) are included in the study data and shown as costs for DHS outpatient clinics. The following 11 clinics provided 16 percent of the DHS clinic visits shown in this study: Antelope Valley Health Center, Bellflower Health Center, Dollarhide Health Center, Glendale Health Center, La Puente Health Center, Lake Los Angeles Community Clinic, Littlerock Community Clinic, Mid-Valley Comprehensive Health Center, San Fernando Health Center, South Antelope Valley Health Center, and Wilmington Health Center. 48 The only cash aid available to the overall population of destitute, homeless single adults is General Relief. Since this population needs money urgently, it seems reasonable to assume that the population receiving this assistance is generally representative of the population of homeless single adults who are U.S. citizens or legal immigrants.

120 Where We Sleep
If individuals have a documented chronic disability the may be able to qualify for Supplemental Security Income (SSI) or Social Security Disability Insurance (SSDI). However, among the 1,007 residents in support housing that are part of this study, all of whom have been certified as being disabled by an independent third party, General Relief is still the primary source of income. It is undoubtedly even more the case that General Relief is the primary form of aid for the overall population of homeless single adults, most of whom have not been certified as disabled. A breakout of the sources of income for individuals in supportive housing who have been certified as disabled is shown below:
Income Source Percent of Supportive Housing Residents with this Source of Income Average Monthly Amount General Relief 52% $229 SSI 28% $742 Social Security 6% $677 Wages from Job 4% $981 SSDI 4% $734 Veteran Disability 2% $980 Unemployment Insurance 1% $664 Veteran Pension 1% $726 49 Pastore, C. and Gaber, P., Western Center on Law and Poverty (2001), CalWORKS: A Comprehensive Guide to Welfare and Related Medi-Cal Issues for California Families, p. IV-27. 50 Supporting data for the profile of homeless General Relief recipients, and where available for the total population of Los Angeles County, is shown below.
Attribute Los Angeles County Homeless
General Relief Recipients Total Los Angeles County
Population 18-64 Years of Age English Speaker 98% 82% No work in past 3 years for those 18-65 years of age 90% 16% Male 71% 50% Born in California 65% 36% Jail history 59% African American 52% 9% 30-45 years of age 41% 38% Disability 37% 10% 46-65 years of age 31% 35% Substance abuse problem 30% Female 29% 50% Mental illness 29% Born in state other than California 28% 16% 18-29 years of age 28% 27% Veteran 27% 4% Probation record 26% Latino 24% 45% White 20% 30% Incarceration history in jail medical facility 15% Incarceration history in jail mental health facility 12% Worked in past 3 years for those 18-65 years of age 10% 84% Born in Mexico or Central America 3% 28% Not Born in U.S., Mexico, or Central America 3% 20% Spanish speaker 2% 15% Asian/Pacific Islander 1% 14% HIV/AIDS 1% 0.4% 51 Prevalence data about the number of people 20 years of age and older in Los Angeles County living with AIDS in 2007 is from Los Angeles County Department of Public Health (2009), HIV/AIDS Semi-Annual Surveillance Summary, http://publichealth.lacounty.gov/wwwfiles/ph/hae/hiv/January2009SemiannualSurveillanceSummary.pdf
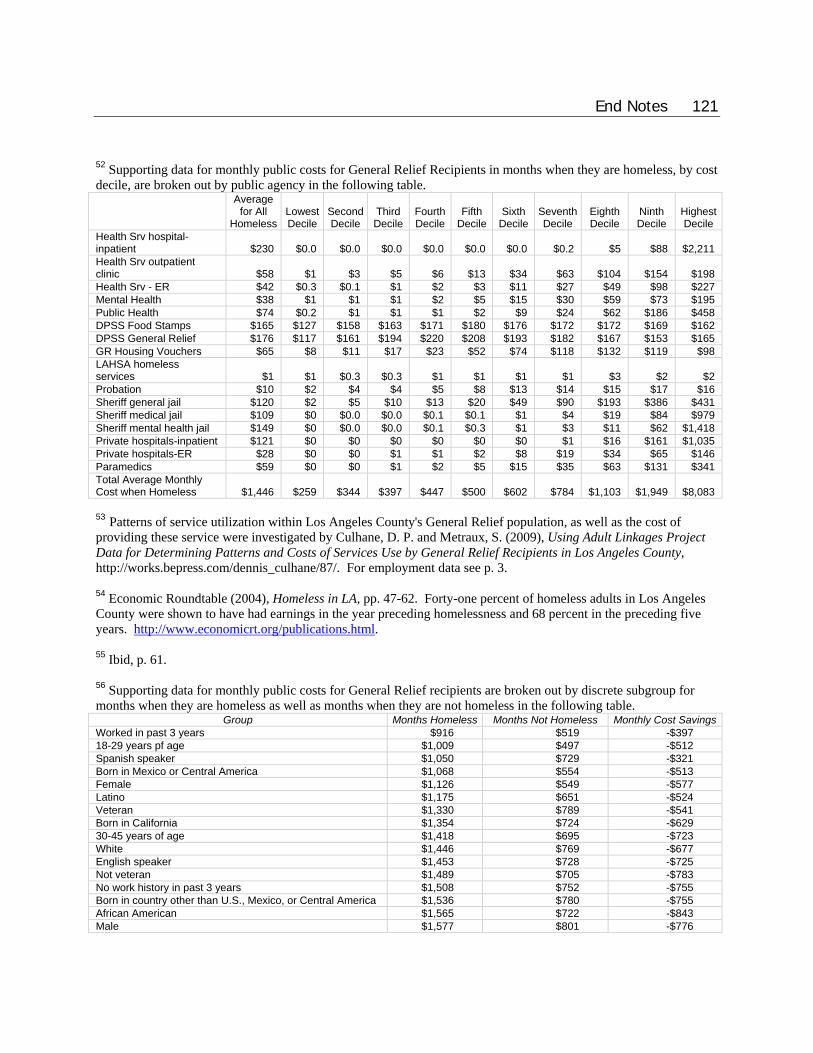
End Notes 121
52 Supporting data for monthly public costs for General Relief Recipients in months when they are homeless, by cost decile, are broken out by public agency in the following table.
Average for All
Homeless Lowest Decile
Second Decile
Third Decile
Fourth Decile
Fifth Decile
Sixth Decile
Seventh Decile
Eighth Decile
Ninth Decile
Highest Decile
Health Srv hospital-inpatient $230 $0.0 $0.0 $0.0 $0.0 $0.0 $0.0 $0.2 $5 $88 $2,211 Health Srv outpatient clinic $58 $1 $3 $5 $6 $13 $34 $63 $104 $154 $198 Health Srv - ER $42 $0.3 $0.1 $1 $2 $3 $11 $27 $49 $98 $227 Mental Health $38 $1 $1 $1 $2 $5 $15 $30 $59 $73 $195 Public Health $74 $0.2 $1 $1 $1 $2 $9 $24 $62 $186 $458 DPSS Food Stamps $165 $127 $158 $163 $171 $180 $176 $172 $172 $169 $162 DPSS General Relief $176 $117 $161 $194 $220 $208 $193 $182 $167 $153 $165 GR Housing Vouchers $65 $8 $11 $17 $23 $52 $74 $118 $132 $119 $98 LAHSA homeless services $1 $1 $0.3 $0.3 $1 $1 $1 $1 $3 $2 $2 Probation $10 $2 $4 $4 $5 $8 $13 $14 $15 $17 $16 Sheriff general jail $120 $2 $5 $10 $13 $20 $49 $90 $193 $386 $431 Sheriff medical jail $109 $0 $0.0 $0.0 $0.1 $0.1 $1 $4 $19 $84 $979 Sheriff mental health jail $149 $0 $0.0 $0.0 $0.1 $0.3 $1 $3 $11 $62 $1,418 Private hospitals-inpatient $121 $0 $0 $0 $0 $0 $0 $1 $16 $161 $1,035 Private hospitals-ER $28 $0 $0 $1 $1 $2 $8 $19 $34 $65 $146 Paramedics $59 $0 $0 $1 $2 $5 $15 $35 $63 $131 $341 Total Average Monthly Cost when Homeless $1,446 $259 $344 $397 $447 $500 $602 $784 $1,103 $1,949 $8,083 53 Patterns of service utilization within Los Angeles County's General Relief population, as well as the cost of providing these service were investigated by Culhane, D. P. and Metraux, S. (2009), Using Adult Linkages Project Data for Determining Patterns and Costs of Services Use by General Relief Recipients in Los Angeles County, http://works.bepress.com/dennis_culhane/87/. For employment data see p. 3. 54 Economic Roundtable (2004), Homeless in LA, pp. 47-62. Forty-one percent of homeless adults in Los Angeles County were shown to have had earnings in the year preceding homelessness and 68 percent in the preceding five years. http://www.economicrt.org/publications.html. 55 Ibid, p. 61. 56 Supporting data for monthly public costs for General Relief recipients are broken out by discrete subgroup for months when they are homeless as well as months when they are not homeless in the following table.
Group Months Homeless Months Not Homeless Monthly Cost SavingsWorked in past 3 years $916 $519 -$397 18-29 years pf age $1,009 $497 -$512 Spanish speaker $1,050 $729 -$321 Born in Mexico or Central America $1,068 $554 -$513 Female $1,126 $549 -$577 Latino $1,175 $651 -$524 Veteran $1,330 $789 -$541 Born in California $1,354 $724 -$629 30-45 years of age $1,418 $695 -$723 White $1,446 $769 -$677 English speaker $1,453 $728 -$725 Not veteran $1,489 $705 -$783 No work history in past 3 years $1,508 $752 -$755 Born in country other than U.S., Mexico, or Central America $1,536 $780 -$755 African American $1,565 $722 -$843 Male $1,577 $801 -$776
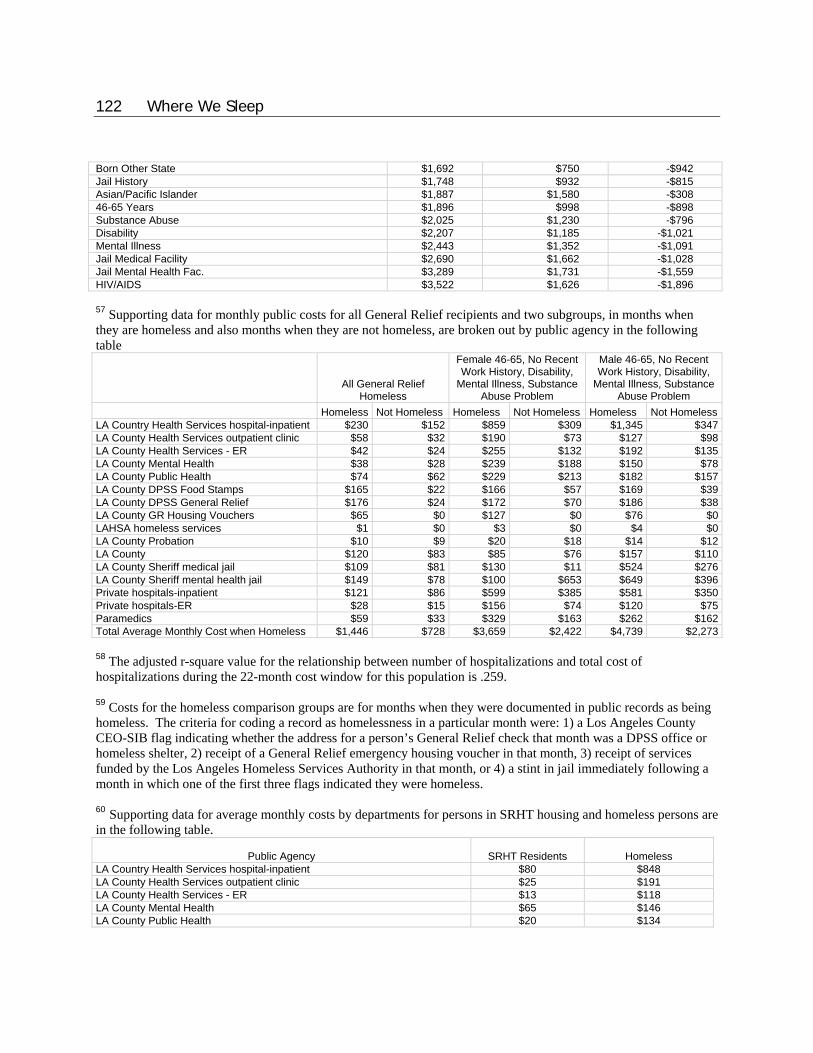
122 Where We Sleep
Born Other State $1,692 $750 -$942 Jail History $1,748 $932 -$815 Asian/Pacific Islander $1,887 $1,580 -$308 46-65 Years $1,896 $998 -$898 Substance Abuse $2,025 $1,230 -$796 Disability $2,207 $1,185 -$1,021 Mental Illness $2,443 $1,352 -$1,091 Jail Medical Facility $2,690 $1,662 -$1,028 Jail Mental Health Fac. $3,289 $1,731 -$1,559 HIV/AIDS $3,522 $1,626 -$1,896 57 Supporting data for monthly public costs for all General Relief recipients and two subgroups, in months when they are homeless and also months when they are not homeless, are broken out by public agency in the following table
All General Relief Homeless
Female 46-65, No Recent Work History, Disability,
Mental Illness, Substance Abuse Problem
Male 46-65, No Recent Work History, Disability,
Mental Illness, Substance Abuse Problem
Homeless Not Homeless Homeless Not Homeless Homeless Not HomelessLA Country Health Services hospital-inpatient $230 $152 $859 $309 $1,345 $347LA County Health Services outpatient clinic $58 $32 $190 $73 $127 $98LA County Health Services - ER $42 $24 $255 $132 $192 $135LA County Mental Health $38 $28 $239 $188 $150 $78LA County Public Health $74 $62 $229 $213 $182 $157LA County DPSS Food Stamps $165 $22 $166 $57 $169 $39LA County DPSS General Relief $176 $24 $172 $70 $186 $38LA County GR Housing Vouchers $65 $0 $127 $0 $76 $0LAHSA homeless services $1 $0 $3 $0 $4 $0LA County Probation $10 $9 $20 $18 $14 $12LA County $120 $83 $85 $76 $157 $110LA County Sheriff medical jail $109 $81 $130 $11 $524 $276LA County Sheriff mental health jail $149 $78 $100 $653 $649 $396Private hospitals-inpatient $121 $86 $599 $385 $581 $350Private hospitals-ER $28 $15 $156 $74 $120 $75Paramedics $59 $33 $329 $163 $262 $162Total Average Monthly Cost when Homeless $1,446 $728 $3,659 $2,422 $4,739 $2,273 58 The adjusted r-square value for the relationship between number of hospitalizations and total cost of hospitalizations during the 22-month cost window for this population is .259. 59 Costs for the homeless comparison groups are for months when they were documented in public records as being homeless. The criteria for coding a record as homelessness in a particular month were: 1) a Los Angeles County CEO-SIB flag indicating whether the address for a person’s General Relief check that month was a DPSS office or homeless shelter, 2) receipt of a General Relief emergency housing voucher in that month, 3) receipt of services funded by the Los Angeles Homeless Services Authority in that month, or 4) a stint in jail immediately following a month in which one of the first three flags indicated they were homeless. 60 Supporting data for average monthly costs by departments for persons in SRHT housing and homeless persons are in the following table.
Public Agency SRHT Residents Homeless
LA Country Health Services hospital-inpatient $80 $848 LA County Health Services outpatient clinic $25 $191 LA County Health Services - ER $13 $118 LA County Mental Health $65 $146 LA County Public Health $20 $134

End Notes 123
LA County DPSS Food Stamps $91 $172 LA County DPSS General Relief $138 $183 LA County GR Housing Vouchers $1 $83 LAHSA homeless services $0 $2 LA County Probation $7 $9 LA County Sheriff general jail $6 $116 LA County Sheriff medical jail $4 $84 LA County Sheriff mental health jail $48 $146 Private hospitals-inpatient $76 $424 Private hospitals-ER $9 $74 Paramedics $22 $167 Total $605 $2,897 61 Totals of the percent distributions of public costs shown for both housed and homeless persons total to more than 100 percent due to rounding error. 62 The operating costs for SRHT buildings are covered by monthly rent. Monthly rent is based on the fair market rent for the unit as determined by the Housing Authority of the City of Los Angeles. Monthly rents vary by building, and residents’ contribution towards rent also varies. Residents in units for which the Trust has a Shelter Plus Care (SPC) rental subsidy pay 30 percent of their gross income in rent. The remainder of the rent is provided through SPC rental subsidy. On average, persons in the SRHT analysis group had a monthly rent of $499; they paid $147 per month for rent; they received an average rent subsidy of $352 per month; and their average rent subsidy was approximately 70 percent of their monthly rent. 63 The monthly capital cost per unit was calculated by taking the average cost to develop one supportive housing unit ($270,000) and dividing it by 30 years or 360 months. The present value of dollars was used in this calculation. Neither financing costs for components of the development budget that incur financing charges nor the offsetting effect of inflation on the future cost for public services provided to homeless residents were included in the calculation. 64 The population of supportive housing residents profiled in this chapter is made up of current residents of the Skid Row Housing Trust who have been there 12 or more months. Shorter-term residents are not included in this sample. 65 The Corporation for Supportive Housing provided over $500,000 in capacity development funding to three key partners in the Collaborative: Skid Row Housing Trust, Lamp Community, and JWCH Institute. The purpose was to create a replicable and sustainable model for a higher level of services funding, comparable to that provided by the Collaborative, by strengthening SSI advocacy for residents and maximizing Medi-Cal reimbursement rates both from the county Department of Mental health and based on JWCH’s status as a Federally Qualified Health Center. 66 Burt, M. R. (2007), The Skid Row Collaborative 2003-2007: Process Evaluation, Urban Institute, Washington, D.C. 67 County of Los Angeles Chief Executive Office (May 27, 2008), Ninety-Day Report Regarding the Implementation of Project 50, p. 4. 68 Only pre-housing cost data was available for Project 50 participants because their entry into housing was recent. Cost data for them provided average costs for all months before housing. The average monthly pre-housing cost of $1,313 for this group was increased by 60.7 percent to produce an adjusted cost of $2,110 for months when homeless. This adjustment factor is based on average monthly cost for all homeless General Relief recipients in all months compared to average cost in months when homeless. The comparison group was made up of matched pairs

124 Where We Sleep
of 43 supportive housing residents with similar propensity scores. One of the 44 participants in Project 50 was an outlier for whom there was not a close match for inclusion in the comparison group. The data set for this project includes 85 participants in the Skid Row Collaborative. Some were outside the cost window, others did not have twelve months in supportive housing. The matched-pair comparison groups were made up of 54 project participants and 54 similar homeless persons. 69 The matched-pair comparison groups for the Skid Row Housing Trust and Skid Row Collaborative populations were used for this decile distribution of costs when homeless. For Project 50 participants, pre-housing costs were used with the decile break points recalibrated based on average costs in all months, rather than just homeless months for the General Relief homeless population. This was necessary because coding was not available to differentiate months homeless from months not homeless for this population. 70 The explanation that low public costs for some Project 50 participants reflect disconnection from public services was put forward by a mental health worker and a housing staff member associated with this project 71 Rent information is based on 497 current supportive housing residents of the Skid Row Housing Trust. 72 HUD defines the Shelter Plus Care Program as a program designed to “provide housing and supportive services on a long-term basis for homeless persons with disabilities, (primarily those with serious mental illness, chronic problems with alcohol and/or drugs, and acquired immunodeficiency syndrome (AIDS) or related diseases) and their families who are living in places not intended for human habitation (e.g., streets) or in emergency shelters.” Shelter Plus Care Program grants are used for the provision of rental assistance payment through four components – 1) Tenant-based Rental Assistance (TRA), 2) Sponsor-based Rental Assistance (SRA), 3) Project-based Rental Assistance with (PRAW) or without rehabilitation (PRA), and 4) Section 8 Moderate Rehabilitation Program for Single Room Occupancy (SRO) Dwellings. Of the Shelter Plus Care components listed above, the Skid Row Housing Trust has SRA, SRO and PRAW. 73 Supplemental Security Income (SSI) is a Federal income supplement program designed to assist aged, blind, and disabled people who have little or no income to meet their basic needs. In 2009, the maximum payment amount to a disabled or elderly individual living independently in California is $907. 74 Corporation for Supportive Housing, “Frequent Users of Emergency Departments: Addressing the Needs of a Vulnerable Population in a Medicaid Waiver.” “California is now engaged in a debate about reforming Medi-Cal. A waiver provides a unique opportunity to the State to transform care for frequent users of emergency rooms and other populations with similar vulnerabilities. A waiver that allows for reimbursement for non-medical services, such as case management, transportation, vocational services, outreach and engagement strategies, and linkage to permanent housing, through community-based providers that are integrated and flexible, that offer services in a range of settings, and that coordinate care for patients who experience difficulties accessing appropriate treatment, would improve health outcomes and control costs.” http://www.csh.org/index.cfm?fuseaction=page.viewPage&pageID=4429&nodeID 75 The Los Angeles County Department of Public Social Services’ Supplemental Security Income Assistance Program (SSIAP) assists disabled General Relief recipients with the SSI application process. Medical and mental health professionals identify potentially eligible participants and refer them for SSI advocacy. More information can be obtained at: http://dpss.lacounty.gov/dpss/ssiap/ssiap_overview.cfm 76 Victoria Stanhope, Benjamin F. Henwood, and Deborah Padgett, “Understanding Service Disengagement from the Perspective of Case Managers,” Psychiatric Services, 60, no. 4 (2009): 459-464.

End Notes 125
77 The universe used for this analysis includes 322 SRHT residents who were housed for at least 12 months during our cost window (July 2005 – December 2008). 78 Most analyses in this study use mean costs. This particular analysis utilizes median average monthly costs to reduce the noise created by atypical high costs generated by one individual in a particular quarter. These high costs are the likely result of a crisis situation in a particular quarter. The median average monthly cost for quarters is computed by: 1) calculating the average monthly cost for each resident in supportive housing, based upon their quarterly cost data and 2) finding the median cost of all those residents who were in residency during a particular quarter. Typically, the median cost is 60 percent of mean costs in this analysis. 79 There is insufficient data to produce estimates for private hospitalizations and emergency medical transportation. 80 A large share of long-term tenants have zero-costs in the later months of tenancy. This effectively brings down the median monthly costs during these later months. The zero-costs suggests: 1) factors of self-selection probably reduce the share of crisis-prone, higher-cost residents among the long-term population, 2) housing and continuity of supportive care are effective factors in stabilizing the lives of homeless persons and decreases a person’s need for public services, and 3) long-term tenants move from county-based services to non-county services. 81 The 746 former residents used in this analysis exited their SRHT unit between January 2003 and March 2007. Representatives from the SRHT stated that, with the exception of residents served through the Skid Row Collaborative, during the timeframe under consideration (January 2003 to March 2007), the nature and intensity of the Trust’s service provision changed significantly in response to its growing understanding of resident need and its increased organizational capacity. Although support was provided to all residents throughout this period, the professionalization of the Trust’s services and staff began in earnest in the fall of 2005. 82 Supporting data for tenure before departing SRHT facilities broken out be singe demographic characteristics are shown in the following table
Tenure in Housing before Departing SRHT Trust Less than 6
Months 6 to 11 Months
12 to 23 Months
24 to 35 Months
36 Months or More
No Justice System 15% 24% 32% 14% 15% Justice System Justice System 23% 29% 22% 16% 10% No SA Indicators 14% 25% 32% 18% 12% Substance
Abuse Substance Abuse Problem 19% 26% 28% 13% 14% Mental Health Problem and Substance Abuse 18% 28% 29% 13% 13% Mental Health Mental Health Problems 17% 24% 30% 15% 14% 18-29 Years 23% 31% 26% 9% 11% 30-45 Years 20% 28% 33% 11% 7% Age 46+ Years 15% 23% 28% 17% 17% Female 13% 25% 35% 14% 13% Gender Male 19% 26% 28% 15% 14%
83 Supporting data for tenure before departing SRHT facilities by reasons for leaving is shown in the following table.
Tenure before Departing SRHT Trust Reason for Leaving Less than
6 Months 6 to 11 Months
12 to 23 Months
24 to 35 Months
36 Months or More All Leavers
Death 5% 3% 4% 3% 8% 4% Hospitalization 3% 1% 0% 2% 2% 1% Incarceration 25% 18% 11% 15% 7% 15% Lease violations/non-compliance 4% 12% 12% 12% 14% 11% Non-payment of rent 7% 10% 13% 10% 14% 11% Other 2% 5% 5% 8% 11% 6% Housing opportunity - Other 4% 5% 4% 5% 8% 5%

126 Where We Sleep
Housing opportunity - Renting 15% 18% 23% 15% 16% 18% Housing opportunity - Staying/Living with Family/Friend 8% 4% 9% 9% 8% 8% Substance abuse treatment facility 8% 11% 5% 4% 3% 7% Disappeared/Unknown 19% 14% 14% 18% 9% 15%
Total 100% 100% 100% 100% 100% 100% 84 Supporting data for average monthly costs by departments for residents in the Rainbow and St. George apartments and comparable residents in other SRHT facilities are in the following table.
Public Agency
Rainbow & St. George Other SRHT Facilities
LA Country Health Services hospital-inpatient $44 $135 LA County Health Services outpatient clinic $11 $48 LA County Health Services - ER $14 $21 LA County Mental Health $104 $64 LA County Public Health $17 $15 LA County DPSS Food Stamps $64 $83 LA County DPSS General Relief $98 $122 LA County GR Housing Vouchers $0 $2 LAHSA homeless services $0 $0 LA County Probation $6 $4 LA County Sheriff general jail $6 $6 LA County Sheriff medical jail $0 $12 LA County Sheriff mental health jail $14 $43 Private hospitals-inpatient $72 $138 Private hospitals-ER $10 $14 Paramedics $24 $36 Total $484 $744 85 Supporting data for the matched-pair comparison of average monthly costs for persons while in SRHT Housing and for persons after exiting SRHT housing by public agency is as follows:
Public Agency
Months when
Housed
All Months After Leaving Housing
Months Homeless
After Leaving Housing
Cost Increase - Months Housed vs. Months Homeless
Health Srv hospital-inpatient 50 157 192 142 Private hospitals-inpatient 48 79 96 48 Health Srv outpatient clinic 36 30 40 5 Health Srv - ER 11 18 23 12 Private hospitals-ER 8 12 15 7 Mental Health 64 69 81 17 Public Health 18 20 22 4 Paramedics 18 27 35 17 DPSS Food Stamps 90 52 97 8 DPSS General Relief 131 67 126 -5 GR Housing Vouchers 0 2 5 5 LAHSA homeless srv 0 9 20 20 Sheriff general jail 3 24 29 26 Sheriff medical jail 2 69 79 77 Sheriff mental health jail 0 93 126 126 Probation 9 8 9 0 Total $489 $735 $997 $508 86 Under this component of the initiative, Department of Public Social Services staff was outstationed at the Twin Towers Correctional Facility to assist inmates who said they would be homeless upon release to assist them in applying for General Relief, Food Stamps and Medi-Cal. Chief Executive Office letters to the Los Angeles County Board of Supervisors about the Homeless Prevention Initiative, April 4, 2006, September 26, 2006, December 29, 2006, and October 27, 2009.

End Notes 127
87 Supporting data for the profile of recipients of General Relief homeless vouchers for four or more months and of all homeless General Relief recipients is shown below.
Subgroup GR Housing Voucher 4+ Months All Homeless General Relief Recipients Spanish Speaker 0% 2% HIV/AIDS 1% 0.9% Asian/Pacific Islander 1% 1% Born in Mex. or Central Am. 3% 3% Not Born US, Mex., C. Am. 3% 3% Other Ethnicity 5% 3% Worked in Past 3 Yrs. 7% 10% Jail Mental Health Facility 17% 12% Jail Medical Facility 20% 15% 18-29 years 23% 28% Veteran 26% 27% Born in Other State 27% 28% Female 28% 29% 46-65 years 28% 31% Latino 29% 24% White 30% 20% Disability 31% 37% African American 35% 52% Mental Illness 37% 29% 30-45 years 49% 41% Probation Record 53% 26% Born in California 67% 65% Male 72% 71% Jail Past 5 Years 74% 59% Substance Abuse 77% 30% No Work Past 3 Yrs. 93% 90% English Speaker 100% 98% 88 The matched-pair comparison group data is for individuals receiving basic General Relief grants during months in which they were homeless, but who did not receive any emergency housing voucher assistance through General Relief during the cost window for this study. 89 Supporting data for monthly costs when homeless vs. when not homeless is shown below.
GROUP Voucher Recipients when
Housed Voucher Recipients when
Homeless Matched-Pair Comparison
Group when Homeless Worked in Past 3 Years $910 $1,654 $1,135 Latino $1,064 $1,278 $1,195 18-29 years $1,112 $1,452 $1,304 Born in California $1,311 $1,540 $1,479 Female $1,273 $1,506 $1,481 30-45 years $1,277 $1,415 $1,610 EVERYONE $1,302 $1,524 $1,615 Other Ethnicity $1,303 $1,677 $1,624 No Work in Past 3 Years $1,330 $1,514 $1,647 Male $1,313 $1,531 $1,680 Substance Abuse $1,468 $1,674 $1,685 White $1,257 $1,403 $1,716 Jail $1,481 $1,687 $1,791 Born in Other State $1,269 $1,572 $1,853 African American $1,534 $1,799 $1,873 46-65 years $1,498 $1,767 $1,894 Disability $1,738 $2,217 $2,122 Born Outside US $1,353 $1,112 $2,518 Mental Illness $1,853 $2,210 $2,541 Jail Medical Facility $2,083 $2,316 $2,709

128 Where We Sleep
Jail Mental Health Facility $2,190 $2,679 $3,330 HIV/AIDS $2,285 $4,730 $4,113 90 One of the reasons that the matched-pair comparison group is more likely to provide more reliable data about costs when homeless than data for the same group when in months when they are homeless is that the matched pair group, which was never in voucher housing for any length of time, is less likely to be affected by transition events. There is evidence in the data from this study that transition events such as moving into or out of housing are often associated with spikes in costs. 91 The distribution of the 855 recipients of General Relief emergency housing vouchers for four or more months by cost decile was as follows:
• Highest Decile 19% • Ninth Decile 21% • Eighth Decile 22% • Seventh Decile 16% • Sixth Decile 12% • Fifth Decile 5% • Fourth Decile 3% • Third Decile 2% • Second Decile 1% • Lowest Decile 0.2%
92 Supporting data for monthly public costs before and during GR voucher housing is shown below.
Prehousing Month
Average Monthly Costs Before Housing
Number of Prehousing Records
Housing Month
Average Monthly Cost While Housed
Number of Housing Records
Prehousing M14 $4,149 22 Housed M01 $1,581 710 Prehousing M13 $3,405 23 Housed M02 $1,428 701 Prehousing M12 $2,857 25 Housed M03 $1,155 695 Prehousing M11 $1,426 32 Housed M04 $1,237 689 Prehousing M10 $1,179 40 Housed M05 $1,227 472 Prehousing M09 $1,088 44 Housed M06 $1,181 306 Prehousing M08 $862 50 Housed M07 $1,001 179 Prehousing M07 $1,037 59 Housed M08 $948 112 Prehousing M06 $1,133 71 Housed M09 $840 73 Prehousing M05 $1,443 91 Housed M10 $876 42 Prehousing M04 $1,359 109 Housed M11 $903 26 Prehousing M03 $2,112 138 Housed M12 $1,014 19 Prehousing M02 $2,922 261 Prehousing M01 $3,659 422
93 The number of records with cost data in each month before and during voucher housing is shown in the table below. There is not cost data in any month for the full sample of 855 persons in this group because not every individual had costs in every month. The size of the monthly samples with cost data dwindles in months more distant from entry into housing. Month Before Entering GR Voucher Housing Month in GR Voucher Housing
Month 14 13 12 11 10 9 8 7 6 5 4 3 2 1 1 2 3 4 5 6 7 8 9 10 11 12Number of records with cost data 22 23 25 32 40 44 50 59 71 91 109 138 261 422 710 701 695 689 472 306 179 112 73 42 26 19 94 Supporting data for average monthly public costs for General Relief emergency housing voucher recipients by service provider in 2008 dollars is shown below.
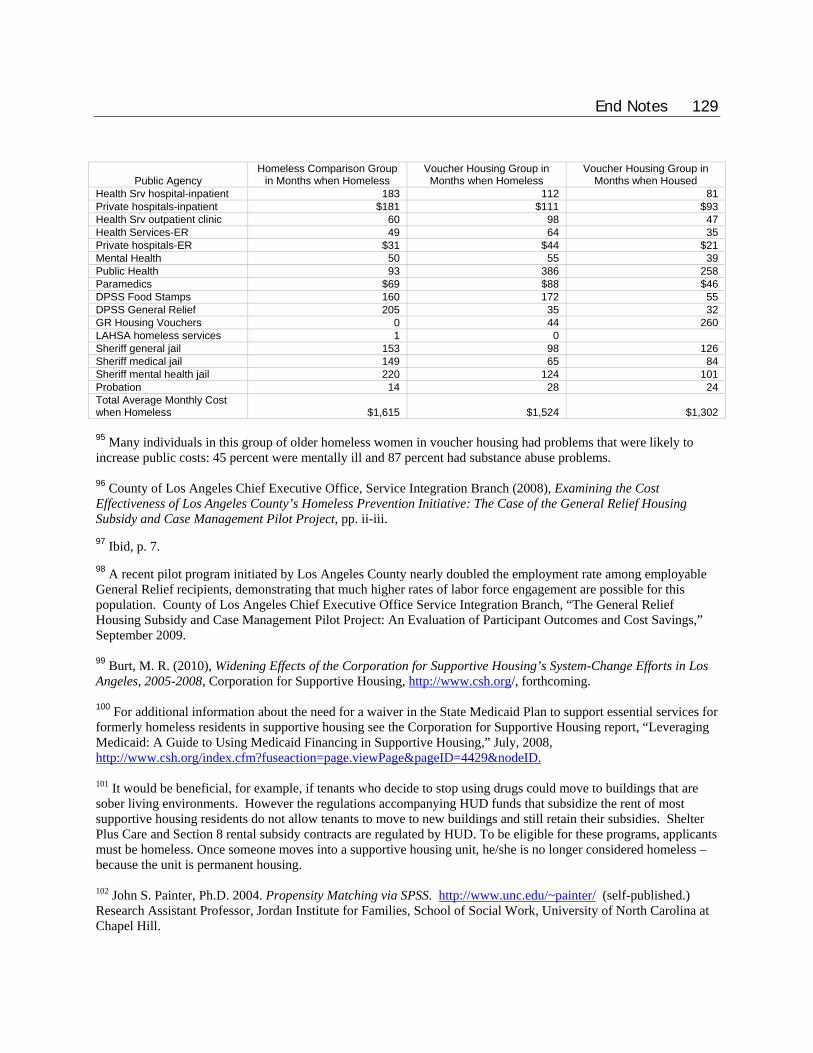
End Notes 129
Public Agency Homeless Comparison Group
in Months when Homeless Voucher Housing Group in Months when Homeless
Voucher Housing Group in Months when Housed
Health Srv hospital-inpatient 183 112 81 Private hospitals-inpatient $181 $111 $93 Health Srv outpatient clinic 60 98 47 Health Services-ER 49 64 35 Private hospitals-ER $31 $44 $21 Mental Health 50 55 39 Public Health 93 386 258 Paramedics $69 $88 $46 DPSS Food Stamps 160 172 55 DPSS General Relief 205 35 32 GR Housing Vouchers 0 44 260 LAHSA homeless services 1 0 Sheriff general jail 153 98 126 Sheriff medical jail 149 65 84 Sheriff mental health jail 220 124 101 Probation 14 28 24 Total Average Monthly Cost when Homeless $1,615 $1,524 $1,302 95 Many individuals in this group of older homeless women in voucher housing had problems that were likely to increase public costs: 45 percent were mentally ill and 87 percent had substance abuse problems. 96 County of Los Angeles Chief Executive Office, Service Integration Branch (2008), Examining the Cost Effectiveness of Los Angeles County’s Homeless Prevention Initiative: The Case of the General Relief Housing Subsidy and Case Management Pilot Project, pp. ii-iii. 97 Ibid, p. 7. 98 A recent pilot program initiated by Los Angeles County nearly doubled the employment rate among employable General Relief recipients, demonstrating that much higher rates of labor force engagement are possible for this population. County of Los Angeles Chief Executive Office Service Integration Branch, “The General Relief Housing Subsidy and Case Management Pilot Project: An Evaluation of Participant Outcomes and Cost Savings,” September 2009. 99 Burt, M. R. (2010), Widening Effects of the Corporation for Supportive Housing’s System-Change Efforts in Los Angeles, 2005-2008, Corporation for Supportive Housing, http://www.csh.org/, forthcoming. 100 For additional information about the need for a waiver in the State Medicaid Plan to support essential services for formerly homeless residents in supportive housing see the Corporation for Supportive Housing report, “Leveraging Medicaid: A Guide to Using Medicaid Financing in Supportive Housing,” July, 2008, http://www.csh.org/index.cfm?fuseaction=page.viewPage&pageID=4429&nodeID. 101 It would be beneficial, for example, if tenants who decide to stop using drugs could move to buildings that are sober living environments. However the regulations accompanying HUD funds that subsidize the rent of most supportive housing residents do not allow tenants to move to new buildings and still retain their subsidies. Shelter Plus Care and Section 8 rental subsidy contracts are regulated by HUD. To be eligible for these programs, applicants must be homeless. Once someone moves into a supportive housing unit, he/she is no longer considered homeless – because the unit is permanent housing. 102 John S. Painter, Ph.D. 2004. Propensity Matching via SPSS. http://www.unc.edu/~painter/ (self-published.) Research Assistant Professor, Jordan Institute for Families, School of Social Work, University of North Carolina at Chapel Hill.

![Dying without Dignity: Homeless Deaths in Los Angeles ...€¦ · Homelessness in Los Angeles: Los Angeles [city and county] has the disgrace of being the homeless capital of the](https://img.pdfslide.us/doc/110x75/5fccac5449692773bc36b9de/dying-without-dignity-homeless-deaths-in-los-angeles-homelessness-in-los-angeles.jpg)