Embed Size (px)
Citation preview
HumanEPI
Data
Where the Question of
Health Risk is Raised
Res
pons
e
Log DosePaustenbach (1995)
AnimalData

General Approaches To Risk Assessment
• Qualitative approach using scientific judgment
• Quantitative approach using safety factors
• Quantitative approach using mathematical models
• Quantitative approach using linear extrapolation

What Drives Most Types of Environmental Health
Risk Assessment?
• There are many types of risk assessment – Cancer– Developmental toxicity– Neurotoxicity

Cancer Risk Assessment
• Population risks for environmental carcinogens are usually set at one additional cancer per 100,000 or 1,000,000 individuals
• Occupational risks are frequently much higher, with one additional cancer per 1,000 workers being not uncommon

Hazard Identification
• A qualitative risk assessment
• Does an agent have the potential to increase the incidence of cancer under any conditions

Dose-Response Assessment
• The relationship between dose and response (cancer incidence)
• Two sets of data are usually available– Data in the observable range– Extrapolation to responses below the
observable range

Exposure Assessment
• EPA uses the cumulative dose received over a lifetime
• This is expressed as the average daily exposure
• Occupational exposures are usually based on exposure during the work week

Risk Characterization
• Provides an overall conclusion and confidence of risk for the risk manager
• Gives the assumptions made
• Explains the uncertainties
• Outlines the data gaps

Issues Related to Uncertainty in Risk Assessment
• High to low dose extrapolation
• Species to species extrapolation
• Mechanism of carcinogenesis
• Interindividual differences

• Chemicals that are carcinogenic in animals are expected to be carcinogenic in humans
• Humans are assumed to be as sensitive as the most sensitive animal
• The dose-response is assumed to be linear
Major Default Assumptions in Cancer Risk Assessment

Emerging Issues in Biologically-based Risk Assessment
• Incorporation of PBPK models• Use of molecular dosimetry as a
surrogate of exposure• Role of cell proliferation• Mode of action information• Life stage differences in susceptibility

Potential of Molecular Dosimetry in Risk Assessment
• High to low dose extrapolation– Saturation of metabolic activation– Saturation of detoxication– Saturation of DNA repair
• Route to route differences• Species to species differences

How is Causality Determined?

Bradford Hill Criteriafor Cancer Causation
• Consistency• Strength• Specificity• Temporality• Coherence
• Dose Response• Biological
Plausibility• Experimental
Support• Analogy

IPCS/EPA Framework for Evaluating Mechanistic Data
• Introduction• Postulated mode of
action• Key events• Dose-response
relationship• Temporal association• Strength, consistency
and specificity of association with key events
• Biological plausibility and coherence
• Other modes of action• Assessment of mode of
action• Uncertainties,
inconsistencies and data gaps

Chemical Exposure (air, water, food, etc.)
Internal Exposure
Metabolic Activation
Macromolecular Binding Detoxication
DNA RNA Protein
Biologically Effective Dose
Efficiency of Mispairing
Cell Proliferation
X
XInitiation
k
k
k k
k
k
1
2
3 4
6
5(Biomarker)

c a
b
Increasing External Exposure
Incr
easi
ng A
dduc
t C
once
ntra
tion
Sublinear
Supralinear

SOURCES OF MUTATIONS
ENDOGENOUS DNA DAMAGE EXOGENOUS DNA DAMAGE
Depurination
DNA REPAIR
MUTATION
LifeStyles
EnvironmentalAgents
FreeRadicals
PolymeraseErrors
CELL REPLICATION

Initiating
Event
Cell Proliferation
(clonal expansion)
Progression
Cell Proliferation
Cell Proliferation
Malignancy
Second Mutating Event
Third Mutating Event


D D
S
S
SS
I
I I
I
Mµ1 µ2
β2
First Event Second Event
A Moolgavkar Representation of Multistage Carcinogenesis

Role of Increased Cell Proliferation in Carcinogenesis
• Decreases time available for DNA repair
• Converts repairable DNA damage intononrepairable mutations
• Necessary for chromosomal aberrations, insertions, deletions and gene amplification
• Clonally expands existing cell populations

8-oxo-G, FapyGua
Lipid Peroxidation
Lipid PeroxideMDA, 4-HNE AP Sites
DNA Base Modification DNA Base
adductROS
SugarDamage
DNA Base adduct
M1G, edG, edA
Oxidative Stress Induced-DNA Damage
GlycosylasehOGG1
GlycosylaseMPG
Base Propenal
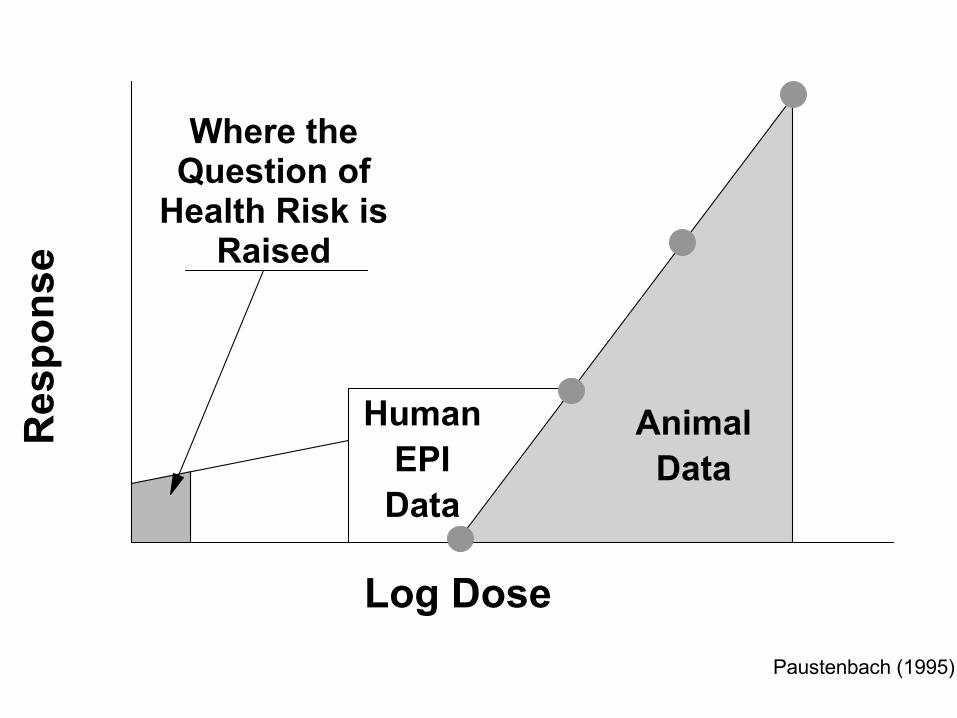
Control Rat Liver Tissues
0. 0
1. 0
2. 0
3. 0
4. 0
5. 0
6. 0
4- wk 12- wk 2- yr
Rat Ages
8OH
dG/d
G (1
0e-6
)

Non-smoker Lymphocytes
0.00
1.00
2.00
3.00
4.00
5.00
6.00
7.00
8.00
9.00
1 2 3 4 5 6 7 8 9 10
8OH
dG/d
G (1
0e-6
)
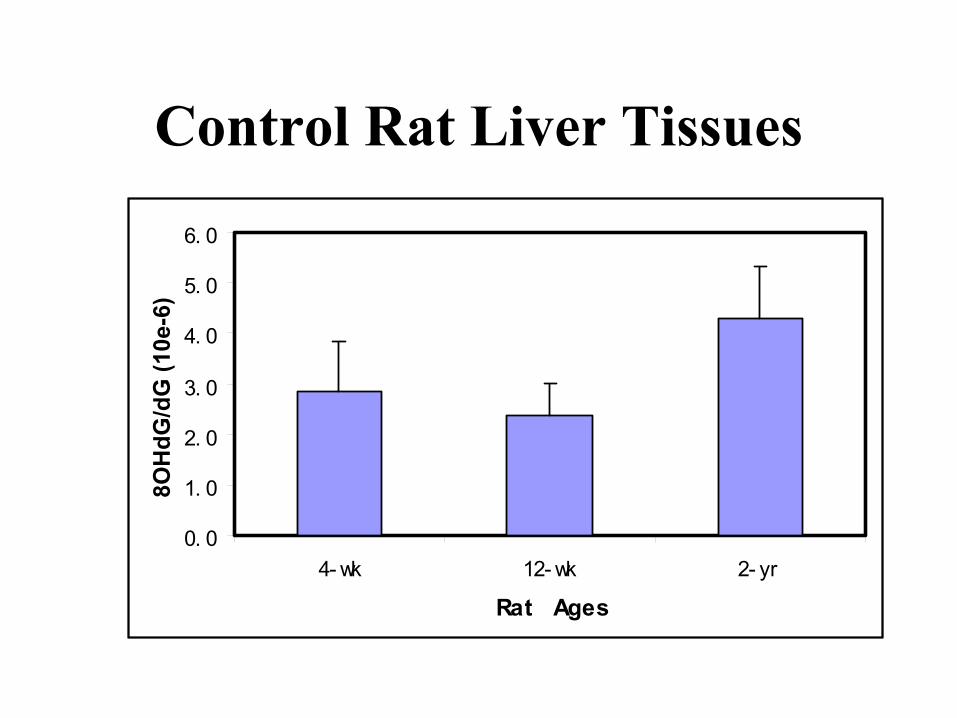
PentachlorophenolUsed as a Pesticide and Wood Preservatives
Introduction to Humans: Air, Food and Drinking water
Mutagen, Rodent Carcinogen
OHCl
ClCl
Cl
ClOH
Cl
ClOH
Cl
Cl
OCl
ClO
Cl
Cl
OCl
ClOH
Cl
Cl
O2
O2-
H2O2
OH

Induced Oxidative StressCalf Thymus DNA Exposed to TCHQCalf Thymus DNA Exposed to TCHQ
0
10
20
30
40
50
0.1 1 10 100 1000
TCHQ (uM)
8OH
dG/d
G (1
0e-6
)

M1G formation from 1,4-TCBQ treatment
0
5
10
15
20
25
30
35
1,4-TCBQ (µM) 0 1 10
M1G
in
108
Nt.
0.1mM NADPH + + +0.1mM CuCl2 + + +

Aldehydic DNA lesions (ADL) in HeLa cells exposed to H2O2 (0.06-20 mM) for 15 min
0
5
10
15
20
25
0 5 10 15 20H2O 2 (mM)
AD
L/1,
000,
000
ntd

0
10
20
30
40
50
0.01 0.1 1 10 100H2O2 (mM)
Incr
ease
d A
DLs
/H2O
2
conc
entr
atio
n
Efficiency of Low Doses of H2O2

DNA Alkylation
7%2%7%14%ENUDEN
0.4%0.1%7%70%MNUDMN
--0.3%85%MMS
O2 Alkyl Thymine
O4 Alkyl Thymine
O6 AkylGuanine
N7AlkylGuanine

N-7-Methylguanine
O -Methylguanine
10000
1000
100
10
1
0.1
0.01
0.001 0.001 0.01 0.1 1 10 100
40
30
20
10
03210
6
DMN (mg/kg)
Alky
latio
ns/1
0 g
uani
nes
Alk y
latio
ns/1
0 g
uani
nes
6 6
A B

0.00E+00
2.00E-06
4.00E-06
6.00E-06
8.00E-06
1.00E-05
1.20E-05
0 10 20 30 40 50 60 70 80
Duration of DEN exposure, days
Mol
ar ra
tio in
DN
A
O4-EtdThd
O6-EtdGuo


0 20 40 60 80 100
0
20
40
60
80
100
0
20
40
60
80
100
Dose (ppm DEN)
ET (p
M)/d
T(µ
M)
0 5 10 15 200
5
10
15
0
5
10
15O2-ET O4-ET
Molecular Dosimetry of DEN

Vinyl Chloride
• Vinyl chloride is a known human and animal carcinogen that induces hepatic angiosarcomas
• Carcinogenic response is associated with high exposure (>50 ppm)
• To date, 178 VC workers have developed hepatic angiosarcomas. All of them started work prior to lowering the occupational exposure 1 ppm
• Vinyl chloride is present in many Superfund sites and some public drinking water in ppb amounts
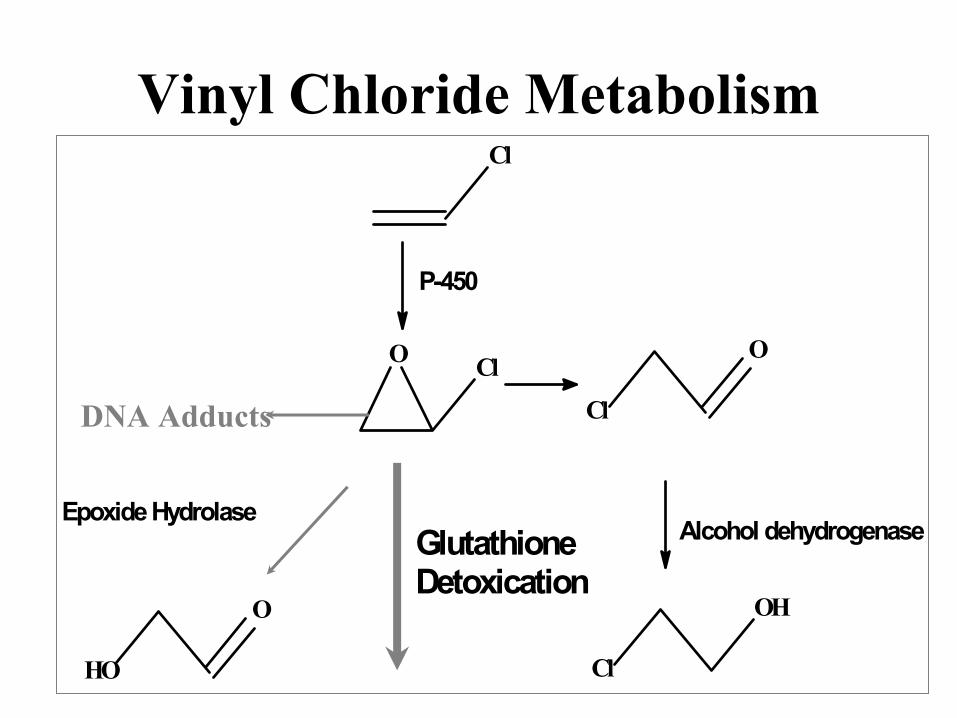
Vinyl Chloride MetabolismCl
O Cl
Cl
O
P-450
Epoxide Hydrolase
HO
O
Cl
OH
Alcohol dehydrogenaseGlutathioneDetoxication
DNA Adducts

Exposure-Response for Vinyl Chloride Metabolism and Carcinogenicity
0
5000
10000
0 1000 2000 3000 4000
VC Exposure (ppm)
ν ( µ
g / 6
hr)
(Gehring et al, 1978)
0.0
0.1
0.2
0 2000 4000 6000VC Exposure (ppm)
ASL
Inci
denc
e(Maltoni et al, 1981)

Formation of [13C2]-DNA Adducts by Vinyl Chloride
CH2Cl
O
Cl
N
NH
NN
N
OOH
dRib
N
NN
N
dRib
N
N
N
N
dRibO
NH
NH2NN
NH
O
dRib
O
NH
N NN
N
O
dRib
CYP450 2E1
vinyl chloride chloroethylene oxide
DNA
HO-ethanodeoxyguanosine1,N6-ethenodeoxyadenosine 3,N4-ethenodeoxycytidine
7-(2-oxoethyl)-deoxyguanosine N2,3-ethenodeoxyguanosine
* ** *
* *
**
** *
*
**
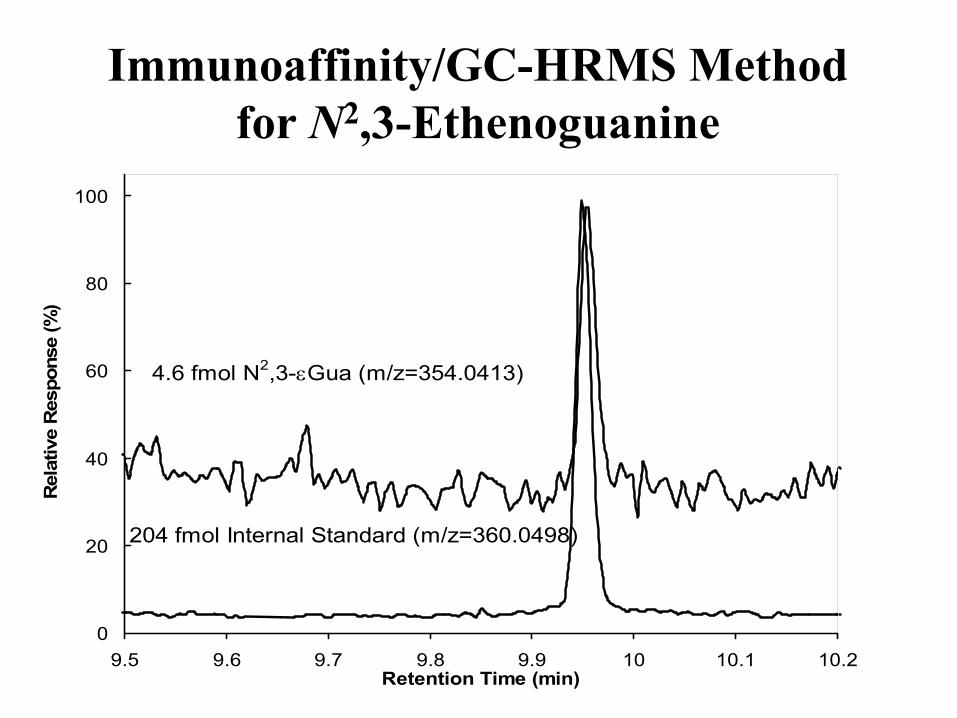
Immunoaffinity/GC-HRMS Method for N2,3-Ethenoguanine
0
20
40
60
80
100
9.5 9.6 9.7 9.8 9.9 10 10.1 10.2Retention Time (min)
Rel
ativ
e R
espo
nse
(%)
4.6 fmol N2,3-εGua (m/z=354.0413)
204 fmol Internal Standard (m/z=360.0498)

Molecular Dosimetry of N2,3-Ethenoguanine in Adult Rats Exposed to Vinyl Chloride
HEP
0
4
8
12
0 25 50 75 100
0
5
10
15
20
0 200 400 600 800 1000
VC Concentration (ppm)
mol
N2 ,3
G /
107 m
ol G
0
4
8
12
16
0 200 400 600 800 1000
VC Concentration (ppm)
mol
N2 ,3
-G
/ 10
7 mol
G
0
2
4
6
8
0 25 50 75 100
NPC

Vinyl Chloride Exposure-Response Relationship Between Endogenous and
Exogenous N2,3-Ethenoguanine
130 ± 50
99 ± 25
16.2 ± 0.5
3.5 ± 1.0
εG/108 G
4 wk
371671 ± 101100
298.238 ± 4100
4.72.29.9 ± 6.510
----4.6 ± 3.50
Fold-Increase
Fold-IncreaseεG/108 Gppm VC
1 wk
* Whole-body inhalation (6 hr/d; 5 d/wk)

Formation of Endogenous εGua Adducts from Lipid Peroxidation
HN
N
N
N
O
H2N
OHO
OH
HN
N
N
N
O
N
OR
OHHO
H
OHO
OH
H
N
N
N
N
O
N
OHO
OH
H
HN
N
N
N
O
N
OHO
OH
+
+CH3(CH2)4CH CH CH CHOOOH

Formation of [13C2]-EG in Hepatocyte DNA by Vinyl Chloride
0.0
0.5
1.0
9.4 9.5 9.6 9.7 9.8 9.9 10
Retention Tim e (m in)
Rel
ativ
e In
ten
sity
0.0
0.5
1.0
9.4 9.5 9.6 9.7 9.8 9.9 10
Retention T im e (m in)
Rel
ativ
e In
ten
sity
0.0
0.5
1.0
9.4 9.5 9.6 9.7 9.8 9.9 10.0
Retention T im e (m in)
Rel
ativ
e In
ten
sity
A
B
C
m/z=354N2,3-εG(Endogenous)
m/z=356[13C2]N2,3-εG(VC-Derived)
m/z=360[13C4,15N2]N2,3-εG(Internal Standard)
0.0
0.5
1.0
9.4 9.5 9.6 9.7 9.8 9.9 10
Retention Tim e (m in)
Rel
ativ
e In
ten
sity
0.0
0.5
1.0
9.4 9.5 9.6 9.7 9.8 9.9 10
Retention T im e (m in)
Rel
ativ
e In
ten
sity
0.0
0.5
1.0
9.4 9.5 9.6 9.7 9.8 9.9 10.0
Retention T im e (m in)
Rel
ativ
e In
ten
sity
A
B
C
0.0
0.5
1.0
9.4 9.5 9.6 9.7 9.8 9.9 10
Retention Tim e (m in)
Rel
ativ
e In
ten
sity
0.0
0.5
1.0
9.4 9.5 9.6 9.7 9.8 9.9 10
Retention T im e (m in)
Rel
ativ
e In
ten
sity
0.0
0.5
1.0
9.4 9.5 9.6 9.7 9.8 9.9 10.0
Retention T im e (m in)
Rel
ativ
e In
ten
sity
0.0
0.5
1.0
9.4 9.5 9.6 9.7 9.8 9.9 10
Retention Tim e (m in)
Rel
ativ
e In
ten
sity
0.0
0.5
1.0
9.4 9.5 9.6 9.7 9.8 9.9 10
Retention T im e (m in)
Rel
ativ
e In
ten
sity
0.0
0.5
1.0
9.4 9.5 9.6 9.7 9.8 9.9 10.0
Retention T im e (m in)
Rel
ativ
e In
ten
sity
A
B
C
m/z=354N2,3-εG(Endogenous)
m/z=356[13C2]N2,3-εG(VC-Derived)
m/z=360[13C4,15N2]N2,3-εG(Internal Standard)
m/z=354N2,3-εG(Endogenous)
m/z=356[13C2]N2,3-εG(VC-Derived)
m/z=360[13C4,15N2]N2,3-εG(Internal Standard)

Formation of [13C2]-EG in Brain DNA by Vinyl Chloride
0.1
0.6
1.1
9.4 9.5 9.6 9.7 9.8 9.9 10
Retention Tim e (m in)
Rel
ativ
e In
ten
sity
0.4
0.9
1.4
9.4 9.5 9.6 9.7 9.8 9.9 10
Retention Tim e (m in)
Rel
ativ
e In
ten
sity
0.0
0.5
1.0
9.4 9.5 9.6 9.7 9.8 9.9 10
Retention Tim e (m in)
Rel
ativ
e In
ten
sity
A
B
C
m/z=354N2,3-εG(Endogenous)
m/z=356[13C2]N2,3-εG(VC-Derived)
m/z=360[13C4,15N2]N2,3-εG(Internal Standard)
0.1
0.6
1.1
9.4 9.5 9.6 9.7 9.8 9.9 10
Retention Tim e (m in)
Rel
ativ
e In
ten
sity
0.4
0.9
1.4
9.4 9.5 9.6 9.7 9.8 9.9 10
Retention Tim e (m in)
Rel
ativ
e In
ten
sity
0.0
0.5
1.0
9.4 9.5 9.6 9.7 9.8 9.9 10
Retention Tim e (m in)
Rel
ativ
e In
ten
sity
0.1
0.6
1.1
9.4 9.5 9.6 9.7 9.8 9.9 10
Retention Tim e (m in)
Rel
ativ
e In
ten
sity
0.4
0.9
1.4
9.4 9.5 9.6 9.7 9.8 9.9 10
Retention Tim e (m in)
Rel
ativ
e In
ten
sity
0.0
0.5
1.0
9.4 9.5 9.6 9.7 9.8 9.9 10
Retention Tim e (m in)
Rel
ativ
e In
ten
sity
A
B
C
m/z=354N2,3-εG(Endogenous)
m/z=356[13C2]N2,3-εG(VC-Derived)
m/z=360[13C4,15N2]N2,3-εG(Internal Standard)
A
B
C
A
B
C
m/z=354N2,3-εG(Endogenous)
m/z=356[13C2]N2,3-εG(VC-Derived)
m/z=360[13C4,15N2]N2,3-εG(Internal Standard)
m/z=354N2,3-εG(Endogenous)
m/z=356[13C2]N2,3-εG(VC-Derived)
m/z=360[13C4,15N2]N2,3-εG(Internal Standard)
10.0

Vinyl Chloride Cancer Risk Estimates
1.6-3.7Rat
PBPK/LMS1995Clewell et al
2000
1996
1989
1994
Year
1.4EpiChen & Blancato
4.4Rat (f)
1.0-2.3Mouse
0.3-2.8Epi
PBPK/LMSEPA
0.6RatPBPK/LMSReitz et al
0.7-1.4RatPBPK/LMS
84RatLMSEPA
Inhalation Risk(per µg/m3 x 10-6)
DataModelAuthor(s)

Use of Mechanistic Evidence in Vinyl Chloride Risk Assessment
• PBPK Modeling– Conversion of animal exposures to human
equivalent concentrations– Route-to-route extrapolation
• DNA Adducts– Selection of low dose extrapolation model– Inclusion of 2-fold protection factor for young– Increased confidence in risk assessment
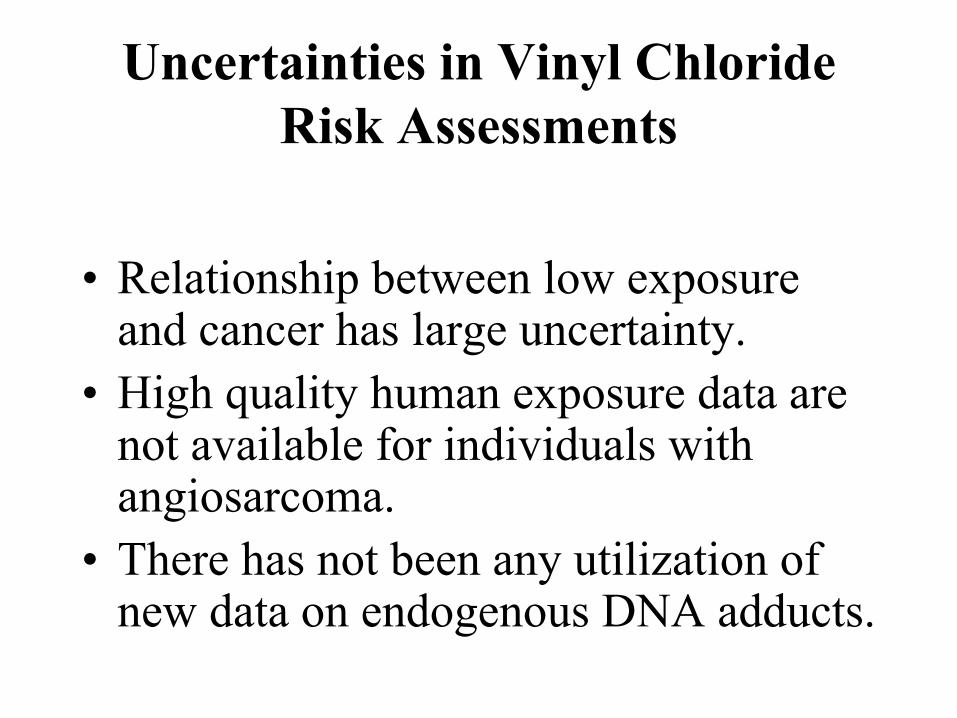
Uncertainties in Vinyl Chloride Risk Assessments
• Relationship between low exposure and cancer has large uncertainty.
• High quality human exposure data are not available for individuals with angiosarcoma.
• There has not been any utilization of new data on endogenous DNA adducts.

Formaldehyde
• Chronic exposure to high concentrations (10-15 ppm) causes nasal cancer in rats
• Listed as a Probable Carcinogen for humans
• Formaldehyde causes DNA-protein cross-links
• Highly nonlinear response due to increased cell proliferation

0
0.2
0.4
0.6
0 2 4 6 8 10 12 14 16
Parts per million Formaldehyde
Tum
or R
ate
Nasal Carcinogenesis in Rats Exposed to Formaldehyde

DNA-Protein Cross-links versus Formaldehyde Exposure
0.00
0.02
0.04
0.06
0 2 4 6 8 10 12 14 16
ppm Formaldehyde
Cov
alen
tly B
ound
HC
HO
per
ppm

0
10
20
30
40
50
60
70
0 2 4 6 8 10 12 14 16
HCHO Concentration (ppm)
Tum
or In
cide
nce
(%)
0
2
4
6
8
10
12
14
Cel
l Pro
lifer
atio
n (m
ean
unit
leng
th
labe
ling
inde
x) a
t Nas
al L
evel
II (f
old
incr
ease
ove
r co
ntro
l)
Tumor Incidence 24-monthStudy (Kerns, 1983; EPA,1987)
Tumor Incidence 18-monthStudy (Monticello, 1990)
Cell Proliferation Study 6-month (Monticello, 1990)
Cell Proliferation 12-month(Monticello, 1990)
Cell Proliferation 18-month(Monticello, 1990)
Tumor Incidence and Cell Proliferation in Rats Exposed to Formaldehyde

Propylene Oxide (PO)
• Workplace exposure: inhalation
• Limit of exposure: 20 ppm (8hr time weighted average)
• Mutagenic in bacterial and mammalian systems in vitro
• In vivo tests (rat and mouse dominant lethal tests and mouse sperm-head morphology test) were negative
• No difference in chromosome aberrations or significant increase in sister chromatid exchanges in lymphocytes of monkeys exposed to 100 or 300 ppm PO for 104 weeks

Detoxication (glutathione S-transferase, epoxide hydrolase))
Intracellular ExposurePO
Proposed mode of action: Events and pathways involved in PO-induced nasal tumor formation
Macromolecular binding
DNA adductscellular injury
Cellhyperplasia
Papillary adenomas
?

Comparison of Carcinogenicity, DNA and Hemoglobin Adducts, and Cell Proliferation
0
2
4
6
0 100 200 300 400 500
Tum
or In
cide
nce
0
50
100
150
200
250
300
0 100 200 300 400 500
pmol
HPG
/mg
DN
A
0
50
100
150
200
0 100 200 300 400 500
pmol
HPV
al/m
g gl
obin
0
2
4
6
8
10
0 100 200 300 400 500
fold
incr
ease
ove
r co
ntro
l
Carcinogenicity DNA Adducts
Hemoglobin Adducts Cell Proliferation

Butadiene• Carcinogenicity
– Mouse - highly carcinogenic– Rat - weakly carcinogenic– Human – considerable uncertainty
• Major metabolites differ by species and include: – Epoxybutene (EB)– Diepoxybutane (DEB): 100x more mutagenic than EB
and 200x more mutagenic than EBD– Epoxybutane diol (EBD): Major cause of
trihydroxybutyl adducts– Butene diol (BD-diol)– Hydroxymethylvinylketone (HMVK): Precursor of M1,
the major urinary metabolite of humans

HO
SG
HO
OH
SG
HO
OH
HO
OH
OH
OH
HO
OH
SG
OH
1,3-Butadiene
O
1,2-Epoxy-3-butene
O
HO
OH
1,2-Dihydroxy-3,4-epoxybutane
O
O
1,2,3,4-Diepoxybutane
Erythritol
EH
M3
EHGSHEH
3-Butene-1,2-diol
CYP2E1
CYP2E1
GSH
M1GSH
M2
EH
GSH
DNAProtein
CYP2E1

Comparison of Mutagenicity at HPRT
20
TK6 cells
0 200 400 600 800 1,0000
5
10
15
Dose (µM)EB EBDDEB
-6In
duce
d M
utan
t Fre
quen
cy X
10

Molecular Dosimetry of Butadiene Epoxide DNA Adducts
0
10
20
30
40
50
60
70
80
0 100 200 300 400 500 600Butadiene Exposure (ppm)
Add
ucts
/mill
ion
Gua
Mouse THB-GRat THB-GMouse EB-GRat EB-G

What is the Source of THB-Guanine?
• DEB and EB are equally reactive with DNA• DEB and EB have been measured in tissues of rats
and mice• DEB-Guanine can be converted to THB-Guanine• DEB-Guanine/[DEB] = EB-Guanine/[EB]• DEB-Guanine = EB-Guanine x [DEB]/[EB]• THB-Guanine = DEB-Guanine +EBD-Guanine• ~95% of THB-Guanine came from EBD

02468
101214161820
0 10 20 30 40 50 60Butadiene Exposure (ppm)
Add
ucts
/mill
ion
Gua
Mouse THB-GRat THB-GMouse EB-GRat EB-G
Dose-response Relationship of DNA Adducts in Female Rats and Mice Exposed to Butadiene for 4 Weeks

0
500
1000
1500
2000
2500
3000
3500
4000
4500
0 10 20 30 40 50 60 70BD Exposure (ppm)
pmol
val
ine
addu
ct/g
glo
bin
Mouse THBV
Rat THBVMouse HBV
Rat HBV
Dose-response Relationship of Hemoglobin Adducts in Female Rats and Mice Exposed to Butadiene for 4 Weeks

0
2000
4000
6000
8000
10000
12000
14000
16000
0 5 10 15 20 25 30
EB Exposure (ppm)
pmol
val
ine
addu
ct/g
glo
bin
Mouse THBV
Rat THBV
Mouse HBV
Rat HBV
Dose-response Relationship of Hemoglobin Adducts in Female Rats and Mice Exposed to Epoxybutene for 4 Weeks

0
2000
4000
6000
8000
10000
12000
14000
16000
18000
20000
0 1 2 3 4 5 6
DEB exposure (ppm)
pmol
val
ine
addu
ct/g
glo
bin
Mouse THBV
Rat THBV
Mouse HBV
Rat HBV
Dose-response Relationship of Hemoglobin Adducts in Female Rats and Mice Exposed to Diepoxybutane for 4 Weeks

Hemoglobin Adducts in CYP2E1 Knock-out Mice Exposed to 62.5 ppm 1,3-butadiene for 6 h by Inhalation
5.6%16%Percent of Wild-Type
73 ± 219.4 ± 3.2CYP2E1 Knock-out Mouse
1300 ± 32058.1 ± 18.5Wild-Type Mouse
THBVal(pmol /g globin)
HBVal(pmol /g globin)Genotype

Efficiency of THBVal formation and Hprt Mutant Induction in Female B6C3F1 Mice Exposed to BD
3 20 62.5 625 1250
Butadiene Exposure (ppm)
0
5
10
15
20
THB
Val
(10
m
ol/g
glo
bin)
/BD
Con
cent
ratio
n (p
pm)
0
5
10
15
20
Indu
ced
Hpr
t MF
X 1
0 /B
D C
once
ntra
tion
(ppm
)THBVal formation in erythrocytesMutant induction in T-lymphocytes
-13
-9

Biomarkers Facility Core 67
Molecular Dosimetry and Epidemiology Studies on Butadiene
Trihydroxybutyl-valineAdduct vs. 1,3-ButadieneExposure by GSTT1 Genotype
10
100
1000
10000
0.001 0.01 0.1 1 10
Average Butadiene Exposure (ppm)
Trih
ydro
xy a
dduc
t (pm
ol/g
Hb) GSTT1 + GSTT1 -
R2=0.737
Control Monomer Polymer
Butadiene Exposure Group
0
100
200
300
400
500
600
700
800
THB
Val (
pmol
/g g
lobi
n)
0.0
1.0
2.0
3.0
4.0
HB
Val (
pmol
/g g
lobi
n)
THBValHBVal
Monoepoxide and Triol Hemoglobin Adducts in Butadiene Workers from the Czech Republic

Effect of Butadiene Exposure on Hemoglobin Adducts, Urinary Metabolites, and Indicators of
Genotoxicity in Humans
Endpoint Control Monomer Polymer Significance (Kruskal-Wallis)
Butadiene Exposure (mg/m3)
0.02 0.64 1.79 p<0.05
HB-Val (pmol/g Hb) THB-Valine (pmol/g Hb)
0.2 95
0.5 180
2.2 715
p<0.05 p<0.05
Net M1 (ug/L) Net M2 (ug/L)
-219 -0.05
213 5.3
2700 84
p<0.05 p<0.05
Hprt VF (×106) MF (×106)
10.75 13.00
5.73 10.69
6.48 18.83
p<0.05 --
SCE (SCE/cell) CA (%)
6.32 1.56
6.14 1.52
6.47 1.54
-- --
Albertini et al., in press

Effect of Butadiene Exposure on Hemoglobin Adducts, Urinary Metabolites, and Indicators of Genotoxicity in Humans
Endpoint Unexposed Exposed Significance (Wilcoxin)
THB-Valine 37.6 74 P<0.0001 Hprt 17.2 16.8 0.76 SCE 10.3 9.7 0.20
Aneuploidy (%) 11 10 0.30
GPA:Nφ NN
6.0 7.2
3.9 6.0
0.12 0.11
Hayes et al. (2000)

Effect of Butadiene Exposure on Hemoglobin Adducts, Urinary Metabolites, and Indicators of Genotoxicity in
Humans with GSTT1 Polymorphisms
Endpoint Wild-Type Null (n=15)
Significance (Wilcoxin)
THB-Valine 72.8 74.0 0.89
hprt 16.7 18.9 0.92
SCE 9.6 9.8 0.78
In vitro SCE + BDO2 86.2 138.9 p<0.0001
Aneuploidy (%) 6 8 0.43
GPA:Nφ NN
4.0 7.0
3.9 5.3
0.90 0.31
Hayes et al. (2000)

O
O
OOH
OOH
OH
OH
OH
O
P450
P450
mEH
mEH
P450
GSTP450+ Several Steps
MI
GST + SeveralSteps
MII
BD EB BD-diol HMVK
DEB EB-diol
O
OHHBAL
ADHSpontaneous Rearrangement
GSTGlutathioneConjugate
Figure 1. 1,3-Butadiene Metabolism Scheme

0
10
20
30
40
0 10 20 30 40
BD-diol (ppm)
THB
-Val
-PFP
TH
(pm
ol/m
g gl
obin
)
Rat
Mouse
THB-Val adducts in mice and rat exposed to 3-butene-1,2-diol (BD-
diol)

O
O
O
OH
OH
OH
OHO
Globin
PeptideOH
NOH
OH
OHPeptide
ON
HO
HO
1,3-Butadiene (BD)
1,2-Epoxy-3-butene(EB)
3-Butene-1,2-diol(BD-diol)
3,4-Epoxy-1,2-butanediol(EBD)
1,2:3,4-Diepoxybutane(DEB)
EH
Globin
P450s
P450s
PeptideOH
NOH
EH
Globin
HB-Val THB-Valpyr-Val
P450s
Butadiene Hemoglobin Adducts

Total Ion Chromatogram (ESI+/MS, m/z 100-1100) Of A Tryptic Digest Of Globin From DEB-exposed
Human Red Blood Cells
15 20 25 30 35
Time (min)
0
10
20
30
40
50
60
70
80
90
100
Rel
ativ
e A
bund
ance
37.06
36.34
26.23 34.84
27.1929.7021.1219.70
28.7732.46
25.2117.81 21.95 38.35
23.7116.92
N,N-(2,3-dihydroxybuta-1,4-diyl)VLSPADK
VLSPADK

Human: pyr-Val-Leu*-Ser- Pro-Ala-Asp-Lys/-Thr-Asn-Val-Lys(pyr-hV) V - L - S - P - A - D - K / -T - N - V - K
Mouse: pyr-Val-Leu*-Ser-Gly-Glu-Asp-Lys/-Ser-Asn-Ile-Lys(pyr-mV) V - L - S - G - E - D - K /- S - N - I - K
Rat: pyr-Val-Leu*-Ser-Ala-Asp-Asp-Lys/-Thr-Asn-Ile-Lys(pyr-rV) V - L - S - A - D - D - K / -T - N - I - K
* d3 in Internal standards/ hydrolyzed by trypsin
pyr-Val containing α-N-Terminal Peptides (1-11)
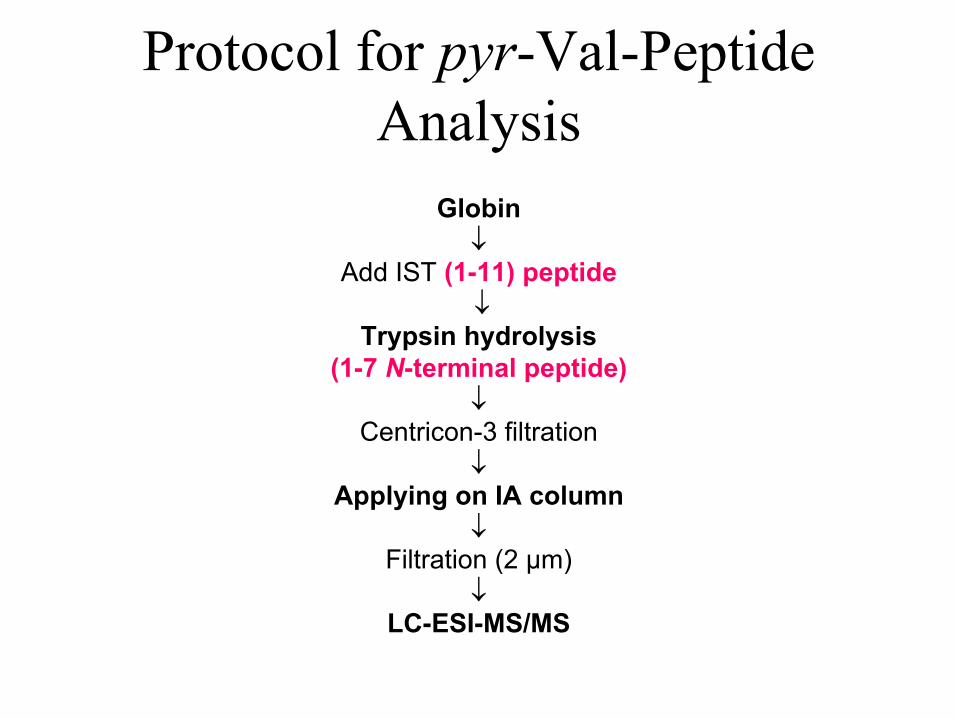
Globin↓
Add IST (1-11) peptide ↓
Trypsin hydrolysis (1-7 N-terminal peptide)
↓Centricon-3 filtration
↓Applying on IA column
↓Filtration (2 µm)
↓LC-ESI-MS/MS
Protocol for pyr-Val-Peptide Analysis

pyr-Val in Mice and Rats Treated with 3 ppm BD
0 2 4 6 8 10 12 14 16 18 20Time (min)
10.07
13.84
10.05
NL: 1.18E5TIC F: + p SRM ms2 833.5 → 158.2pyr-val_188
NL: 1.42E5TIC F: + p SRM ms2 836.5→158.2pyr-val_188
Rel
ativ
e A
bund
ance
50
100
50
100
0
0
A: Mouse 3 ppm 10 days~39.7 pmol/g
NL: 3.03E4
Rel
ativ
e A
bund
ance
50
100
50
100
0
0
10.44
10.44TIC F: + p SRM ms2 833.5 → 158.2 pyr-val_200
NL: 2.01E5TIC F: + p SRM ms2 836.5 → 158.2 pyr-val_200
B: Rat 3 ppm 10 days4.5 pmol/g
0 2 4 6 8 10 12 14 16 18 20Time (min)Boysen et al (2004) Cancer Research, 64:8517-8520

BD-derived globin adducts in mice and rats
Duration Species
Exposure [ppm BD]
HB-Val [pmol/g]
HB-Val ppm BD
pyr-Val [pmol/g]
pyr-Val ppm BD
THB-Val [pmol/g]
THB-Val ppm BD
10 days Mice (B6C3F1)
3 53 ± 7.6 17.7 48.7 ± 3.23 16.2 452 ± 38 150.0 62.5 137 ± 12.2a 1.6 130.4 ± 64 2.1 3410 ± 177 54.6 1250 7143 ± 537 5.7 2487.0 ± 426 2.0 13755 ± 1651 11.0
Rats (F344) 3 13 ± 2.4 4.3 3.9 ± 0.8 1.3 339 ± 41 113.0 62.5 87 ± 7.6 1.4 38.3 ± 1.2 0.6 3202 ± 302 51.2
90 days Rats (Crl:CD®)
Females 1000 8690 ± 930 b 8.6c 58.1 ± 17.3 0.058 c 24066 ± 9292 26.6c Males 1000 5480 ± 2880 b 5.4c 16.7 ± 6.6 0.017 c 12095 ± 3712 12.7c
a One data point was excluded with 95% CI according to Q-test (n=2). b Swenberg et al HEI Report 92, 2000, n=3. c Efficiencies were based on 90 day exposures and were not adjusted per day of exposure.
Boysen et al (2004) Cancer Research, 64:8517-8520
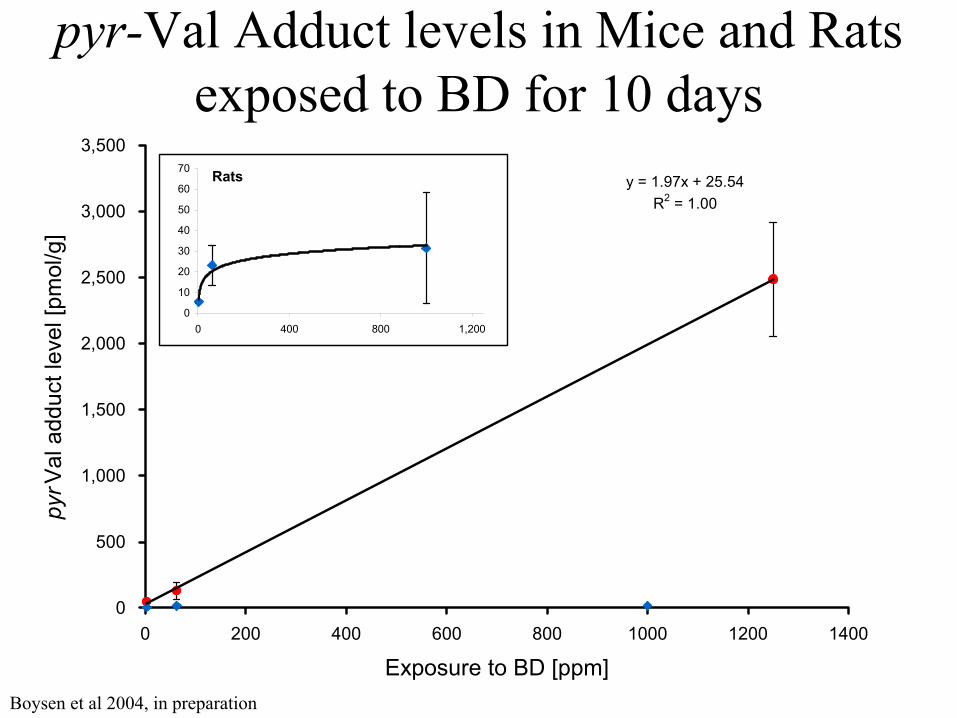
pyr-Val Adduct levels in Mice and Rats exposed to BD for 10 days
�y = 1.97x + 25.54
R2 = 1.00
0
500
1,000
1,500
2,000
2,500
3,000
3,500
0 200 400 600 800 1000 1200 1400
Exposure to BD [ppm]
pyrV
al a
dduc
t lev
el [p
mol
/g]
Rats
0
10
20
30
40
50
60
70
0 400 800 1,200
Boysen et al 2004, in preparation

Dose Response of pyr-V in Mice and Rats Exposed to BD for 4 Weeks
male rats
female rats
male mice
female mice
0
100
200
300
400
500
600
0 10 20 30 40 50 60 70 80
BD Exposure [ppm]
Am
ount
of
pyr
-Val
[pm
ol/g
]
0
4
8
12
16
20
0 25 50 75
male rats
female rats
Future Studies
• Extend the exposure-response data (HB-Val, THB-Val and pry-Val) for mice and rats.
• Compare molecular dose versus mutations in epoxide hydrolase null vs wild type mice.
• Compare molecular dose versus mutations in XPC null versus wild type mice.
• Examine exposure-response and gender effects in BD workers.

Biologically-Based Risk Assessment• Refine estimates of dose to relevant targets
through use of biomarkers of exposure and PBPK modeling
• Improve hazard characterization through a better understanding of the mode(s) of action for endpoints of concern
• Strengthen inferences regarding the shape of dose/response curves outside the range of traditional observations
• Identify/investigate opportunities for research in human populations, such as susceptibility factors

Systematic Characterization of ComprehensiveExposure-Dose-Response Continuum and the Evolution of Protective to Predictive Dose-Response Estimates

Conclusions
• Biomarkers of exposure and effect can identify key events that drive dose-response relationships.
• These responses can be the result of metabolism, cell proliferation and DNA repair.
• Understanding and utilizing these key events in risk assessment will reduce uncertainty and improve accuracy.