Embed Size (px)
Citation preview

1
Frans Mulder
PhD course Jyväskylä 2017
Where are the protons? Measuring and modelling proton equilibria in complex macromolecular systems.
Frans Mulder
Lecture 3 Application of NMR spectroscopy
to study electrostatics
2

2
Acknowledgement
Stina Lindman, Ingemar Andre and Sara Linse Biophysical Chemistry, Lund University
pKa values of ionizable groups in proteins are of interest as electrostatic interactions
play an important role in functional aspects of proteins.
The ability to assign a pKa to a specific ionizable group in a protein (based on its chemical shift)
can aid in the mechanistic description of binding, catalysis, and other behaviour

3
Asp, Glu Tyr & C-term
Lys N-term
net charge
Up-shifted pKa-values far above pI Up- and down-shifted pKa-values close to pI
Asp, Glu Tyr & C-term
Lys N-term
net charge

4
Traditional NMR approaches to pKa determination in proteins:
- 1H 1D - 1H 2D TOCSY
Forman-Kay et al. (1992) Biochemistry 31, 3442-52
Isotope labeling for pKa values by NMR
C C C
C C
NH 3 +
N
O=C
Lysine with 13-C- ε
C C C
N
O=C
Aspartate with 13-C- β
O
O
C C C
N
O=C
Glutamate with 13-C- γ
O
O C
C N
O=C
Uniform 15-N
R

5
pKa values of lysines using 13C and 1H
0.5 mM apo Calbindin D9k (low salt) [Kesvatera et al. (1996), J Mol Biol 259, 828]
The H(C)N experiment correlates amino 15N chemical shift with Hε (Lys) correlates amino 15N chemical shift with Hδ (Arg)
15Nε
13Cδ
13Cζ
1Hδ1Hδ ’
1Hε
15NζH3
13Cε
13Cδ
1Hε1Hε ’
+
6
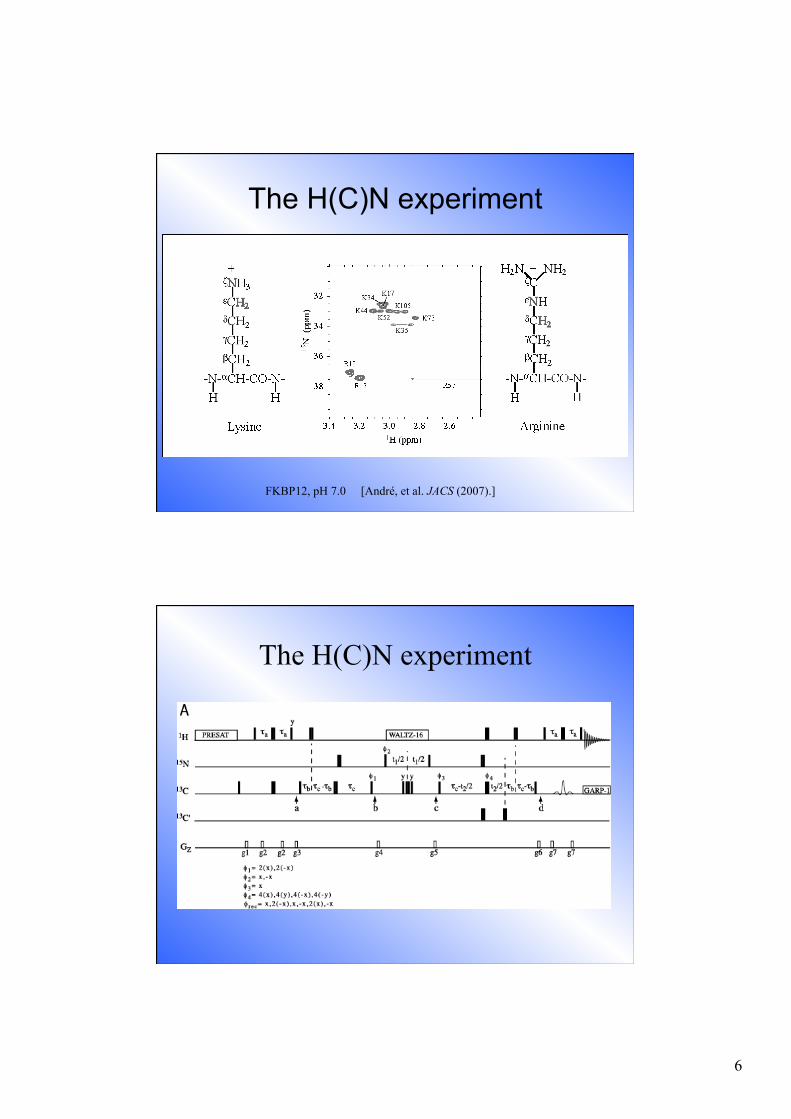
The H(C)N experiment
FKBP12, pH 7.0 [André, et al. JACS (2007).]
The H(C)N experiment

7
The C-TOCSY(N)H experiment
The C-TOCSY(N)H experiment

8
pKa values of lysines from the 15N shift of the titrating group
15Nζ (
ppm
)
2 mM apo calmodulin in 100 mM KCl
pH
[André, et al. JACS (2007).]
δobs =(δHA +δA−10
(pH−pKa ) )(1+10(pH−pKa ) )
Henderson-Hasselbalch equation for NMR titrations
of non-interacting sites

9
pKa values of lysines from the 15N shift of the titrating group
remember, the model pKa = 10.4
[André, et al. JACS (2007).]
with the largest difference in pKa being 0.5 units. All titrationcurves display ideal two-state equilibrium behavior, and goodfits are obtained without introducing a Hill parameter, which issometimes necessary to account for “nonideal” titration curves.46
Due to low signal-to-noise at pH above 12 from the repeatedaddition of base solution, the titration did not yield a gooddefinition of the chemical shift for the neutral species. Neverthe-less, the pKa values could be determined very precisely (within0.1). Note that the uncertainties listed in Table 2 only representthe fitting error, while the largest error is expected to arise fromuncertainty of the pH at larger values. This accounts for an erroron the order of 0.1. Notwithstanding the absolute error in thepKa values, differences in acidity constants obtained frommonitoring the large change in 15N! chemical shift may be assmall as 0.01, allowing extremely small effects of electrostaticenvironments to be quantified.Calmodulin has previously been shown to be stable and
maintain its structure at high pH values, even in the absence ofbound calcium.47 We preformed additional experiments toconfirm that the protein maintained its native structure andcomposition at high pH values. Circular dichroism (S1), 15N-1H and 13C-1H HSQC (S2 and S3), and agarose gel electro-phoresis (S4) were used to demonstrate that calmodulin is stable,maintains its structure, and resists deamidation at high pH valueson the time scale of the titration experiments.
Discussion
pKa values are the most accurate experimental probe ofelectrostatic interactions in proteins, and NMR is the mostgenerally applicable technique to obtain site-specific informationon the titration status of a charged residue. For Lys, Asp, andGlu, 2D-[1H,1H]-TOCSY, 2D-[15N,1H]-HSQC-TOCSY, or 2D-[1H,1H]-NOESY experiments have been used extensively todetermine pKa values.15,18,48-50 Although straightforward inprinciple, these techniques suffer from a number of practicaldrawbacks. Signal overlap is often a considerable problem,especially for larger proteins, due to limited chemical shiftdispersion in the 1H dimension. More seriously, 1H chemicalshifts may sense multiple protonation equilibria simultaneously,resulting in complex titration curves that may be difficult tointerpret. Because of their sensitivity to structure, protons maysometimes even report on rearrangements rather than an actual
titration event. It is not uncommon that protons attached to thesame carbon atom report on different pKa values due to theinfluence of nearby titrating groups or other changes in themicroenvironment.17,48,49,51 These problems can be avoided toa large degree by following the chemical shift of heteronucleiat or near the titrating group. For example, the 13C carboxylshifts accurately report on the electrostatics of aspartic andglutamic acids.21 The determined pKa value is a reliable estimateof the actual pKa value because of the changes in electron densityand resonance structure, transmitted through chemical bonds.In the case of lysines, a number of methods have been used todetermine pKa values. These include indirect methods wherefunctional aspects of the protein are followed. For example, pKavalues have been obtained by monitoring the rate of catalysisor inactivation of an inhibitor as a function of pH.8,12 Thesetypes of methods do not provide site-specific information andwill be useful only in cases where a limited number of titratingresidues contribute to the observed effect and only for proteinsthat have a pH-dependent property amenable to characterization.The pH-dependent stability of a protein can be interpreted interms of pKa shifts between the folded and unfolded state sothat the average charge state of the lysine residues can bedetermined. Selective 13C labeling of lysine residues has beenused to obtain pKa values by following 2D-[Hϵ,Cϵ]11 or 2D-[Hδ,Cδ]30 correlations as a function of pH. The drawback ofthis method is that the carbon chemical shift changes are smalland potentially influenced by titrating groups in the surroundingarea. Moreover, the selectively labeled protein sample is oflimited use for other applications. Selective labeling with 15Nhas been used in determination of pKa values in mellitin by15N spectroscopy.19 However, assignment of the 15N resonancesrequired site-specific labeling through solid-phase synthesis19
or that the lysines are removed selectively by mutation. Inanother method, the lysine residues are chemically modifiedwith 13C-labeled mono- or dimethyl groups, as demonstratedfor calmodulin10 and calbindin D9k.52 This method yields simplespectra, but there is great risk that the chemical modificationperturbs the time-averaged protein structure and induces biasin the population of side-chain conformers, both of which changethe pKa values of the modified residues. In addition, methylationinduces an offset in the pKa. For these samples the assignmentproblem remains the same as for selectively 15N-labeled lysineresidues mentioned above.To supersede existing methodology we developed an NMR
method to determine pKa values of lysine and arginine residues,which can be applied to uniformly 15N/13C-labeled proteins. Inthis method 2D-[Hϵ,N!] (Lys) and 2D-[Hδ,Nϵ] (Arg) correlationsare recorded in a single experiment as a function of pH. Sincenonexchangeable protons are used for excitation and detectionthese experiments are applicable over the full range of pH andtemperature. In the case of arginine the head group charge isdelocalized over the entire Nϵ-C#-(NH2)2 moiety, such thatNϵ is a suitable reporter for the arginine charge state. For lysinethe N! nucleus is directly bonded to the titrating proton, whichyields significant chemical shift changes between the protonatedand unprotonated forms. As chemical shifts can be measuredwith great precision this results in very precise data for thetitration event. Furthermore, high accuracy is achieved because
(46) Markley, J. L. Acc. Chem. Res. 1975, 8, 70-80.(47) Huque, M. E.; Vogel, H. J. J. Protein Chem. 1993, 12, 695-707.(48) Perez-Canadillas, J. M.; Campos-Olivas, R.; Lacadena, J.; Martinez, del
Pozo, A.; Gavilanes, J. G.; Santoro, J.; Rico, M.; Bruix, M. Biochemistry1998, 37, 15865-15876.
(49) Song, J.; Laskowski, M., Jr.; Qasim, M. A.; Markley, J. L. Biochemistry2003, 42, 6380-6391.
(50) Sundd, M.; Iverson, N.; Ibarra-Molero, B.; Sanchez-Ruiz, J. M.; Robertson,A. D. Biochemistry 2002, 41, 7586-7596.
(51) Lindman, S.; Linse, S.; Mulder, F. A.; Andre, I. Biochemistry 2006, 45,13993-14002.
(52) Zhang, M.; Thulin, E.; Vogel, H. J. J. Protein Chem. 1994, 13, 527-535.
Table 2. pKa Values of Lysine Residues in apo Calmodulin AsDetermined from N# or Hϵ at 25 °C in 100 mM KCl; K(x) IndicatesThat the Residue Is Not Assigned
residue N# Hϵ N#+ Hϵ
K13 10.74 ( 0.02 10.72 ( 0.06 10.74 ( 0.02K94 11.03 ( 0.03 11.21 ( 0.08 11.05 ( 0.04K(3) 11.22 ( 0.03 11.14 ( 0.14 11.22 ( 0.05K(4) 11.04 ( 0.02 11.10 ( 0.09 11.04 ( 0.02K(5) 11.03 ( 0.02 11.05 ( 0.07 11.02 ( 0.02K(6) 10.92 ( 0.01 10.81 ( 0.07 10.93 ( 0.02K(7) 10.80 ( 0.01 10.81 ( 0.08 10.80 ( 0.02K(8) 10.93 ( 0.02 10.95 ( 0.08 10.93 ( 0.03
A R T I C L E S Andre et al.
H J. AM. CHEM. SOC.
pH-dependent stability to unfolding for the B1 domain of protein G
• Variant to ensure unprocessed protein
• Contains 2 extra negative charges, D8 and D37
• Total of 12 side-chain carboxyl groups
β1
β4
β3
β2
PGB1-QDD

10
2.5-3 3-3.5 3.5-4 pKa: 4-4.5 4.5-5 5-6.5
Model
Color coding according to pKa
13Cγ
13Cβ
13Cα13C’15N
1Hβ1Hβ ’
13C’
OH O
The H(C)CO experiment correlates carboxyl 13C chemical shift with Hβ or Hγ
For Asp:
[ Oda et. al, Biochemistry 33 (1994) 5275]

11
Spectrum at pH 5 good dispersion and sensitivity
Spectra pH 2-5

12
δobs =(δHA +δA−10
nh (pH−pKa ) )(1+10nh (pH−pKa ) )
Henderson-Hasselbalch equation: a Hill parameter is now necessary to
fit the data Hill parameter to account for cooperativity
0M : 4.6
0.5M : 4.6
0M : 4.8
0.5M : 4.8
0M : 4.8
0.5M : 4.5
0M : 3.8
0.5M : 4.0
0M : 3.8
0.5M : 3.8
pKa values of side-chain carboxyl groups at 0 M and 0.5 M NaCl
Glu
pKa model=4.4

13
0M : 3.8
0.5M : 3.8
pKa values of side-chain carboxyl groups at 0 M and 0.5 M NaCl: zoom in
Asp pKa model=4.0
0M : 2.9
0.5M : 3.2
0M : 6.6
0M : 4.9
0.5M : 4.6
0M : 4.2
0.5M : 4.1
0M : 3.1
0.5M : 3.3
0M : 3.8
0.5M : 3.8
0M : 4.1
0.5M : 4.0
0.5M : 6.1
pKa values continued

14
Ø PBC = first derivative of the titration curve with respect to
pH
Ø Curve fitting with Hill-parameter
cannot account for asymmetric titration curves
Proton Binding Capacitance (PBC)
Highly downshifted
Slightly upshifted
Highly upshifted
Slightly down-shifted
PBC and titration asymmetry

15
Low salt
High salt
• Derivative of titration curve explains cooperativity and negative-cooperativity
• Titration behavior approaches model with addition of salt
Salt dependence of Glu pKa
Cooperativity of Asp
Low salt
High salt
• Derivative of titration curves explain cooperativity and negative-cooperativity
• Titration behavior approaches model with addition of salt

16
pKa values for Asp8 from 13C and 1H chemical shifts
Major differences between the two protons!
pKa CO: 4.9
pKa Hβ1: 5.8
pKa Hβ2: 4.7
Carbonyl 13C shifts for Asp47 and Ala48 report pKa value of Asp47 carboxyl group
pKa carboxyl group of D47: 3.1
pKa carbonyl group of D47: 3.2
pKa carbonyl group of A48: 3.3

17
pKa carboxyl group of E56: 3.8
pKa carbonyl group of K10: 3.8
Carbonyl shifts report on hydrogen bonds
How to calculate pH-dependent stability based on pKa values
∑ ∫ −=Δi
FpH
U pH)(3.2)( δδ iiU qqRTpHG
pH)(pKn iah101
1−+
−=iq
)pK(pHn iah101
1−+
=iq
• Experimental pKa values for native state
• Denatured state treated as random coil and pKa values were calculated using a Gausssian chain model [ Zhou, PNAS 99 (2002), 3569]

18
Denaturation data
pH dependent stability calculated from pKa values
pKa values explain pH-dependent stability
[ Lindman et. al, Biophys J. (2010) 99:3365-73]
Conclusions -1 • chemical shifts of 13C and 15N in protein are specific
and accurate reporters of side chain protonation states • carefully designed NMR experiments can monitor the
heteronuclear chemical shifts in 2D spectra with high sensitivity and good resolution
• site-specific protonation constants can be determined

19
Conclusions -2 • pKa values show that pH-dependent stability can be
explained purely by electrostatics • Electrostatic contributions to protein stability are
small (but not to kinetics …!)
• There is clear evidence of local electrostatic coupling between acidic side chains in PGB1, but not for basic side chains in apo CaM
• We directly detect - for the first time - asymmetry in the pH-dependent protonation of individual acidic groups in proteins as a result of the change in protein electrostatic energies with pH