Embed Size (px)
Citation preview

00
Exploring barriers to remittances in sub-Saharan African series
Volume 1
Where are the flows?
April 2018
Authors
Barry Cooper
Cat Denoon-Stevens
Rose Tuyeni Peter
Antonia Esser
Centre for Financial Regulation & Inclusion
Tel. +27 21 913 9510
Email: [email protected]
The Vineyards Office Estate Farm 1, Block A 99 Jip de Jager Drive Bellville, 7530 South Africa PO Box 5966 Tygervalley, 7535 South Africa www.cenfri.org
2
Table of contents
Acronyms 3
1. Introduction 4
2. Understanding remittance flows in sub-Saharan Africa 9
2.1 Remittance-receiving countries 9
2.2 Primary SSA remittance-sending countries 14
2.3 Matching migration patterns with remittance flows 15
2.4 Characteristics of remittance-receiving countries 20
2.5 Conclusion 23
3. Bibliography 24
4. Appendices 28
4.1 Appendix A: Economic importance of remittances for SSA countries 28
4.2 Appendix B: Supporting tables for primary remittance-sending countries 31
4.3 Appendix C: Where are migrants remitting to? 32

3
Acronyms
ACH Automated clearing house
ADLA Authorised dealers with limited authority
AML/CFT Anti-money laundering and the combating of financing of terrorism
DRIS Diaspora remittance incentive scheme
FATF Financial Action Task Force
FDI Foreign Direct Investment
GDP Gross domestic product
ID Identification document
IMTS Informal money transfer service
MMO Mobile money operator
MNO Mobile network operator
MTO Money transfer operator
ODA Official development assistance
RBZ Reserve Bank of Zimbabwe
RSP Remittance Service Provider
SSA Sub-Sahara Africa

Where are the flows?| April 2018 4
1. Introduction
A lifeline for households. Remittances are non-reciprocal transfers of money from an individual or
household in one place to another individual or household in another place1 (Hougaard, 2008). They
can take many forms but are typically associated with working migrants that send regular amounts of
money to support their families and communities back home. The advantage of these payments is
that they usually flow directly into the hands of households, increasing household incomes and
reducing the likelihood of households falling into poverty (International Organisation for Migration,
2005). This monetary support has positive effects on both education and health outcomes,
supporting human capital development particularly in children (Gupta & Pattillo CA, 2009; Hassan,
Chowdhury, & Shakur, 2017).
An important capital flow. Remittances are also important at a macroeconomic level, as they are a
vital source of funds globally, but especially for sub-Saharan Africa (SSA). Today, their value is almost
equal to traditional foreign capital sources flowing into the region, such as overseas development
assistance (ODA) and foreign direct investment (FDI). Figure 1 shows that, while the flows of both FDI
and ODA into SSA have been declining since 2011, the value of remittances has been steadily
increasing over this period, albeit with a slight decline in 2016. In 2015, the region received
USD39 billion in FDI and USD37.1 billion in ODA2, compared to USD34.6 billion in remittances. The
values of FDI and remittances declined slightly in 2016, with SSA receiving USD38.2 billion in FDI and
USD34.4 billion in remittances.
1Remittances can be “domestic”, meaning that the sender and receiver of the remittances are within the same country (but still in disparate locations), or “international”, meaning that the sender transfers money from one country to a recipient in another country (Hougaard, 2008). 2 The most recent ODA data from the World Bank is from 2015.

Where are the flows?| April 2018 5
Figure 1: Remittance flows compared for ODA and FDI in SSA
Source: World Bank remittance data, 2017c; World Bank ODA data, 2016a; World Bank FDI data, 2017a
May be a better vehicle for development than foreign aid. Studies have found that although foreign
aid has a positive impact on indicators such as savings and investment in SSA countries, remittances
have a much greater effect on these development outcomes (Balde, 2011). In fact, Stojanov and
Strielkowski (2013) have found that due to the magnitude and more efficient absorption of
remittances compared to ODA, remittances have a stronger net impact on increasing gross domestic
product (GDP) per capita than ODA has. In addition to this, unlike ODA and FDI, remittance flows are
often not significantly affected by economic crisis (Stojanov & Strielkowski, 2013); some studies have
found that they are counter-cyclical in nature (Frankel, 2010). It should be noted that these studies
do not argue that ODA has no positive impact, but rather that remittances may be a more efficient,
impactful and resilient form of development assistance than ODA.
An opportunity to expand digital payments. Given that remittances are often the first point of
contact with formal financial services for many consumers, this represents an opportunity for the
expansion of digital payments though remittance transfers. In fact, studies have shown that there is a
significant and positive relationship between remittances and financial-sector development, and with
increased breadth and depth of bank account usage (World Bank Development Research Group, the
Better Than Cash Alliance, and the Bill & Melinda Gates Foundation, 2014).
Large share of flows intra-regional. A significant number of the remittances received by SSA
countries are sent from within the region. Since 2011, the share and value of remittances received
from within the region has been increasing, from USD10.9 billion (36% of remittances received) in
2011 to USD14.9 billion (43% of remittances received) in 2016. To get a sense of how important this
is as a revenue source, consider that this amount is greater than all of the region’s mineral exports3
to the rest of the world (World Integrated Trade Solutions, 2017).
3 SSA exported USD11.5 billion in minerals in 2016 (World Integrated Trade Solutions, 2017).
30.5
34.6 34.4
10.9
15.7 14.9
41.1 37.1
40.539.0 38.2
0
5
10
15
20
25
30
35
40
45
50
2011 2012 2013 2014 2015 2016
USD
bill
ion
s
To countries in SSA From countries in SSA ODA FDI

Where are the flows?| April 2018 6
Flows into SSA relatively low. Despite their relative magnitude, the formal remittance flows between and into SSA countries are heavily constrained when compared to other regions in the world. The East Asia and Pacific region received the most in 2015 (with USD127 billion), followed by South Asia with USD118 billion, then Latin America and the Caribbean with USD67 billion, and the Middle East and North Africa (MENA) with USD50 billion. This means that the USD34.6 billion received by SSA countries in 2015 accounted for only 8.5% of the USD413.6 billion in remittances sent to developing countries in 2015 (World Bank, 2016b), despite being home to 14% of the migrants in the developing world (United Nations, 2015)4.
Significant barriers undermine true potential. On average, SSA is the most expensive region in the
world to send remittances to. Currently, the average cost of sending remittances to SSA is 9.1% of
the value of the transaction, compared to the global average of 7.2% (World Bank, 2017e)5. In fact,
for some countries, remittance fees can make up 22% of the transfer value6. The lack of convenient
access points to remittance service providers (RSPs) for “cashing in” or “cashing out” remittances
increases the opportunity costs to the consumer. Most senders and recipients in SSA conduct these
transactions in cash and hence rely on proximate remittance access points to deposit or withdraw
funds. In addition, RSPs usually require official documentation, such as national identification
documents (IDs) or proof of address when sending or receiving remittances. These are often hard to
obtain, particularly for those consumers who live in rural areas or those who have immigrated to a
country without documentation7 (Bester, et al., 2008). The barriers to the seamless and inclusive
working of a remittance channel are typically classified as either first-mile, middle-mile or last-mile
barriers (see Box 1).
4 There are a total of 168 million migrants from the developing world, and their breakdown by region is as follows: 38 million (23% of the total) are from South Asia, 34 million (20%) are from Latin America and the Caribbean, 30 million (12%) are from East Asia and the Pacific, 24 million (14%) are from SSA, 22 million (13%) are from MENA, and 21 million (12%) are from Europe and Central Asia (United Nations, 2015). 5 The average total costs quoted here reflect the cost of sending remittances in the third quarter of 2017 according to the Remittance Prices Worldwide website (World Bank, 2017e). 6 This value refers to the total average cost of transferring NGN40,000 (roughly USD200) from Nigeria to either Benin, Mali or Togo in the third quarter of 2017 (World Bank, 2017f). 7 Regulators and financial institutions are required to comply with Financial Action Task Force (FATF) guidelines on Anti-Money Laundering and Combating the Financing of Terrorism (AML/CFT) requirements, which require that certain identification documentation (ID) be present in order to use certain financial services, of which money transfer is one. The lack of official national ID and address systems in SSA often means that people in rural areas cannot access financial services due to regulatory barriers. For undocumented migrants, the precarity of their immigration status often precludes them from accessing official identification altogether, thus creating a barrier to accessing formal financial services. (Bester, et al., 2008).

Where are the flows?| April 2018 7
Box 1: The first, middle and last mile of remittance service provision
There are a number of different participants and service providers along what is described as the first, middle and last mile of the remittance value chain, which is illustrated in Figure 2 below.
Figure 2: First, middle and last mile of service remittances
Source: Authors’ own
First mile. At the first mile of remittance delivery, the sender makes the payment instruction and pays for the transaction. At this point, the personal information of senders and receivers is collected and the sender is provided with all the relevant information regarding the transfer (including pricing, documentary requirements, transaction identification details and information about the collection process). Many different types of RSPs offer remittance transfer in the first mile, such as commercial banks, money transfer operators (MTOs), mobile network operators (MNOs) or mobile money operators (MMOs), and informal money transfer services (IMTSs), just to name a few.
Middle mile. At the middle mile, the information is exchanged between the first-mile and last-mile institutions. At the clearing stage, the payment message is transferred from the first-mile operator to its counterpart at the last mile via various channels such as SWIFT, automated clearing houses (ACHs), hubs, switches or telephonic transactions, among other methods. The funds are injected in the system as fiat, e-fiat or mobile money, cryptocurrency, protocol or card. At the settlement stage, the funds are settled between sending and receiving institution. This stage can be cut out if no settlement is necessary, for example when transfers occur between branches of the same bank.
Last mile. At the last mile of remittances delivery, the recipient receives the funds. In SSA, most recipients still collect funds at a physical location in cash from a paying-out agent such as a bank, MTO, MNO, merchant or IMTS.
Source: International Organisation for Migration, 2017

Where are the flows?| April 2018 8
Barriers drive informality. Consumers that rely on remittances often have no choice but to accept
excessive costs. In many cases, however, the combination of barriers means that they often prefer to
use informal, less secure services to meet their needs, as these provide greater value to consumers
than formal alternatives. A FinMark Trust (2016) study on remittance corridors in Southern Africa
found that informal RSPs tend to have ties to the communities of both the senders and receivers of
remittances, meaning that they are more familiar, accessible, and trusted than formal providers.
Informal remittance channels can be as simple as sending money through friends and relatives who
are travelling, or using public transport providers such as buses and taxis. However, in many cases
informal RSPs are leveraging off very sophisticated back-end systems to provide low-cost and
efficient payments, which are processed almost instantaneously (FinMark Trust, 2016).
Global drive to reduce cost barriers. Due to their increasing value and importance, remittances have
gained prominence on the global policy agenda. The United Nations (UN) Sustainable Development
Goals’ (SDGs) Addis Agenda commits to facilitating the flow of remittances. Signatories to the SDGs
pledge to reduce the average transaction costs of remittances to less than 3% of the amount
transferred by 2030, with no corridor costing more than 5% (World Bank, 2016c). There is a growing
movement of new players and existing RSPs that are introducing innovative remittance products and
channels to new corridors into and within SSA.
Understanding barriers in the SSA context. In light of these dynamics, this seven-part study series
seeks to provide an overview of the remittances market, gaps and barriers in SSA, conclude on what
is required to reduce supply-side barriers and enable the formal market to fulfil its true potential. The
study is organised as follows:
• Volume 1 provides an overview of key remittance corridors in SSA, from the perspective of both
the receiving and sending countries. It analyses the correlation between migration and
remittances and introduces a categorisation of countries.
• Volume 2 outlines the supply-side barriers to the efficient flow of remittances in SSA.
• Volumes 3 to 6 explore how the barriers manifest in the region by presenting four country case
studies from SSA.
• Volume 7 adds conclusions and recommendations for the region.
Where are the flows?| April 2018 9
2. Understanding remittance flows in sub-Saharan Africa
This chapter provides an overview of the current landscape of formal remittance flows, both to and within SSA. In 2016, USD34.4 billion in remittances flowed into SSA and USD14.9 billion flowed between countries in SSA. To gain a more granular understanding of the current flows, we use World Bank remittance data of both sending and receiving value to determine the key remittance receiving and sending countries in the region. To smooth out the potential effects of outliers and to present a better overview of the trends, the figures discussed in this section represent five-year averages of remittance flows, unless otherwise stated. The following sub-section then compares these flows to migration patterns for these key countries to determine whether the remittance flows match migration flows. Migrants are a core driver of remittances; and, consequently, if there are many migrants in one country but the formal remittance flow is small, there are likely to be barriers to formal remittance provision in the market – providing an opportunity for intervention. Finally, Sub-section 2.4 analyses various SSA countries according to migrant and remittance flows.
2.1 Remittance-receiving countries
This section ranks the countries in SSA by the value of formal remittances they receive. The average value of remittances received over the past five years, remittances per capita and remittances as a share of GDP are used to determine the relative economic importance of remittances for a country.
2.1.1 Top SSA remittance-receiving countries
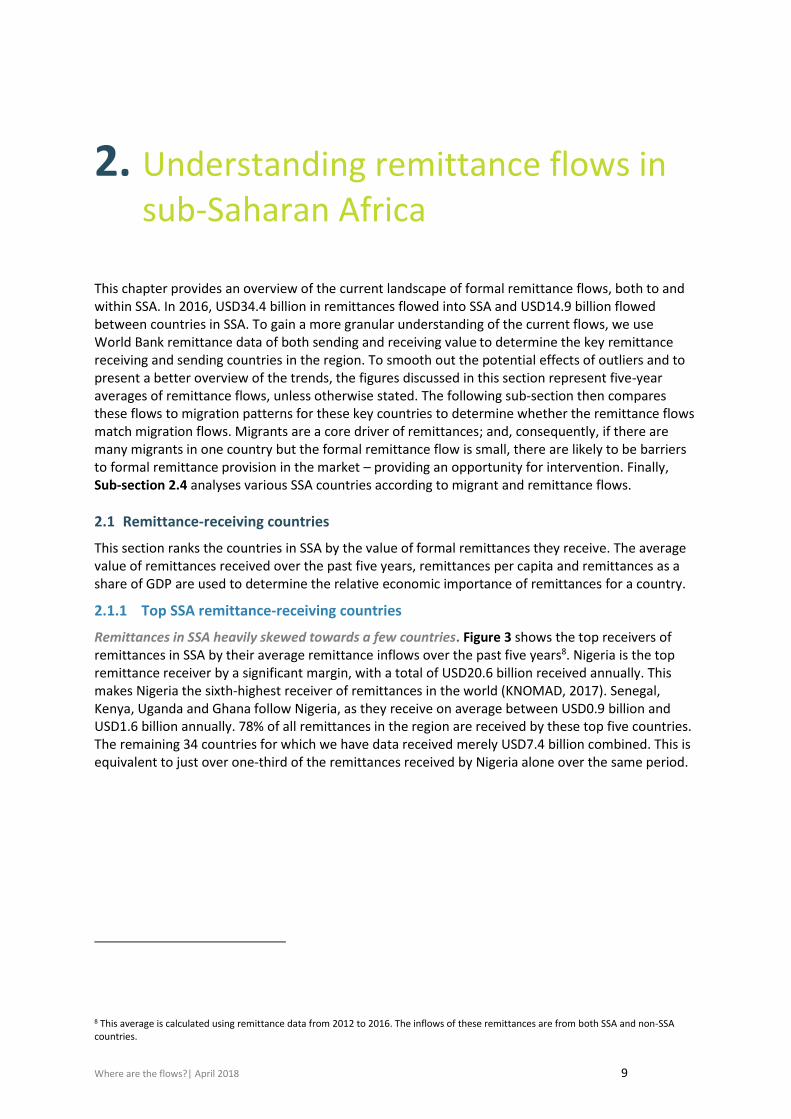
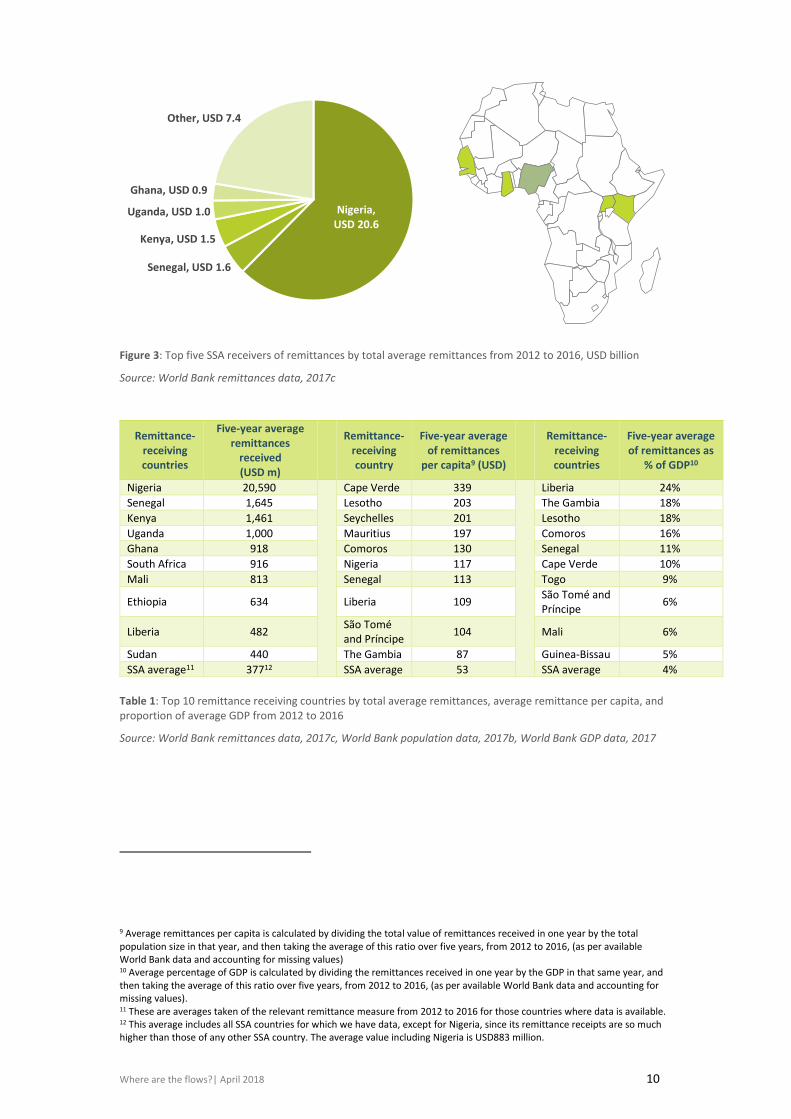
Remittances in SSA heavily skewed towards a few countries. Figure 3 shows the top receivers of remittances in SSA by their average remittance inflows over the past five years8. Nigeria is the top remittance receiver by a significant margin, with a total of USD20.6 billion received annually. This makes Nigeria the sixth-highest receiver of remittances in the world (KNOMAD, 2017). Senegal, Kenya, Uganda and Ghana follow Nigeria, as they receive on average between USD0.9 billion and USD1.6 billion annually. 78% of all remittances in the region are received by these top five countries. The remaining 34 countries for which we have data received merely USD7.4 billion combined. This is equivalent to just over one-third of the remittances received by Nigeria alone over the same period.
8 This average is calculated using remittance data from 2012 to 2016. The inflows of these remittances are from both SSA and non-SSA countries.
Where are the flows?| April 2018 10
Figure 3: Top five SSA receivers of remittances by total average remittances from 2012 to 2016, USD billion
Source: World Bank remittances data, 2017c
Table 1: Top 10 remittance receiving countries by total average remittances, average remittance per capita, and proportion of average GDP from 2012 to 2016
Source: World Bank remittances data, 2017c, World Bank population data, 2017b, World Bank GDP data, 2017
9 Average remittances per capita is calculated by dividing the total value of remittances received in one year by the total population size in that year, and then taking the average of this ratio over five years, from 2012 to 2016, (as per available World Bank data and accounting for missing values) 10 Average percentage of GDP is calculated by dividing the remittances received in one year by the GDP in that same year, and then taking the average of this ratio over five years, from 2012 to 2016, (as per available World Bank data and accounting for missing values). 11 These are averages taken of the relevant remittance measure from 2012 to 2016 for those countries where data is available. 12 This average includes all SSA countries for which we have data, except for Nigeria, since its remittance receipts are so much higher than those of any other SSA country. The average value including Nigeria is USD883 million.
Remittance-receiving countries
Five-year average remittances
received (USD m)
Remittance-
receiving country
Five-year average of remittances
per capita9 (USD)
Remittance-receiving countries
Five-year average of remittances as
% of GDP10
Nigeria 20,590
Cape Verde 339
Liberia 24%
Senegal 1,645 Lesotho 203 The Gambia 18%
Kenya 1,461 Seychelles 201 Lesotho 18%
Uganda 1,000 Mauritius 197 Comoros 16%
Ghana 918 Comoros 130 Senegal 11%
South Africa 916 Nigeria 117 Cape Verde 10%
Mali 813 Senegal 113 Togo 9%
Ethiopia 634 Liberia 109 São Tomé and Príncipe
6%
Liberia 482 São Tomé and Príncipe
104 Mali 6%
Sudan 440 The Gambia 87 Guinea-Bissau 5%
SSA average11 37712 SSA average 53 SSA average 4%
Nigeria, USD 20.6
Senegal, USD 1.6
Kenya, USD 1.5
Uganda, USD 1.0
Ghana, USD 0.9
Other, USD 7.4

Where are the flows?| April 2018 11
Economic importance of remittances. In addition to the average value of remittances received over the past five years, Table 1 above ranks the top ten SSA countries according to remittances received per capita and the average remittances as a percentage of the country’s GDP over the same time13. The latter two help us to better understand the importance of remittances to individuals in a country, as well as to the economy.
Remittances a major source of income for many SSA countries. Table 1 shows that even though some countries may not receive large values of remittances, remittances are still important for their economies, with countries such as Cape Verde receiving USD339 per person in remittances annually and six countries receiving the equivalent of 10% or more of their GDP in remittances. For countries such as Liberia, The Gambia and Lesotho, remittances shown as a percentage of GDP are comparable to the GDP contribution of some of their major industries. The economic importance of remittances has been increasing for the region as a whole. Between 2012 and 2016, remittances per capita grew from USD50 to USD58, and remittances as a percentage of GDP increased from 3.5% to 5%.
One-third of remittances being intra-SSA, with this share growing. Almost one-third of the
total remittance flows to SSA countries come from other SSA countries. Much like the flows
from outside the region into SSA, remittances received from other SSA countries are skewed
towards a few nations. The top five recipients take home 74% of the remittances of all
remittance receipts from SSA countries, with Nigeria receiving 55% of this total. Intra-SSA
remittance flows are growing faster than flows from outside the region, increasing by 22%
between 2012 and 2016, while flows from outside SSA into the region only increased by 7%
over the same period. This presents a compelling business case for investing further into the
development of efficient remittance channels within SSA. See Appendix A for a more
detailed discussion of intra-SSA flows.
2.1.2 Who are the senders of these remittances?
United States and United Kingdom top senders, but considerable flows from within SSA. Remittances flow along a value chain that runs from sender to receiver. To truly understand what drives these flows, one needs to understand which countries are driving flows into the continent. Table 2 matches the top 10 remittance-receiving countries in SSA with the top 10 senders of remittances to SSA.
13 It should be noted that remittances as a percentage of GDP should not be interpreted as the contribution made to GDP by remittances, as this is not within the scope of this study, but rather remittances simply expressed as a percentage of GDP. This measure is an indicator of relative economic importance, not a measure of the share of economic output attributable to remittances.

Where are the flows?| April 2018 12
Top remittance-receiving countries
Top remittance-sending countries
Five-year average sent to SSA (USD m)
Nigeria Senegal Kenya Uganda Ghana South Africa
Mali Ethiopia Liberia Sudan
United States 7,386 ✓ ✓ ✓ ✓ ✓ ✓ ✓ ✓ ✓
United Kingdom 5,077 ✓ ✓ ✓ ✓ ✓ ✓
Cameroon 2,085 ✓
Italy 1,517 ✓ ✓ ✓ ✓ ✓
France 1,377 ✓ ✓
Spain 1,106 ✓ ✓ ✓
Côte d'Ivoire 1,025 ✓ ✓ ✓ ✓ ✓
South Africa 900 ✓ ✓ ✓
Germany 845 ✓ ✓ ✓ ✓ ✓
Ghana 814 ✓ ✓
Table 2: Top 10 senders of remittances to SSA countries and top 10 receivers of remittances in SSA from 2012 to 2016
Source: World Bank remittance data, 2017c
The top five senders of remittances in Table 2 constitute 54% of all remittances sent to SSA, with the United States and the United Kingdom topping the list with USD7.4 billion and USD5.1 billion, respectively. Notably, four of the top 10 senders are from SSA, which indicates a strong source of capital from within the region.
Box 2: Remittances from the United Kingdom (UK) to SSA
Important source of remittances for many SSA countries. Figure 4 illustrates the top five
recipients in SSA of remittances from the UK. It shows that Nigeria receives the lion’s share of
remittances, with USD3.8 billion, followed by Kenya, Uganda, South Africa and Ghana. These
countries are among the top source countries of migrants from SSA to the UK. Somalia and
Zimbabwe are also among the top migration source countries for the UK, and the UK has been
recognised as a major source of remittances for both these countries (UK Government, 2015;
Mhlanga, 2017), but due to a lack of World Bank data on these countries, they are not included in
this analysis14.
14 The gap in data for Zimbabwe and Somalia is discussed in more detail in Box 3 and Note 2 of this series.

Where are the flows?| April 2018 13
Figure 4: Top five SSA receivers of remittances from the UK between 2012 and 2016, USD m
Source: World Bank remittances data 2017c
Even more important than FDI or ODA. Along with being the second-largest sender of remittances
to SSA, the UK is the second-largest ODA-contributing country to Africa15. Figure 5 below compares
the growth of remittances over the five-year period from 2012 to 2016 to that of ODA and FDI.
In 2016, an estimated USD5.3 billion in remittances was sent from the UK to SSA, compared to only
USD3.8 billion in ODA and a net disinvestment of USD8.5 billion in FDI. This indicates that between
2015 and 2016, remittance flows from the UK outstripped the value of flows from ODA and FDI
combined.
Figure 5: Total ODA, FDI and remittances received by SSA from the UK between 2012 and 2016, USD billions16
Source: Department for International Development, 2015; Department for International Development, 2017; Office for National Statistics, 2017; World Bank remittances data, 2017c
3.4
3.9
4.3 4.2 3.9
2.6
5.1
4.2
0.3
-8.5
5.0
4.9
4.9 5.2 5.3
-10
-8
-6
-4
-2
0
2
4
6
2012 2013 2014 2015 2016
USD
Bill
ion
s
ODA FDI Remittances
Nigeria, 3 763
Kenya, 505
Uganda, 247
South Africa, 245
Ghana, 123
Other, 197

Where are the flows?| April 2018 14
2.2 Primary SSA remittance-sending countries
In total, SSA receives more remittances than it sends, which is unsurprising given the net emigration trend in the region. Sending is, however, still a significant use case. On average, between 2012 and 2016, SSA countries sent USD14.2 billion in remittances annually. Most of these remittances were sent to fellow SSA countries, showing a growing intra-SSA market. Barriers to remittance provision do not only exist in the receiving end of remittance (i.e. the last mile in the remittance value chain) but also at the sending point (i.e. the first mile). The following sections analyse the sending patterns and top senders both to the rest of the world and to other SSA countries.
The top five countries sending almost 50% of remittances, mostly to others in the region. Figure 6 shows the composition of remittances sent by country. The top five senders of remittances are Cameroon (USD2.3 billion), South Africa (USD2 billion), Côte d’Ivoire (USD1 billion), Ghana (USD0.8 billion) and Gabon (USD0.8 billion). Together they sent on average 49% of remittances in SSA between 2012 and 2016. 76% of all remittances sent in the region are sent to other SSA countries.
Figure 6: Top five senders of remittances in SSA in USD billions; on average between 2012 to 2016
Source: World Bank remittance data, 2017c
Sending patterns suggesting first-mile business case. Appendix B ranks remittance-sending countries by average remittances, remittances per capita and remittances as a percentage of GDP. Remittances sent from The Gambia equate to almost a quarter of the country’s GDP, while the average sent from the region is equal to 3% of the region’s GDP. Several of the top-ranked countries by remittances as a percentage of GDP sent the equivalent of 5%
15 The UK was in fact the fourth-largest donor in 2015, with USD4.2 billion in ODA, behind the US with USD9.3 billion, EU Institutions with USD6.2 billion, and the World Bank’s International Development Association with USD5.2 billion (Department for International Development, 2017). 16 ODA and FDI figures reflect flows to the whole of Africa, not only SSA.
Cameroon, USD 2.3
South Africa,
USD 2.0
Côte d'Ivoire, USD 1.0
Ghana, USD 0.8 Gabon,
USD 0.8
Other, USD 7.3

Where are the flows?| April 2018 15
or more of their GDP in remittances. This shows that sending remittances is an important use case for SSA consumers and that due consideration is needed of the first-mile barriers in the region, and not just of the last-mile barriers.
Half of the top remittance senders sending primarily to Nigeria. Most remittances that
originate from West African countries are sent to Nigeria17. This should come as no surprise
if one considers that Nigeria receives just over half of all the remittances sent from other
SSA countries. Other primary recipient countries of remittances from SSA comprise mainly
trading partners (such as China and India), neighbouring countries (such as Nigeria and
Cameroon, Côte d’Ivoire and Ghana, and Lesotho and South Africa) and countries that share
important cultural and economic ties (such as France and francophone West African states).
Strong evidence that cost savings from common currency unions increase remittance flows. Half of the top 10 senders and three of the top receivers in Table 5, as outlined in Appendix B, are in common currency unions. Cameroon, Gabon and Chad are part of the Economic and Monetary Community of Central Africa18, and Côte d’Ivoire, Mali, Senegal and Benin are part of the Economic and Monetary Community of West Africa19. Both these monetary areas use CFA francs as currency, which is pegged to the euro20. Table 5 in Appendix B shows that countries that are in common currency unions tend to send more remittances to one another21. This is significant because one of the primary barriers to remittances is the high cost of sending, and one of the drivers of this high cost is the foreign exchange fees and spreads. Therefore, if countries share a currency, this removes one of the primary cost drivers for remittances.
2.3 Matching migration patterns with remittance flows22
Informal flows vast and unreported. The World Bank remittance data, used throughout this
report, is based on formal IMF balance of payments data (World Bank, n.d.). However, it is
well known that there is a high and increasing level of informality in the remittance market,
which oftentimes vastly exceeds formal flows. Freund and Spatafora (2005) estimated that,
globally, between 35% and 75% of remittances are sent informally. In fact, they estimated
that as much as 70% of remittances sent from France to Mali and Senegal move through
informal channels (Freund & Spatafora, 2005). The Ministry of Congolese Abroad estimated
that USD9 billion in remittances flow into the country, which amounts to almost 30% of the
DRC’s GDP (Hougaard, et al., 2016), compared to only USD16 million recorded in formal
flows. This means that it is possible that actual figures of remittances received by SSA
countries may be anywhere from USD43 billion to USD55 billion, as opposed to the
USD31.5 billion estimated here. In the absence of reliable data on informal flows, the
17 Refer to Table 5 of Appendix B for illustration of top senders of remittances and top receivers of remittances. 18 Member states of the Economic and Monetary Community of Central African are Cameroon, Central African Republic, Republic of Congo, Gabon, Equatorial Guinea and Chad (BEAC, 2011). 19 Member states of the Economic and Monetary Community of West Africa are Benin, Burkina Faso, Cote d’Ivoire Guinea-Bissau, Mali, Niger, Senegal, and Togo (BCEAO, 2012). 20 The CFA franc is the name of two separate currencies, the West African CFA franc (ISO currency code XAF) and the Central African CFA franc (ISO currency code XOF). These two currencies are equal to each other in value, and are both pegged to the Euro (Banque de France, 2015). 21 If one considers the three CFA franc receivers in Table 5, they all primarily receive remittances from other CFA franc countries. For instance, seven of the top ten senders of remittances to Mali are CFA franc countries; namely Cote d’Ivoire, Gabon, Niger, Burkina Faso, The Republic of Congo, Senegal and Cameroon. For Senegal five of the top ten senders of its remittances are CFA countries; Gabon, Cote d’Ivoire, Mali, Republic of Congo, and Cameroon. Six out of the top ten remittance senders to Cote d’Ivoire use the CFA franc, Burkina Faso, Mali, Benin, Gabon, Togo, and Cameroon. 22 Refer to Appendix C for a more detail on the discussion of migration patterns and remittance flows.

Where are the flows?| April 2018 16
following sections attempt to match migration and remittance data to understand where
the formal data is likely to underestimate total remittance flows or indicate potential
barriers.
Mismatch between migrant and remittance flows confirms informality. Since cross-border remittances are sent from senders in one country to recipients in another, studying migration patterns can be a good indication of where remittances will be coming from and going to. For instance, if most South African migrants live in the UK, one can assume that most remittances coming into South Africa will come from the UK. However, we find that this is not always the case. Figure 7 below shows the top 10 destination countries of migrants from SSA. In descending order, Côte d’Ivoire, South Africa and the USA are the top three destination countries for migrants from SSA. However, when one looks at migrant patterns and the flows of remittances, they do not always mirror each other. For instance, there are around 2.1 million migrants from SSA who live in Côte d’Ivoire. The pie chart to the left of the Ivorian map shows the breakdown of where migrants are coming from, and the pie chart to the right shows the breakdown of countries to which migrants living in Côte d’Ivoire are remitting. In Côte d’Ivoire, 62% of its migrants come from Burkina Faso, yet Burkinabe people do not feature as prominently among the receivers of remittances from Côte d’Ivoire. This trend is evident in many of the countries listed in Figure 7. This suggests that the reported figures of formal remittances do not tell the complete story and that there may be significant values of informal flows or informal migration that go unseen.

Where are the flows?| April 2018 17

Where are the flows?| April 2018 18
Figure 7: Top destination countries for SSA migrants
Source: World Bank remittances data, 2017c; United Nations, 2015
Analysing patterns of migration to help identify underestimated corridors. The figures
quoted above are official migrant numbers as reported by the United Nations Population
Division. These figures may not capture all unofficial migration, or migrants who have
gained citizenship to their host country but still have strong ties to their home country.
However, this data is still useful for identifying which remittance corridors may be
underestimated in terms of formal flows. These underestimated corridors may be an
advanced indication of where barriers to the provision of accessible remittance services may
exist.
Where are the flows?| April 2018 19
Gaps in remittance data for Somalia and Zimbabwe. Somalia and Zimbabwe are two of the
top source countries of migrants in the region (United Nations, 2015). However, the value of
remittances sent to Zimbabwe and Somalia was not available in the World Bank remittances
database23. As a result (even though we know that the US, Kenya and Ethiopia are home to
large populations of Somalis and that Zimbabweans make up a large share of migrants in
South Africa), they were not included in this analysis. Box 3 aims to fill some of the gaps in
data for Zimbabwe.
23 To maintain consistency in data sources, remittance values for Somalia and Zimbabwe are not included, although there are data sources that estimate these values. Given that the World Bank remittance data is collected from the same source and the methodology for collection is the same across countries, the authors felt that including data from other sources (which may have different data collection methods) would compromise the comparability of remittance figures between countries.

Where are the flows?| April 2018 20
Box 3: Estimating the value of remittances sent from South Africa to Zimbabwe
Figure 8: Remittance flows into Zimbabwe
Source: Truen et al, 2016; Mangudya, 2017; RBZ, 2017
Figure 8 illustrates remittance flows to Zimbabwe, drawing on Reserve Bank of Zimbabwe data. Total
international remittances24 were increasing sharply up until 2012, amounting to approximately
USD2 billion at the time. Since then, they have remained relatively stable with an observed decrease
from USD1.9 billion in 2015 to USD1.6 billion in 2016 (Mangudya, 2017).
The decrease in diaspora remittances between 2015 and 2016 was attributed to the weak
performance of the global economy, a depreciating South African rand and an increasing preference
of the diaspora to send remittances in kind, as well as through informal channels. South Africa
contributes 34% of the total diaspora remittances to Zimbabwe, estimated to be around
USD300 million over the last three years (Mangudya, 2017). Truen et al (2016) estimate that informal
remittances from South Africa to Zimbabwe are valued at USD472 million25.
Diaspora remittances have been highlighted as an important source of liquidity for Zimbabwe; and, as
such, the Reserve Bank of Zimbabwe (RBZ) has reduced the licence fees for Authorised Dealers with
Limited Authority (ADLAs), in effect from 1 August 2017. It is hoped that this will enhance the ease of
doing business and increase competition within the remittance market (RBZ, 2017).
Furthermore, to attract the use of formal remittance channels, the RBZ has been operating a
Diaspora Remittance Incentive Scheme (DRIS) that aims to encourage the use of formal remittance
services, particularly the use of bank accounts and wallets for receiving remittances26.
2.4 Characteristics of remittance-receiving countries
In the preceding sub-sections, the remittance market in SSA was explored from three angles. Firstly, the volume of flows, to get a sense of the scale or magnitude of formal remittance flows in the SSA region, both from a global perspective and then more specifically between SSA countries. Secondly, the relative economic importance of remittances was considered by analysing remittances as a proportion of GDP. Lastly, the migration and remittance flows were compared to each other, to ascertain how well migration predicted the volume of remittances from certain countries. This sub-section combines these findings to cluster countries according to common characteristics.
0
500
1000
1500
2000
2500
2009 2010 2011 2012 2013 2014 2015 2016
USD
mill
ion
s
Total international remittances
Disapora remittances
Estimated diaspora remittances from SA to Zim
Where are the flows?| April 2018 21
The bubble chart in Figure 9 measures the number of migrants on the vertical axis, using UN migration data from 2015. The average value of formal remittances received per migrant between 2012 and 2016 from all countries is measured on the horizontal axis; this number represents how much each migrant sent back home on average across the region, each year, over the stated period. The size of each bubble shows the remittances received as a percentage of GDP27.
The countries on the left-hand side of the graph (closest to the vertical axis) receive relatively low remittances per capita, but have a high number of migrants. This may suggest that formal remittances do not show the full picture of the value of remittances flowing into these countries. The countries on the right-hand side of the graph have relatively high values of remittances per capita, but not as many migrants. Although there are some exceptions, countries that are clustered on the left tend to have lower values for remittances as a percentage of GDP than those on the right. This suggests that there is potential economic value to be unlocked, should remittance size per capita increase.
24 These include remittances from diaspora and international organisations, such as NGOs (Mangudya, 2017). 25 Truen et al (2016) estimate that total remittances sent from South Africa to Zimbabwe amount to USD630 million, and 75% of this amount is sent informally (Truen, et al., 2016). 26 DRIS provides a 2% incentive for money transfer operators to reduce the cost of sending remittances, and a 3% incentive for remittances received in cash to reduce the cost of receiving them. This incentive recently increased for remittances received through a bank or wallet account from 3% to 10%, to encourage the use of bank accounts and wallets for receiving remittances as opposed to cash. These incentives are paid out by the RBZ. (RBZ, 2017). 27 The countries in this chart were chosen based on whether they are included among the top 10 receivers of remittances from all other countries, the size of their migrant population living outside of the country, and the relative share of remittances as a proportion of GDP. The bubbles are colour-coded to represent the level of socio-political fragility of each country (Department for International Development, 2016).

Where are the flows? | April 2018 22
Figure 9: Typologies of remittance-receiving countries
Source: World Bank remittance data, 2017c; World Bank GDP data, 2017; United Nations, 2015
High fragility
Moderate fragility
Low fragility
No fragility
* The size of the bubbles represents the relative share
of remittances as a % of GDP
Ghana, 2%
Senegal, 11%
Kenya, 2%
Uganda, 4%
Mali, 6%
South Africa, 0.3%
Liberia, 25%
Ethiopia, 1%
Madagascar, 4%
Burkina Faso, 2%
Sudan, 0.5%
DRC, 0.05%
Cote d'Ivoire, 1%
-
500,000
1,000,000
1,500,000
2,000,000
2,500,000
- 500 1,000 1,500 2,000 2,500 3,000 3,500
Nu
mb
er o
f m
igra
nts
, 20
15
Average remittances received per migrant in USD, 2012-2016
18,500
Nigeria, 4%

Where are the flows? | April 2018 23
Increasing the value of formal remittances to have significant positive economic impact. Although the increase in formal remittances may simply represent a change from informal to formal remittance channels, this shift would have a wholesale impact on financial markets. If, as Freund and Spatafora (2005) estimate, formal remittances are between 35% and 70% of the value of formal flows, this would translate to an increase of between 2% and 4% in remittances as a percentage of GDP for each of these countries, on average28. Increasing the value of remittances moving through formal channels not only provides added security for both the sender and receiver of funds, but it also increases foreign exchange inflows into the formal economy, has the potential to increase the depth and breadth of banking penetration, and increases the aggregate level of deposits and credit intermediated through the local banking sector (Aggarwa, et al., 2006; Demirgüç-Kunt, et al., 2009; Giuliano & Ruiz-Arranz, 2009; Karikari, et al., 2016). This financial-sector development, in turn, contributes to overall economic growth. This underscores the untapped economic potential of informal remittances and the substantial positive economic impact of more remittances being intermediated through formal channels.
2.5 Conclusion
Remittances important to SSA economies. The importance of remittances to SSA economies, at a micro- and macro-level, has been well established. Research has shown that remittances have a positive effect on many human development outcomes and are an important source of foreign currency (International Organisation for Migration, 2005; Gupta & Pattillo CA, 2009; Hassan, Chowdhury, & Shakur, 2017). The first two sections of this note establish the economic importance of remittances to SSA economies. The study finds that there are a few SSA countries (notably including Nigeria) that send and receive the lion’s share of remittances from within and outside of the region. However, this does not mean that the economic impact of these remittances accrues to only those countries. Remittances tend to have the most significant economic impact on island countries and smaller economies, as they represent a significant share of their GDP. For countries like Liberia and Lesotho, remittances received are comparable to some of the major sectors of the economy.
Mismatch between remittance and migration flows showing there are underestimated corridors. Section 2.3 and 2.4 take a deeper look at whether the flows we have identified are an accurate representation of remittances in SSA, given what migration within and outside of the region looks like. We find that there are gaps, which we refer to as “underestimated corridors”. We find that there is not always a clear correlation between where SSA migrants live and where remittances come from, as illustrated by the case of Côte d’Ivoire. We argue that this is most likely attributed to informality in these markets. Perhaps due to high costs, well-established informal RSPs, inefficient or inaccessible formal providers, or a combination of all these factors, consumers are choosing to use informal channels over formal ones.
Investigating barriers. This note lays the groundwork for better understanding the landscape of remittances in SSA, to better understand the barriers to the development of the formal remittance market in the region. The findings presented here, along with those of the forthcoming notes, will lay the foundations for the development of a remittances market development hypothesis. Notes 2 to 7 will outline the supply-side barriers to the development of the remittance market and will present four case studies of four different countries at different stages of remittance market development, with the aim of illustrating the unique barriers faced by each of them.
28 Assuming GDP remains unchanged
Where are the flows?| April 2018 24
3. Bibliography
Aggarwa, R., Demirgüç-Kunt, A. & Martinez Peria, M., 2006. Do Workers’ Remittances Promote Financial
Development?. World Bank Policy Research Working Paper, July.Volume 3957.
Avert, 2017. HIV and AIDS in Lesotho. [Online]
Available at: https://www.avert.org/professionals/hiv-around-world/sub-saharan-africa/lesotho
[Accessed 1 December 2017].
Balde, Y., 2011. The Impact of Remittances and Foreign Aid on Savings/Investment in Sub-Saharan Africa (SSA).
African Development Review, Wiley, 23(2), pp. 247-262.
Banque de France, 2015. The CFA franc zone. [Online]
Available at: https://www.banque-france.fr/sites/default/files/medias/documents/816153_fiche_zone-
franc.pdf
[Accessed 6 February 2018].
BCEAO, 2012. Member States. [Online]
Available at: https://www.bceao.int/-03-Etats-Membres-.html
BEAC, 2011. La Banque des etats de l'Afrique Centrale: Institut d'Emission en Afrique Centrale. [Online]
Available at: https://www.beac.int/index.php/beac/la-beac-a-40-ans
Bester, H. et al., 2008. Implementing FATF standards in developing countries and financial inclusion: Findings
and guidelines. [Online]
Available at: http://www.cenfri.org/documents/AML/AML_CFT%20and%20Financial%20Inclusion.pdf
[Accessed 1 December 2017].
CIA, 2016. CIA World Fact Book - Liberia. [Online]
Available at: https://www.cia.gov/library/publications/the-world-factbook/geos/li.html
[Accessed 18 August 2017].
Demirgüç-Kunt, A., López Córdova, E., Martinez Pería, M. & Woodruff, C., 2009. Remittances and Banking
Sector Breadth and Depth: Evidence from Mexico. Journal of Development Economics, Volume 95, pp. 229-241.
Department for International Development, 2016. International Development Committee (IDC) Inquiry:
Allocation of Resources. [Online]
Available at:
http://data.parliament.uk/writtenevidence/committeeevidence.svc/evidencedocument/international-
development-committee/dfids-allocation-of-resources/written/28276.pdf
[Accessed 30 November 2017].
Department for International Development, 2017. Statitics on International Development 2017: Final 2016 UK
ODA spend statistics. [Online]
Available at: https://www.gov.uk/government/uploads/system/uploads/attachment_data/file/660062/SID-
2017b.pdf
[Accessed 4 January 2018].

Where are the flows?| April 2018 25
FinMark Trust, 2016. Cross-border remittances. [Online]
Available at: http://www.finmark.org.za/wp-content/uploads/2016/11/cross-border-remittances-2016.pdf
[Accessed 30 November 2017].
Frankel, J., 2010. Are Bilateral Remittances Countercyclical?. Harvard Kennedy School Faculty Research Working
Paper Series, Volume RWP10-037 .
Freund, C. & Spatafora, N., 2005. Remittances: Transaction Costs, Determinants, and Informal Flows. [Online]
Available at: http://library1.nida.ac.th/worldbankf/fulltext/wps03704.pdf
[Accessed 21 August 2017].
Freund, C. & Spatafora, N., 2008. Remittances, transaction costs, and informality. Journal of Development
Economics, p. 356–366.
Giuliano, P. & Ruiz-Arranz, M., 2009. Remittances, financial development, and growth. Journal of Development
Economics, 90(1), pp. 144-152.
Gupta, S. & Pattillo CA, W. S., 2009. Effect of Remittances on Poverty and Financial Development in Sub-
Saharan Africa. World Development, p. 104–115.
Hassan, G., Chowdhury, M. & Shakur, S., 2017. Remittances, Human Capital and Poverty: A System Approach.
The Journal of Developing Areas , pp. 177-192.
Hougaard, C., 2008. The landscape of remittances in Zambia. [Online]
Available at: http://cenfri.org/documents/Remittances/2008/Zambia_remittances_doc_Sep%202008.pdf
Hougaard, C. et al., 2016. Making Access Possible (MAP) DRC, s.l.: Cenfri, FinMark Trust, UNCDF, Cether.
International Organisation for Migration, 2005. XIX. The Millenium Development Goals (MDGs) and Migration.
[Online]
Available at: http://www.un.org/esa/population/publications/PopAspectsMDG/18_IOM.pdf
International Organisation for Migration, 2017. Remittances in ACP Countries: Key Challenges and Ways
Forward: Informing Discussions of the ACP-EU Dialogue on Migration and Development, Brussels: International
Organization for Migration (IOM).
Karikari, N., Mensah, S. & Harvey, S., 2016. Do remittances promote financial development in Africa?.
SpringerPlus, 5(1).
KNOMAD, 2017. Migration and Remittances: Recent Developments and Outlook Special Topic: Return
Migration. s.l.:The World Bank Group.
Mangudya, J., 2017. Monetary Policy Statement. [Online]
Available at: http://www.rbz.co.zw/assets/2017-monetary-policy-statement-.pdf
[Accessed 5 January 2018].
Merriam-Webster, 2017. Must an 'Immigrant' Also Be an 'Emigrant'?. [Online]
Available at: https://www.merriam-webster.com/words-at-play/immigrant-emigrant-emigre-refugee-how-to-
tell-the-difference
Mhlanga, F., 2017. Diaspora remittances at $180m in Q1. [Online]
Available at: https://www.newsday.co.zw/2017/05/diaspora-remittances-180m-q1/
[Accessed 4 January 2018].
Where are the flows?| April 2018 26
Mohapatra, S. & Ratha, D., 2011. Migrant Remittances in Africa: An Overview . In: Remittance markets in Africa.
Washinton, DC: The World Bank, pp. 3-70.
Office for National Statistics, 2017. Foreign direct investment involving UK companies: Outward tables. [Online]
Available at:
https://www.ons.gov.uk/businessindustryandtrade/business/businessinnovation/datasets/foreigndirectinvest
mentinvolvingukcompaniesoutwardtables
[Accessed 4 January 2018].
RBZ, 2017. 2017 Mid-term monetary policy statement: Produce and create. [Online]
Available at: http://www.rbz.co.zw/assets/mid-term-monetary-policy-statement-02-august-2017-.pdf
[Accessed 5 January 2018].
Stojanov, R. & Strielkowski, W., 2013. The role of remittances as a more efficeint tool of development aid in
developing countries. Prague Economic Papers, Volume 4, pp. 487-503.
Truen, S. et al., 2016. FinMark Trust. [Online]
Available at: http://www.finmark.org.za/wp-content/uploads/2017/06/the-impact-of-remittances-in-lesotho-
malawi-and-zimbabwe.pdf
[Accessed 1 December 2017].
Truen, S. et al., 2016. The impact of remittances in Lesotho, Malawi and Zimbabwe. [Online]
Available at: http://www.finmark.org.za/wp-content/uploads/2017/06/the-impact-of-remittances-in-lesotho-
malawi-and-zimbabwe.pdf
[Accessed 12 February 2017].
UK Government, 2015. UK-Somalia Remittance Factsheet. [Online]
Available at: https://www.gov.uk/government/uploads/system/uploads/attachment_data/file/418690/15-03-
11_UK-Somalia_Remittance_Factsheet.pdf
[Accessed 4 January 2018].
UNEP, 2017. French Speaking Africa. [Online]
Available at: http://web.unep.org/ozonaction/networks/french-speaking-africa
United Nations, 2015. International migrant stock 2015. [Online]
Available at:
http://www.un.org/en/development/desa/population/migration/data/estimates2/estimates15.shtml
[Accessed 1 December 2017].
World Bank Development Research Group, the Better Than Cash Alliance, and the Bill & Melinda Gates
Foundation, 2014. The opportunities of digitising payments, Washington: International Bank for Reconstruction
and Development/The World Bank.
World Bank FDI data, 2017a. Foreign direct investment, net inflows (BoP, current US$). [Online]
Available at: https://data.worldbank.org/indicator/BX.KLT.DINV.CD.WD
World Bank ODA data, 2016a. Net ODA received per capita (current US$). [Online]
Available at: https://data.worldbank.org/indicator/DT.ODA.ODAT.PC.ZS
World Bank population data, 2017b. Population, total. [Online]
Available at: https://data.worldbank.org/indicator/SP.POP.TOTL
[Accessed 1 November 2017].

Where are the flows?| April 2018 27
World Bank remittance data, 2017c. Personal remittances, received (current US$). [Online]
Available at: https://data.worldbank.org/indicator/BX.TRF.PWKR.CD.DT
World Bank, 2016b. Remittances to Developing Countries Edge Up Slightly in 2015. [Online]
Available at: http://www.worldbank.org/en/news/press-release/2016/04/13/remittances-to-developing-
countries-edge-up-slightly-in-2015
World Bank, 2016c. Remittances. [Online]
Available at: http://www.un.org/esa/ffd/wp-content/uploads/2016/01/Remittances_WBG_IATF-Issue-Brief.pdf
[Accessed 30 November 2017].
World Bank, 2017d. Country corridors. [Online]
Available at: https://remittanceprices.worldbank.org/en/countrycorridors
World Bank, 2017e. Remittance Prices Worldwide: an analysis of the trends of remittances services. [Online]
Available at: https://remittanceprices.worldbank.org/sites/default/files/rpw_report_september_2017.pdf
World Bank, 2017f. Sending money from NIGERIA to TOGO. [Online]
Available at: https://remittanceprices.worldbank.org/en/corridor/Nigeria/Togo
World Bank, 2017g. GDP per capita (current US$). [Online]
Available at: https://data.worldbank.org/indicator/NY.GDP.PCAP.CD
World Bank, n.d.. Metadata. [Online]
Available at:
http://databank.worldbank.org/data/Views/Metadata/MetadataWidget.aspx?Name=Personal%20remittances,
%20received%20(current%20US$)&Code=BX.TRF.PWKR.CD.DT&Type=S&ReqType=Metadata&ddlSelectedValu
e=PAK&ReportID=52277&ReportType=Table
[Accessed 5 January 2018].
World Integrated Trade Solutions, 2017. Sub-Saharan Africa Trade Indicators 2016. [Online]
Available at: https://wits.worldbank.org/CountryProfile/en/Country/SSF/Year/2016
Where are the flows? | 2018/03/01April 2018 28
4. Appendices
4.1 Appendix A: Economic importance of remittances for SSA countries
Island states gaining the most value per capita from remittances29. Table 1 shows that the top 10 countries differ across the three categories. While Nigeria tops the list in terms of remittance value received, remittance per capita (USD 117) is below that of Cape Verde, Lesotho and the Seychelles with USD339, USD203 and USD201 per capita, respectively. Seven of the top 10 remittance-per-capita countries listed have relatively small populations, namely Cape Verde, Seychelles, Mauritius, Comoros, Sao Tome and Principe, The Gambia and Lesotho30. Apart from The Gambia and Lesotho, these countries are all island states. This indicates that, although these countries receive relatively low values of remittances compared to the top 10, their small populations mean that this translates into a relatively large and economically significant value of remittances per person. Nigeria, Senegal and Liberia receive large values of remittances in absolute USD amounts, which also translate to a significant value of remittance per capita, which is impressive especially for Nigeria with its population of over 180 million31. In SSA, between 2012 and 2016, average-per-capita remittances for the region increased from USD50 to USD58, indicating an increasing importance of remittances to individual incomes across the region.
Liberia, The Gambia and Lesotho relying on remittances the most. When countries are ranked according to remittances as a percentage of GDP, the relative importance of these flows becomes very clear. Table 1 shows that the remittances are equivalent to 24% of Liberia’s GDP, and 18% of both The Gambia and Lesotho’s GDPs. For Liberia, remittances are comparable to the third-largest contributor to GDP after services and agriculture (CIA, 2016). The same holds for The Gambia and Comoros. For Lesotho and Cape Verde, remittance as a percentage of GDP is even greater than agricultural contribution. The trend for the SSA region is on the rise: On average, the contribution of remittances to the regional GDP increased from 3.5% in 2012 to almost 5% in 2016.
Remittances having the greatest economic impact on Senegal and Liberia across all three indicators. Both these countries appear in the top 10 of remittance receivers, remittances per capita and remittances as a share of GDP. This is a strong indication of the economic importance of remittances to these countries – at an individual, household and macroeconomic level. There is, however, a significant overlap in the countries presented in top remittances per capita and as a share of GDP. This is because these same countries with small populations often have relatively small economies as well, and as a result, the economic impact of even relatively low value of remittances on these small countries will be much greater than the impact on larger economies, such as Nigeria and Kenya.
29 An investigation into why these countries attract proportionately higher values of remittances is outside of the scope of this study. However, it should be noted that for many of these small economies, they often attract a negligible total USD amount of remittances; but, because their populations and GDP values are small, these proportions look large. Although they may attract a relatively large share of remittances compared to their population, often it is not enough to build a business case around. 30 Cape Verde has a population of 539,560 people, Seychelles has a population of 94,680, Mauritius has a population of 1.3 million, Comoros has a population of 795,600, São Tomé and Principe has a population of 199,910, The Gambia has a population of 2 million, and Lesotho has a population of 2.2 million (World Bank population data, 2017b). 31 Liberia has a population of 4.6 million people, and Senegal has a population of 15.4 million (World Bank population data, 2017b).

Where are the flows?| April 2018 29
Intra-SSA remittances are important contributors to the productive capacity of SSA economies,
particularly Lesotho. As mentioned in Section 2.1.1, analysing remittances per capita and as a share
of GDP helps us to better understand the economic impact of remittances on a micro- (individual or
household) and macro-level. Looking at these measures for intra-SSA remittances only, allows one to
analyse the effect of regional remittances on economic productivity in isolation. Lesotho receives
96% of its remittances from South Africa and thus is the top receiver of intra-SSA remittances by
average per capita and as a percentage of GDP, as shown in Table 3. However, formal remittances
from South Africa to Lesotho have declined by 35% between 2012 and 2016, falling from
USD509 million to USD331 million. This translates into a per capita remittance drop from USD258 to
USD155, and remittances as a share of GDP has fallen from 20% to 16% over this period. This decline
in remittances is not a recent phenomenon and is primarily due to Lesotho’s economic dependence
on a declining number of Basotho migrant workers living in South Africa. Of Lesotho’s population of
2.2 million people, 404,000 live and work in South Africa (World Bank, 2017b; United Nations, 2015).
Many of these migrant workers are employed in the South African mining industry, but the number
of Basotho employed in this sector has been declining (Truen, et al., 2016). In addition to this, the
HIV and AIDS epidemic32 in Lesotho has caused the death of many male migrant workers, thus
leaving many Basotho households without a male breadwinner (Truen, et al., 2016). These factors
have resulted in the steady decline of remittances sent from South Africa to Lesotho.
32 Lesotho has the second-highest HIV adult prevalence rate in the world (Avert, 2017).

Where are the flows?| April 2018 30
Remittance-receiving countries
Five-year average remittances received (USD m)
Remittance-receiving country
Five-year average of remittances per capita33 (USD)
Remittance-receiving countries
Five-year average of remittances as % of GDP34
Nigeria 5,870 Lesotho 196 Lesotho 17%
Mali 607 São Tomé
and Principe 41
Liberia 9%
Senegal 527 Liberia 40 Togo 6%
Uganda 511 Cape Verde 40 Mali 5%
Lesotho 419 Senegal 36 Senegal 4%
Ghana 297
Mali 36
São Tomé and Principe 2%
Côte d'Ivoire 271
Togo 35
The Gambia 2%
Togo 257 Nigeria 33 Benin 2%
Kenya 238 Seychelles 27 Uganda 2%
Burkina Faso 204
Swaziland 22
Guinea-Bissau 2%
Sub-Saharan Africa 12935
Sub-Saharan Africa 18
Sub-Saharan Africa 1.8%
Table 3: Top 10 receivers of remittances from other SSA countries by total average remittances, average remittance per capita, and proportion of average GDP from 2012 to 2016
Source: World Bank remittances data, 2017c, World Bank population data, 2017b, World Bank GDP data, 2017
Intra-SSA remittances are economically significant capital flows. There is significant overlap
between Table 1 and Table 3, with small, island economies again well represented among the top
receivers of remittances per capita and by share of GDP. However, larger economies such as Togo,
Mali and Senegal are represented on all three rankings. This shows that they not only receive large
volumes of remittances, but these remittances still represent significant contributions to their
respective economies. Lesotho is also not the only country that receives most of its remittances from
other SSA countries. Mali and Uganda receive 75% and 51% of their remittances from other SSA
countries, respectively.
33 Average remittances per capita is calculated by dividing the total value of remittances received in one year by the total population size in that year, and then taking the average of this ratio over five years, from 2012 to 2016, (as per available World Bank data and accounting for missing values) 34 Average percentage of GDP is calculated by dividing the remittances received in one year by the GDP in that same year, and then taking the average of this ratio over five years, from 2012 to 2016, (as per available World Bank data and accounting for missing values). 35 This average includes all SSA countries for which we have data, except for Nigeria since its remittance receipts are so much higher than those of any other SSA country. The average value including Nigeria is USD276 million.

Where are the flows?| April 2018 31
4.2 Appendix B: Supporting tables for primary remittance-sending countries
SSA countries with highest GDP per capita tending to send the most per capita. Table 4 shows the top 10 SSA countries by total remittances sent, average remittances sent per capita, as well as in terms of the remittances sent as a percentage of GDP. The remittances per capita are far larger in the top five countries than in the rest of SSA. Five of the top 10 senders per capita are among the countries with the highest GDP per capita in SSA36.
Remittance-sending countries
Five-year average remittances sent (USD m)
Remittance-sending country
Five-year average of remittances per capita (USD37)
Remittance-sending countries
Five-year average of remittances as % of GDP of sending country
Cameroon 2,259 Gabon 438 The Gambia 24%
South Africa 1,995 Seychelles 423 Togo 9%
Côte d'Ivoire
1,025
Mauritius 168
Cameroon 8%
Ghana 834 The Gambia 117 Benin 8%
Gabon 823 Cameroon 101 Liberia 7%
Benin 696 Benin 68 Central African Republic
6%
Nigeria 666 Botswana 56 Gabon 5%
Tanzania 511 Equatorial
Guinea 55
Niger 5%
Chad 468 Togo 51 Chad 4%
Sudan 367 Côte d'Ivoire 46 Mauritania 4%
SSA average 290 SSA average 43 SSA average 3%
Table 4: Top 10 SSA senders of remittances by total average remittances, average remittance per capita, and proportion of average GDP from 2012 to 2016
Source: World Bank remittances data, 2017c, World Bank population data, 2017b, World Bank GDP data, 2017
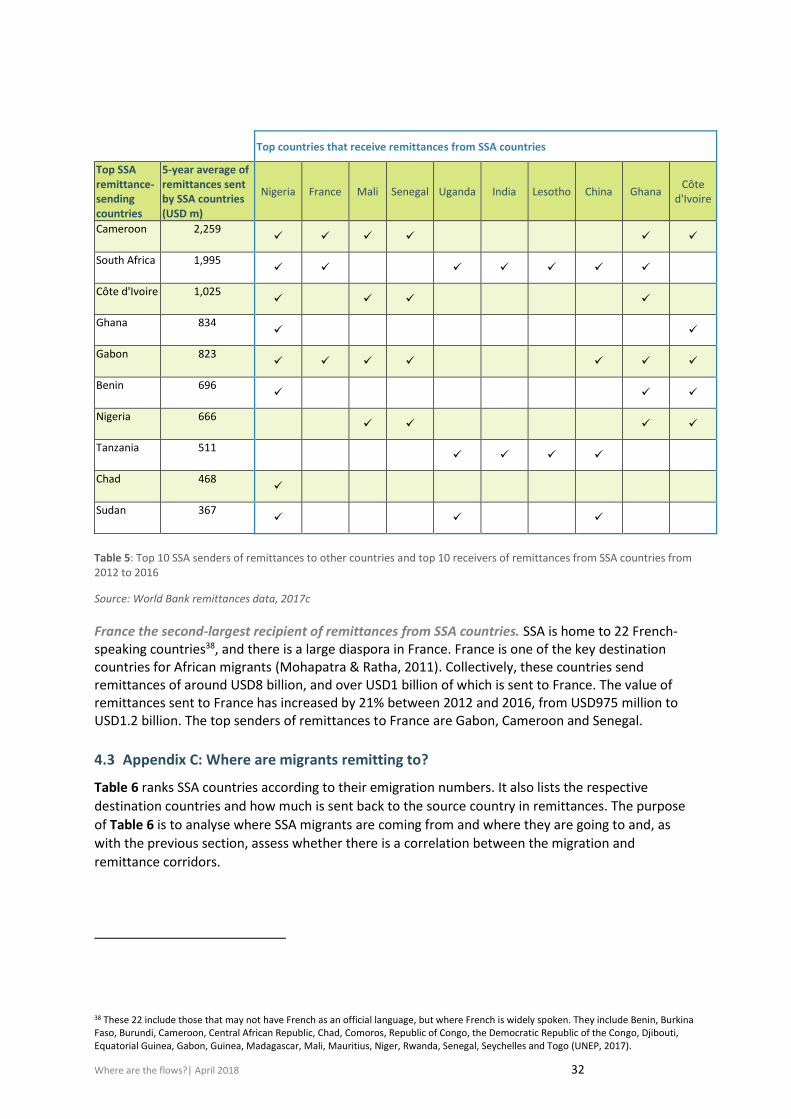
Half of the top remittance senders sending primarily to Nigeria. Table 5 shows the top senders of
remittances from SSA and their remittance destination countries. Most remittances that originate
from Cameroon, Ghana, Benin, Chad and Sudan are sent to Nigeria. This should come as no surprise
considering that Nigeria receives just over half of all the remittances sent from other SSA countries,
as discussed in Section 2.1.1.
36 These are the African countries with highest GDP per capita in current USD in 2016: Seychelle’s GDP per capita is USD 15,076, Mauritius’ is USD 9,628, Equatorial Guinea’s is USD8,333, Gabon’s is USD 7,179, and Botswana’s is USD 6,788 (World Bank, 2017g).
Where are the flows?| April 2018 32
Top countries that receive remittances from SSA countries
Top SSA remittance-sending countries
5-year average of remittances sent by SSA countries (USD m)
Nigeria France Mali Senegal Uganda India Lesotho China Ghana Côte
d'Ivoire
Cameroon 2,259 ✓ ✓ ✓ ✓ ✓ ✓
South Africa 1,995 ✓ ✓ ✓ ✓ ✓ ✓ ✓
Côte d'Ivoire 1,025 ✓ ✓ ✓ ✓
Ghana 834 ✓ ✓
Gabon 823 ✓ ✓ ✓ ✓ ✓ ✓ ✓
Benin 696 ✓ ✓ ✓
Nigeria 666 ✓ ✓ ✓ ✓
Tanzania 511 ✓ ✓ ✓ ✓
Chad 468 ✓
Sudan 367 ✓ ✓ ✓
Table 5: Top 10 SSA senders of remittances to other countries and top 10 receivers of remittances from SSA countries from 2012 to 2016
Source: World Bank remittances data, 2017c
France the second-largest recipient of remittances from SSA countries. SSA is home to 22 French-speaking countries38, and there is a large diaspora in France. France is one of the key destination countries for African migrants (Mohapatra & Ratha, 2011). Collectively, these countries send remittances of around USD8 billion, and over USD1 billion of which is sent to France. The value of remittances sent to France has increased by 21% between 2012 and 2016, from USD975 million to USD1.2 billion. The top senders of remittances to France are Gabon, Cameroon and Senegal.
4.3 Appendix C: Where are migrants remitting to?
Table 6 ranks SSA countries according to their emigration numbers. It also lists the respective
destination countries and how much is sent back to the source country in remittances. The purpose
of Table 6 is to analyse where SSA migrants are coming from and where they are going to and, as
with the previous section, assess whether there is a correlation between the migration and
remittance corridors.
38 These 22 include those that may not have French as an official language, but where French is widely spoken. They include Benin, Burkina Faso, Burundi, Cameroon, Central African Republic, Chad, Comoros, Republic of Congo, the Democratic Republic of the Congo, Djibouti, Equatorial Guinea, Gabon, Guinea, Madagascar, Mali, Mauritius, Niger, Rwanda, Senegal, Seychelles and Togo (UNEP, 2017).

Where are the flows?| April 2018 33
Top source country for SSA migrants
Number of migrants from source country (2015)
Main destination countries for migrants in 2015
Value of total average remittances received by source country in USD m (2012-2016 Average)
Top senders of remittances to source country (2012-2016 Average)
Somalia 1,998,764 Kenya (24%) Ethiopia (22%) Yemen (12%)
No Data No Data
Sudan 1,890,861 South Sudan (29%) Saudi Arabia (19%) Chad (19%)
440 Saudi Arabia (40%) UAE (10%) South Sudan (8%)
Burkina Faso 1,453,378 Côte d’Ivoire (89%) Ghana (4%) Mali (2%)
234 Cote d’Ivoire (57%) Ghana (18%) Italy (5%)
DRC 1,403,757
Uganda (22%) Rwanda (16%) Republic of Congo (12%)
16 Republic of Congo (17%) Belgium (15%) France (11%)
Nigeria 1,093,644 USA (22%) UK (20%) Cameroon (7%)
20,590 USA (28%) UK (18%) Cameroon (10%)
Mali 1,005,607 Côte d’Ivoire (35%) Nigeria (16%) Niger (8%)
813 Côte d’Ivoire (29%) France (18%) Nigeria (16%)
Zimbabwe 856,345 South Africa (56%) UK (16%) USA (6%)
No Data No data
Côte d’Ivoire 850,105 Burkina Faso (64%) France (11%) Liberia (5%)
360 Burkina Faso (52%) France (14%) Liberia (11%)
South Africa 841,120 UK (26%) Australia (22%) USA (11%)
916 UK (27%) Australia (20%) USA (13%)
Ghana 801,710 Nigeria (28%) USA (17%) UK (13%)
918 USA (27%) Nigeria (18%) UK (13%)
Table 6: Top source countries of migrants in SSA
Source: World Bank remittances data, 2017c; United Nations, 2015
Overlap between top source countries and remittance receivers. Sudan, Nigeria, Mali, South Africa,
Ghana, Burkina Faso and Côte d’Ivoire (all ranked as top receivers of remittances) also appear in the
Table 6. Somalia, DRC and Zimbabwe are the only countries listed here that do not appear among the
top receivers of remittances. The absence of Somalia and Zimbabwe from these lists is because there
is not remittance data available for them, as mentioned in Section 2.2. There is an overlap between
the main destination countries and the top senders of remittances to source countries in Table 6. For
Nigeria, Côte d’Ivoire, South Africa and Ghana, these columns essentially match. There is some
overlap between these columns for Burkina Faso and Mali, but the discrepancies are not particularly
stark.
Missing corridors in Sudan and DRC. Sudan and the DRC are different to the other source countries
for SSA migrants listed in Table 6, as there is much less overlap between the destination countries for
these migrants and source country of remittances. In Sudan’s case, South Sudan and Chad are home
to 48% of Sudanese migrants, but 50% of remittances come from Saudi Arabia and the United Arab
Emirates (UAE), compared to only 8% coming from South Sudan. For the DRC, even though 38% of

Where are the flows?| April 2018 34
their migrants live in Uganda and Rwanda, they do not receive much in formal remittances from
them. And even though France and Belgium do not appear to be major destination countries for
Congolese migrants, there are significant contributors of remittances to the DRC. Despite the DRC
having 1.4 million people living outside of the country, it only receives USD16 million in remittances.
Its migrant population is similar in size to Burkina Faso, but they receive more than 14 times less in
remittances. This is further evidence that there are likely “missing corridors” in the DRC, as
mentioned at the beginning of Section 2.3

© 2018 Cenfri
About FSD Africa FSD Africa is a non-profit company that aims to increase prosperity, create jobs and reduce poverty by bringing about a transformation in financial markets in sub-Saharan Africa (SSA) and in the economies they serve. It provides know-how and capital to champions of change whose ideas, influence and actions will make finance more useful to African businesses and households. It is funded by the UK Aid from the UK Government. FSD Africa also provides technical and operational support to a family of 10 financial market development agencies or “FSDs” across SSA called the FSD Network.
About Cenfri The Centre for Financial Regulation & Inclusion (Cenfri) is a global think-tank and non-profit enterprise that bridges the gap between insights and impact in the financial sector. Cenfri’s people are driven by a vision of a world where all people live their financial lives optimally to enhance welfare and grow the economy. Its core focus is on generating insights that can inform policymakers, market players and donors seeking to unlock development outcomes through inclusive financial services and the financial sector more broadly.