Embed Size (px)
Citation preview
“When the market speaks… it PAYS to listen!”
– Title of July 2003 TASC Article on Market Internals
MTA Educational Web Series on:
Market InternalsPresented by: Mike Hurley, CMT

Presented by: Mike Hurley, CMT - [email protected] - 775-750-8921 22
Introduction
Background
Overview / Basic Usage
Related / Advanced Indicators
Actual Market Examples
Wrap-up/Ref’s
33
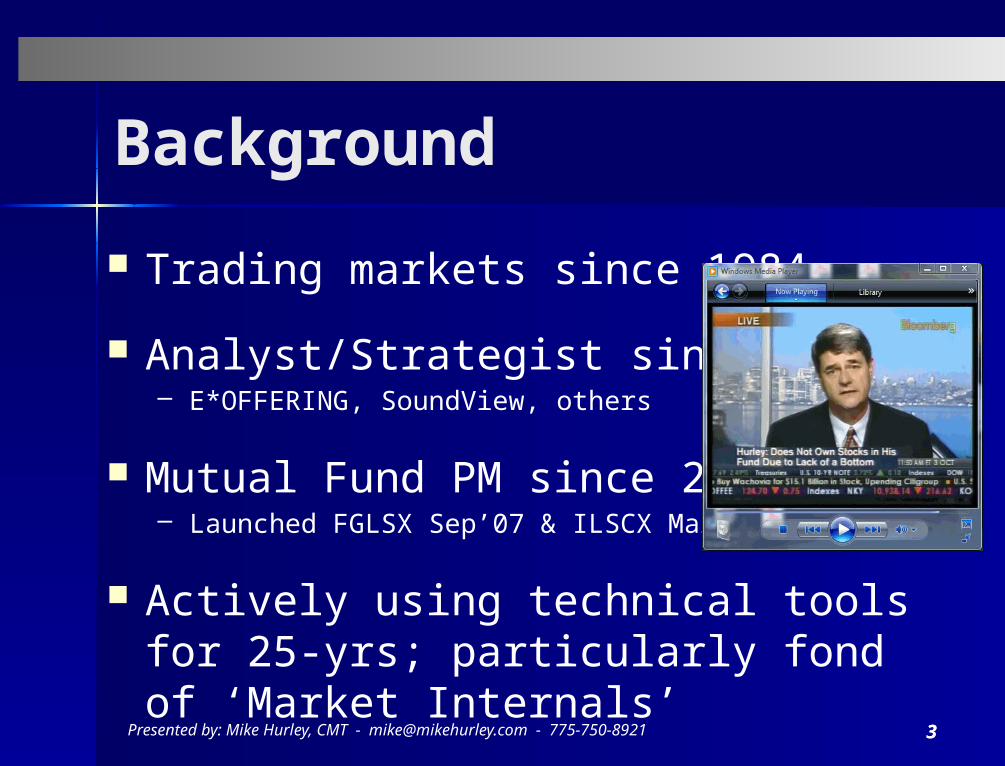
Background
Trading markets since 1984
Analyst/Strategist since 1993– E*OFFERING, SoundView, others
Mutual Fund PM since 2007– Launched FGLSX Sep’07 & ILSCX Mar’09
Actively using technical tools for 25-yrs; particularly fond of ‘Market Internals’
Presented by: Mike Hurley, CMT - [email protected] - 775-750-8921
44
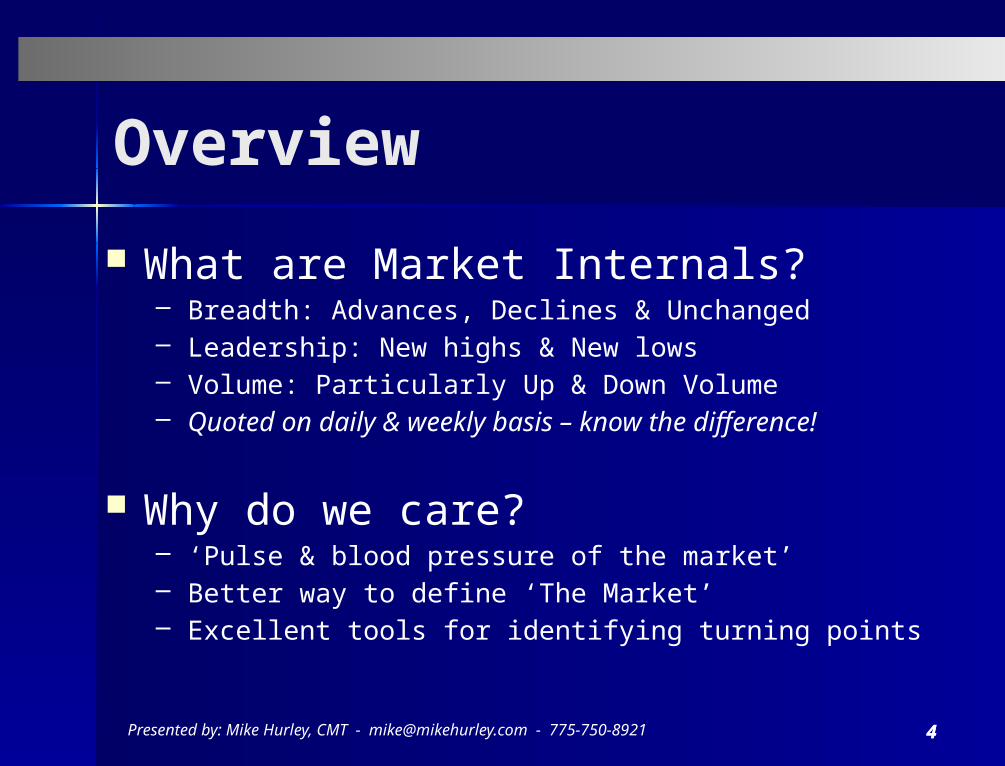
Overview
What are Market Internals?– Breadth: Advances, Declines & Unchanged– Leadership: New highs & New lows– Volume: Particularly Up & Down Volume– Quoted on daily & weekly basis – know the difference!
Why do we care?– ‘Pulse & blood pressure of the market’– Better way to define ‘The Market’– Excellent tools for identifying turning points
Presented by: Mike Hurley, CMT - [email protected] - 775-750-8921
55
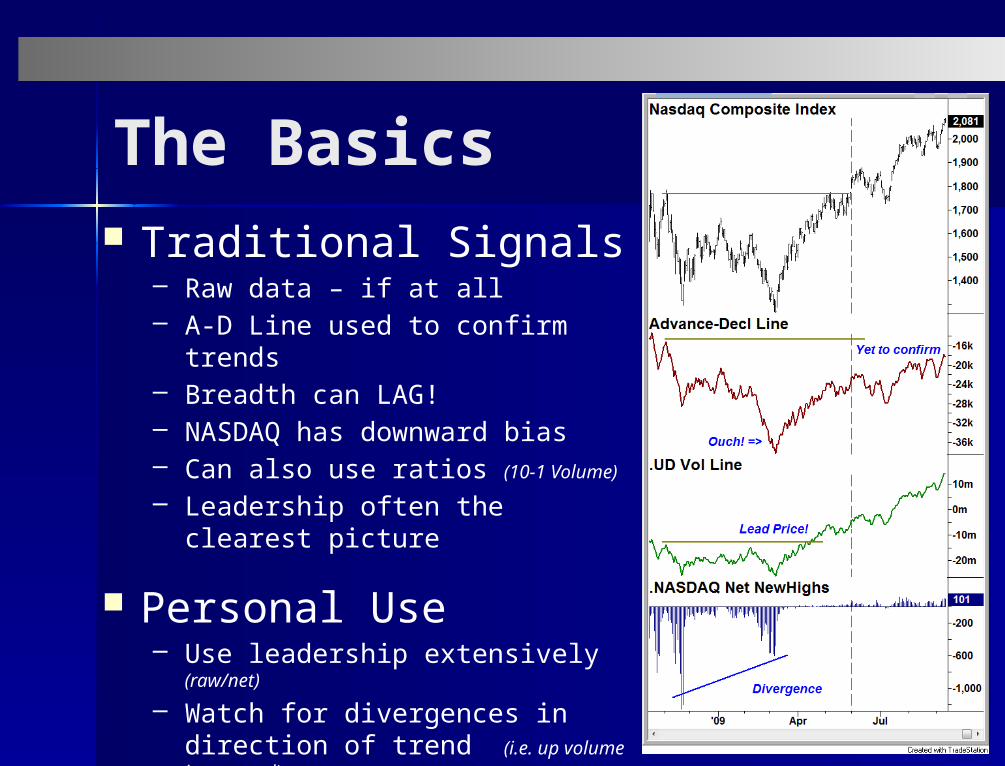
The Basics Traditional Signals
– Raw data – if at all– A-D Line used to confirm trends– Breadth can LAG! – NASDAQ has downward bias– Can also use ratios (10-1 Volume)
– Leadership often the clearest picture
Personal Use– Use leadership extensively
(raw/net)
– Watch for divergences in direction of trend (i.e. up volume in up trend)
– Stick to the ‘Big Picture’ (systems = sand)
66
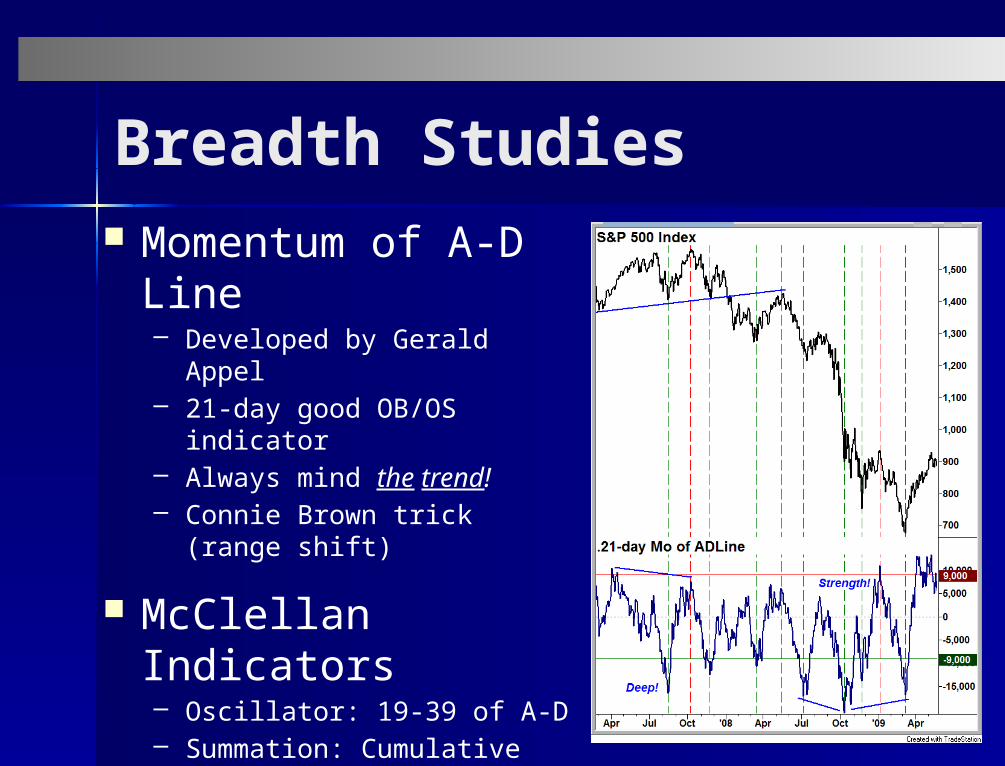
Breadth Studies Momentum of A-D
Line– Developed by Gerald Appel– 21-day good OB/OS indicator – Always mind the trend!– Connie Brown trick (range
shift)
McClellan Indicators– Oscillator: 19-39 of A-D– Summation: Cumulative total
‘90% Days’– Lowry’s: U/D Volume and A/D– ID panic selling & buying

High Low Logic– Dev. by Norman Fosbeck– Lesser of NH or NL / Total
Issues – >2½% is bad (i.e. split tape)
Hindenburg Indicator– High Low Logic (>2¼%)– McClellan is negative– Above 50-day
%New Highs– Dev. by Gerald Appel:
NH/(NH+NL)– SMA/EMA – smoothes raw data
77
Leadership
88
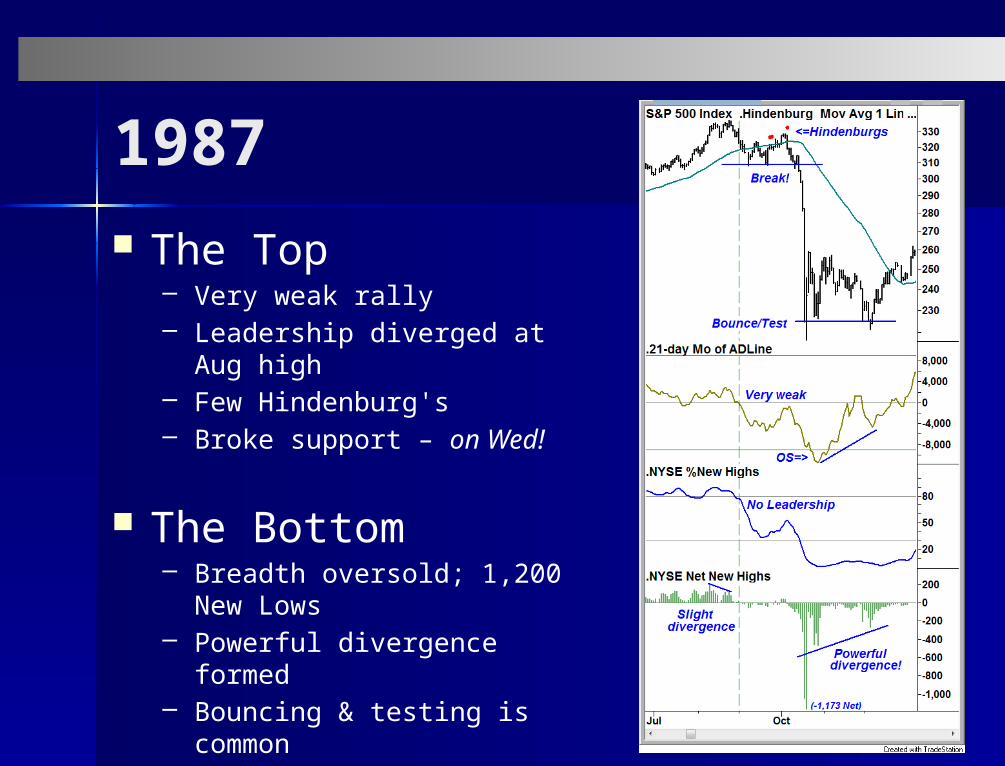
1987 The Top
– Very weak rally– Leadership diverged at Aug
high– Few Hindenburg's– Broke support – on Wed!
The Bottom– Breadth oversold; 1,200 New
Lows– Powerful divergence formed – Bouncing & testing is common – Rebuilding takes time!

99
1990 Garden Variety Bear
Market– A-D Line peaked Aug ‘89 – No power in breadth or leadership– Few Hindenburg’s
Typical Bottom has 4 Steps– Psychological extreme– Recognizable chart
pattern/divergences– Substantial rally off the lows– Successful test – ‘Dip but not a trip’
Charts lead the news!Presented by: Mike Hurley, CMT - [email protected] - 775-750-8921
1010
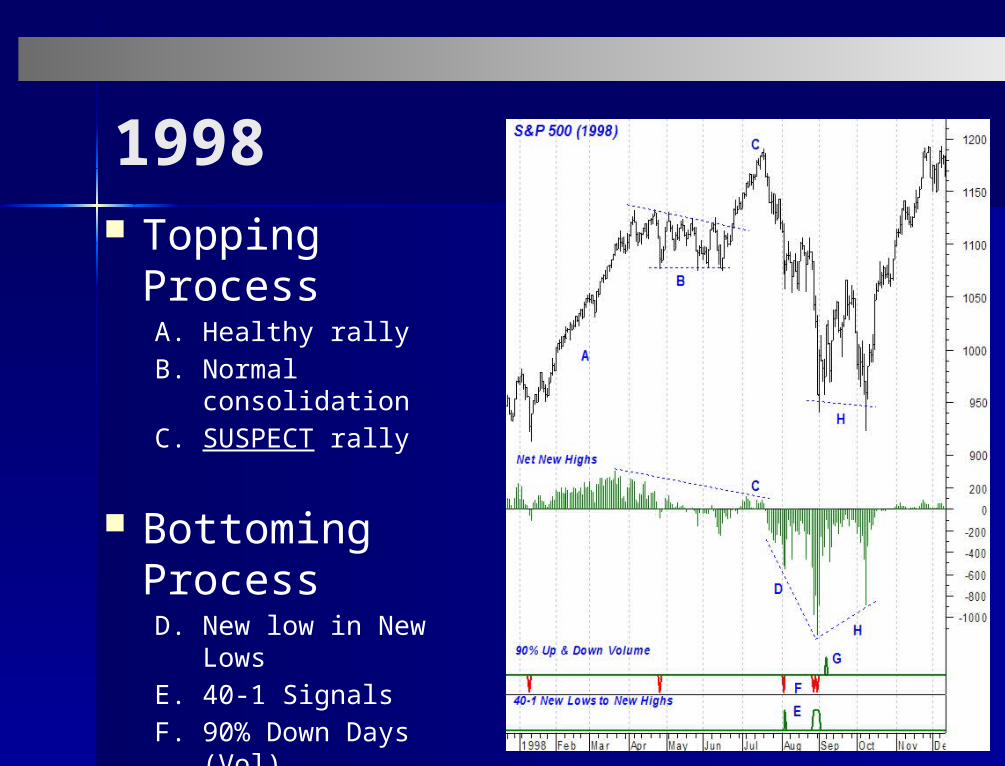
1998 Topping Process
A. Healthy rallyB. Normal consolidationC. SUSPECT rally
Bottoming ProcessD. New low in New LowsE. 40-1 SignalsF. 90% Down Days (Vol)G. 90% Up Days (Vol)H. Bullish Divergence!
Process vs. Event!
1111
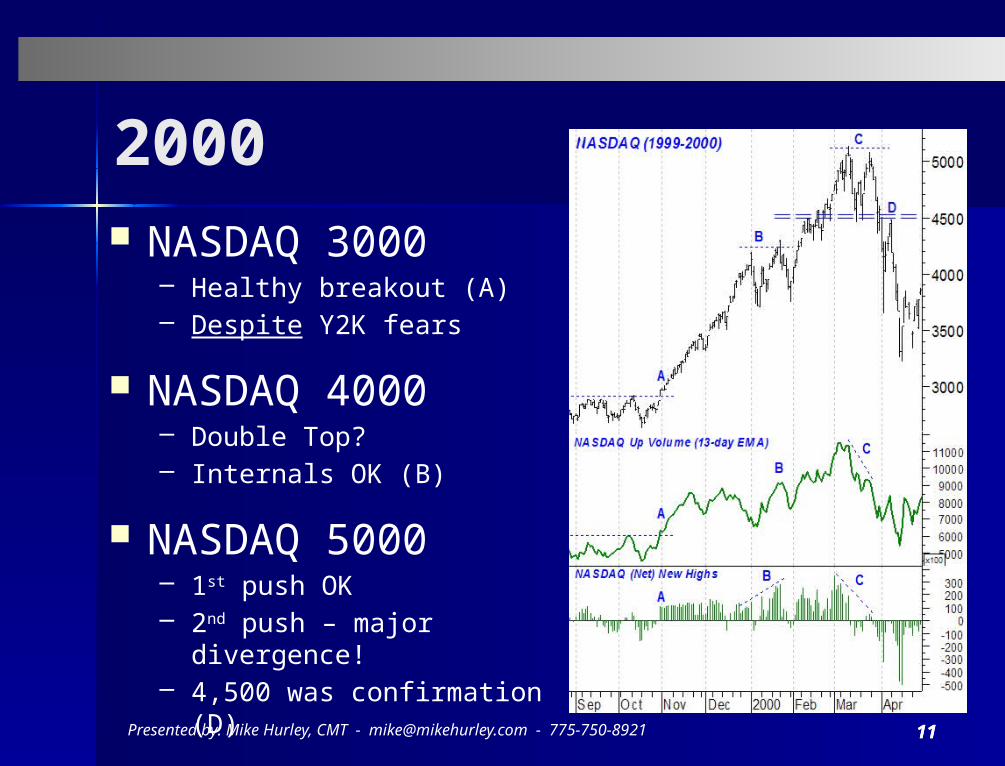
2000 NASDAQ 3000
– Healthy breakout (A)– Despite Y2K fears
NASDAQ 4000– Double Top?– Internals OK (B)
NASDAQ 5000– 1st push OK – 2nd push – major
divergence!– 4,500 was confirmation (D)
Presented by: Mike Hurley, CMT - [email protected] - 775-750-8921
1212
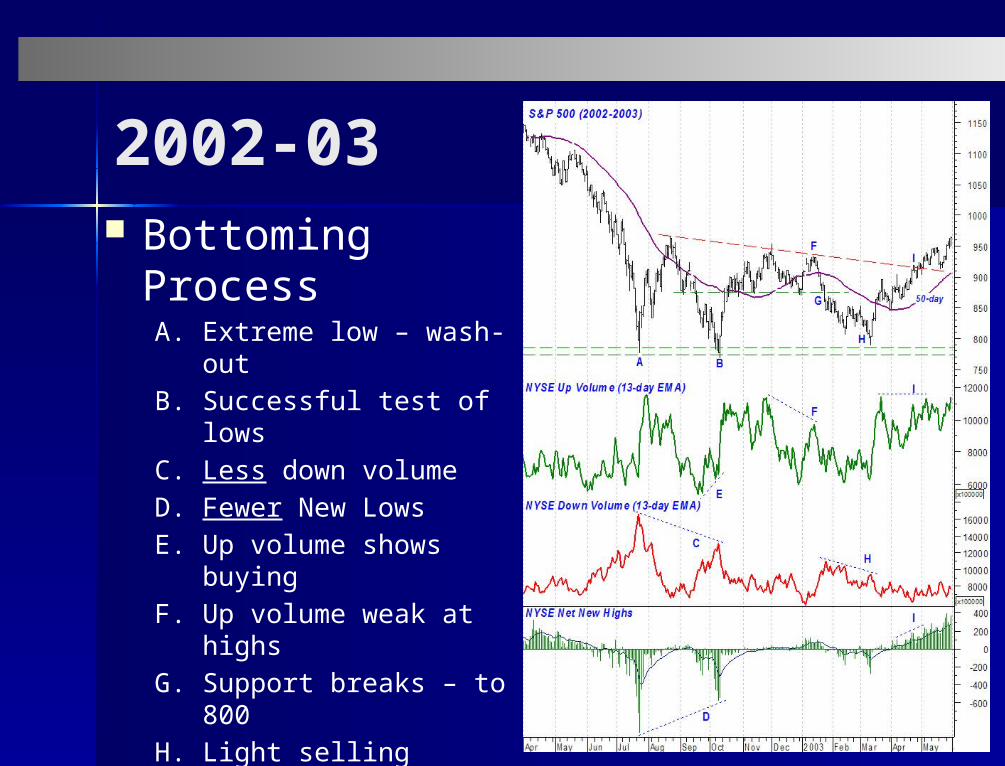
2002-03 Bottoming
ProcessA. Extreme low – wash-
outB. Successful test of lowsC. Less down volumeD. Fewer New LowsE. Up volume shows
buyingF. Up volume weak at
highsG. Support breaks – to
800H. Light selling
(divergence in down vol. & new lows)
I. Healthy breakout!
Process vs. Event!

1313
2008-09 2008 Top
– Leadership diverged– XLF diverged– XLY/XLP Declining– Potential H&S?
2009 Bottom– Leadership diverged– Steep Yield Curve– XLY/XLP Advancing
‘Rational analysis’
Presented by: Mike Hurley, CMT - [email protected] - 775-750-8921
1414
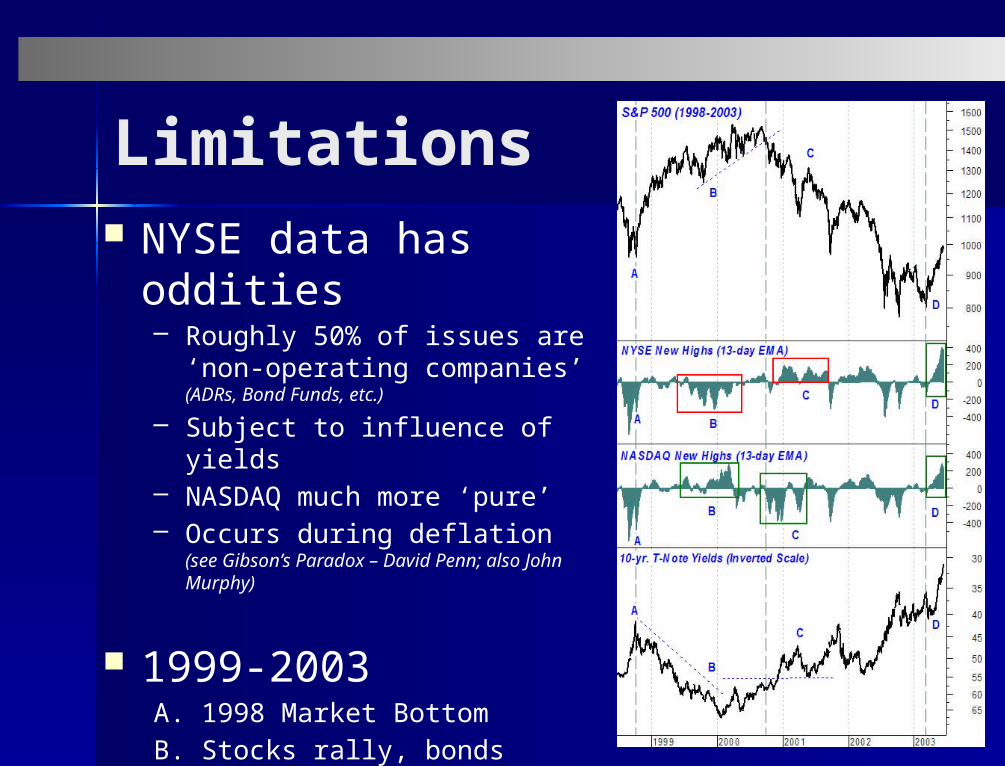
Limitations NYSE data has
oddities– Roughly 50% of issues are
‘non-operating companies’ (ADRs, Bond Funds, etc.)
– Subject to influence of yields– NASDAQ much more ‘pure’– Occurs during deflation (see
Gibson’s Paradox – David Penn; also John Murphy)
1999-2003A. 1998 Market BottomB. Stocks rally, bonds declineC. Stocks decline, bonds rallyD. Stocks & bonds in sync

1515
Wrap-up/Ref’s Summary
– Market Internals can be a very valuable tool– Signals uncommon; particularly powerful when
combined– Goal: Provide introduction and to inspire further
study
Ref’s (small sample)– Gerald Appel –Technical Analysis – Robert Colby – Encyclopedia of Technical Market Indicators– Alexander Elder – Trading for a Living– John Murphy – Intermarket Technical Analysis – Mike Hurley –Technical Analysis of Stocks & Commodities (Jul‘03)– David Penn –Technical Analysis of Stocks & Commodities (Mar‘02)
Questions/Comments are Welcome!Presented by: Mike Hurley, CMT - [email protected] - 775-750-8921


![Tasc Basic[1]](https://img.pdfslide.us/doc/110x75/5449bfc5af795984188b45cc/tasc-basic1.jpg)