Embed Size (px)
Citation preview
WHEN STUDYING AND NUDGING DON’T GO AS PLANNED:UNSUCCESSFUL ATTEMPTS TO HELP TRADITIONAL AND ONLINE COLLEGE STUDENTS
Philip OreopoulosRichard W. Patterson
Uros PetronijevicNolan G. Pope
WORKING PAPER 25036
NBER WORKING PAPER SERIES
WHEN STUDYING AND NUDGING DON’T GO AS PLANNED:UNSUCCESSFUL ATTEMPTS TO HELP TRADITIONAL AND ONLINE COLLEGE STUDENTS
Philip OreopoulosRichard W. Patterson
Uros PetronijevicNolan G. Pope
Working Paper 25036http://www.nber.org/papers/w25036
NATIONAL BUREAU OF ECONOMIC RESEARCH1050 Massachusetts Avenue
Cambridge, MA 02138September 2018, Revised April 2019
Previously circulated as "Lack of Study Time is the Problem, but What is the Solution? Unsuccessful Attempts to Help Traditional and Online College Students." At the University of Toronto, we are indebted to the first-year economics instructors for their willingness to incorporate an experiment into their courses for a fourth consecutive year. We especially thank James Lahey, our web developer, for his tireless commitment to designing and perfecting the experiment’s website, as well as for his help with organizing and extracting the experimental data. Spencer Dean, Chelsea Kowalski, Catherine Tessier, Chester Madrazo, Ophelia Au, and Erica Rzepecki showed great enthusiasm and professionalism in their role as coaches. At WGU, we thank Jason Levin, Chelsea Barnett, and Narendra Pandya for their help designing, programming, and executing this study. Thanks also to seminar participants at the University of Michigan, Michigan State University, UC San Diego, Notre Dame University, the Institute of Behavior & Inequality, MDRC, the Association for Public Policy Analysis and Management (APPAM) 2017 annual research conference, the Society of Labor Economists’ 2018 annual meetings, and the College Board. All remaining errors are our own. The experiments in this paper were both registered with the AEA RCT Registry. The RCT IDs are AEARCTR-0000972 and AEARCTR-0000810. The views expressed herein are those of the authors and do not necessarily reflect the views of the National Bureau of Economic Research.
NBER working papers are circulated for discussion and comment purposes. They have not been peer-reviewed or been subject to the review by the NBER Board of Directors that accompanies official NBER publications.
© 2018 by Philip Oreopoulos, Richard W. Patterson, Uros Petronijevic, and Nolan G. Pope. All rights reserved. Short sections of text, not to exceed two paragraphs, may be quoted without explicit permission provided that full credit, including © notice, is given to the source.
When Studying and Nudging Don’t Go as Planned: Unsuccessful Attempts to Help Traditional and Online College StudentsPhilip Oreopoulos, Richard W. Patterson, Uros Petronijevic, and Nolan G. PopeNBER Working Paper No. 25036September 2018, Revised April 2019JEL No. I2,J24
ABSTRACT
We evaluate two low-cost college support programs designed to target insufficient study time, a common occurrence among many undergraduates. We experimentally evaluate the programs across three distinct colleges, randomly assigning more than 9,000 students to construct a weekly schedule in an online planning module and to receive weekly study reminders or coach consultation via text message. Despite high participation and engagement, and treated students at two sites marginally increasing study time, we estimate precise null effects on student credit accumulation, course grades, and retention at each site for the full sample and for multiple subgroups. The results and other supplemental evidence suggest that low-touch programs that offer scheduling assistance, encouragement, and reminders for studying lack the required scope to significantly affect academic outcomes.
Philip OreopoulosDepartment of EconomicsUniversity of Toronto150 St. George StreetToronto, ON M5S 3G7CANADAand [email protected]
Richard W. PattersonUnited States Military AcademyB107 Lincoln HallWest Point, NY [email protected]
Uros PetronijevicYork UniversityDepartment of EconomicsVari Hall4700 Keele StreetToronto, ON M3J [email protected]
Nolan G. PopeUniversity of Maryland3114 Tydings Hall7343 Preinkert DrCollege Park, MD [email protected]
A randomized controlled trials registry entry is available at AEARCTR-0000972, AEARCTR-0000810A online appendices is available at http://www.nber.org/data-appendix/w25036
When Studying and Nudging Don’t Go as Planned: Unsuccessful Attempts to Help Traditional and Online College Students
Philip Oreopoulos Richard W. Patterson
Uros Petronijevic Nolan G. Pope
April 2019
Abstract: We evaluate two low-cost college support programs designed to target insufficient study time, a common occurrence among many undergraduates. We experimentally evaluate the programs across three distinct colleges, randomly assigning more than 9,000 students to construct a weekly schedule in an online planning module and to receive weekly study reminders or coach consultation via text message. Despite high participation and engagement, and treated students at two sites marginally increasing study time, we estimate precise null effects on student credit accumulation, course grades, and retention at each site for the full sample and for multiple subgroups. The results and other supplemental evidence suggest that low-touch programs that offer scheduling assistance, encouragement, and reminders for studying lack the required scope to significantly affect academic outcomes.
Acknowledgements: At the University of Toronto, we are indebted to the first-year economics instructors for their willingness to incorporate an experiment into their courses for a fourth consecutive year. We especially thank James Lahey, our web developer, for his tireless commitment to designing and perfecting the experiment’s website, as well as for his help with organizing and extracting the experimental data. Spencer Dean, Chelsea Kowalski, Catherine Tessier, Chester Madrazo, Ophelia Au, and Erica Rzepecki showed great enthusiasm and professionalism in their role as coaches. At WGU, we thank Jason Levin, Chelsea Barnett, and Narendra Pandya for their help designing, programming, and executing this study. Thanks also to seminar participants at the University of Michigan, Michigan State University, UC San Diego, Notre Dame University, the Institute of Behavior & Inequality, MDRC, the Association for Public Policy Analysis and Management (APPAM) 2017 annual research conference, the Society of Labor Economists’ 2018 annual meetings, and the College Board. All remaining errors are our own. The experiments in this paper were both registered with the AEA RCT Registry. The RCT IDs are AEARCTR-0000972 and AEARCTR-0000810. Oreopoulos – University of Toronto and NBER, [email protected]; Patterson – United States Military Academy, [email protected]; Petronijevic – York University, [email protected]; Pope – University of Maryland, [email protected].
1
1. Introduction
College enrollment has steadily increased in recent decades, as policymakers, popular media, and
parents all emphasize the importance of post-secondary education for labor market success. Yet
approximately half of all students who enroll never complete their program and students who do
complete struggle and develop limited skills along the way (Arum and Roksa 2011). Student effort
is a key determinant of academic outcomes, and many students devote an alarmingly low amount
of time to regular studying (Babcock and Marks 2011). Despite a clear positive association
between study time and academic outcomes (Brint and Cantwell 2010; Stinebrickner and
Stinebrickner 2004, 2008), underachieving students in both traditional and online colleges often
manage their time poorly and study very little (Dohetry 2006; Beattie, Laliberté, Michaud-Leclerc,
and Oreopoulos 2017; Beattie, Laliberté, and Oreopoulos 2018). Indeed, any initiative to improve
student outcomes is likely to be far more effective when students are consistently engaged in the
learning process.
In this paper, we study three types of post-secondary education institutions – a selective
four-year college, a less-selective four-year college, and an online university – that differ in terms
of student characteristics and how they deliver education, but share the problem of having many
students who manage their time poorly. Recent studies using students from our traditional college
settings (campuses at the University of Toronto) show that struggling students have a high
propensity to procrastinate and study little throughout the academic year (Beattie, Laliberte, and
Oreopoulos 2018). Upon initially experiencing poor performance in first semester, these students
do not increase their planned study time, despite many acknowledging that the biggest challenge
to their academic success is poor time management (Beattie, Laliberte, Michaud-Leclerc, and
Oreopoulos 2017).
2
A lack of available time is unlikely to be the reason for low study times. Figure 1 plots the
distribution of time that students have available and the distribution of time they self-report
studying during a regular week in the fall semester, using information from baseline and follow-
up surveys among students from the two colleges in our traditional college samples. 1 Available
study time is calculated from a baseline survey that elicits students’ self-reported expectations for
weekly hours of paid work, commuting time to and from campus, time spent attending lectures,
and time spent sleeping. Self-reported study time during a regular week in the fall semester is
gathered from a follow-up survey at the end of the semester. The two distributions are almost non-
overlapping, suggesting that few students are limited by their available time for studying. Indeed,
the median student has approximately 93 hours a week available but only chooses to devote 12
hours to studying outside the classroom. Half of students in our sample self-report studying less
than 12 hours a week, while the bottom quarter of students report studying less than 5 hours per
week.
At the online college we study, Western Governors University (WGU), students also
appear to study infrequently. Although students have easy access to material online, the average
student logs into to their portal only 2.1 days per week. In addition, 90 percent of students log in
less than 3.7 days per week and 18.5 percent of students log in less than 1 day per week. More
generally, online education is a setting where time management issues are particularly likely to
drive poor performance. Indeed, recent experimental and quasi-experimental evidence finds that
students in online courses perform worse than students in traditional classroom settings (Bettinger
et al., forthcoming; Figlio et al. 2013). One possible reason for these performance gaps is that the
1 We describe the data used to construct this figure in greater detail in Section 4.
3
asynchronous, unstructured nature of online courses makes students particularly prone to issues
with time management and distraction.
To address issues of poor time management and low study times, we design and evaluate
two programs that aim to increase study time by helping students create and follow realistic
schedules. We experimentally evaluate program impacts using a sample of over 3,500
undergraduate students at the University of Toronto (UofT) and a sample of over 6,000
undergraduate students at WGU. At UofT, we implement our program at both the more-selective
main campus, St. George (UTSG), and the less-selective suburban commuter campus, the
University of Toronto at Mississauga (UTM). Our experimental sample includes approximately
2,000 UTSG students and 1,500 UTM students. Across all three locations, we randomly assign
incoming students to treatment or control groups. Students in the treatment group are provided
information to motivate the benefits of sufficient study and complete an online planning module
in which they make a calendar describing their planned weekly commitments in the upcoming
year, including the times during the week they plan to study. To keep these plans salient, we also
encouraged students at the UofT campuses to provide their phone numbers and students at WGU
to download the WGU mobile application so that we could send students reminders about their
scheduled study times via text message throughout the academic year. Students in the control
groups at the UofT campuses were given a personality test, while students in the control group at
WGU did not receive the planning module but still completed the standard online student
orientation.
Our planning interventions relate to a broader and growing literature on the application of
behavioral insights to education settings (Lavecchia, Liu, and Oreopoulos 2016; Damgaard and
Nielsen 2018). Recent attempts to help improve academic outcomes focus on prompting students
4
to think about future goals (Clark et al. 2017; Dobronyi et al. 2017), encouraging more healthy
perspectives for dealing with setbacks or anxiety (Yeager et al. 2016; Bettinger et al. 2018), and
low-cost encouragement or advising (Fryer 2016; Castleman and Meyer 2016; Oreopoulos and
Petronijevic 2018). We focus instead on targeting study time, treating it as a crucial necessary
(but not sufficient) condition for academic success. Poorly performing students, who typically
study less than 10 hours a week, are unlikely to benefit from any intervention that does not increase
this variable.
Our planning interventions are designed to improve study time management through three
key channels. First, by providing information about successful students’ study habits through an
online module, they make students aware of how much time is usually required to perform well in
their courses. Second, by requiring that students create a weekly plan that details all their
commitments, the interventions help students better understand the time commitment required for
all their other obligations outside of school. Third, the periodic reminders that students receive
about their planned study times help keep their goals salient throughout the academic year.
Despite our time-management program being well-received and generating a high degree
of student engagement, we find no impact on academic outcomes across all three experimental
sites (the two campuses of UofT and WGU). Specifically, we estimate no treatment effect on
credit accumulation or course grades at UTSG and UTM and no treatment effect on student credit
accumulation or retention at WGU. These results hold even after investigating potentially
heterogeneous treatment effects across several student subgroups.2
2 The experiments at WGU and at UofT were both pre-registered with the AEA RCT Registry. The RCT IDs are AEARCTR-0000972 and AEARCTR-0000810 at WGU and UofT, respectively. Our analysis of treatments effects in the full sample and across student subgroups closely follows our pre-registered analysis plans.
5
Considering the mechanisms behind the null effects, we show that the intervention did
significantly increase self-reported study times at the University of Toronto campuses by nearly 2
hours per week. We reconcile the null effects on grades with these positive effects on study time
by showing that the association between study time and course grades is relatively low. An increase
in weekly study time of 10 hours (75 percent of a standard deviation) is associated with an average
increase in course grades between 2.2 and 4.6 percentage points (between 17 and 35 percent of a
standard deviation), a range reflecting estimates that are adjusted to account for measurement error
and potential grade inflation. The relatively weak association between study hours and grades and
our first-stage effect on study time at UofT together imply grade effects that may be too small for
us to detect.
A lack of engagement – both during the initial online exercise and throughout the course
of the semester with text message coaching – is unlikely to explain the insignificant effects of the
intervention. We document that treated students engaged with the calendar exercise by setting
higher study goals in their calendars than what they reported to be expecting to study during the
(pre-randomization) baseline survey. Further, response rates to the weekly text-messages were
quite high, with nearly 70 percent of students engaging with their coaches. Finally, supplemental
evidence suggests that most students enjoyed the program and would have liked for it to continue.
Given the high levels of student engagement and satisfaction with the intervention, it is
likely that a more comprehensive program is required to generate larger change in behavior and
outcomes. We further use our unique survey data at the UofT campuses to demonstrate that, in
addition to studying more, top-performing students differ from low-performing students on many
other important dimensions: they have much higher incoming high school grades, set higher
expectations for themselves, are more likely to finish what they start, manage their time well, and
6
plan well into the future, and are less likely to study at the last minute and delay starting
assignments. These important differences among high- and low-performing students, coupled with
the very large study effort increase that is required to generate significant change in outcomes,
imply that a more comprehensive and intensive intervention – designed to affect many dimensions
of student behavior – is likely required to generate meaningful change in academic outcomes.
Here, our results are consistent with an increasingly common finding in the economics
literature on low-cost, scalable interventions in education – namely, that such interventions are
effective at nudging students toward taking relatively simple, one-time actions but are less
effective at causing improvement in outcomes that require meaningful and sustained changes in
student behavior.3 For example, text-messaging programs that push helpful information to students
have proven effective at causing students to enroll in college once admitted (Castleman and Page
2015) or to renew financial aid (Castleman and Page 2016), but such programs have largely been
unable to affect students’ academic outcomes, such as course grades or overall GPA (Fryer 2016;
Castleman and Meyer 2016; Oreopoulos and Petronijevic 2018).4 Significant change in these
outcomes is usually brought about by more comprehensive interventions that offer tutoring,
advising, future planning, and some form of financial aid.5 We find that helping students create
clear schedules and providing them with periodic reminders has no detectable effect on student
grades or credit accumulation, an important finding for higher-education policymakers considering
3 There are exceptions that find positive effects of low-cost interventions affecting sustained changes in behavior. For example, Chande et al. (2015) find that text message prompts to increase attendance in adult education programs, Patterson (2018) finds that commitment devices increase study time and improve performance in a Massive Open Online Course (MOOC), and Martinez (2013) finds positive effects of social cue interventions on students’ performance in a MOOC. 4 Our findings here contribute to the broader literature on planning interventions that shows encouraging people to make a concrete plan for action has shown promise in settings with a single action such as voting (Nickerson and Rogers, 2010) and getting the flu vaccine (Milkman et al., 2011), but has not shown to be effective in increasing sustained actions, such as attending the gym (Carrera et al., 2018). 5 See, for example, Scrivener and Weiss (2013); Bettinger and Baker (2014); Andrews, Imberman, and Lovenheim (2016); and Evans, Kearny, Perry, and Sullivan (2017).
7
the efficacy of programs that emphasize the importance of time management and sufficient study
time.
Because our planning module requires students to set study-time goals, our results also
contribute to the recent literature on goal-setting interventions. In a large field experiment among
traditional college students, Clark et al. (2017) find that requiring students to make goals over
course outcomes has a small positive effect on performance but that assigning task-based goals
has a larger and more robust impact on course performance. The authors interpret their results as
evidence that task-specific goals generate positive outcomes by addressing both present-bias and
loss-averse preferences. In contrast, in another large field experiment in a traditional college
setting, Dobronyi et al. (2017) find that asking students to make specific, meaningful, and
attainable goals did not have any measurable impact on student outcomes. The authors also found
that providing students with additional growth-mindset training (Dweck, 2006) and text/email
reminders did not improve academic outcomes.6 Our results suggest that helping students set
specific goals for study hours may not be an effective way to improve academic outcomes.7
The remainder of this paper is organized as follows: The next section offers a brief conceptual
framework for thinking about why students encounter challenges with managing their study time
well. Section 3 provides a detailed description of our intervention and its implementation at the
UofT campuses and WGU. Section 4 describes the experimental data from both experiments and
6 Dobronyi et al. (2017) base their work on research conducted by Morisano et al. (2010) and Schippers et al. (2015), which both find large positive effects of goal setting interventions. 7 Our paper also relates to the recent literature on pre-commitment devices in higher education. Himmler et al. (2017) find that asking students to pre-commit to taking exams at a certain time improved their overall performance in a graduate business school, while Baker et al. (2016) find that prompting students via email to schedule times to watch lecture videos in a Massive Open Online Course had no impact on performance. In a similar setting, Patterson (2015) finds that enabling students to pre-commit to limits on distracting internet time increased completion rates and improved performance but reminding students about their coursework and allowing students to block distractions while working had no significant impact on course outcomes.
8
outlines our empirical strategy for estimating the treatment effects, while Section 5 presents the
results. We discus and interpret our results in Section 6 and Section 7 provides concluding remarks.
2. Conceptual Framework
In this section, we outline the mechanisms through which our planning interventions could
improve student outcomes, followed by a brief discussion of the potential obstacles to their
effectiveness.
Many individuals tend to underestimate the time required to complete a task (Kahneman and
Tversky 1979), with more complicated tasks, such as navigating university courses, usually
resulting in greater underestimation (Buehler et al. 1994). Decomposing a task into smaller
segments, however, helps individuals form more accurate estimates about the time required to
complete it (Buehler et al. 1994; Forsyth and Burt 2008). Accordingly, to help students better
appreciate the time they require and have available for the tasks in their courses, our planning
interventions guide them through unpacking their weekly study schedules into smaller study
sessions that are dispersed throughout the week.
We also remind students of their study goals and weekly completion benchmarks via text
message throughout the academic year. The use of follow-up reminders is motivated in part by
economic models of limited memory and inattention (Mullainathan 2002; Ericson 2014; Karlan et
al. 2010), which predict that individuals are susceptible to inattention to their prior plans, thereby
causing delays or even failures in plan completion. Reminders have been shown to successfully
increase plan completion in a variety of domains, including exercise (Calzolari and Nardotto
9
2012), repayment of loans (Cadena and Schoar 2011), savings accounts deposits (Karlan et al.
2010), and college matriculation (Castleman and Page 2015).
Our planning interventions are also designed to help students better manage their time by
increasing ‘implementation intentions,’ a term that refers to the process of identifying when,
where, and how one will fulfil a plan (Gollwitzer 1993). Recent experimental evidence suggests
that fostering implementation intentions can increase desired behavior across many domains,
including exercise, diet, recycling, project completion, and voting (Gollwitzer and Sheeran 2006;
Nickerson and Rogers 2010). By requiring students to define implementation intentions at the
beginning of the academic year, our planning intervention helps them establish clear study goals
to follow while working through their courses.
As we describe in greater detail below, treated students at the UofT campuses were also
assigned to a senior-undergraduate student coach, whose job was to check-in once a week via text
message to inquire about how students were progressing and offer encouragement. Personal
coaching or advising done over the phone or in person has proven effective in improving students’
academic outcomes at both two-year and four-year colleges (Scrivener and Weiss 2013; Bettinger
and Baker 2014; Oreopoulos and Petronijevic 2018). Despite there being less evidence on the
effectiveness of personal coaching that occurs via text message,8 we offered treated students a text-
message coaching program to help them address any individual-specific challenges to following
through with their plans.
8 Oreopoulos, Petronijevic, Logel, and Beattie (2018) show that while personal coaching via text message did not improve academic outcomes in a sample of students at UofT, it did significantly and positively impact non-academic outcomes, such as student mental health and feelings of belonging at the university.
10
There are, however, several reasons our planning interventions may be ineffective at increasing
study time and improving students’ academic outcomes. First, students’ tendency to procrastinate
may limit the efficacy of a planning intervention. Specifically, students may exhibit time-
inconsistency and behave more impatiently in the moment than they had previously planned
(Laibson, 1997; O’Donoghue and Rabin, 1999). Solomon and Rothblum (1984) find that more
than half of college students report regularly procrastinating coursework. If present-biased
preferences keep students from following through on their plans, then improving the quality of
students’ plans and reminding them about their plans may not be enough to affect academic
outcomes.
Second, students may be overconfident in their abilities. Twenge et al. (2012) find that a
majority of college students believe they have above average abilities. We also find a large
majority of students believe they will perform above average compared to their classmates. If
students overestimate their abilities, they may make insufficient study plans and underestimate the
penalties they will face from failing to follow-through on their plans (Dunlosky and Rawson,
2012).
Third and finally, the benefits to studying are long-term, uncertain, and highly ambiguous. It
is therefore also possible that students have low expectations on the returns to studying on grades,
or the returns to grades on longer term outcomes. Perhaps obtaining a degree, for example, matters
much more than obtaining a ‘B’ average instead of a ‘C’. Or perhaps these expectations are not
correct. Motivating the benefits to studying or reducing ambiguity, may therefore increase study
effort (Epstein and Halevy, 2018).
11
3. Description of Intervention
In this section, we describe the implementation of the experiments at both UofT and WGU,
providing greater detail about the planning interventions and the follow-up messages students
received.
3.1. The Intervention at UofT
We conducted our experiment at UofT throughout the 2017-18 academic year. At both the main
campus, UTSG, and the satellite campus, UTM, we partnered with all first-year economics
instructors to include a 45 to 60 minute ‘warm-up’ exercise at the beginning of the course worth 2
percent of students’ final grades. The exercise had to be completed within the first two weeks of
the fall semester for students to receive course credit, with the type of exercise each student
completed depending on whether he or she was randomly assigned to the treatment or control
group. All students logged in using their university accounts and completed a brief introductory
survey, in which they provided information about their parental education, their own expected
educational attainment, their work plans, their educational history, and their self-reported tendency
to procrastinate or become distracted. Students assigned to the treatment group were then required
to complete an online module that first taught them about the importance of sufficient study time
and then guided them through a planning intervention, while students assigned to the control group
were given a personality test. Below we describe the treatment and control modules in more detail.
3.1.1. Planning Intervention
12
All students randomly assigned to the planning intervention at UofT completed a three-part online
module. We offer an overview of the module in this subsection and provide full documentation in
Appendix B.
During the first part of the planning module, we presented the college’s recommendation
for weekly study time (at least 4 to 6 hours per course, or at least 20 to 30 hours per week for a full
course load) and information on the importance of sufficient study time for academic performance
and general life satisfaction. We motivated the latter by showing descriptive evidence (gathered
from previous experiments we ran at UofT) about the positive associations between study time
and grades and study time and measures of mental health. In the second part of the module, we
asked students to read testimonials from former students, each of which described a common
challenge faced by university students and how making a schedule and studying regularly can help
students avoid these pitfalls. After reading through the stories, students wrote about how they
could motivate themselves to stick to a regular study routine and identified the study strategies
they thought would be the most helpful for doing so. Students were encouraged to slow down or
write a little more if they tried to continue through the exercise below a minimum time or word-
count restriction.
Having discussed the importance of keeping an organized schedule and studying enough,
the third part of the online module asked students to make their own weekly schedule by building
a weekly calendar. We first asked students to populate their calendars with class times, which they
could do by downloading a standard electronic calendar (ICS) file from their university platform
and then uploading the ICS file to our platform. Students then scheduled their anticipated job
schedules along with their regular sleep routines. Once they had accounted for items with little
scheduling flexibility, students were asked to populate their calendars with weekly study times.
13
The module asked them to reconsider the importance of sufficient and regular study time and
would not allow them to proceed unless the number of scheduled study hours throughout the week
matched their self-imposed target for study hours. As the final step toward completing their
calendars, students scheduled personal time for seeing friends and family and engaging in other
activities they enjoy.
To help students stay on track throughout the academic year, we made their weekly
calendars available to them. If students already had a Gmail account, they simply had to provide
their Gmail address and we then uploaded their calendars directly into their Google calendars. If
students did not have a Gmail account, we gave them the option to create one or to simply
download their calendar as an ICS file and upload it to whichever calendar application they prefer
to use.9
For the last step of the exercise, all students were encouraged to enroll in a virtual coaching
program called [email protected] We explained that students would be matched with an experienced,
senior-undergraduate coach whose job would be to check-in once a week via text message to
inquire about how students were doing with their study goals, offer support and encouragement,
and answer any questions. Across both campuses, 80 percent of students opted-in to the coaching
program by providing their cell phone numbers.
Our coaches were hired through a research opportunity program, which allows students to
participate in a research project for course credit (rather than pay). Coaches were solicited to apply
for the program through various student service offices and we sought recommendations for keen,
9 A total of 1,685 students completed the planning intervention at UofT and 1,424 (84.5 percent) provided a Gmail address for us to upload their calendars directly into their Google calendars. The remaining students downloaded their calendar from our platform as ICS file. 10 As in Oreopoulos and Petronijevic (2018), we chose the name to emphasize that the program would help coach students toward their individual definitions of success.
14
talented senior undergraduates who had prior experience helping new students (as, for example,
residence dons, orientation volunteers, or tutors). Upon joining the team, coaches reported to our
program manager, a graduate student in economics, who communicated best practices and ensured
proper protocol was being followed.
Once students opted-in to the coaching program, they were assigned to a specific coach
and each coach was assigned a few time slots during the week to be the coach who was on call.
During each on-call time for a given coach, we sent a batch message to all students who were
assigned to that coach to spur productive conversation. If students replied while their coach was
still on call, that coach would continue the conversation. If students replied after their coach’s shift
ended, the coach who was currently on call or the team manager was responsible for closing the
conversation.
The batch messages we sent to students fell into two general categories. The first message
type consisted of a weekly study tip on how to use study time effectively. When sending these
messages, we took advantage of knowing when students planned to study from the calendars they
completed, sending the messages 15 minutes prior to one randomly selected study session. The
second type of message was a weekly check-in from the students’ coaches, which was designed
mostly to offer support and inquire about how well students were managing their time. To help
effectively close conversations, we sent an automatic follow-up message with a tip or
encouragement if the student did not respond to the original check-in message. A list of example
check-in text messages that we sent throughout the academic year is available in Table C1 in
Appendix C.
Student engagement with the text-messaging program was quite high, with 26 to 66 percent
of treated students responding to our messages each week. In terms of cumulative engagement, 80
15
percent of treated students sent at least one text message back to their coach during the academic
year. We also asked students via text message for feedback on our coaching program, and many
expressed gratitude and appreciation for the study tips and support.11
3.1.2. Personality Test
As in Oreopoulos and Petronijevic (2018), students who were assigned to the control group at both
UTSG and UTM were given a personality test measuring the Big Five personality traits of
agreeableness, conscientiousness, extraversion, openness to experience, and emotional stability.
The test tended to take about 45 to 60 minutes to complete, and students were emailed a report
describing their scores on each trait upon completion of the exercise. Beattie, Laliberté, and
Oreopoulos (2018) describe the personality test in greater detail in the appendix of their paper and
use the resulting data to explore non-academic predictors of performance in university.
3.2. The Intervention at WGU
In this subsection, we provide an overview of the planning module students completed at WGU.
Full documentation is presented in Appendix B.
WGU is a large non-profit online college in the United States.12 Prior to the beginning of
his or her first semester, each new student participates in an online student orientation. As part of
our experiment, randomly-selected undergraduate students who enrolled between January 2 and
11 An anonymized list of student response to our feedback request and more detailed information on student engagement with the text-messaging program are available upon request. 12 See Appendix A for a broad overview of WGU.
16
March 1 of 2017 were additionally required to complete a two-part planning module at the end of
the online orientation.13 The planning module was similar to that which was completed by students
at UofT.
In the first part, we again shared the college's recommendation for weekly study time (1-2
hours per “competency unit”/credit or 3-6 hours per typical course)14 and required students to
complete an interactive weekly planning activity, in which they allocated their time among four
categories (work, study, recreation, family and home) and 21 subcategories.15 Upon completion
of the planning exercise, the second part of the module asked students to organize the college-
assigned Google calendar associated with their WGU email account. This calendar was pre-
populated with categorical events from each of the four primary activity types and students were
required to organize the calendar to match their planning activity allocation. When students
finished organizing their calendars, they submitted a screenshot of their completed calendar as an
enrollment requirement.
With each student having a completed calendar in hand, WGU recreated study events onto
treated students’ calendars each week for the remainder of the semester. Students were able to
modify their study schedules at any time, with study events being visible on students’ Google
calendars, the calendar in the WGU student web portal, and the WGU mobile application. The
81.8 percent of students who installed the WGU mobile application also received mobile
notifications 15 minutes prior to two randomly selected study sessions between 9am and 8pm each
13 Students in the control group only completed the regular online orientation. 14 Among students taking 5 courses, this recommendation amounts to 15 to 30 hours per week of total study time, which is very similar to the recommendation at UofT of 20 to 30 hours. 15 Work- working, commuting, and other work time; study--mentor support, course readings, course writing, group activity, and other study time; recreation-watching tv, socializing, reading, exercise and sports, browsing the internet, and other recreation; and family and home-caring for family, preparing and eating meals, cleaning and laundry, household management, lawn and garden, sleep, and other home and family.
17
week. Additionally, all treated students received study notifications in the WGU web portal
“notification center.”
To help students unpack their semester schedules, we also populated their calendar with
“completion benchmarks.” WGU students digitally meet with a counselor to set their course
schedules prior to the beginning of each semester. In this meeting, they outline the anticipated
start and end dates for each course. Nearly all courses at WGU have a “Course of Study Guide”
or syllabus that divides the course into 4-8 segments or blocks. We combined students’ anticipated
start and end dates with their course syllabi segments to create evenly spaced intermediate
completion benchmarks for each course in which a student is enrolled. These benchmarks were
populated in students’ WGU Google calendars and automatically adjusted to any changes made
by WGU or the students to the scheduled start or end date in WGU's system. Students could view
these benchmarks in the Google calendar, WGU web portal, and WGU mobile app, and students
with the mobile application received a reminder at 4pm two days before each completion
benchmark, reminding them that they would need to complete their benchmark task in the next
two days to stay on track.16 Examples of the benchmark reminders can be found in Table C2 in
Appendix C.
4. Data, Motivating Evidence, and Empirical Strategy
In this section, we describe the data we collected from UTSG, UTM, and WGU, along with our
strategy for estimating treatment effects across the three sites.
16 These completion benchmark notifications were also displayed on all WGU student's web portals.
18
4.1. Experimental Randomization and Sample Description at UofT
We begin the description of the data at UofT with Table 1, which reports the total number of
students in the treatment and control groups, as well as the fractions of students sorted to treatment
and control at each campus. Prior to the experiment, we intended to sort one third of students to
both the treatment and control groups at UTSG17 and to evenly divide students across treatment
and control groups at UTM. Table 1 shows that slightly more than one third of students (35.8
percent) were sorted to the treatment group and slightly less than one third (30.4 percent) were
sorted to the control group at UTSG, while we reached our target fractions at UTM, as the
percentages of students sorted to treatment and control are not statistically different than 50
percent. Across both campuses, we have 3,581 students in our study, with 2,044 coming from
UTSG and 1,537 coming from UTM. The completion rates for the online modules are very high
across both campuses, ranging between 97 and 98 percent. We can match 94 percent of our
experimental sample to the university’s administrative data on course grades, leaving us with an
analysis sample of 3,344 students.18
Tables 2 and 3 present balancing tests UTSG and UTM, respectively, showing that the
treatment and control group are balanced along observable characteristics. The lone exception (out
of 32 tests for mean differences) is that students in the treatment group at UTM report being
slightly more likely to often think about their futures. We demonstrate below that our treatment
effect estimates are robust to controlling for this variable and many other covariates.
17 The remaining one third of students was sorted to a different treatment group, which is the subject of a separate, standalone paper. 18 The university’s grades data only include students who are registered at the end of September in the fall semester of 2017, which is why we are unable to match a small fraction of students who are no longer registered at that time. The match rate to the grades data is not differential by treatment status.
19
In terms of the sample characteristics, approximately half our sample at the UofT campuses
is male, the average student is 18 years old, approximately 40 percent of students speak English
as their first language, 50 percent of students are international, and approximately 75 percent are
in their first year of studies. These characteristics are similar across UTSG and UTM. Differences
start to emerge, however, when one considers variables related to academic preparedness. The
average incoming high school grade average at UTSG is 91 percent, while it is 85 percent at UTM,
reflecting the differences in selectivity across the two campuses. The 75th percentile student at
UTM has a high school grade average of 88 percent, which corresponds to the 25th percentile
student at UTSG. Also consistent with differences in selection criteria, many students at both
campuses intend to earn at least an A- grade average and more than a bachelor’s degree, but the
factions are higher at UTSG (74 percent and 48 percent) than at UTM (62 percent and 40 percent).
It is also the case that only 23 percent of the UTSG sample consists of first-generation students,
while the fraction is considerably higher at UTM, at 34 percent.
With respect to student time commitments, the average student at UTSG expects to study
approximately 18.6 hours per week in university, work approximately 6.4 hours a week for pay
and spends approximately 24 minutes commuting to campus (in one direction). At UTM, students
expect to study 15.6 hours per week, work 8.2 hours for pay and spend 31 minutes commuting to
campus.19 On average, students at UTSG and UTM report spending 13.6 and 11.8 hours per week,
respectively, studying outside of class in high school. In subsection 4.3, we provide descriptive
evidence on student study times during the fall semester at UTSG and UTM, along with the
associations between study time and academic performance.
19 Note that the expected study time per week is collected during the baseline (pre-randomization) survey for both treatment and control group students. This variable differs from the actual (self-reported) study time, which appears in Figure 1 and is gathered during the follow-up survey at the end of the semester.
20
4.2. Experimental Randomization and Sample Description at WGU
At WGU, our study sample includes 6,065 undergraduate students who enrolled between January
2 and March 1 of 2017. Students were randomly assigned to either the treatment or control group
based on the last two digits of their sequentially assigned student number. Table 4 shows the
balance of observable characteristics across treatment and control, indicating that the groups are
mostly balanced in terms of observable characteristics. Among the 16 characteristics presented in
the table, four are statistically different across treatment and control groups. Students in the
treatment group are approximately half a year older, 2 percentage points more likely to work full
time, 2 percentage points more likely to have annual incomes between $45,000 and $65,000, and
2 percentage points more likely to be first-generation students. While there are more statistically
significant differences than one would expect from random assignment, we are able to verify that
the treatment assignment mechanism was followed in over 99.9% cases.20 Furthermore, these
differences are not economically large, and we show below that controlling for these variables
(and many other covariates) does not affect our estimated treatment effects. Finally, our
experimental design also involved randomly assigning graduate students to the planning
treatment.21 While our analysis plan specified that these graduate students be dropped from our
analysis, we show in Appendix D that our sample balances across observable characteristics (1/16
variables differ at the 5% level) when graduate students are included and that our results remain
unchanged.
20 Based on the last two digits of student’s id numbers, only 4/6065 are assigned to a treatment group that does not correspond to the assignment rule. Our estimates are robust to exclusion of these observations. 21 Graduate students assigned to the treatment were not sent benchmark reminders in all courses, but were otherwise treated identically to undergraduate students.
21
In terms of the sample characteristics, approximately 34 percent of the WGU students in
our study are male and the average student is 35 years old – a marked difference from the UofT
sample, where half of the sample is male, and the average student is only 18 years old. Nearly 80
percent of the sample consists of white students, while Hispanic and black students each comprise
approximately 11 percent of the sample. A large majority (75 percent) of students are employed
full time and many (40 percent) have annual incomes of $65,000 or more.22 Approximately 42
percent are first-generation students whose parents did not complete post-secondary education.
4.3. Descriptive Facts on Student Study Time at UofT and WGU
Figure 1 (discussed above in the Introduction) shows that many students at UofT study far less
than the time they have available to do so, with the median student reporting that they studied only
12 hours per week in the fall semester despite having more than 90 hours available. As mentioned,
we construct time available in Figure 1 using the information students provide in our baseline
survey about their expectations for upcoming weekly hours of work (for pay), commuting time to
and from campus each week, time spent attending lectures each week, and time spent sleeping.23
We gathered information on actual (self-reported) study time during the fall semester by
conducting a follow-up survey with students at the end of the fall semester, asking how many hours
they spend studying outside of class during an average week (which is the reported study time
variable in Figure 1) and how many hours they spend studying during a week in which they are
22 One may be concerned that students who work full time do not have available time to increase study intensity. In our analysis of heterogeneous treatment effects below, we show that our estimates do not differ across WGU students by employment status or household income. 23 We acknowledge that there are other demands on students’ time that are not captured by these variables, such as eating, sports and clubs, self-care, church going, etc. To make sure that we are not drastically overstating the time students have available, we have also done calculations where we conservatively assume that students only have 60 hours per week for being productive in school. Taking 60 hours per week as the total available time and subtracting time spent working (for pay), commuting, and attending class, the median student still has 41 hours remaining and 90 percent of students have at least 27 hours per week remaining.
22
preparing for midterms or exams.24 Because the follow-up survey did not have grade incentives
attached, the aggregate response rate was only 48 percent, with 47 percent of students responding
at UTSG and 50 percent of students responding at UTM. However, attrition from the follow-up
survey was not differential by treatment status at either campus.
In Figure 2, we quantify the amount of available time students at UofT are not using toward
studying by subtracting reported study time from available time and plotting the resulting
distribution of remaining time.25 The vertical lines in the figure represent the 25th, 50th, and 75th
percentiles, respectively, indicating that three-quarters of students expect to forgo at least 65 hours
per week in potential study time, 50 percent of students expect to forgo at least 78 hours, and one-
quarter of students expect to forgo more than 87 hours a week. We note again that these
calculations already account for sleeping time, class time, and self-reported expectations for time
required for working and commuting to and from school each week.26
Table 5 presents summary statistics for self-reported student study time at UTSG and UTM in
the fall semester during a typical week and during a week spent preparing for midterms or exams.
Across both campuses, the average student in the control group reports having spent only 15.6
hours outside of class studying during average week in the fall semester.27 During a week of
preparing for midterms or exams, students report studying 24.8 hours, on average – an increase of
nearly 10 hours from a typical week but still only marginally more than the number of hours one
typically spends at a part-time job. In terms of the breakdown across campuses, students at UTSG
24 The sample in Figure 1 is restricted to students in the control groups across both campuses of UofT. 25 We construct this figure by restricting the sample to students in the control group and pooling together students at UTSG and UTM. 26 Using the more conservative calculation that assumes students only have 60 hours per week for being productive in school (see footnote 19), the median student expects to forgo 26 hours per week and 75 percent of students expect to forgo at least 14 hours per week. 27 We focus only on students in the control group in this subsection, deferring an exploration of whether treatment significantly increased student study time to Section 5.
23
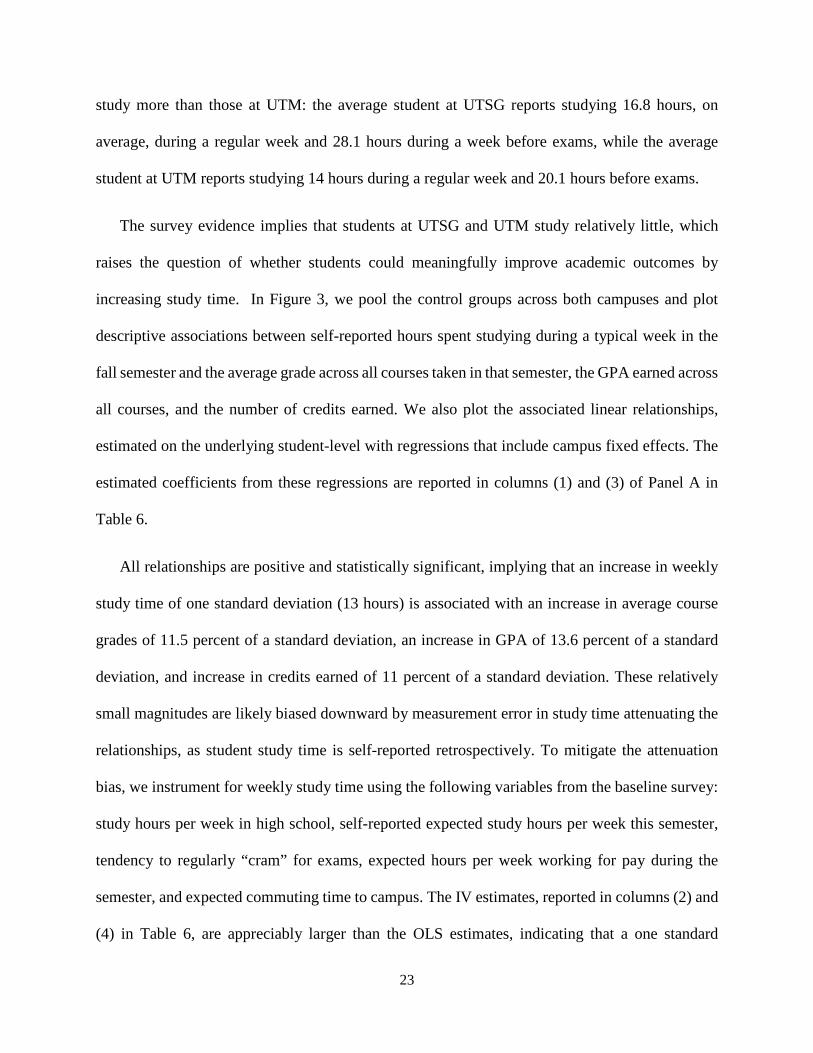
study more than those at UTM: the average student at UTSG reports studying 16.8 hours, on
average, during a regular week and 28.1 hours during a week before exams, while the average
student at UTM reports studying 14 hours during a regular week and 20.1 hours before exams.
The survey evidence implies that students at UTSG and UTM study relatively little, which
raises the question of whether students could meaningfully improve academic outcomes by
increasing study time. In Figure 3, we pool the control groups across both campuses and plot
descriptive associations between self-reported hours spent studying during a typical week in the
fall semester and the average grade across all courses taken in that semester, the GPA earned across
all courses, and the number of credits earned. We also plot the associated linear relationships,
estimated on the underlying student-level with regressions that include campus fixed effects. The
estimated coefficients from these regressions are reported in columns (1) and (3) of Panel A in
Table 6.
All relationships are positive and statistically significant, implying that an increase in weekly
study time of one standard deviation (13 hours) is associated with an increase in average course
grades of 11.5 percent of a standard deviation, an increase in GPA of 13.6 percent of a standard
deviation, and increase in credits earned of 11 percent of a standard deviation. These relatively
small magnitudes are likely biased downward by measurement error in study time attenuating the
relationships, as student study time is self-reported retrospectively. To mitigate the attenuation
bias, we instrument for weekly study time using the following variables from the baseline survey:
study hours per week in high school, self-reported expected study hours per week this semester,
tendency to regularly “cram” for exams, expected hours per week working for pay during the
semester, and expected commuting time to campus. The IV estimates, reported in columns (2) and
(4) in Table 6, are appreciably larger than the OLS estimates, indicating that a one standard
24
deviation increase in study time is associated with an increase in mean grades and GPA in the fall
semester of 22 and 21 percent of a standard deviation, respectively. 28
In Panel (B) of Table 6, we focus only on the relationship between weekly study time and
grades in math or economics courses. We do so to address concerns about grade inflation
attenuating the relationship between study time and course grades, relying on the notion that
grading in math and economics courses is likely to be more objective than in other social science
or humanities courses, resulting in a tighter link between student effort and outcomes. This is
indeed what we find, as the IV estimates indicate that a one standard-deviation increase in weekly
study time is associated with an increase in the mean math and economics grade of 37 percent and
30 percent of a standard deviation, respectively. Taken together, the descriptive relationships that
adjust for measurement error indicate that an additional 10 hours of studying per week is associated
with an increase in mean grades between 2.2 and 4.6 percentage points. Although these estimates
do not reflect a causal relationship, the descriptive relationship between studying and grades is
small when comparing only marginal differences in studying. Large differences – more than 10
hours a week – are needed, all else equal, to observe changes in letter grades (i.e., moving from a
B grade to an A grade). We return to this point in Section 6 below, where we interpret our
treatment effects.
28Brint and Cantwell (2008) also use retrospectively self-reported study time from the University of California Undergraduate Experience Survey to show that a one standard-deviation increase in weekly study time is associated with an increase in GPA of 10 percent of a standard deviation, an estimate that is very close to our OLS estiamte. Accounting for measurement error in retrospective self-reports, Stinebrickner and Stinebrickner (2004) use time-diary data collected at six different times during the academic year at Berea College to estimate that a one standard-deviation increase in daily study time is associated with a 0.43 standard deviation higher college GPA. The authors also find evidence of non-linear effects on study time on grades, where the effect of study time is diminishing. We tested for non-linear effects by adding a quadratic study time term in each of the specifications in Figure 3, but the quadratic terms were not significant in any specification. To compare the estimates from Stinebrickner and Stinebrickner’s daily study time data with those from our weekly data, note that the standard deviation of daily study time in their data is 1.62 hours per day (or 11.34 hours per week) and the standard deviation of GPA is 0.686 points. In our data at UofT, the standard deviation of study time is 13 hours per week and the standard deviation of GPA is approximately 1 point.
25
Turning to the relationship between study intensity and student outcomes at WGU, we note
that we are unable to directly observe the frequency and duration of study time because course
content is hosted on third-party platforms. However, students are able to access all of their courses
through the WGU portal and we observe how frequently students visit this portal. Although these
data do have limitations, they provide a measure of engagement that does not suffer from problems
related to retrospective self-reporting.
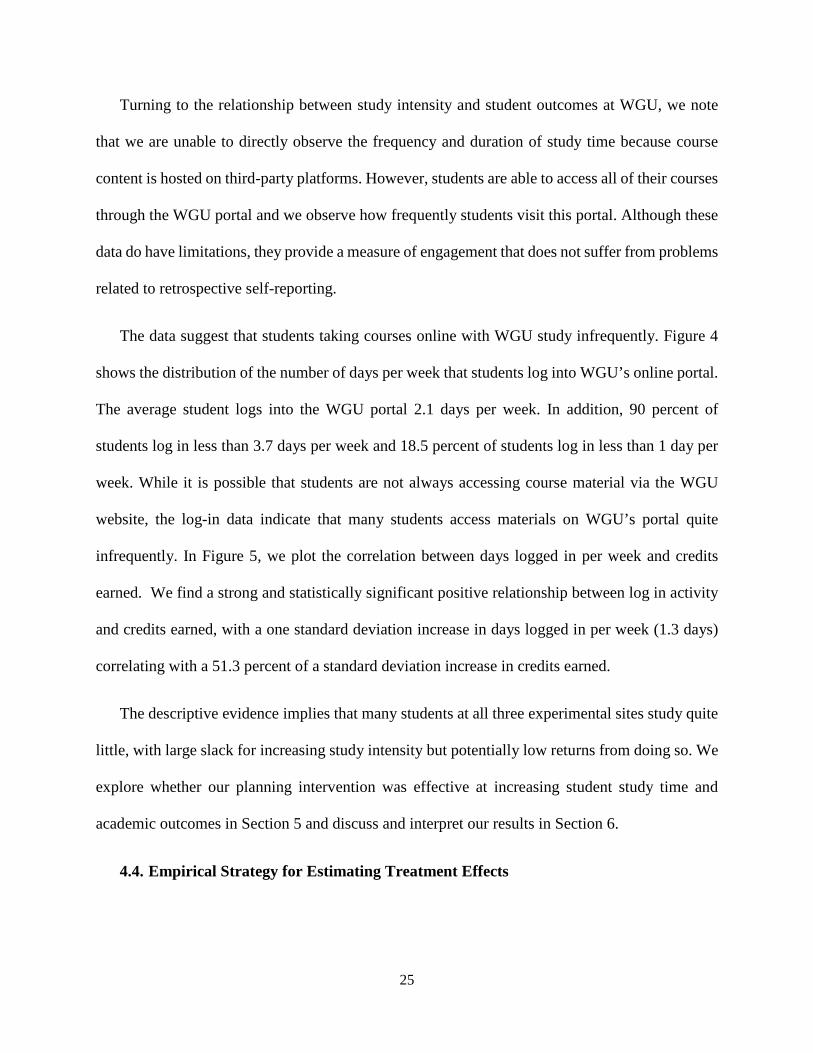
The data suggest that students taking courses online with WGU study infrequently. Figure 4
shows the distribution of the number of days per week that students log into WGU’s online portal.
The average student logs into the WGU portal 2.1 days per week. In addition, 90 percent of
students log in less than 3.7 days per week and 18.5 percent of students log in less than 1 day per
week. While it is possible that students are not always accessing course material via the WGU
website, the log-in data indicate that many students access materials on WGU’s portal quite
infrequently. In Figure 5, we plot the correlation between days logged in per week and credits
earned. We find a strong and statistically significant positive relationship between log in activity
and credits earned, with a one standard deviation increase in days logged in per week (1.3 days)
correlating with a 51.3 percent of a standard deviation increase in credits earned.
The descriptive evidence implies that many students at all three experimental sites study quite
little, with large slack for increasing study intensity but potentially low returns from doing so. We
explore whether our planning intervention was effective at increasing student study time and
academic outcomes in Section 5 and discuss and interpret our results in Section 6.
4.4. Empirical Strategy for Estimating Treatment Effects
26
Having successfully randomized students across treatment and control groups at UTSG, UTM,
and WGU, we estimate the effects of the planning treatment with a comparison of mean outcomes
in a simple regression framework. The main specification, which we estimate separately at each
site, is given by
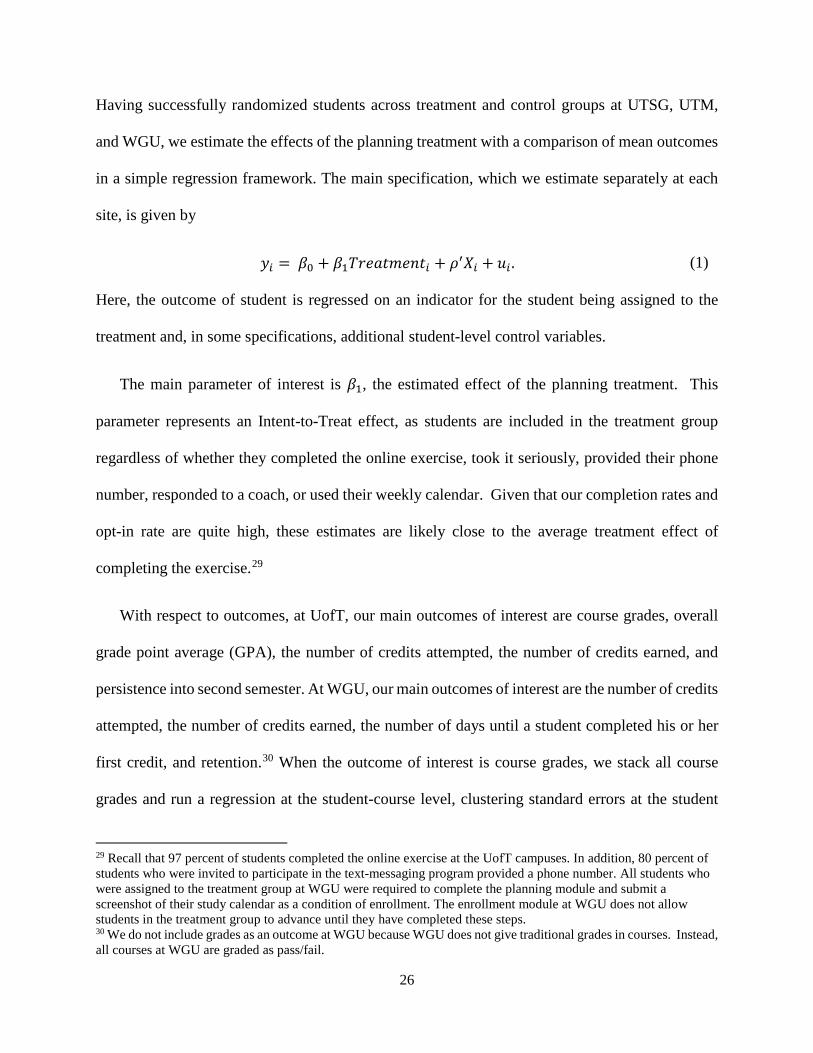
𝑦𝑦𝑖𝑖 = 𝛽𝛽0 + 𝛽𝛽1𝑇𝑇𝑇𝑇𝑇𝑇𝑇𝑇𝑇𝑇𝑇𝑇𝑇𝑇𝑇𝑇𝑇𝑇𝑖𝑖 + 𝜌𝜌′𝑋𝑋𝑖𝑖 + 𝑢𝑢𝑖𝑖 . (1)
Here, the outcome of student is regressed on an indicator for the student being assigned to the
treatment and, in some specifications, additional student-level control variables.
The main parameter of interest is 𝛽𝛽1, the estimated effect of the planning treatment. This
parameter represents an Intent-to-Treat effect, as students are included in the treatment group
regardless of whether they completed the online exercise, took it seriously, provided their phone
number, responded to a coach, or used their weekly calendar. Given that our completion rates and
opt-in rate are quite high, these estimates are likely close to the average treatment effect of
completing the exercise.29
With respect to outcomes, at UofT, our main outcomes of interest are course grades, overall
grade point average (GPA), the number of credits attempted, the number of credits earned, and
persistence into second semester. At WGU, our main outcomes of interest are the number of credits
attempted, the number of credits earned, the number of days until a student completed his or her
first credit, and retention.30 When the outcome of interest is course grades, we stack all course
grades and run a regression at the student-course level, clustering standard errors at the student
29 Recall that 97 percent of students completed the online exercise at the UofT campuses. In addition, 80 percent of students who were invited to participate in the text-messaging program provided a phone number. All students who were assigned to the treatment group at WGU were required to complete the planning module and submit a screenshot of their study calendar as a condition of enrollment. The enrollment module at WGU does not allow students in the treatment group to advance until they have completed these steps. 30 We do not include grades as an outcome at WGU because WGU does not give traditional grades in courses. Instead, all courses at WGU are graded as pass/fail.
27
level. The effects on all other outcomes are estimated with regressions at the student level and
robust standard errors are reported.
5. Results
In this section, we present the estimated effects of the planning treatment on student self-reported
study times (at UofT), online activity (at WGU), and academic outcomes (at both UofT and WGU),
as well as an exploration of heterogeneous treatment effects across various student subgroups.
5.1. Treatment Effects on Student Self-Reported Study Time
We begin by discussing treatment effects on student self-reported study time from the follow-up
survey at UofT and activity on the online portal at WGU.
The average student in the control group at UofT spent 15.6 hours studying outside of class
during a regular week in the fall semester and 24.8 hours studying when exams were approaching.
Table 7 reports estimated treatment effects on both outcomes in the full sample of UofT students
and separately by campus. The estimated average treatment effects are presented, with and without
control variables, respectively, in columns (3) and (4). Treatment effects on study time during a
regular week in the pooled sample range between 1.65 and 1.69 hours and are statistically
significant at the 1 percent level. Students who were assigned to the planning treatment therefore
self-report studying nearly two more hours during a regular study week than non-treated students
and treatment effects are nearly identical across UTSG and UTM, as in indicated in the bottom
two panels of Table 7. The estimates in Table 7 also reveal that the planning treatment did not
affect student study time during exam or midterm periods, on average, as the effects are small and
statistically insignificant in all specifications and across both campuses.
28
In Figure 6, we further investigate the underlying patterns in the treatment effects
throughout the distribution of students by plotting separate densities by treatment and control
group for student study time during an average week and for study time during a week with
midterms or exams approaching. The average treatment effect on study time during an average
week (reported above) appears to stem from the planning intervention causing fewer students to
self-report studying less than 15 hours per week and more students to report studying between 15
and 45 hours per week. The patterns for the densities of study time during an exam period are less
clear, as the planning module resulted in more students reporting studying between 17 and 37
hours but fewer students studying above 50 hours. Because of these competing forces, the
estimated average treatment effect is not statistically differentiable from zero.
In addition to study hours at UofT, we test whether the treatment at WGU affected study
frequency as measured by logins and click data. The main outcomes of interest are the number of
days per week a student logs into WGU’s online portal and the log number of mouse clicks, log
number of mouse moves, and log number of page scrolls. Although these data have limitations
because students are primarily studying outside of the WGU website, they do contain precise
information on frequency and intensity of student interaction with the online portal. Table 8 shows
that for all four outcomes the effects of intervention are small and statistically insignificant. Figure
7 underscores this point, showing that the average number of days students log into the WGU
website during each week of the semester do not significantly differ across the treatment and
control groups.
In sum, we find clear evidence that assignment to the planning-focused warm-up exercise
at UofT caused an increase in self-reported study time during an average week and suggestive
evidence that it also caused an increase in study time during midterm and exam periods. However,
29
we do not find evidence that treated students at WGU significantly changed their study time in
response to the intervention. There are at least three reasons for the contrasting results between
UofT and WGU. First, it is possible that the intervention was effective in the UofT sample but not
the WGU sample. Second, WGU students may have increased study time but we are not able to
detect it given the limitations of our study time data at WGU. Third, treated students at UofT may
have been primed by the treatment materials to inflate their self-reported weekly study time relative
to students in the control group. In Section 6, we present supplemental evidence to suggest that
treated students being primed is an unlikely explanation for our results, showing that we obtained
nearly identical estimates after running a similar experiment the subsequent year at the same UofT
campuses. We also use new data from the follow-up experiment to present additional evidence
against the priming interpretation of our results.
5.2. Treatment Effects on Achievement Outcomes
Table 9 reports treatment effects for several academic outcomes estimated separately at UTSG,
UTM, and WGU. Outcomes at UofT are measured throughout the entire 2017-18 academic year,
while outcomes at WGU are recorded for all students who enrolled between January 2 and March
1 of 2017. We define the ‘retention’ outcome as a binary variable capturing whether a student was
enrolled in the winter semester of the 2017-18 academic year at UofT and whether a student was
enrolled in the semester following the experimental period at WGU.
The planning treatment appears to have no effect on students’ academic outcomes. The
results in Table 9 indicate that treated students do not attempt or earn more credits than students
in the control group and they are not more likely to persist into second semester. These results are
robust across all three experimental sites and to estimating treatment effects with and without other
30
student-level control variables.31 At WGU, there is suggestive evidence that treatment may have
actually reduced retention into next semester, with students in the treatment group being 1.5
percentage points less likely to enroll. This is a small effect, however, corresponding to 1.7 percent
of the mean retention rate.
In Table 10, we investigate treatment effects on course grades and GPA at the UofT
campuses and the number of days until a student earns his or her first credit at WGU. At UofT,
we show treatment effect estimates on course grades from stacked regressions where the unit of
observation is a student-course and standard errors are clustered at the student level. We also
present estimated treatment effects on courses taken during the fall semester, courses taken during
the winter semester, and all courses taken during the full academic year. 32 When the outcome is
student GPA from the full academic year, we run the regression at the student-level and report
robust standard errors.
The planning intervention did not significantly affect student grade outcomes at either
campus of UofT. This result is robust to considering courses from each semester separately and to
including additional control variables. Similarly, at WGU, we find that the planning intervention
did not have any impact on the number of days students needed to complete their first credit. We
provide a more detailed discussion of these estimated null effects in Section 6 below, where we
interpret and reconcile these results with the effects of treatment on study time.
31 At UTSG and UTM, control variables include student age, self-reported study hours per week during high school, expected hours per week studying this semester, expected paid-work hours per week, tendency to think about future goals, tendency to study at the last minute, difficulty transitioning to university, commuting time (in minutes) to campus, and indicator variables for first-year status, international student status, first-generation status, gender, English mother-tongue status, a self-reported desire to earn more than an undergraduate degree, and a self-reported expectation to earn an A- average grade or greater. At WGU, control variables include age, sex, race, first generation status, employment status, and income (bins). 32 Courses from the entire academic year include fall semester courses, winter semester courses, and courses that span both semesters.
31
5.3. Treatment Effects Across Student Subgroups
We now present estimated treatment effects on academic outcomes across a variety of student
subgroups.33 Specifically, at both the UofT campuses and WGU, we investigate whether treatment
effects are differential by student gender, age, employment status, and first-generation status. At
the UofT campuses, we also explore potentially different treatment effects across international and
domestic students and first-year and non-first-year students; while at WGU, we also differentiate
across students by race and by household income.
In Tables 11 and 12, we report the effects of the planning intervention on all course grades
across student subgroups at UTSG and UTM, respectively. The planning module does not appear
to have caused an improvement in student grades among any subgroup of students at UTSG, as no
treatment effect is economically or statistically significant. At UTM, treatment effects are negative
and marginally statistically significant (at the 10 percent level) for male students and those who
expect to work than 8 hours per week at the start of the academic year. However, given the many
hypotheses being tested in the subgroup analyses across UTSG and UTM (24 hypothesis) and the
lack of an overall treatment effect in the main sample, we interpret these negative effects
cautiously, as they are likely due to chance.
Table 13 explores heterogeneous treatment effects on earned credits across student
subgroups at WGU. As in the aggregate analysis, the planning module appears to have no effect
on credit accumulation for any group of students.34 In particular, we note that there are no
differences in treatment effects across students who are employed full-time, part-time, or
33In our analysis of subgroups (and treatment effects in the full sample above), we closely follow our AEA pre-registered analysis plans (registration ID AEARCTR-0000972 at WGU and AEARCTR-0000810 at UofT). 34 Treatment effects across subgroups on credit accumulation and persistence are similarly small and insignificant at both WGU and the campuses of UofT. The results are available upon request.
32
unemployed, suggesting that the absence of a treatment effect in the full sample is not driven by
students who work full-time not having the time available to increase their study effort. Treatment
effects are also similar across students from households with different incomes.
Comparing the estimated treatment effects across all three experimental sites, treatment effects
are similar across older (20 years of age or older at UofT and 30 years of age or older at WGU)
and younger students, suggesting that student maturity (as proxied by age) is not an important
factor in explaining our null treatment effects. It is also the case that treatment effects do not differ
by first-generation status (at both UofT and WGU), international student status (at UofT), or first-
year status (at UofT), indicating that familiarity with institutional features is also unlikely to be an
important moderating factor for treatment effectiveness.
6. Discussion
In this section, we discuss our seemingly contrasting results that treatment increased study time
at UofT while having no effect on academic outcomes. We also discuss the implications of our
results on the broader literature on student decision-making and interventions in higher education.
6.1. Is the Effect on Study Time Real?
Given the positive effects on study time at UofT and the null effects on grades, one may worry
that the study time effect is biased upward by treated students being primed to inflate their self-
reported study time relative to students in the control group. We argue that this is not the case, for
three reasons.
First, supplemental evidence that we obtained from a similar experiment at the UofT campuses
during the subsequent academic year (2018-2019) again shows nearly identical first stage effects
on study time with subsequent null effects on academic outcomes. In the second experiment,
33
treated students completed a slightly modified version of the planning intervention and were again
invited to participate in follow-up text message coaching through the fall semester.35 Students were
also given a follow-up survey at the end of the fall semester in which we asked them how many
hours per week they spent studying during typical week and how many hours they spent studying
during a week with midterms and exams approaching.36 This follow-up survey did have grade
incentives attached in the second experiment, which resulted in a much higher completion rate of
70 percent.37 The supplementary evidence we present here thus suffers less from the potential
concern that only the most motivated students completed the follow-up survey.
Estimated treatment effects on study time from the second experiment are reported in Table
E.1 of Appendix E. In the pooled sample of students from both UofT campuses, treated students
report studying approximately 2.2 hours more than control students during a typical week in the
fall semester. The effect sizes are similar across the two campuses, with students at UTSG studying
about 2.6 hours more per week (14 percent more than the control group) and students at UTM
studying 1.7 hours more per week (10 percent more than the control group). Figure E.1 shows that
the average treatment effect on study time again stems from the planning intervention causing
fewer students to study less than 15 hours per week and more students to study between 15 and 45
hours per week. The results in Table E.1 are also consistent with treatment increasing extra study
time during exam weeks at both campuses but these estimates are not statistically different from
zero.38
35 Students in the control group were assigned to complete the same personality test. 36 In contrast to the follow-up survey used in the first experiment, the question about midterms or exams asked students how many additional hours (relative to regular week studying) they study when midterms or exams are approaching. 37 The completion rate was not differential between the treatment and control groups. 38 The second experiment and its full set of results are the subject of a different, standalone paper. For brevity, we do not discuss the estimated treatment effects on academic outcomes from the second experiment in the current paper. In summary, we again do not find economically or statistically significant effects on academic outcomes, both in the full sample and many student subgroups.
34
Second, to mitigate measurement error concerns that stem from retrospective self-reporting,
we asked students in the second experiment to complete a time-use diary, documenting a complete
breakdown of how they spent their time “yesterday” – that is, the day before they completed the
follow-up survey. In addition to suffering less from measurement error, reported study time in the
time-use diaries is also less likely to be biased by treated students inflating their answers, as the
question did not ask students about study time directly. Instead, we simply asked students to
provide a detailed breakdown of how they allocated their time the day before taking the survey,
allowing them to select from 17 options, 39 and then constructed total study time “yesterday” as
the sum of time spent studying alone, time spent studying with other students, and time spent with
a tutor or instructor (outside of class). We then estimated treatment effects on the amount of time
students reported studying in their time-use diary, again recovering positive treatment effects at
both campuses. Our estimated treatment effects, reported in Table E.2, imply that treated students
studied about 0.25 hours more per day, on average, than students assigned to the control group,
which amounts to approximately a 6 percent increase in study time relative to the control group
mean. The estimated effects on study time are similar across UTSG and UTM and, at
approximately 15 minutes per day, align very closely with our estimates for treatment effects on
self-reported weekly study time.40
Third, although we did not find positive treatment effects on our measures of online activity at
WGU, we note that these measures are imperfect proxies for study time. In particular, we only
39 The options were: sleeping, attending class, studying alone, studying with others, working for pay, meeting with a tutor or instructor, volunteering, commuting, seeing friends, spending time on a computer, spending time on a phone, watching TV, doing extracurricular activities alone, doing extracurricular activities others, eating alone, eating with others, and other activities not listed above. 40 As further support for the intervention affecting study time, we note the subsequent experiment was also conducted at the third campus of UofT, the University of Toronto at Scarborough, and another large university in the great Toronto area, York University. Treatment effect estimates at both sites are similar to those reported here and are available upon request.
35
observe activity (log ins, mouse clicks, mouse moves, and page scrolls) in the online portal that
links students to external courses.41 Course content at WGU is hosted by third-party providers,
which prevents us from observing actual study time and study intensity. Even if we did observe
online coursework, it is possible that students complete much of their studying offline and simply
access their online portals to download course materials. The estimated null effects on our
measures of study activity at WGU therefore do not necessarily contradict the positive effects we
find at UofT.
6.2. Why is there No Effect on Grades?
Given the positive and robust effect on study time at UofT, it is somewhat puzzling that we find
no effect on grades. As noted earlier, however, the association between study time and grades
(even after adjusting for measurement error in study time) is relatively weak. We found that an
additional 10 hours of studying per week is associated with an increase in mean grades between
2.2 and 4.6 percentage points. We corroborate this finding again using the data gathered from our
second experiment at UofT, where we can also instrument for weekly study time using total daily
study time from the time-use diaries on the follow-up survey. The descriptive associations between
study time and grades for the second experimental cohort are reported in Table E.3 in Appendix E
and imply (using the IV estimates that are adjusted for measurement error) that an additional 10
hours of weekly study time is associated with an increase in mean grades between 2.25 and 4.93
percentage points, a range nearly identical the one found in our first experimental cohort.
Recall that our estimated treatment effect on weekly study time at UofT is approximately
1.7 hours per week. Evaluating this increase in study time at the estimated upper bound for the
41 The online portal also includes a calendar, mentoring resources, testing resources, and financial resources.
36
association between weekly study time and grades, we would expect to find an average effect on
grades of 0.84 percentage points. This is a very small effect and one that we do not have the power
to detect.42 Although our estimate of the return to studying is adjusted for measurement error, it
does not reflect a causal link between study time and grades. We attempt to account for this by
performing a back-of-the-envelope calculation that uses the estimate of the causal return to study
time from Stinebrickner and Stinebrickner (2008), who use time-diary data from Berea College
together with an instrumental variables strategy to find that a one-standard deviation increase in
studying per day increases student GPA by 90 percent of standard deviation.43 The standard
deviation of daily study time in their data is 1.62 hours per day (or 11.34 hours per week) and the
standard deviation of GPA is 0.686 points. Importing their estimate of the casual return to studying
into our setting, we would expect to find that increasing studying time by 1.7 hours per week (our
treatment effect) leads to an increase in GPA of 0.09 points – an effect that would be marginally
significant at the 5 percent level but still insignificant at the 1 percent level, given our statistical
power.44
Taken together, our results imply that the planning intervention increased study time by
approximately 1.7 hours per week at the UofT campuses but that the association between weekly
study time and academic outcomes is not large enough for the treatment effect on study time to
translate into an economically and statistically significant effect on course grades and GPA.
42 In Table 10, the standard errors on our estimated treatment effects on fall semester grades are 0.584 and 0.735 percentage points and UTSG and UTM, respectively. The point estimates and standard errors together imply 95-percent confidence intervals of [-1.14, 1.15] and [-1.77, 1.10]. 43 Stinebrickner and Stinebrickner (2008) instrument for study time with a variable indicating whether a student’s roommate brought a video or computer game to campus. 44 Pooling observations from both the UTSG and UTM campuses and including control variables along with campus fixed effects (all in order to increase statistical power) results in an estimated treatment effect of 0.002 points on fall semester GPA, with a corresponding 95-percent confidence interval of [-0.068, 0.073] and a 99-percent confidence interval [-0.091, 0.095].
37
6.3. Why Was the Intervention Unsuccessful and What Can We Learn from It?
In this subsection, we argue that our intervention likely lacked the scale and intensity that are
required to meaningfully affect student outcomes. We conclude the section by offering a
speculative discussion about the implications of our results for future interventions.
6.3.1. Students Did Engage with the Intervention
UofT students engaged enthusiastically with both the online materials and the text message
coaching program. With respect to the materials presented during the online intervention, treated
students responded by initially scheduling more study time into their calendars than they reported
expecting to study during the (pre-randomization) baseline survey.45 As shown in the first block
of Table E.4 in Appendix E, the average treated student at UTSG scheduled 7 more hours than
initially expected at the calendar stage while the average student at UTM scheduled 9.5 hours.
Figure E.2 presents the densities of expected and calendar-scheduled study times for treated
students at both UofT campuses, showing that treatment caused a rightward shift of the expected
study time density, especially for those who planned to study 15 hours or less initially. These
increases in planned study time again underscore that binding time constraints are not the reason
most students do not study more, as many were able to allocate additional time in their weekly
schedules for studying. Further, these results suggest students were reading and processing the
materials presented to them during the intervention, as they increased planned study time by a
large margin at the calendar building stage.
However, treated students did not follow through with their more ambitious study goals. The
second block of estimates in Table E.4 show that the gains in calendar-planned study time over
45 Importantly, the balancing tests in Tables 2 and 3 show that expected study time per week is not different across treatment and control groups.
38
expected study time (at baseline) were completely undone during the semester, as students reported
studying (at follow-up) 8.2 hours less than planned (at the calendar-building stage) at UTSG and
9.5 hours less than planned at UTM.46 Students were unable to follow through with their plans
despite receiving weekly text messages that kept their study goals salient and offered help with
on-going issues. As indicated in Figure E.2 in Appendix E, nearly 70 percent of students replied
to these text messages at least once, with week-to-week response rates varying between 20 and 50
percent. Therefore, not only did students engage with the initial online intervention but many
interacted with the text message coaching service as well.47
6.3.2. The Intervention was Not Comprehensive Enough to Cause and Sustain the
Required Change in Behavior
Given that students seem to have been engaged with the all facets of the intervention, it is
likely that the intervention simply did not have the scope and intensity needed to meaningfully
affect student outcomes.
As shown above, the associations between study time and outcomes imply that marginal
changes in study time are likely not enough to generate a large improvement in academic
outcomes; instead, the descriptive relationships suggest large changes in study habits are required
to meaningfully impact student grades. Furthermore, high-achieving students differ from low-
achieving students along many characteristics other than study time. In Table E.5 in Appendix E,
46 The final block in Table E.4 shows the estimated treatment effects on the difference between self-reported study time from the follow-up survey and expected study time at the baseline survey. Students in the control group at UTSG and UTM report studying 3.3 and 2.4 hours less than expected per week, respectively. The treatment effect at both campuses implies that the mean difference among treated students is approximately 2 hours larger, but it is important to note that treated students also studied less than expected. 47 Supplemental evidence from our second experiment at the UofT campuses indicates that students enjoy participating in these types of coaching programs: 70 percent of participants agreed that the program was helpful for them and 87 percent thought the program should be offered again the following year to a new cohort of students.
39
we restrict the sample to students from the control group across both UofT campuses and regress
several different variables (gathered at baseline) on indicators for students having a fall semester
course grade average that is an A or above, a B, a C, or a D and below (the omitted group). Students
who earned an A average studied more than all other students and 7 hours more per week than
students who earned a D average or less. This difference amounts to approximately 0.54 standard
deviations of weekly study time.
But the remaining associations reported in Table E.5 indicate that there are much more stark
differences between the best- and worst-performing students along other dimensions. For example,
A students have incoming high school grades that are nearly a full standard deviation (0.95 SD)
higher than students who earn a D or below, implying that much of the achievement gap is related
to pre-existing differences in academic preparedness. In addition, top-performing students hold
themselves to a higher standard, expecting to study 3.3 hours more than the worst students and
being 18 percentage points (40 percent) more likely to expect to earn an A average in the upcoming
semester. Relative to students who earn a D or less, students who earn an A average are also much
more likely to believe that they (i) tend to finish what they start (16 percent), (ii) manage their time
well (42 percent), (iii) do not study at the last minute for exams (23 percent), and (iv) think about
the future (9.6 percent). They also start the online exercise approximately two days earlier at the
beginning of the fall semester, which is consistent with them having a lower tendency to
procrastinate (Beattie, Laliberte, and Oreopoulos 2018).
These descriptive associations, along with the evidence that treated students drastically failed
to reach their calendar study goals, suggest that a more intense intervention is likely required to
help students (i) compensate for lower incoming ability, (ii) set and maintain much more ambitious
study goals, and (iii) meaningfully change their broader approach to post-secondary studies. Many
40
successful interventions in post-secondary settings offer such exhaustive programs, consisting of
a combination of tutoring, comprehensive and personalized advising, future planning, and some
form of financial aid (Scrivener and Weiss 2013; Bettinger and Baker 2014; Andrews, Imberman,
and Lovenheim 2016; Evans, Kearny, Perry, and Sullivan 2017). These efforts target a student’s
entire routine and approach to school, with personal support and frequent encouragement. Less
comprehensive, low-touch interventions have proven effective at affecting outcomes that require
students to take a series of well-defined steps (Castleman and Page 2015; Castleman and Page
2016), but such programs have largely been unable to affect outcomes such as grades or credit
accumulation, which require sustained changes in behavior (Castleman and Meyer 2016;
Oreopoulos and Petronijevic 2018).
7. Conclusion
In this study, we examine whether an intervention focusing on study time can improve student
outcomes in three distinct academic environments: a selective four-year college, a less selective
four-year college, and an online university. Our analysis is motivated by patterns of very low
study times observed among students in our populations and documented by other scholars (e.g.
Babcock and Marks, 2011). Despite recommendations to treat studying like a full-time job,
students at the UofT campuses only report studying 16.8 and 14 hours per week, on average, at
UTSG and UTM, respectively. Further, the median student at UTSG studies only 12 hours per
week while the median student at UTM studies only 10 hours per week. At WGU students only
log on to the course website an average of 2.1 days per week. Although students in each
environment appear to have the ability to increase their studying, we find no impacts of our
planning treatments on academic outcomes at any of the three academic environments we study
and across many demographic subgroups.
41
We find null effects on academic outcomes despite treated students being highly engaged with
the intervention at the UofT campuses – with respect to both the online intervention and text
message coaching – and responding to treatment by increasing study time by approximately 2
hours per week. The effect on study time was not large enough, however, to generate a significant
change in academic performance, as our estimates of the relationship between study time and
grades indicate that we would expect to see at most a 0.84 percentage point (6 percent of a standard
deviation) improvement in course grades. Given the large change in study behavior that is required
to generate meaningful change in student outcomes and the many other characteristics along which
high- and low-performing students differ, it is likely that a more intense and comprehensive
intervention that transforms students’ approach and attitudes towards education is required to
significantly improve academic achievement.
42
References
Arum, Richard, and Josipa Roksa. 2011. “Academically Adrift: Limited Learning on College
Campuses.” Chicago, IL: University of Chicago Press.
Andrews, Rodney J., Scott A. Imberman, and Michael F. Lovenheim. 2016. “Recruiting and
Supporting Low-Income, High-Achieving Students at Flagship Universities.” NBER
Working Paper # 22260. Cambridge, Mass.: National Bureau of Economic Research.
Babcock Philip and Mindy Marks. 2011. “The Falling Time Cost of College: Evidence form Half
a Century of Time Use Data.” The Review of Economics and Statistics. 93(2): 468-478.
Baker, Rachel, Brent Evans, and Thomas Dee, 2016, “A Randomized Experiment Testing the
Efficacy of a Scheduling Nudge in a Massive Open Online Course (MOOC),” AERA
Open, 2 (4)
Beattie, Graham, Jean-William P. Laliberté and Philip Oreopoulos. 2018. "Thrivers and Divers:
Using Non-Academic Measures to Predict College Success and Failure," Economics of
Education Review. 62: 170-182
Beattie, Graham, Jean-William P. Laliberté, Catherine Michaud-Leclerc, and Philip Oreopoulos.
2018. " What Sets College Thrivers and Divers Apart? A Contrast in Study Habits,
Attitudes, and Mental Health," NBER Working Paper # 23588. Cambridge, Mass.:
National Bureau of Economic Research.
Bettinger, Eric, and Rachel Baker. 2014. “The Effects of Student Coaching: An Evaluation of a
Randomized Experiment in Student Advising.” Educational Evaluation and Policy
Analysis. 35(1):3-19.
43
Bettinger, Eric, Sten Ludvigsen, Mari Rege, Ingeborg F. Solli, and David Yeager. 2018.
“Increasing Perseverance in Math: Evidence from a Field Experiment in Norway.”
Journal of Economic Behavior and Organization. 146: 1-15.
Bettinger, Eric, Lindsay Fox, Susanna Loeb, and Eric S Taylor, “Virtual Classrooms: How
Online College Courses Affect Student Success," American Economic Review,
forthcoming.
Brint, Steven and Allison M. Cantwell. 2010. “Undergraduate Time Use and Academic
Outcomes: Results from the University of California Undergraduate Experience Survey
2006.” Teachers College Record. 112(9): 2441-2470.
Buehler, Roger, Dale Griffin, and Michael Ross. 1994. “Exploring the "planning fallacy": Why
people underestimate their task completion times.," Journal of personality and social
psychology, 67 (3),366.
Cadena, Ximena and Antoinette Schoar. 2011. “Remembering to Pay? Reminders vs. Financial
Incentives for Loan Payments”. NBER Working Paper # 17020. Cambridge, Mass.:
National Bureau of Economic Research.
Calzolari, Giacomo and Mattia Nardotto. 2012. “Nudging with Information: A Randomized
Field Experiment". CEPR Discussion Paper # DP8671. London, UK. Center for
Economic Policy Research.
Carrera, Mariana, Heather Royer, Mark Stehr, Justin Sydnor, and Dmitry Taubinsky. 2018 "The
Limits of Simple Implementation Intentions: Evidence from a Field Experiment on
Making Plans to Exercise." NBER Working Paper # 24959. Cambridge, Mass.: National
Bureau of Economic Research.
44
Castleman, Benjamin, and Lindsay Page. 2015. “Summer nudging: Can personalized text
messages and peer mentor outreach increase college going among low-income high
school graduates?" Journal of Economic Behavior & Organization, 115, 144-160.
__________. 2016. “Freshman Year Financial Aid Nudges: An Experiment to Increase FAFSA
Renewal and College Persistence.” Journal of Human Resources, 51(2): 389-415.
Castleman, Benjamin, and Katharine Meyer. 2016. “Can Text Message Nudges Improve
Academic Outcomes in College? Evidence from a West Virginia Initiative.” Center for
Education Policy and Workforce Competitiveness Working Paper # 43. Charlottesville,
VA: University of Virginia.
Clark, Damon, David Gill, Victoria Prowse, and Mark Rush. 2017. “Using Goals to Motivate
College Students: Theory and Evidence from Field Experiments.” NBER Working Paper
# 23638. Cambridge, Mass.: National Bureau of Economic Research.
Doherty, William. 2006. “An Analysis of Multiple Factors Affecting Retention in Web-Based
Community College Courses.” The Internet and Higher Education. 9(4): 245-255.
Damgaard, Mette Trier and Helena Skyt Nielsen. 2018. “Nudging in education.” Economics of
Education Review. 64: 313-342.
Deslauriers, L., Schelew, E. and Wieman, C., 2011. "Improved learning in a large-enrollment
physics class.” Science, 332(6031), pp.862-864.
Dobronyi, Christopher R., Philip Oreopoulos, and Uros Petronijevic. 2017. “Goal Setting,
Academic Reminders, and College Success: A Large-Scale Field Experiment.” NBER
Working Paper #23738. Cambridge, Mass.: National Bureau of Economic Research.
45
Dunlosky, J. and Rawson, K.A., 2012. “Overconfidence produces underachievement: Inaccurate
self evaluations undermine students’ learning and retention.” Learning and Instruction,
22(4), pp.271-280.
Dunlosky, J., Rawson, K.A., Marsh, E.J., Nathan, M.J. and Willingham, D.T., 2013. “Improving
students’ learning with effective learning techniques: Promising directions from cognitive
and educational psychology.” Psychological Science in the Public Interest, 14(1), pp.4-
58.
Ericson, Keith M Marzilli, 2017. “On the Interaction of Memory and Procrastination:
Implications for Reminders, Deadlines, and Empirical Estimation.” Journal of the
European Economic Association, 15(3), pp.692-719.
Evans, William N, Melissa S. Kearney, Brendan Perry, and James X. Sullivan. 2017. “Increasing
Community College Completion Rates among Low-Income Students: Evidence from a
Randomized Controlled Trial Evaluation of a Case Management Intervention.” NBER
Working Paper # 24150. Cambridge, Mass.: National Bureau of Economic Research.
Larry G Epstein, Yoram Halevy. 2018. “Ambiguous Correlation,” The Review of Economic
Studies, rdy008, https://doi.org/10.1093/restud/rdy008
Figlio, David, Mark Rush, and Lu Yin, “Is it live or is it internet? Experimental estimates of the
effects of online instruction on student learning,” Journal of Labor Economics, 2013, 31
(4), 763-784.
Forsyth, Darryl K and Christopher DB Burt. 2008. “Allocating time to future tasks: The effect of
task segmentation on planning fallacy bias," Memory & cognition, 36 (4), 791-798.
46
Fryer, Roland G. 2016. "Information, Non-Financial Incentives, and Student Achievement:
Evidence from a Text Messaging Experiment.” Journal of Public Economics. 144:109-
121.
Gollwitzer, Peter M. 1993. “Goal achievement: The role of intentions," European review of
social psychology, 4 (1), 141-185.
Gollwitzer, Peter M, and Paschal Sheeran. 2006. “Implementation intentions and goal
achievement: A meta-analysis of effects and processes," Advances in experimental social
psychology, 38, 69-119.
Himmler, Oliver, Robert Jaeckle, and Philipp Weinschenk.. “Soft Commitments, Reminders and
Academic Performance,” American Economic Journal: Applied Economics, forthcoming.
Kahneman, Daniel and Amos Tversky, 1979, “Prospect theory: An analysis of decision under
risk," Econometrica: Journal of the econometric society, pp. 263-291.
Karlan, Dean, Margaret McConnell, Sendhil Mullainathan, and Jonathan Zinman. 2016. “Getting
to the Top of Mind: How Reminders Increase Saving." Management Science, 62(2):
3393-3411.
Laibson, David. 1997. “Golden Eggs and Hyperbolic Discounting." The Quarterly Journal of
Economics. 112(2): 443-478.
Lavecchia, Adam, Heidi Liu and Philip Oreopoulos. 2016. “Behavioral Economics of Education:
Progress and Possibilities” Handbook of Economics of Education. (5): 1-74.
47
Milkman, Katherine L., John Beshears, James J. Choi, David Laibson, and Brigitte C. Madrian.
2016. "Using implementation intentions prompts to enhance influenza vaccination rates."
Proceedings of the National Academy of Sciences 108(26): 10415-10420.
Morisano, Dominique, Jacob B. Hirsh, Jordan B. Peterson, Robert O. Pihl, and Bruce M. Shore,
2010. "Setting, Elaborating, and Reflecting on Personal Goals Improves Academic
Performance." Journal of Applied Psychology, 95(2): 255-264.
Mullainathan, Sendhil. 2002. “A Memory-Based Model of Bounded Rationality,” The Quarterly
Journal of Economics, 117 (3), 735-774.
Nickerson, David W and Todd Rogers. 2010. “Do you have a voting plan? Implementation
intentions, voter turnout, and organic plan making," Psychological Science, 21 (2), 194-
199.
O’Donogue, Ted and Matthew Rabin. 1999. "Do It Now or Later" American Economic Review,
89(1): 103-124.
Oreopoulos, Philip and Uros Petronijevic. 2018. "Student Coaching: How Far Can Technology
Go?" Journal of Human Resources, 53(2): 299-329.
Oreopoulos, Philip, Uros Petronijevic, Christine Logel, and Graham Beattie. 2018." Improving
Non-Academic Student Outcomes Using Online and Text-Message Coaching" NBER
Working Paper # 24992. Cambridge, Mass.: National Bureau of Economic Research.
Patterson, Richard W. 2018. “Can Behavioral Tools Improve Online Student Outcomes?
Experimental Evidence from a Massive Open Online Course.” Journal of Economic
Behavior and Organization, 153, 293-321.
48
Schippers, Michaéla, Ad Scheepers, and Jordan Peterson, 2015. “A Scalable Goal-Setting
Intervention Closes Both the Gender and Ethnic Minority Achievement Gap.” Palgrave
Communications, 1: Article Number 15014.
Scrivener, Susan and Michael J. Weiss. 2013. “More Graduates: Two-Year Results from an
Evaluation of Accelerated Study in Associate Programs (ASAP) for Developmental
Education Students.” Policy Brief, MDRC.
Solomon, L.J. and Rothblum, E.D., 1984. Academic procrastination: Frequency and cognitive-
behavioral correlates. Journal of counseling psychology, 31(4), p.503.
Stinebrickner, Ralph and Todd R. Stinebrickner. 2004. “Time-use and college outcomes.”
Journal of Econometrics. 121: 243-269.
Stinebrickner, Ralph and Todd R. Stinebrickner. 2008. “The Causal Effect of Studying on
Academic Performance.” The B.E. Journal of Economic Analysis & Policy. 8(1): 1-55.
Twenge, J.M., Campbell, W.K. and Gentile, B., 2012. Generational increases in agentic self-
evaluations among American college students, 1966–2009. Self and Identity, 11(4),
pp.409-427.
Yeager, David, Carissa Romero, Dave Paunesku, Christopher S. Hulleman, Barbara Schneider,
Cintia Hinojosa, Hae Yeon Lee, Joseph O’Brien, Kate Flint, Alice Roberts, and Jill Trott.
2016. “Using Design Thinking to Improve Psychological Interventions: The Case of the
Growth Mindset During the Transition to High School.” Journal of Educational
Psychology. 108(3):374–391.
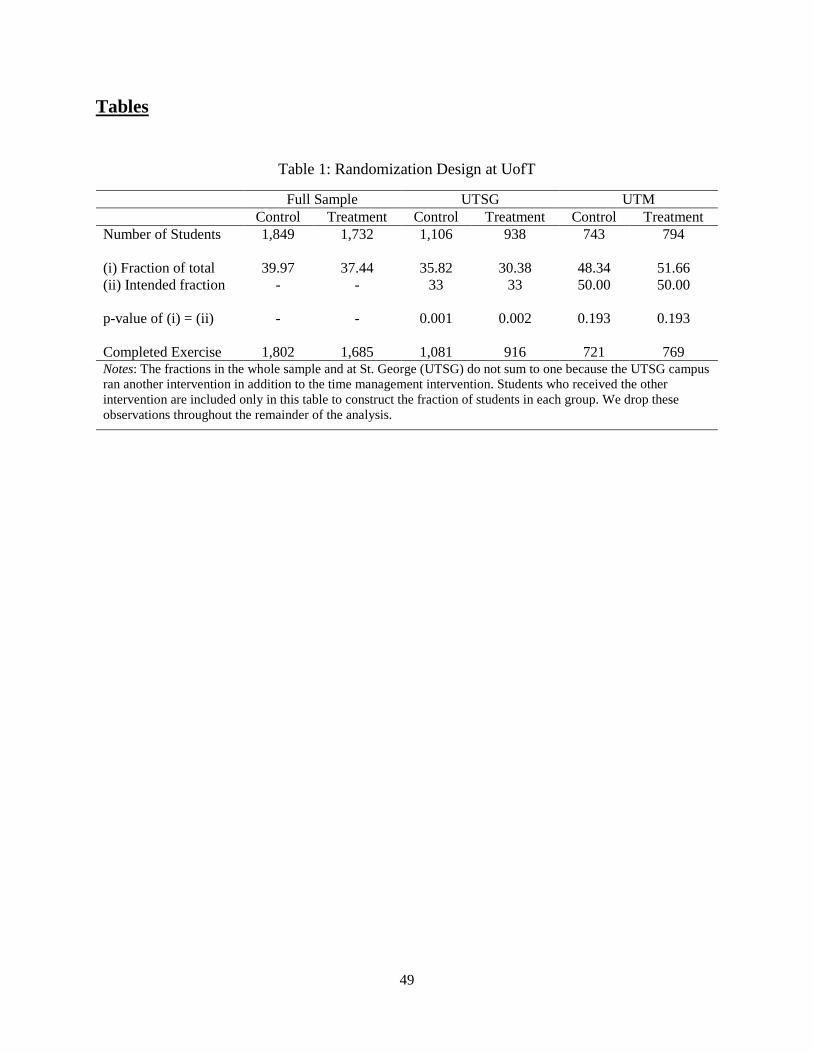
49
Tables
Table 1: Randomization Design at UofT
Full Sample UTSG UTM Control Treatment Control Treatment Control Treatment Number of Students 1,849 1,732 1,106 938 743 794 (i) Fraction of total 39.97 37.44 35.82 30.38 48.34 51.66 (ii) Intended fraction - - 33 33 50.00 50.00 p-value of (i) = (ii) - - 0.001 0.002 0.193 0.193 Completed Exercise 1,802 1,685 1,081 916 721 769 Notes: The fractions in the whole sample and at St. George (UTSG) do not sum to one because the UTSG campus ran another intervention in addition to the time management intervention. Students who received the other intervention are included only in this table to construct the fraction of students in each group. We drop these observations throughout the remainder of the analysis.
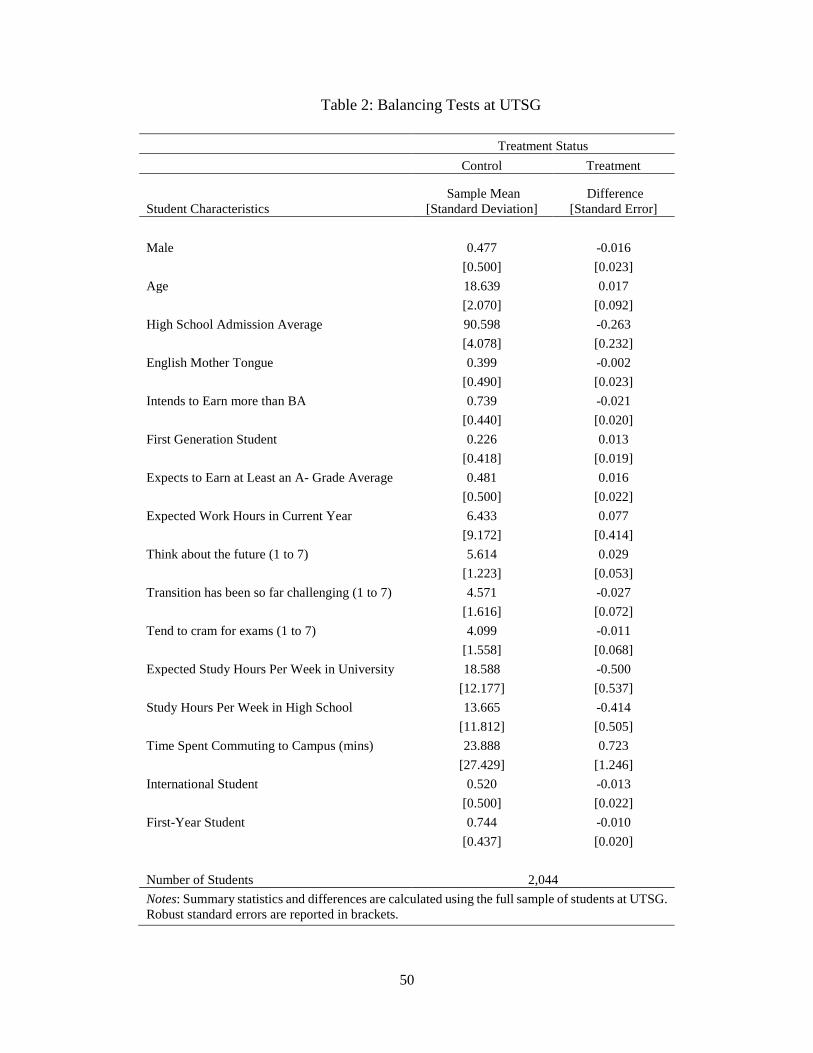
50
Table 2: Balancing Tests at UTSG
Treatment Status Control Treatment
Student Characteristics Sample Mean
[Standard Deviation] Difference
[Standard Error]
Male 0.477 -0.016
[0.500] [0.023] Age 18.639 0.017
[2.070] [0.092] High School Admission Average 90.598 -0.263
[4.078] [0.232] English Mother Tongue 0.399 -0.002
[0.490] [0.023] Intends to Earn more than BA 0.739 -0.021
[0.440] [0.020] First Generation Student 0.226 0.013
[0.418] [0.019] Expects to Earn at Least an A- Grade Average 0.481 0.016
[0.500] [0.022] Expected Work Hours in Current Year 6.433 0.077
[9.172] [0.414] Think about the future (1 to 7) 5.614 0.029
[1.223] [0.053] Transition has been so far challenging (1 to 7) 4.571 -0.027
[1.616] [0.072] Tend to cram for exams (1 to 7) 4.099 -0.011
[1.558] [0.068] Expected Study Hours Per Week in University 18.588 -0.500
[12.177] [0.537] Study Hours Per Week in High School 13.665 -0.414
[11.812] [0.505] Time Spent Commuting to Campus (mins) 23.888 0.723
[27.429] [1.246] International Student 0.520 -0.013
[0.500] [0.022] First-Year Student 0.744 -0.010
[0.437] [0.020]
Number of Students 2,044 Notes: Summary statistics and differences are calculated using the full sample of students at UTSG. Robust standard errors are reported in brackets.
51
Table 3: Balancing Tests at UTM
Treatment Status
Control Treatment
Student Characteristics Sample Mean
[Standard Deviation] Difference
[Standard Error]
Male 0.519 -0.001
[0.500] [0.026] Age 18.627 0.045
[1.337] [0.083] High School Admission Average 84.976 0.245
[4.421] [0.256] English Mother Tongue 0.401 -0.006
[0.490] [0.025] Intends to Earn more than BA 0.616 0.002
[0.487] [0.025] First Generation Student 0.342 0.006
[0.475] [0.024] Expects to Earn at Least an A- Grade Average 0.404 0.006
[0.491] [0.025] Expected Work Hours in Current Year 8.170 0.436
[9.639] [0.495] Think about the future (1 to 7) 5.546 0.127**
[1.220] [0.061] Transition has been so far challenging (1 to 7) 4.747 -0.028
[1.583] [0.081] Tend to cram for exams (1 to 7) 4.079 0.038
[1.453] [0.075] Expected Study Hours Per Week in University 15.622 -0.530
[12.229] [0.611] Study Hours Per Week in High School 11.794 -0.513
[10.637] [0.536] Time Spent Commuting to Campus (mins) 30.908 1.736
[30.576] [1.604] International Student 0.491 -0.032
[0.500] [0.025] First-Year Student 0.759 0.002
[0.428] [0.022]
Number of Students 1,537 Notes: Summary statistics and differences are calculated using the full sample of students at UTM. Robust standard errors are reported in brackets. ** indicates significance at the 5 percent level
52
Table 4: Balancing Tests at WGU
Treatment Status Control Treatment
Student Characteristics
Sample Mean
[Standard Deviation] Difference
[Standard Error] Male 0.347 0.001
[0.476] [0.012] Age 34.771 0.496**
[9.120] [0.238] Hispanic 0.107 0.001
[0.309] [0.008] White 0.790∗ -0.002
[0.408] [0.011] Black 0.108 0.005
[0.311] [0.008] Asian 0.047 -0.006
[0.212] [0.005] Employment status=full time 0.752 0.023**
[0.432] [0.011] Employment status=part time 0.144 -0.014
[0.351] [0.009] Employment status=unemployed 0.104 -0.008
[0.305] [0.008] Income=less than 16, 000 0.070 -0.004
[0.255] [0.007] Income=16, 000 to 24, 999 0.084 0.002
[0.278] [0.007] Income=25, 000 to 34, 999 0.114 -0.010
[0.318] [0.008] Income=35, 000 to 44, 999 0.132 -0.010
[0.338] [0.009] Income=45, 000 to 64, 999 0.196 0.025**
[0.397] [0.011] Income=65, 000 or more 0.404 -0.004
[0.491] [0.013] First generation student 0.423 0.022* [0.494] [0.013] Number of students 6,065 Notes: Summary statistics and differences are calculated using the full sample of students at WGU. Robust standard errors are reported in brackets. ** indicates significance at the 5 percent level, and * at the 10 percent level.
53
Table 5: Summary Statistics for Study Habits from Follow-Up Survey at UofT
Full Sample UTSG UTM Control Treatment Control Treatment Control Treatment
Regular Week 15.595 17.083 16.756 18.525 13.978 15.483
[13.135] [12.262] [13.885] [12.959] [11.842] [11.241]
Midterms/Exams Week 24.779 24.258 28.142 28.105 20.108 19.966
[17.922] [15.253] [18.667] [15.766] [15.072] [13.434]
Observations 871 848 507 446 364 402 Notes: Summary statistics are calculated using all students at both campuses of UofT who completed the follow-up survey. Standard deviations appear in brackets.
54
Table 6: Associations Between Weekly Study Time and Student Grade Outcomes
(1) (2) (3) (4) Panel A: Mean Grade and GPA Across All Fall Courses
Dependent Variable: Mean Fall Grade Mean Fall GPA
OLS
IV Using Baseline Survey OLS
IV Using Baseline Survey
Study Time/Week 0.118*** 0.219*** 0.011*** 0.017***
[0.025] [0.073] [0.002] [0.006]
Mean of Dep Var. 68.46 2.42 [Standard Dev.] [13.03] [1.05]
Observations 792 792 792 792
Panel B: Mean Grade Across Fall Math and Economics Courses
Dependent Variable: Mean Fall Math Grade Mean Fall Economics Grade
OLS
IV Using Baseline Survey OLS
IV Using Baseline Survey
Study Time/Week 0.174*** 0.456*** 0.135*** 0.351***
[0.055] [0.134] [0.043] [0.112]
Mean of Dep Var. 67.84 67.44 [Standard Dev.] [16.11] [15.15]
Observations 284 284 441 441 Notes: The dependent variable in each regression is indicated in the column headings. All regressions are run at the student level and pool all control group observations from the UofT campuses while including campus fixed effects. In columns (2) and (4), we instrument for weekly study time using expected weekly study time at the baseline survey, the expected number of hours students expect to work for pay each week, commute time to campus, self-reported hours spent studying per week in high school, and self-reported tendency to study at the last minute. Robust standard errors are reported in brackets. *** indicates significance at the 1 percent level.
55
Table 7: Treatment Effects on Self-Reported Study Times at UofT
(1) (2) (3) (4) Sample and Control Mean Treatment Treatment
Dependent Variable [Standard Deviation] Difference Difference
Pooled UofT Sample Regular Week Study 15.595 1.651*** 1.691*** [13.135] [0.609] [0.582] 1,719 1,628 Exam Week Study 24.779 -0.084 0.196 [17.922] [0.779] [0.748] 1,714 1,623 UTSG Regular Week Study 16.756 1.769** 1.618* [13.885] [0.870] [0.844] 953 873 Exam Week Study 28.142 -0.037 0.153 [18.668] [1.117] [1.093] 951 871 UTM Regular Week Study 13.978 1.505* 1.633** [11.842] [0.836] [0.796] 766 755 Exam Week Study 20.108 -0.142 0.282
[15.702] [1.063] [1.001] 763 752
Controls? No Yes
Notes: The dependent variable in each regression and the sample used are indicated in the rows of column (1). The unit of observation is a student. Control variables include student age, self-reported study hours per week during high school, expected hours per week studying this semester, expected paid-work hours per week, tendency to think about future goals, tendency to study at the last minute, difficulty transitioning to university, commuting time (in minutes) to campus, and indicator variables for first-year status, international student status, first-generation status, gender, English mother-tongue status, a self-reported desire to earn more than an undergraduate degree, and a self-reported expectation to earn an A- average grade or greater. Robust standard errors are reported in brackets in columns (3) to (4). The number of observations used in each regression appears below the standard errors. *** indicates significance at the 1 percent level; ** indicates significance at the 5 percent level; and * indicates significance at the 10 percent level.
56
Table 8: Treatment Effect on Click Data at WGU
(1) (2) (3) (4) Dependent Variable Control Mean Treatment Treatment
[Standard Deviation] Difference Difference Fraction of Days Logged in 0.417 0.003 0.001
[0.185] [0.005] [0.005]
6,065 6,065
Log Mouse Clicks 7.148 0.026 0.019
[0.685] [0.018] [0.018]
6,065 6,065
Log Mouse Moves 8.269 0.031 0.020
[0.724] [0.019] [0.019]
6,065 6,065
Log Scroll Count 10.491 0.033 0.030
[0.952] [0.024] [0.025] 6,065 6,065 Controls? No Yes Notes: The dependent variable in each regression is indicated in the rows of column (1). The unit of observation is a student. Control variables include age, sex, race, first generation status, employment status, and six income bins: (1) less than 16,000, (2) 25,000-34,999. (3) 35,000-44,999, (5) 45,000-64,999, and (6) 65,000+. Robust standard errors are reported in brackets in columns (3) to (4). The number of observations used in each regression appears below the standard errors.
57
Table 9: Treatment Effects on Credit Accumulation and Retention
(1) (2) (3) (4)
Dependent Variable and Sample
Control Mean Treatment Treatment [Standard Deviation] Difference Difference
Credits Attempted UTSG 3.799 0.025 0.026 [1.243] [0.058] [0.056] 1,860 1,860 UTM 3.611 0.030 0.035 [1.370] [0.070] [0.068] 1,484 1,484 WGU 16.987 0.225 0.226
[9.107] [0.234] [0.228] 6,064 6,064
Credits Earned UTSG 3.479 0.011 0.010 [1.425] [0.065] [0.064] 1,860 1,860 UTM 3.193 -0.119 -0.114 [1.557] [0.080] [0.078] 1,484 1,484 WGU 14.434 0.161 0.144
[10.553] [0.273] [0.267] 6,064 6,064
Retention UTSG 0.997 0.002 0.002 [0.054] [0.002] [0.002] 1,860 1,860 UTM 0.999 0.001 0.001 [0.037] [0.001] [0.001] 1,484 1,484 WGU 0.891 -0.014* -0.016*
[0.312] [0.008] [0.008] 6,064 6,064
Controls? No Yes Notes: The dependent variable in each regression and the sample used are indicated in the rows of column (1). The unit of observation is a student. Control variables used in the UofT samples are described in the notes of Table 7. Control variables use in the WGU sample are described in the notes of Table 8. Robust standard errors are reported in brackets in columns (3) to (4). The number of observations used in each regression appears below the standard errors. * indicates significance at the 10 percent level.
58
Table 10: Treatment Effects on Grades at UofT and Days to Completion at WGU
(1) (2) (3) (4)
Sample and Dependent Variable
Control Mean Treatment Treatment
[Standard Deviation] Difference Difference
UTSG Fall Grades (2017-18) 71.020 0.039 0.002
[14.954] [0.622] [0.584]
5,413 5,413
Winter Grades (2017-18) 69.680 -0.724 -0.648
[17.023] [0.740] [0.714]
4,894 4,894
All Grades (2017-18) 70.306 -0.436 -0.463
[16.043] [0.584] [0.551]
12,241 12,241
GPA (2017-18) 2.507 -0.018 -0.022
[0.996] [0.046] [0.044]
1,860 1,860
UTM Fall Grades (2017-18) 66.447 -0.447 -0.338
[13.622] [0.755] [0.735]
2,951 2,951
Winter Grades (2017-18) 66.470 -1.380 -1.159
[16.366] [0.978] [0.939]
3,143 3,143
All Grades (2017-18) 66.010 -1.203 -1.104
[15.747] [0.764] [0.739]
8,428 8,428
GPA (2017-18) 2.119 -0.025 -0.021
[0.998] [0.054] [0.053]
1,484 1,484
WGU Days to First Completion 33.587 -0.258 -0.238
[27.299] [0.731] [0.750]
5,762 5,762
Controls? No Yes Notes: The dependent variable in each regression and the sample used are indicated in the rows of column (1). Control variables used in the UofT samples are described in the notes of Table 7. Control variables use in the WGU sample are described in the notes of Table 8. When the outcome is course grades, standard errors are clustered at the student level and the unit of observation is a student-course. For other outcomes, robust standard errors are reported, and the unit of observation is a student. Sample size from the regression appears below the standard error.
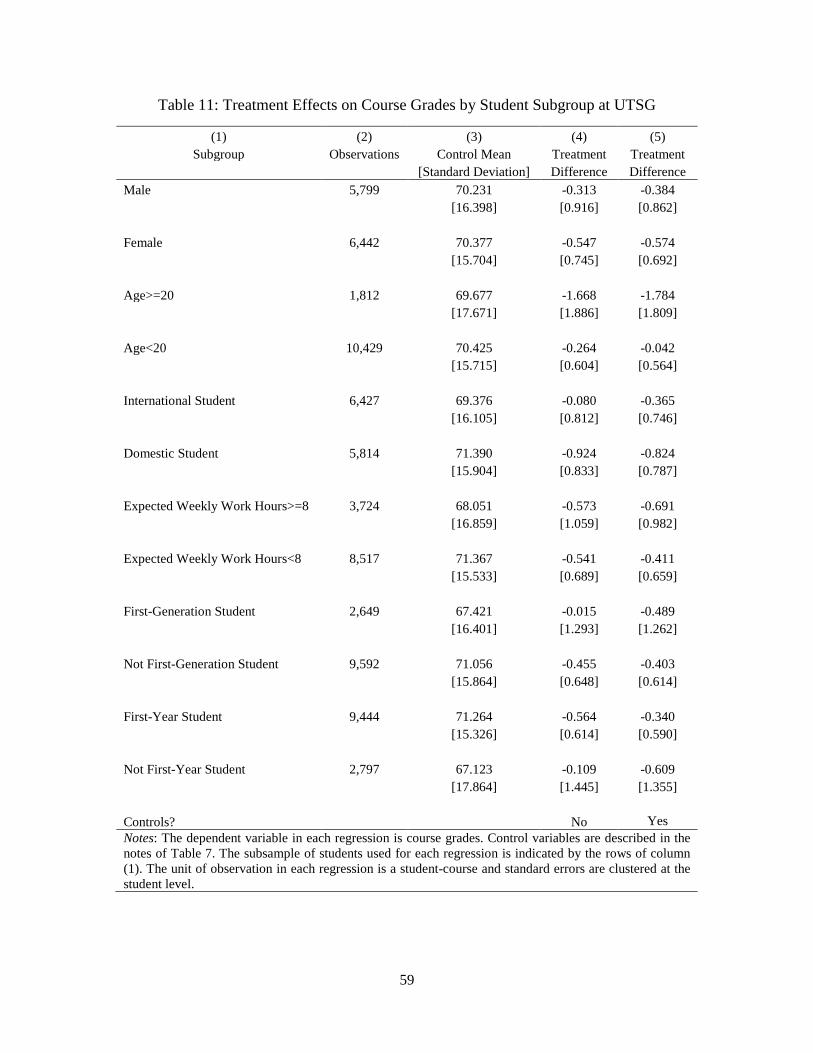
59
Table 11: Treatment Effects on Course Grades by Student Subgroup at UTSG
(1) (2) (3) (4) (5) Subgroup Observations Control Mean Treatment Treatment
[Standard Deviation] Difference Difference Male 5,799 70.231 -0.313 -0.384
[16.398] [0.916] [0.862]
Female 6,442 70.377 -0.547 -0.574 [15.704] [0.745] [0.692]
Age>=20 1,812 69.677 -1.668 -1.784 [17.671] [1.886] [1.809]
Age<20 10,429 70.425 -0.264 -0.042 [15.715] [0.604] [0.564]
International Student 6,427 69.376 -0.080 -0.365 [16.105] [0.812] [0.746]
Domestic Student 5,814 71.390 -0.924 -0.824 [15.904] [0.833] [0.787]
Expected Weekly Work Hours>=8 3,724 68.051 -0.573 -0.691 [16.859] [1.059] [0.982]
Expected Weekly Work Hours<8 8,517 71.367 -0.541 -0.411 [15.533] [0.689] [0.659]
First-Generation Student 2,649 67.421 -0.015 -0.489 [16.401] [1.293] [1.262]
Not First-Generation Student 9,592 71.056 -0.455 -0.403 [15.864] [0.648] [0.614]
First-Year Student 9,444 71.264 -0.564 -0.340 [15.326] [0.614] [0.590]
Not First-Year Student 2,797 67.123 -0.109 -0.609 [17.864] [1.445] [1.355]
Controls? No Yes Notes: The dependent variable in each regression is course grades. Control variables are described in the notes of Table 7. The subsample of students used for each regression is indicated by the rows of column (1). The unit of observation in each regression is a student-course and standard errors are clustered at the student level.
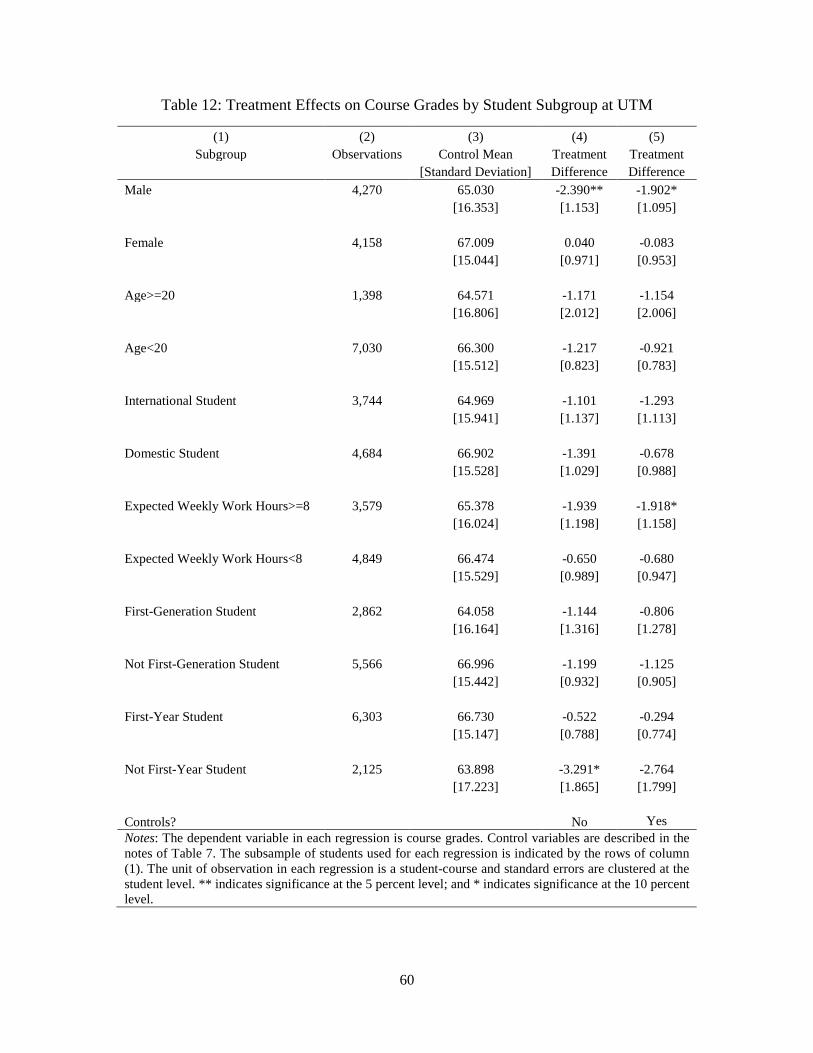
60
Table 12: Treatment Effects on Course Grades by Student Subgroup at UTM
(1) (2) (3) (4) (5) Subgroup Observations Control Mean Treatment Treatment
[Standard Deviation] Difference Difference Male 4,270 65.030 -2.390** -1.902*
[16.353] [1.153] [1.095]
Female 4,158 67.009 0.040 -0.083 [15.044] [0.971] [0.953]
Age>=20 1,398 64.571 -1.171 -1.154 [16.806] [2.012] [2.006]
Age<20 7,030 66.300 -1.217 -0.921 [15.512] [0.823] [0.783]
International Student 3,744 64.969 -1.101 -1.293 [15.941] [1.137] [1.113]
Domestic Student 4,684 66.902 -1.391 -0.678 [15.528] [1.029] [0.988]
Expected Weekly Work Hours>=8 3,579 65.378 -1.939 -1.918* [16.024] [1.198] [1.158]
Expected Weekly Work Hours<8 4,849 66.474 -0.650 -0.680 [15.529] [0.989] [0.947]
First-Generation Student 2,862 64.058 -1.144 -0.806 [16.164] [1.316] [1.278]
Not First-Generation Student 5,566 66.996 -1.199 -1.125 [15.442] [0.932] [0.905]
First-Year Student 6,303 66.730 -0.522 -0.294 [15.147] [0.788] [0.774]
Not First-Year Student 2,125 63.898 -3.291* -2.764 [17.223] [1.865] [1.799]
Controls? No Yes Notes: The dependent variable in each regression is course grades. Control variables are described in the notes of Table 7. The subsample of students used for each regression is indicated by the rows of column (1). The unit of observation in each regression is a student-course and standard errors are clustered at the student level. ** indicates significance at the 5 percent level; and * indicates significance at the 10 percent level.
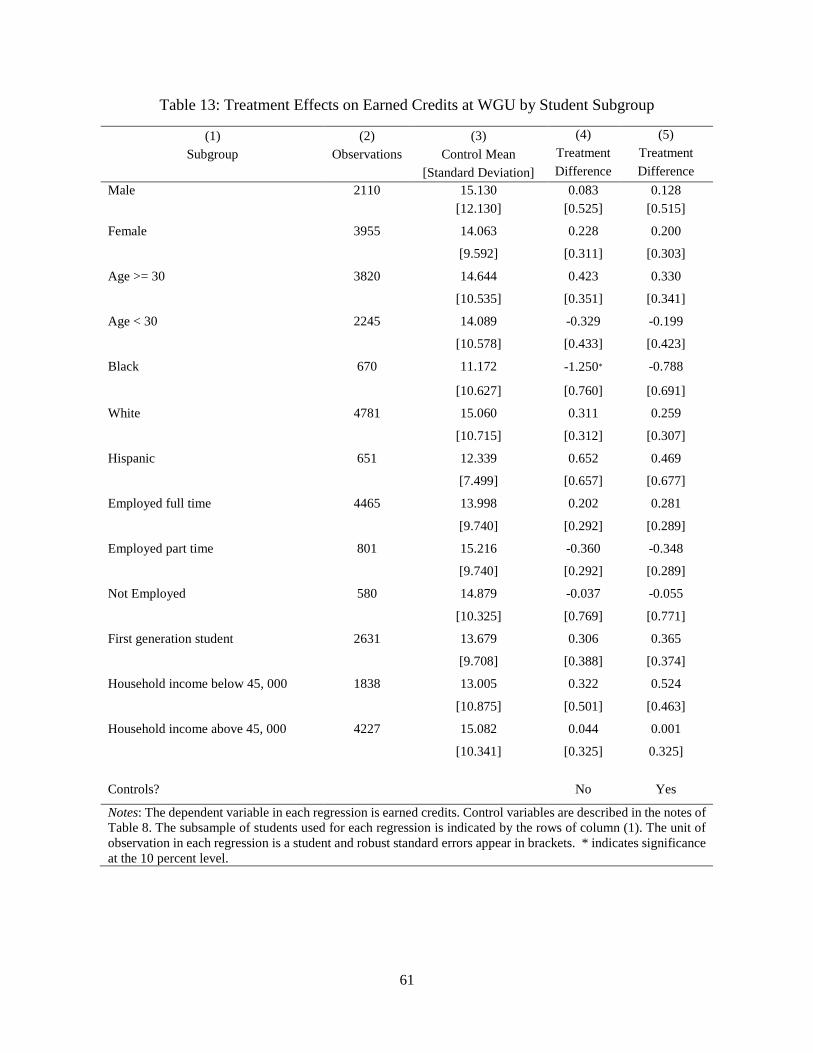
61
Table 13: Treatment Effects on Earned Credits at WGU by Student Subgroup
(1) (2) (3) (4) (5) Subgroup Observations Control Mean Treatment Treatment
[Standard Deviation] Difference Difference Male 2110 15.130 0.083 0.128
[12.130] [0.525] [0.515]
Female 3955 14.063 0.228 0.200 [9.592] [0.311] [0.303]
Age >= 30 3820 14.644 0.423 0.330
[10.535] [0.351] [0.341]
Age < 30 2245 14.089 -0.329 -0.199 [10.578] [0.433] [0.423]
Black 670 11.172 -1.250∗ -0.788
[10.627] [0.760] [0.691]
White 4781 15.060 0.311 0.259 [10.715] [0.312] [0.307]
Hispanic 651 12.339 0.652 0.469 [7.499] [0.657] [0.677]
Employed full time 4465 13.998 0.202 0.281 [9.740] [0.292] [0.289]
Employed part time 801 15.216 -0.360 -0.348 [9.740] [0.292] [0.289]
Not Employed 580 14.879 -0.037 -0.055 [10.325] [0.769] [0.771]
First generation student 2631 13.679 0.306 0.365 [9.708] [0.388] [0.374]
Household income below 45, 000 1838 13.005 0.322 0.524 [10.875] [0.501] [0.463]
Household income above 45, 000 4227 15.082 0.044 0.001
[10.341] [0.325] 0.325]
Controls? No Yes
Notes: The dependent variable in each regression is earned credits. Control variables are described in the notes of Table 8. The subsample of students used for each regression is indicated by the rows of column (1). The unit of observation in each regression is a student and robust standard errors appear in brackets. * indicates significance at the 10 percent level.
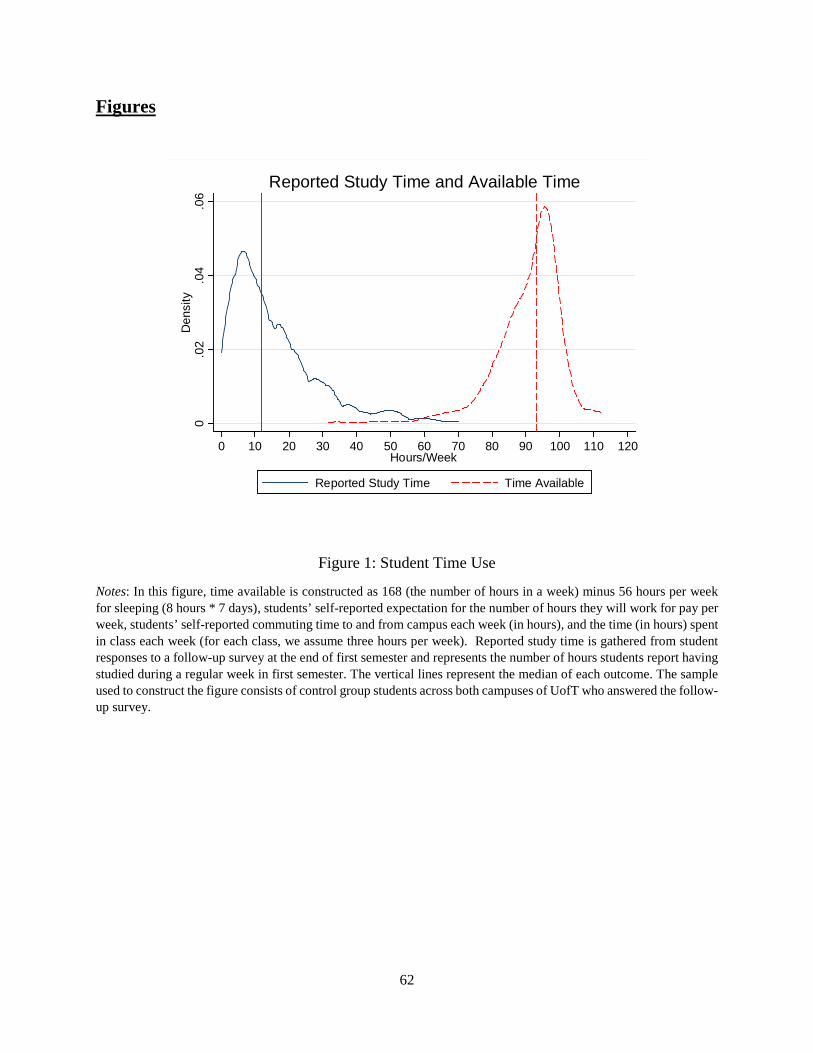
62
Figures
Figure 1: Student Time Use
Notes: In this figure, time available is constructed as 168 (the number of hours in a week) minus 56 hours per week for sleeping (8 hours * 7 days), students’ self-reported expectation for the number of hours they will work for pay per week, students’ self-reported commuting time to and from campus each week (in hours), and the time (in hours) spent in class each week (for each class, we assume three hours per week). Reported study time is gathered from student responses to a follow-up survey at the end of first semester and represents the number of hours students report having studied during a regular week in first semester. The vertical lines represent the median of each outcome. The sample used to construct the figure consists of control group students across both campuses of UofT who answered the follow-up survey.
0.0
2.0
4.0
6D
ensi
ty
0 10 20 30 40 50 60 70 80 90 100 110 120Hours/Week
Reported Study Time Time Available
Reported Study Time and Available Time
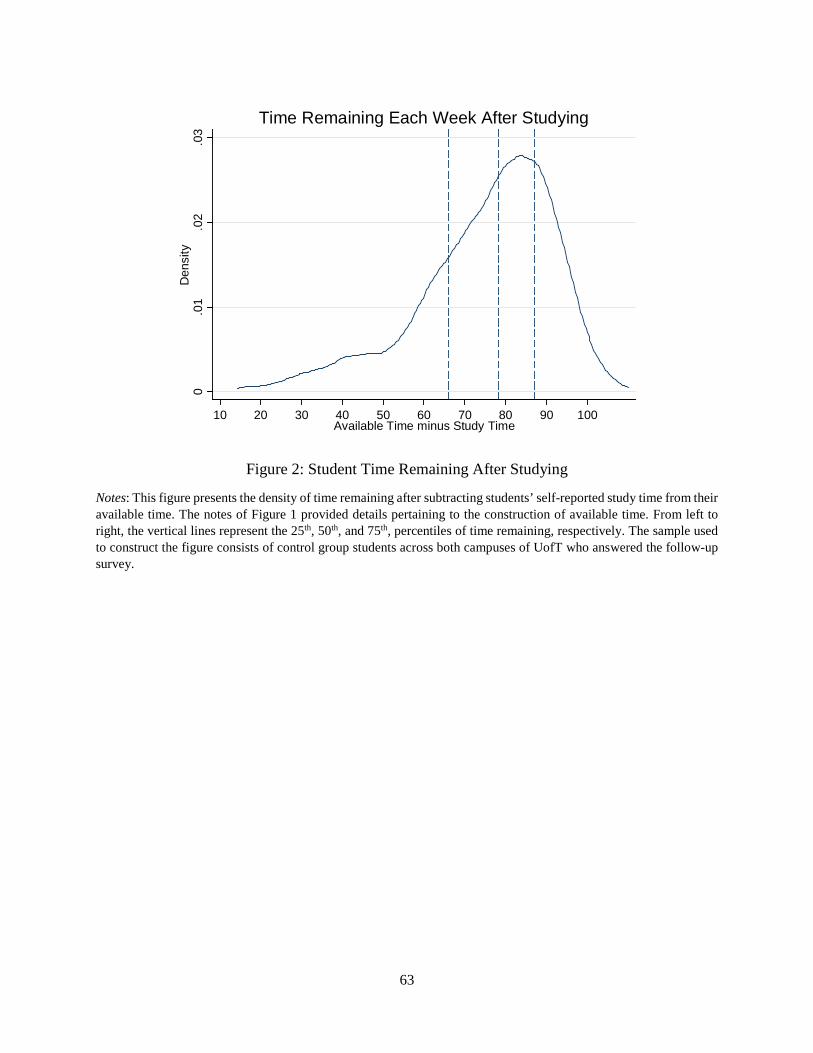
63
Figure 2: Student Time Remaining After Studying
Notes: This figure presents the density of time remaining after subtracting students’ self-reported study time from their available time. The notes of Figure 1 provided details pertaining to the construction of available time. From left to right, the vertical lines represent the 25th, 50th, and 75th, percentiles of time remaining, respectively. The sample used to construct the figure consists of control group students across both campuses of UofT who answered the follow-up survey.
0.0
1.0
2.0
3D
ensi
ty
10 20 30 40 50 60 70 80 90 100Available Time minus Study Time
Time Remaining Each Week After Studying
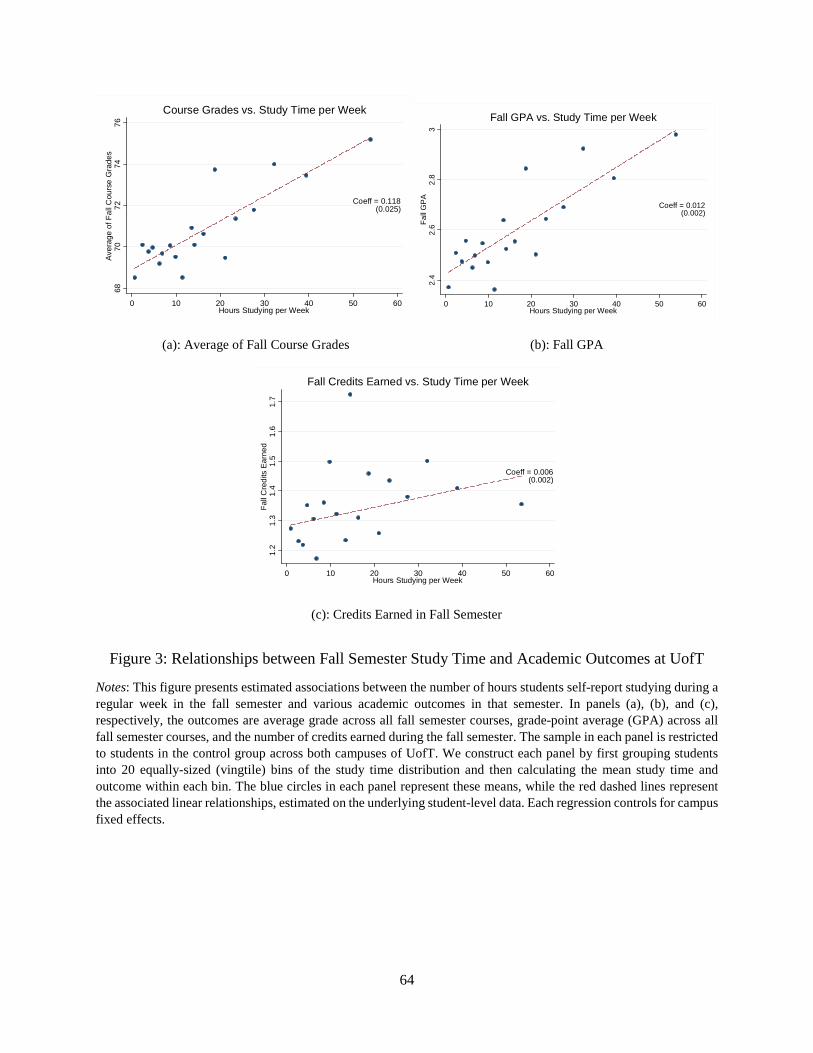
64
(a): Average of Fall Course Grades (b): Fall GPA
(c): Credits Earned in Fall Semester
Figure 3: Relationships between Fall Semester Study Time and Academic Outcomes at UofT
Notes: This figure presents estimated associations between the number of hours students self-report studying during a regular week in the fall semester and various academic outcomes in that semester. In panels (a), (b), and (c), respectively, the outcomes are average grade across all fall semester courses, grade-point average (GPA) across all fall semester courses, and the number of credits earned during the fall semester. The sample in each panel is restricted to students in the control group across both campuses of UofT. We construct each panel by first grouping students into 20 equally-sized (vingtile) bins of the study time distribution and then calculating the mean study time and outcome within each bin. The blue circles in each panel represent these means, while the red dashed lines represent the associated linear relationships, estimated on the underlying student-level data. Each regression controls for campus fixed effects.
6870
7274
76Av
erag
e of
Fal
l Cou
rse
Gra
des
0 10 20 30 40 50 60Hours Studying per Week
Coeff = 0.118(0.025)
Course Grades vs. Study Time per Week
2.4
2.6
2.8
3Fa
ll G
PA
0 10 20 30 40 50 60Hours Studying per Week
Coeff = 0.012(0.002)
Fall GPA vs. Study Time per Week
1.2
1.3
1.4
1.5
1.6
1.7
Fall
Cre
dits
Ear
ned
0 10 20 30 40 50 60Hours Studying per Week
Coeff = 0.006(0.002)
Fall Credits Earned vs. Study Time per Week
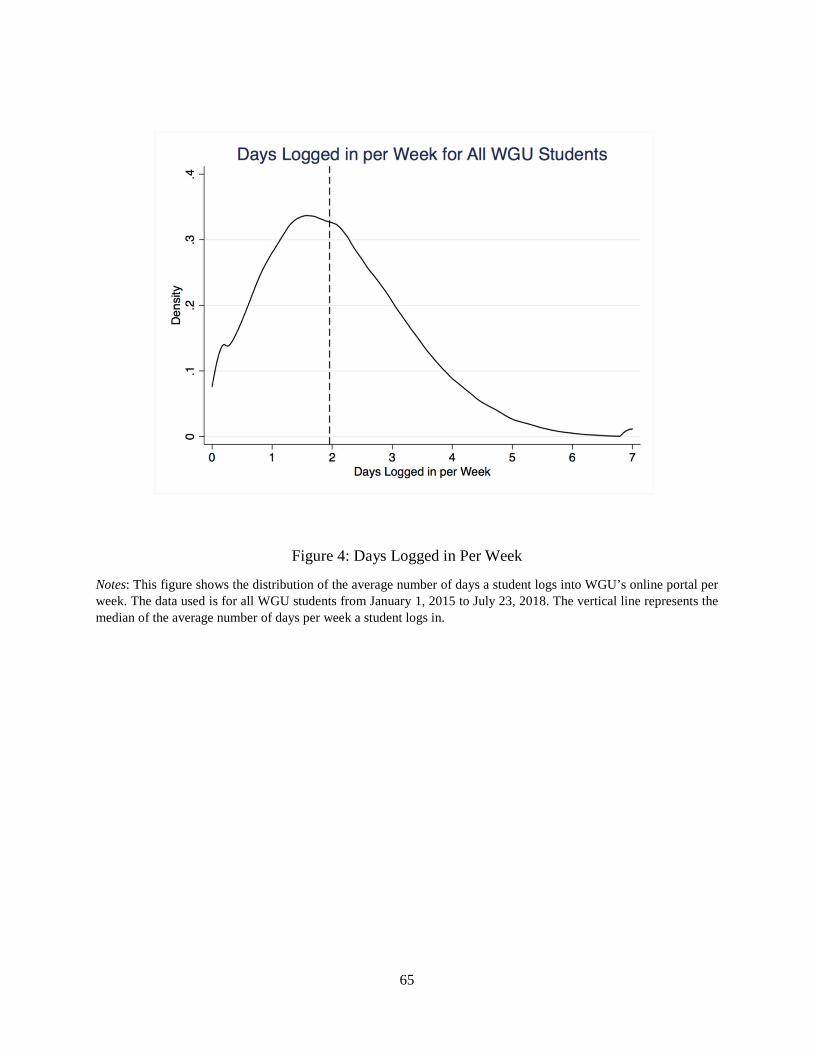
65
Figure 4: Days Logged in Per Week
Notes: This figure shows the distribution of the average number of days a student logs into WGU’s online portal per week. The data used is for all WGU students from January 1, 2015 to July 23, 2018. The vertical line represents the median of the average number of days per week a student logs in.
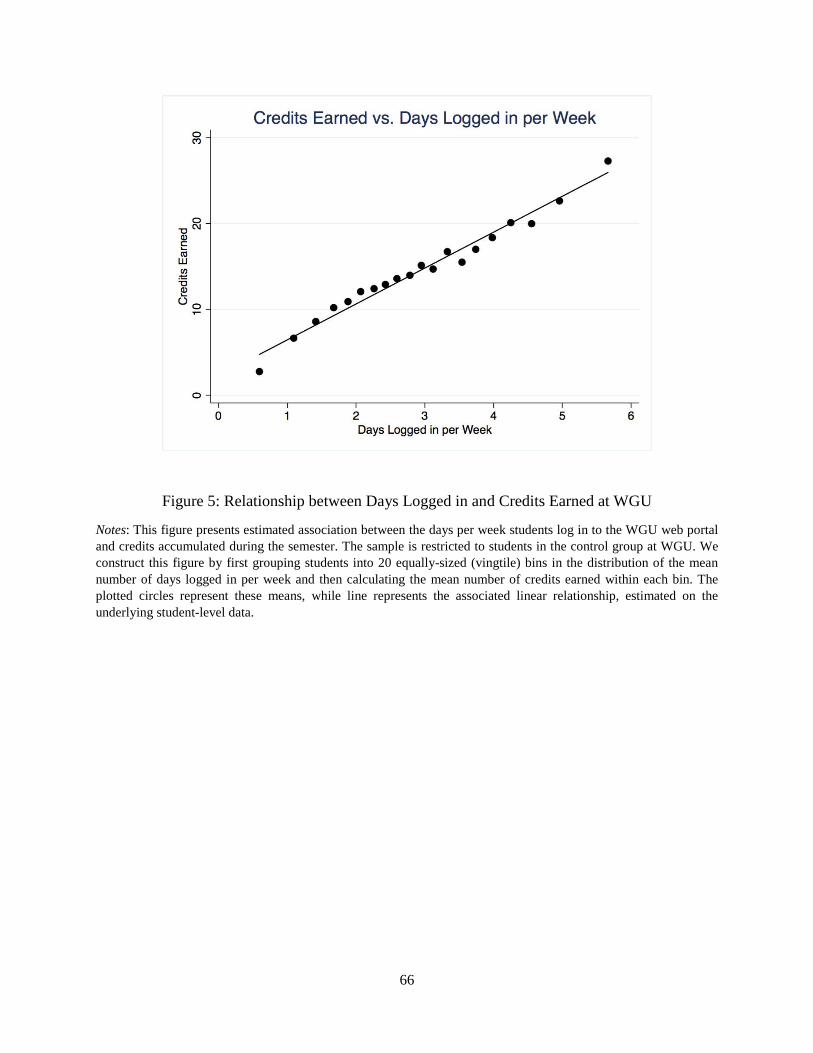
66
Figure 5: Relationship between Days Logged in and Credits Earned at WGU
Notes: This figure presents estimated association between the days per week students log in to the WGU web portal and credits accumulated during the semester. The sample is restricted to students in the control group at WGU. We construct this figure by first grouping students into 20 equally-sized (vingtile) bins in the distribution of the mean number of days logged in per week and then calculating the mean number of credits earned within each bin. The plotted circles represent these means, while line represents the associated linear relationship, estimated on the underlying student-level data.
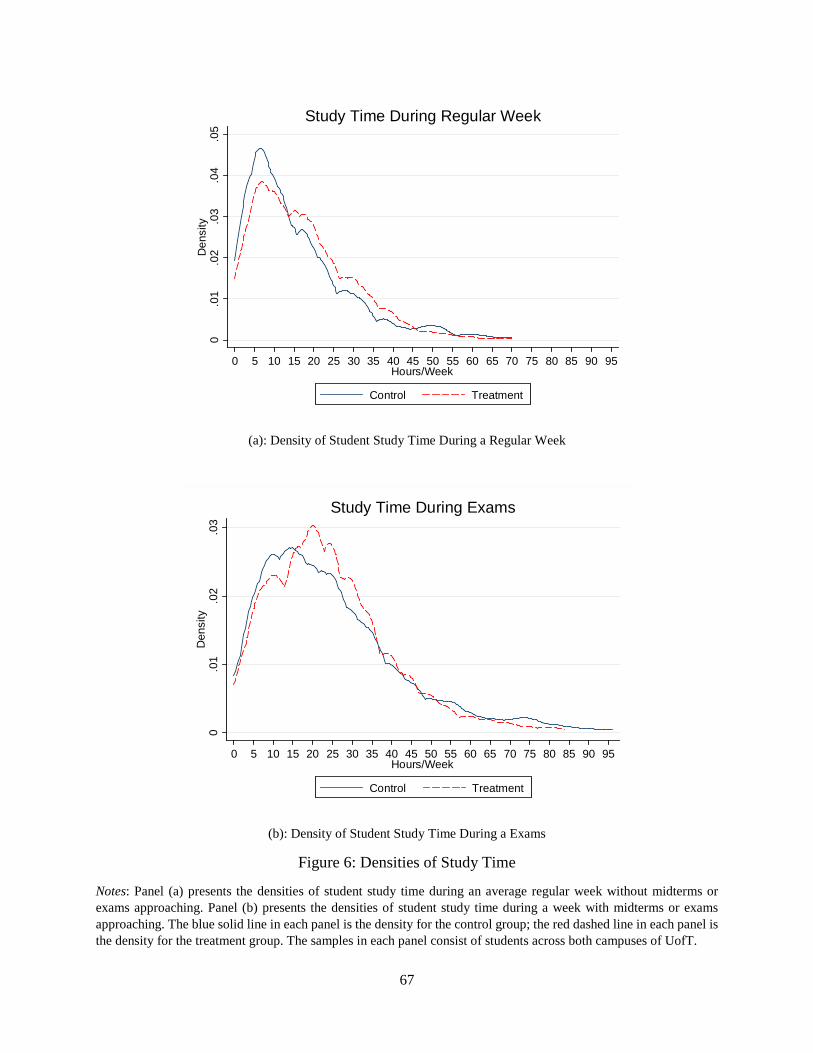
67
(a): Density of Student Study Time During a Regular Week
(b): Density of Student Study Time During a Exams
Figure 6: Densities of Study Time
Notes: Panel (a) presents the densities of student study time during an average regular week without midterms or exams approaching. Panel (b) presents the densities of student study time during a week with midterms or exams approaching. The blue solid line in each panel is the density for the control group; the red dashed line in each panel is the density for the treatment group. The samples in each panel consist of students across both campuses of UofT.
0.0
1.0
2.0
3.0
4.0
5D
ensi
ty
0 5 10 15 20 25 30 35 40 45 50 55 60 65 70 75 80 85 90 95Hours/Week
Control Treatment
Study Time During Regular Week
0.0
1.0
2.0
3D
ensi
ty
0 5 10 15 20 25 30 35 40 45 50 55 60 65 70 75 80 85 90 95Hours/Week
Control Treatment
Study Time During Exams
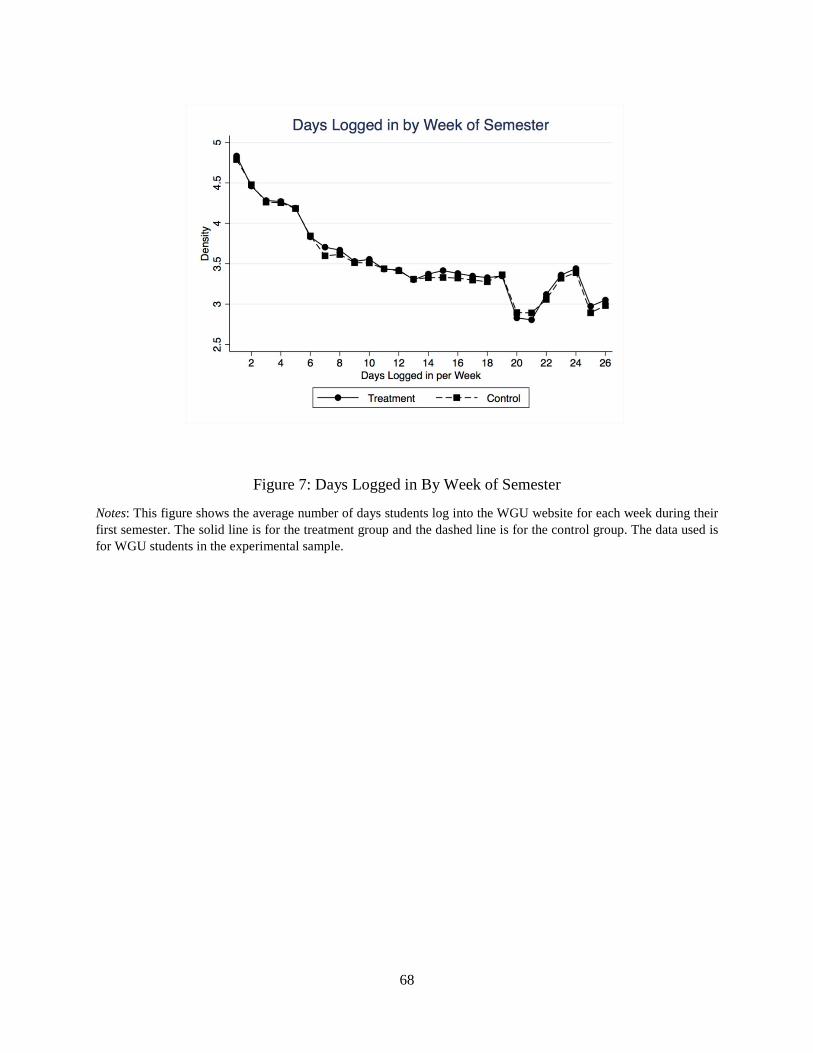
68
Figure 7: Days Logged in By Week of Semester
Notes: This figure shows the average number of days students log into the WGU website for each week during their first semester. The solid line is for the treatment group and the dashed line is for the control group. The data used is for WGU students in the experimental sample.