Embed Size (px)
Citation preview
WHEN SOCIAL MEDIA & AR COLLIDE:
METHODS, MADNESS & METRICS
Joshua Reynolds
Global Technology Practice Director, Hill & Knowlton
Presented to Gartner AR Forum, October 2009
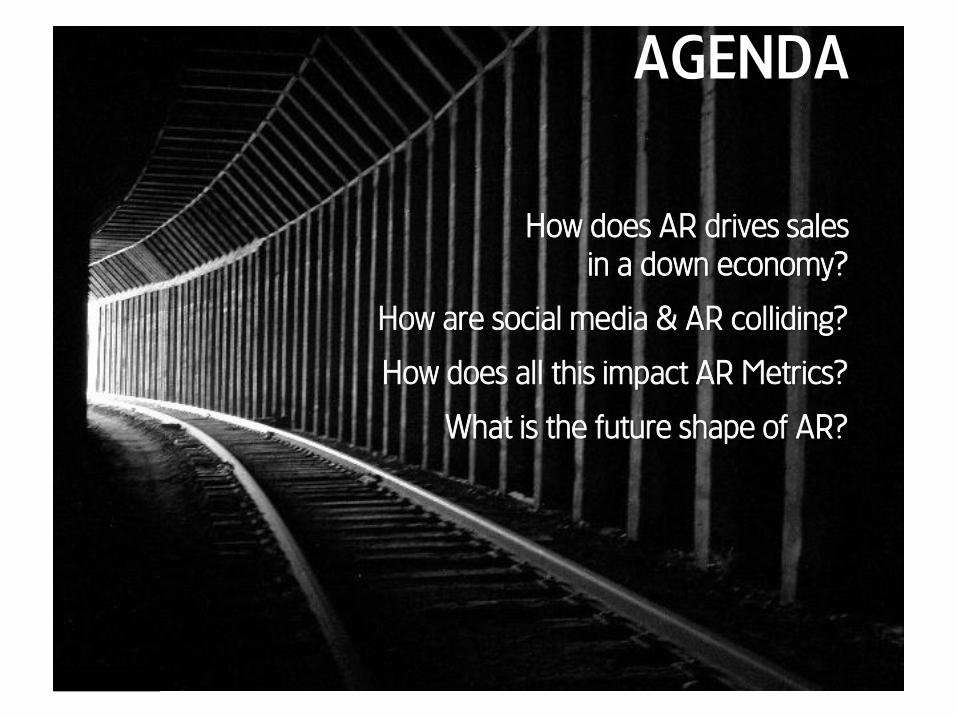
AGENDA
How does AR drives sales
in a down economy?
How are social media & AR colliding?
How does all this impact AR Metrics?
What is the future shape of AR?
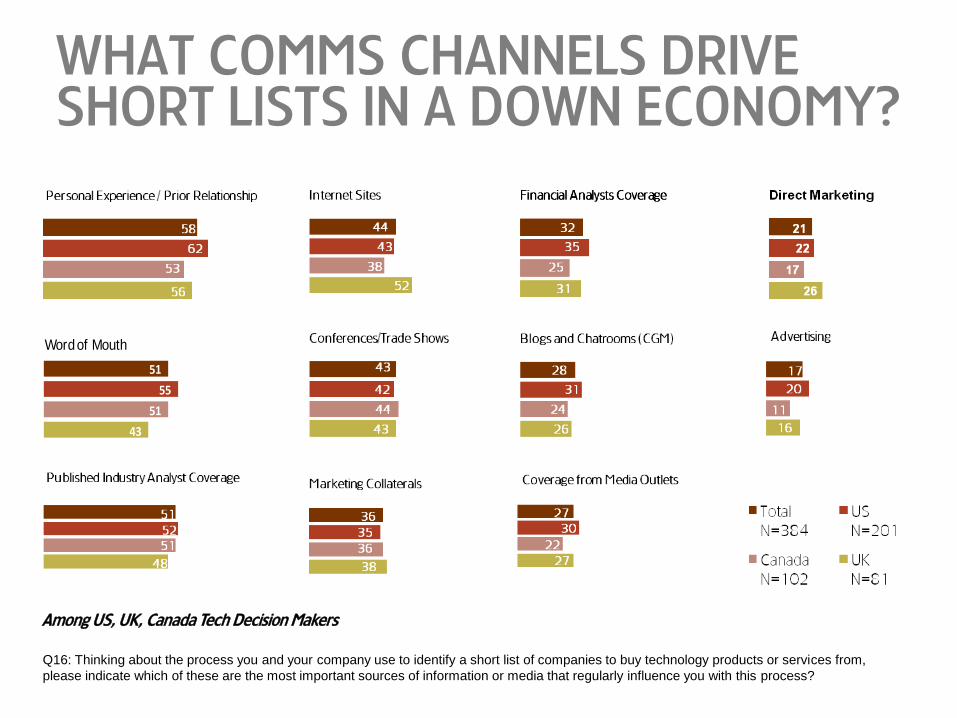
WHAT COMMS CHANNELS DRIVE SHORT LISTS IN A DOWN ECONOMY?
Q16: Thinking about the process you and your company use to identify a short list of companies to buy technology products or services from,
please indicate which of these are the most important sources of information or media that regularly influence you with this process?
Among US, UK, Canada Tech Decision Makers
43
51
55
51
Word of Mouth
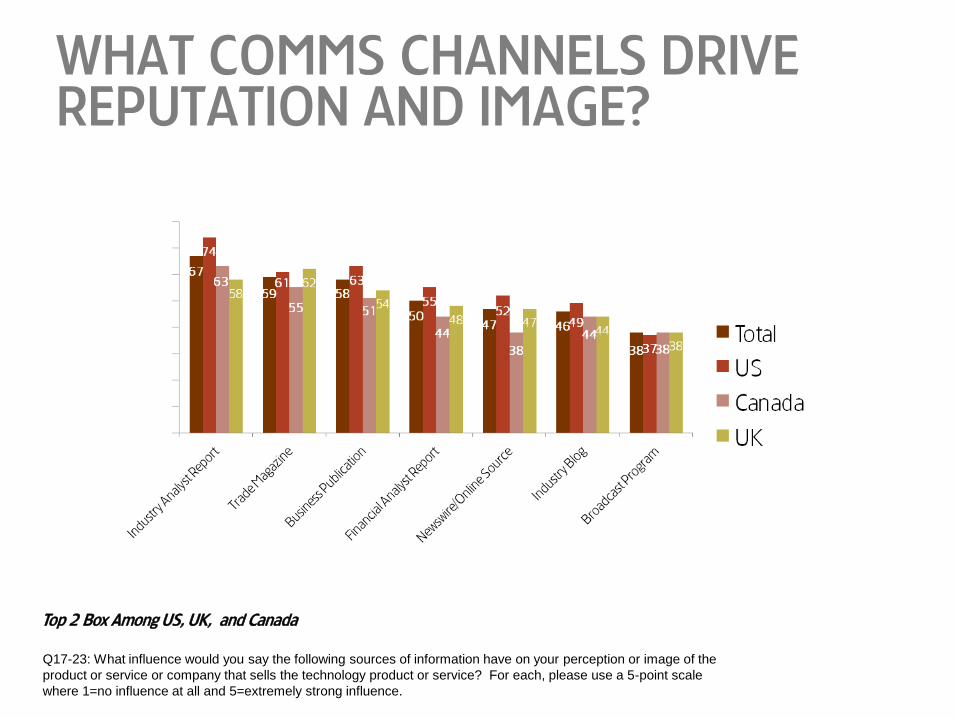
WHAT COMMS CHANNELS DRIVE REPUTATION AND IMAGE?
Q17-23: What influence would you say the following sources of information have on your perception or image of the
product or service or company that sells the technology product or service? For each, please use a 5-point scale
where 1=no influence at all and 5=extremely strong influence.
Top 2 Box Among US, UK, and Canada
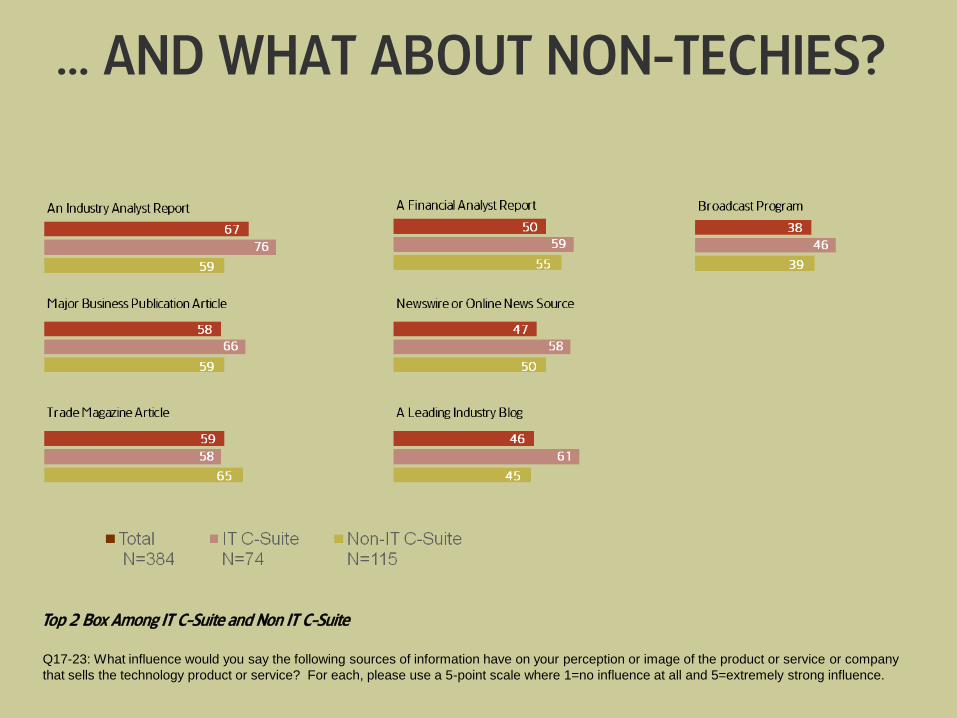
… AND WHAT ABOUT NON-TECHIES?
Q17-23: What influence would you say the following sources of information have on your perception or image of the product or service or company
that sells the technology product or service? For each, please use a 5-point scale where 1=no influence at all and 5=extremely strong influence.
Top 2 Box Among IT C-Suite and Non IT C-Suite
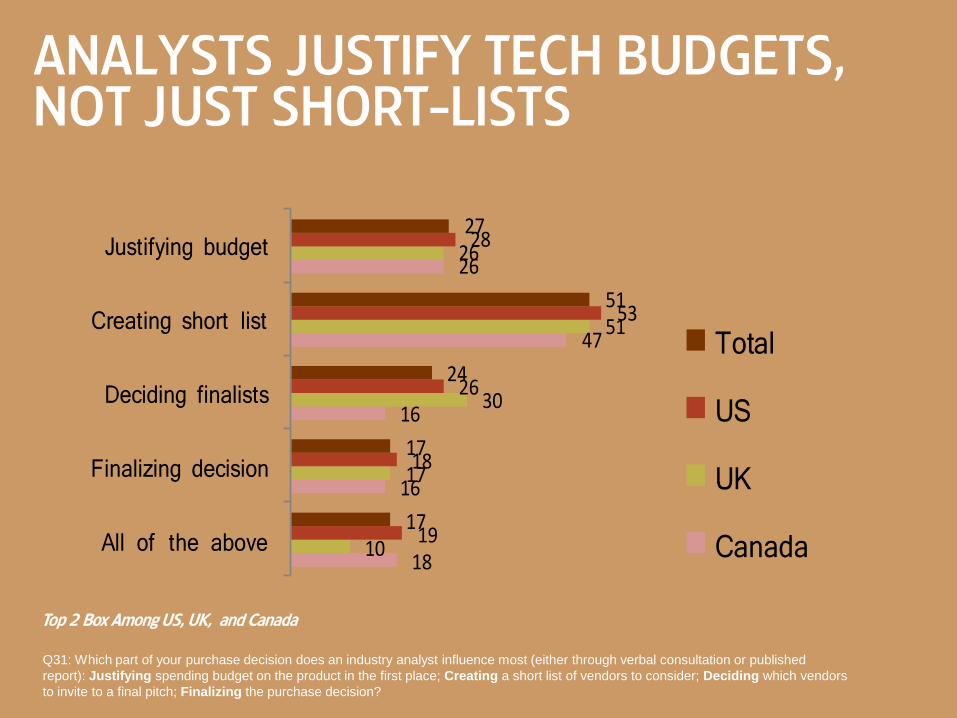
ANALYSTS JUSTIFY TECH BUDGETS, NOT JUST SHORT-LISTS
Top 2 Box Among US, UK, and Canada
Q31: Which part of your purchase decision does an industry analyst influence most (either through verbal consultation or published
report): Justifying spending budget on the product in the first place; Creating a short list of vendors to consider; Deciding which vendors
to invite to a final pitch; Finalizing the purchase decision?
18
16
16
47
26
10
17
30
51
26
19
18
26
53
28
17
17
24
51
27
All of the above
Finalizing decision
Deciding finalists
Creating short list
Justifying budget
Total
US
UK
Canada
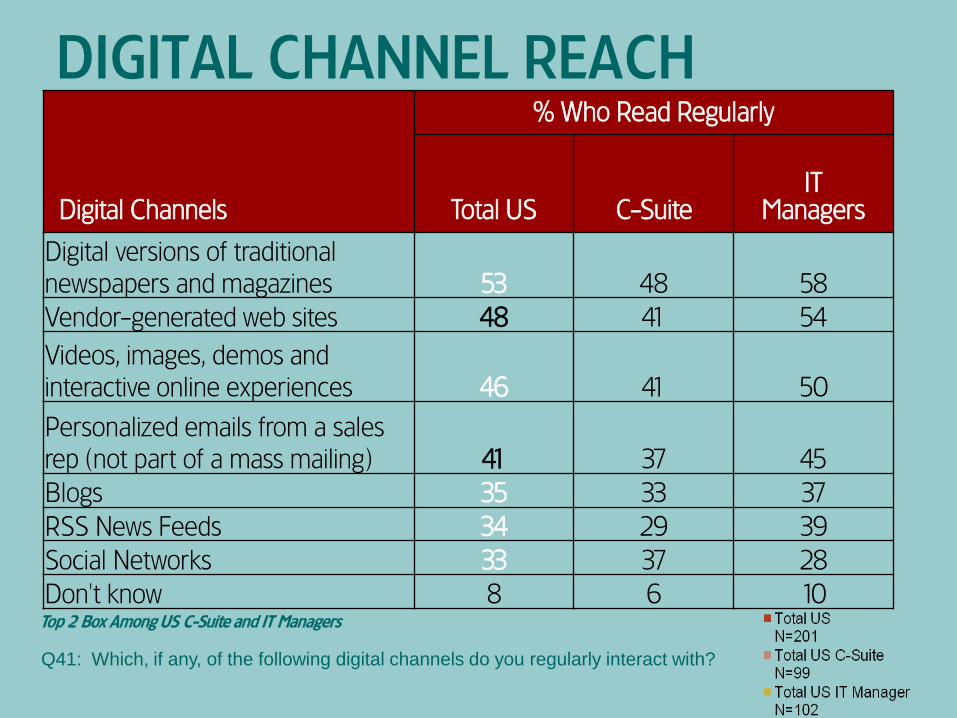
DIGITAL CHANNEL REACH
Digital Channels
% Who Read Regularly
Total US C-SuiteIT
Managers
Digital versions of traditional
newspapers and magazines 53 48 58
Vendor-generated web sites 48 41 54
Videos, images, demos and
interactive online experiences 46 41 50
Personalized emails from a sales
rep (not part of a mass mailing) 41 37 45
Blogs 35 33 37
RSS News Feeds 34 29 39
Social Networks 33 37 28
Don't know 8 6 10Top 2 Box Among US C-Suite and IT Managers
Q41: Which, if any, of the following digital channels do you regularly interact with?
7
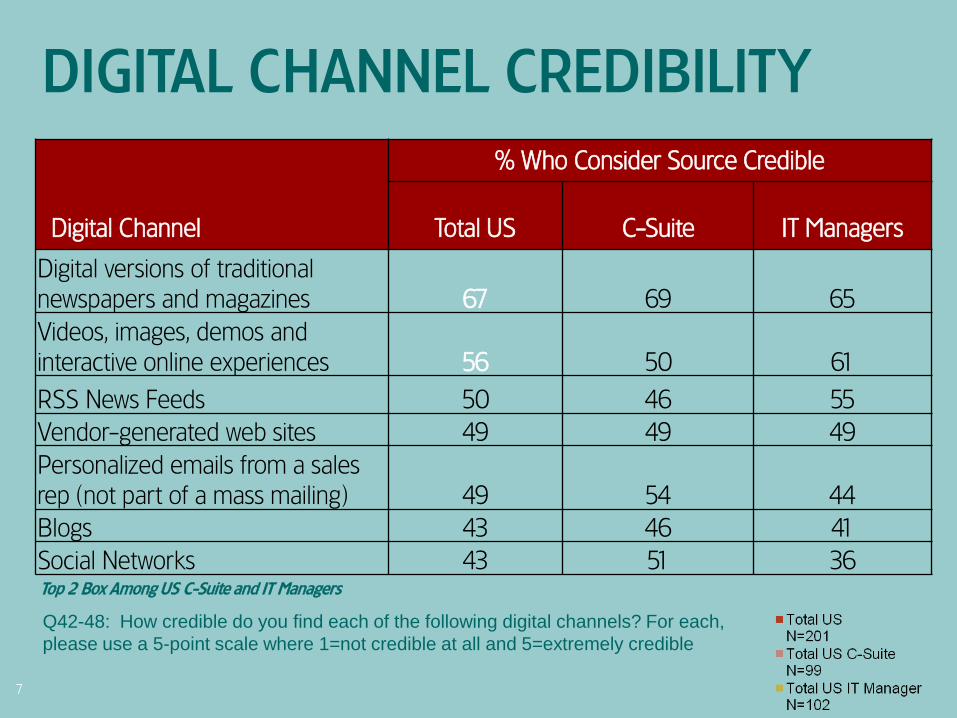
Digital Channel
% Who Consider Source Credible
Total US C-Suite IT Managers
Digital versions of traditional
newspapers and magazines 67 69 65
Videos, images, demos and
interactive online experiences 56 50 61
RSS News Feeds 50 46 55
Vendor-generated web sites 49 49 49
Personalized emails from a sales
rep (not part of a mass mailing) 49 54 44
Blogs 43 46 41
Social Networks 43 51 36
Top 2 Box Among US C-Suite and IT Managers
DIGITAL CHANNEL CREDIBILITY
Q42-48: How credible do you find each of the following digital channels? For each,
please use a 5-point scale where 1=not credible at all and 5=extremely credible
Top 2 Box Among US C-Suite and IT Managers
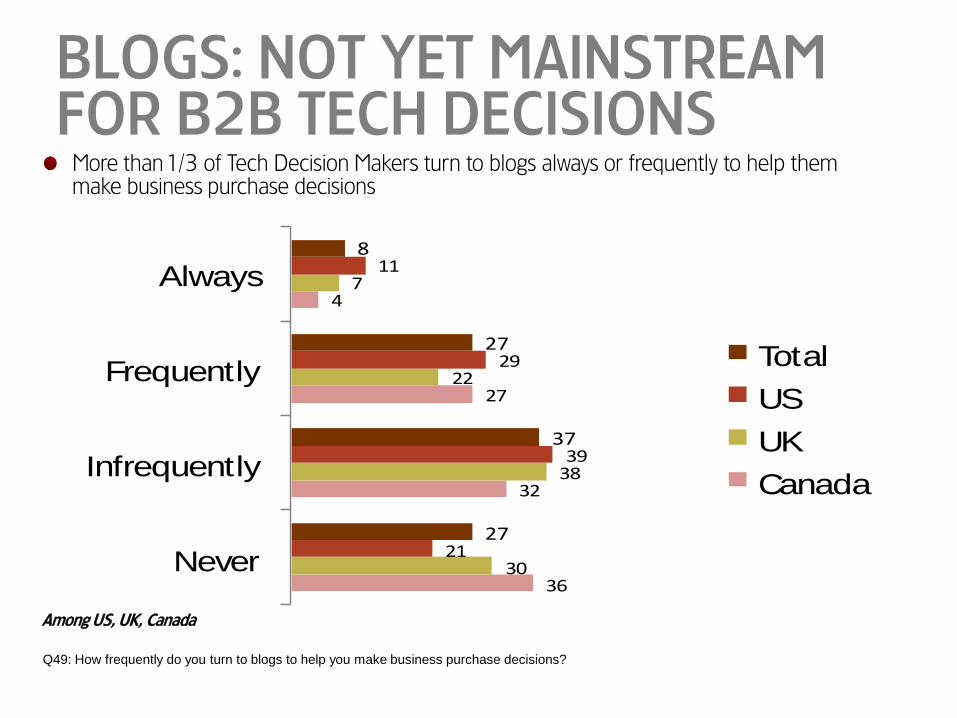
BLOGS: NOT YET MAINSTREAM FOR B2B TECH DECISIONS
36
32
27
4
30
38
22
7
21
39
29
11
27
37
27
8
Never
Infrequently
Frequently
Always
Total
US
UK
Canada
Q49: How frequently do you turn to blogs to help you make business purchase decisions?
Among US, UK, Canada
More than 1/3 of Tech Decision Makers turn to blogs always or frequently to help them make business purchase decisions
34
26
35
33
48
40
35
40
Canada
UK
US
Total
Not likely to participate (1+2)
Likely to Participate (4+5)
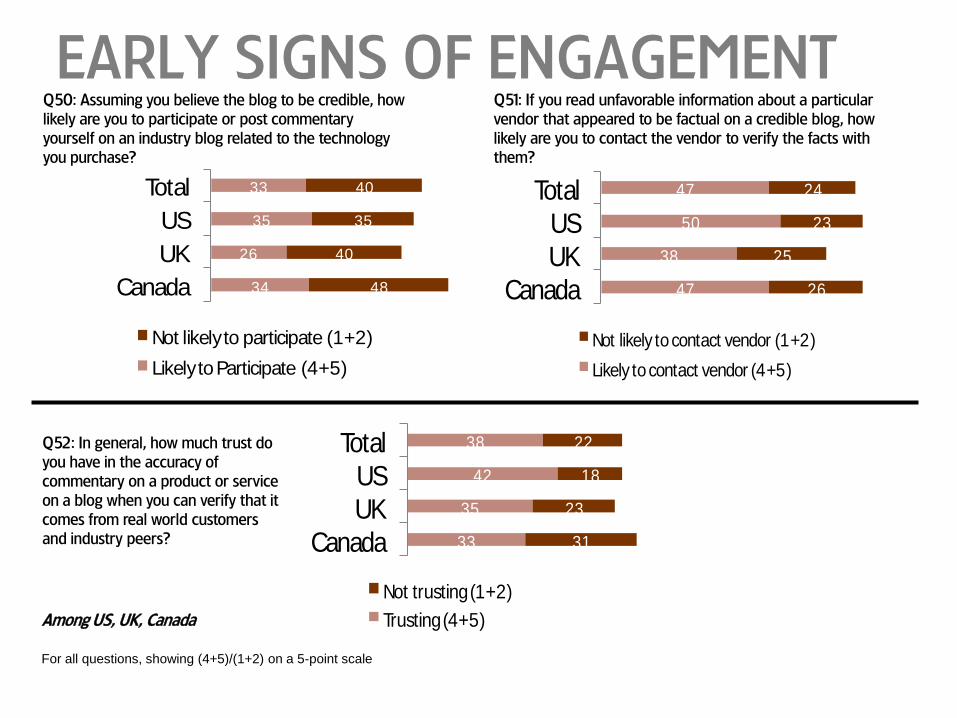
EARLY SIGNS OF ENGAGEMENT
For all questions, showing (4+5)/(1+2) on a 5-point scale
Among US, UK, Canada
Q51: If you read unfavorable information about a particular
vendor that appeared to be factual on a credible blog, how
likely are you to contact the vendor to verify the facts with
them?
Q52: In general, how much trust do
you have in the accuracy of
commentary on a product or service
on a blog when you can verify that it
comes from real world customers
and industry peers?
Q50: Assuming you believe the blog to be credible, how
likely are you to participate or post commentary
yourself on an industry blog related to the technology
you purchase?
47
38
50
47
26
25
23
24
Canada
UK
US
Total
Not likely to contact vendor (1+2)
Likely to contact vendor (4+5)
33
35
42
38
31
23
18
22
Canada
UK
US
Total
Not trusting (1+2)
Trusting (4+5)
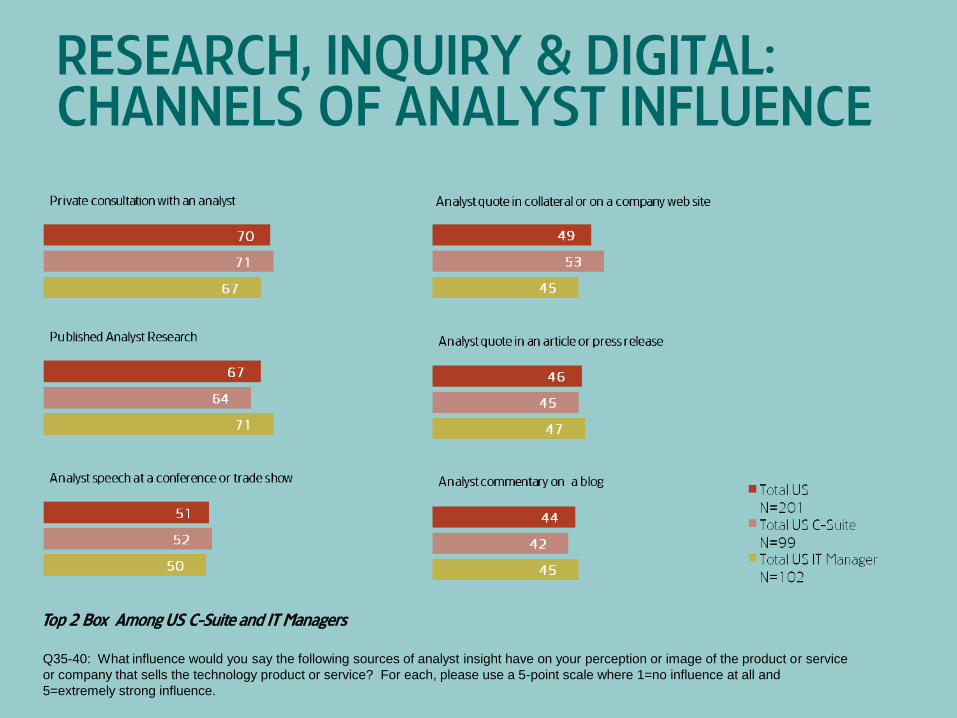
RESEARCH, INQUIRY & DIGITAL: CHANNELS OF ANALYST INFLUENCE
Q35-40: What influence would you say the following sources of analyst insight have on your perception or image of the product or service
or company that sells the technology product or service? For each, please use a 5-point scale where 1=no influence at all and
5=extremely strong influence.
Top 2 Box Among US C-Suite and IT Managers

DIGITAL AR METHODOLOGIES
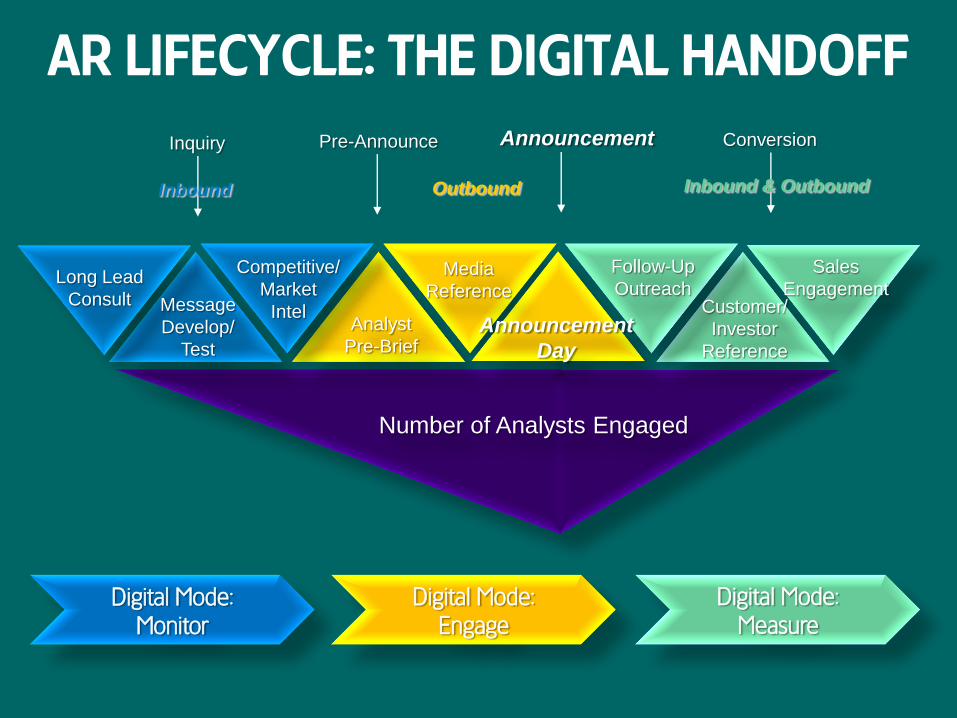
AR LIFECYCLE: THE DIGITAL HANDOFF
Long Lead
Consult Message
Develop/
Test
Competitive/
Market
IntelAnalyst
Pre-Brief
Media
Reference
Announcement
Day
Follow-Up
OutreachCustomer/
Investor
Reference
Sales
Engagement
AnnouncementInquiry Pre-Announce Conversion
Number of Analysts Engaged
Inbound & OutboundOutboundInbound
Digital Mode:
Monitor
Digital Mode:
Engage
Digital Mode:
Measure
13
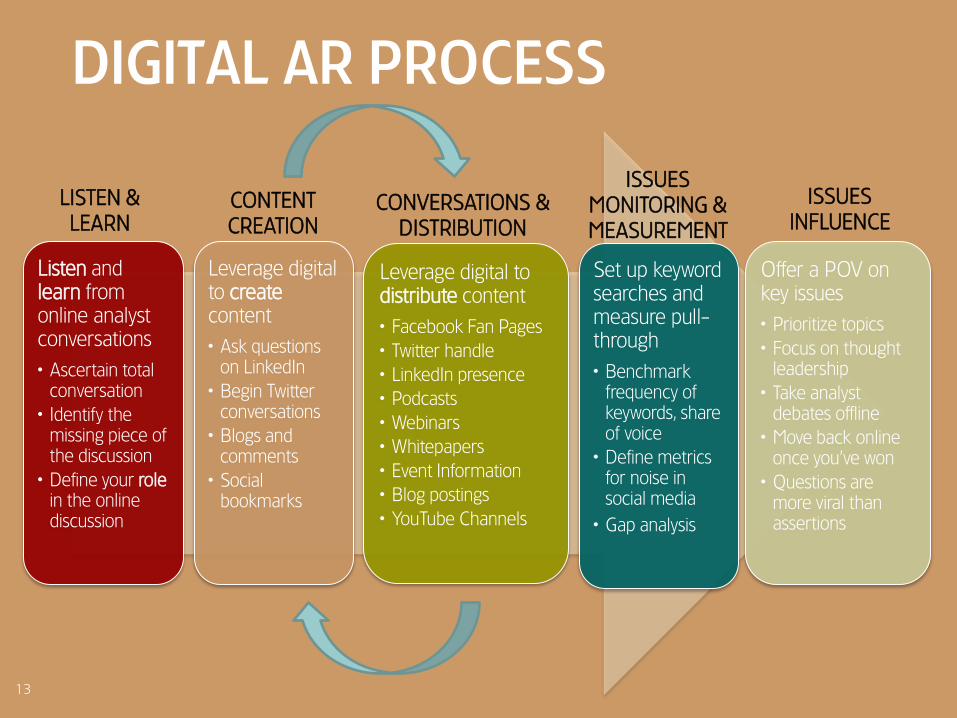
DIGITAL AR PROCESS
Listen and learn from online analyst conversations
„ Ascertain total conversation
„ Identify the missing piece of the discussion
„ Define your rolein the online discussion
Leverage digital to createcontent
„ Ask questions on LinkedIn
„ Begin Twitter conversations
„ Blogs and comments
„ Social bookmarks
Leverage digital to distribute content
„ Facebook Fan Pages
„ Twitter handle
„ LinkedIn presence
„ Podcasts
„ Webinars
„ Whitepapers
„ Event Information
„ Blog postings
„ YouTube Channels
Set up keyword searches and measure pull-through
„ Benchmark frequency of keywords, share of voice
„ Define metrics for noise in social media
„ Gap analysis
Offer a POV on key issues
„ Prioritize topics
„ Focus on thought leadership
„ Take analyst debates offline
„ Move back online once you’ve won
„ Questions are more viral than assertions
CONTENT
CREATIONCONVERSATIONS &
DISTRIBUTION
ISSUES
MONITORING &
MEASUREMENT
ISSUES
INFLUENCE
LISTEN &
LEARN

METRICS
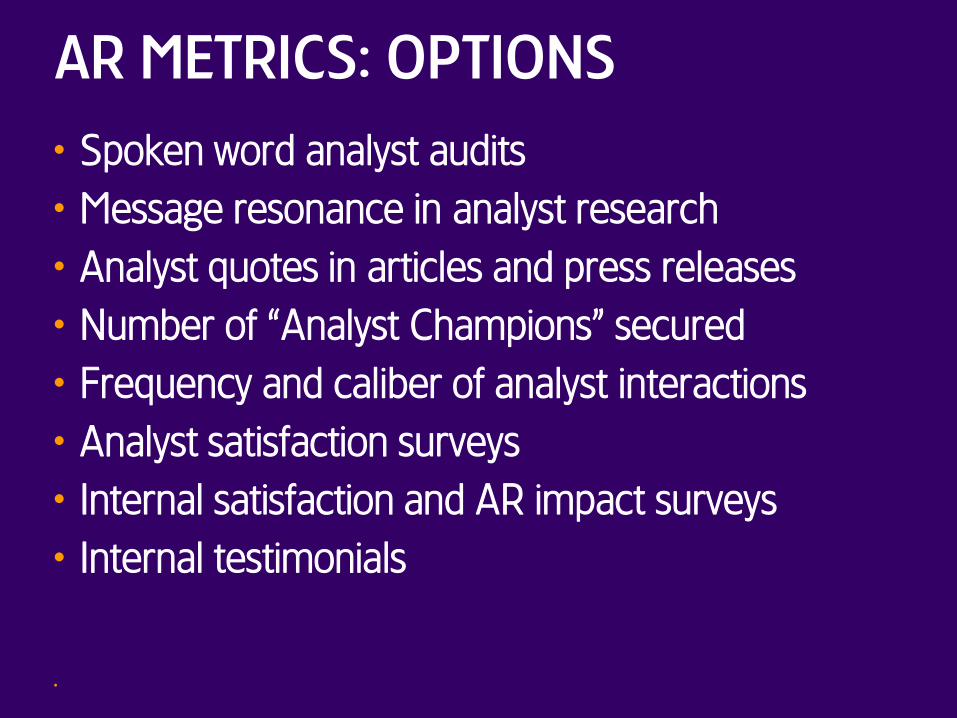
AR METRICS: OPTIONS
„ Spoken word analyst audits
„ Message resonance in analyst research
„ Analyst quotes in articles and press releases
„ Number of “Analyst Champions” secured
„ Frequency and caliber of analyst interactions
„ Analyst satisfaction surveys
„ Internal satisfaction and AR impact surveys
„ Internal testimonials
„
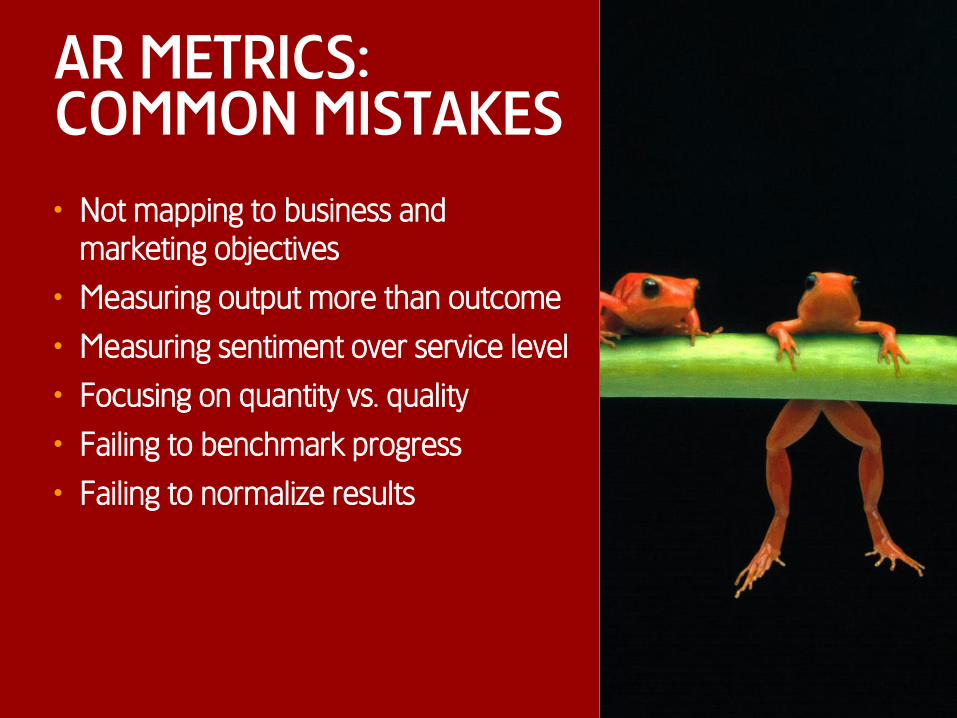
AR METRICS: COMMON MISTAKES
„ Not mapping to business and
marketing objectives
„ Measuring output more than outcome
„ Measuring sentiment over service level
„ Focusing on quantity vs. quality
„ Failing to benchmark progress
„ Failing to normalize results
FOR MORE INFORMATION ...
Additional cuts of data and regional results for China, US, UK and Canada are available, along with more detailed social media findings and metrics models, by contacting:
Joshua Reynolds
Global Technology Practice Director
Hill & Knowlton
415-856-5102


![The Games! The Upsets! The Madness!: March Madness [INFOGRAPHIC]](https://img.pdfslide.us/doc/110x75/577cdcc71a28ab9e78ab621f/the-games-the-upsets-the-madness-march-madness-infographic.jpg)