Embed Size (px)
Citation preview
When Is Evidence “Enough” to Make a Health Care Decision?
National Pharmaceutical Council
IMS Health
July 31, 2013
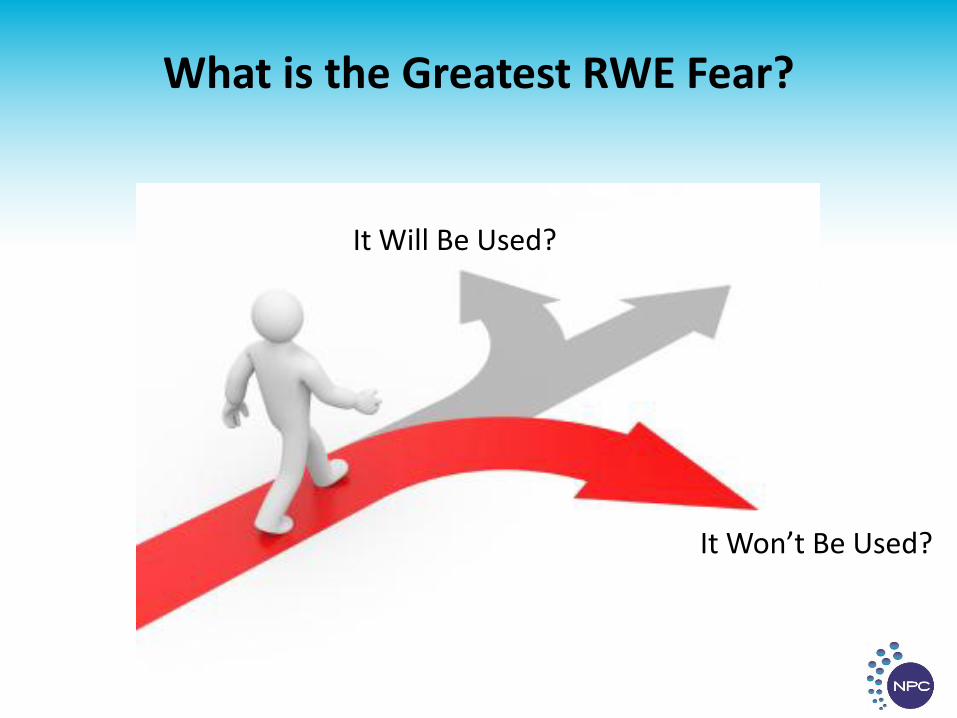
What is the Greatest RWE Fear?
It Will Be Used?
It Won’t Be Used?
Agenda
• Introductions
• When Is Evidence Sufficient for Decision-Making? A Framework for Understanding the Pace of Evidence Adoption
• RWE Market Impact on Medicines: A Lens for Pharma
• Question and Answers
4

Speakers
5
Dr. Ben Hughes Senior Principal, Real World Evidence
Solutions, IMS Health
Marla Kessler Vice President,
IMS Consulting Group
Dr. Eleanor M. Perfetto Professor, Pharmaceutical Health Services
Research, School of Pharmacy, University of Maryland
Dr. Robert W. Dubois Chief Science Officer,
National Pharmaceutical Council
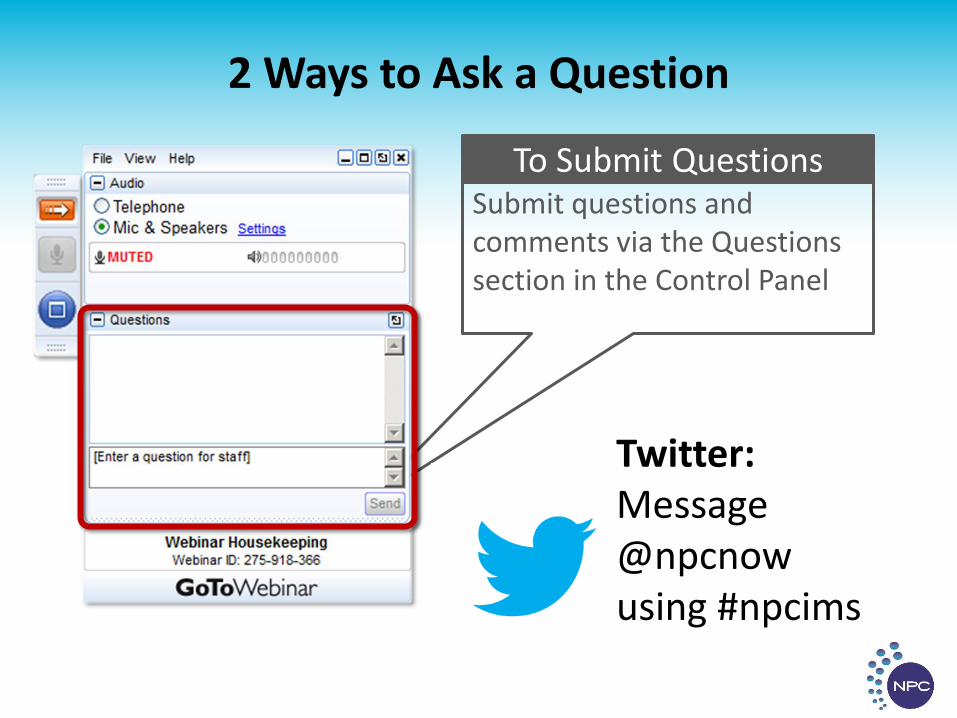
Submit questions and comments via the Questions section in the Control Panel
To Submit Questions
2 Ways to Ask a Question
Twitter: Message @npcnow using #npcims
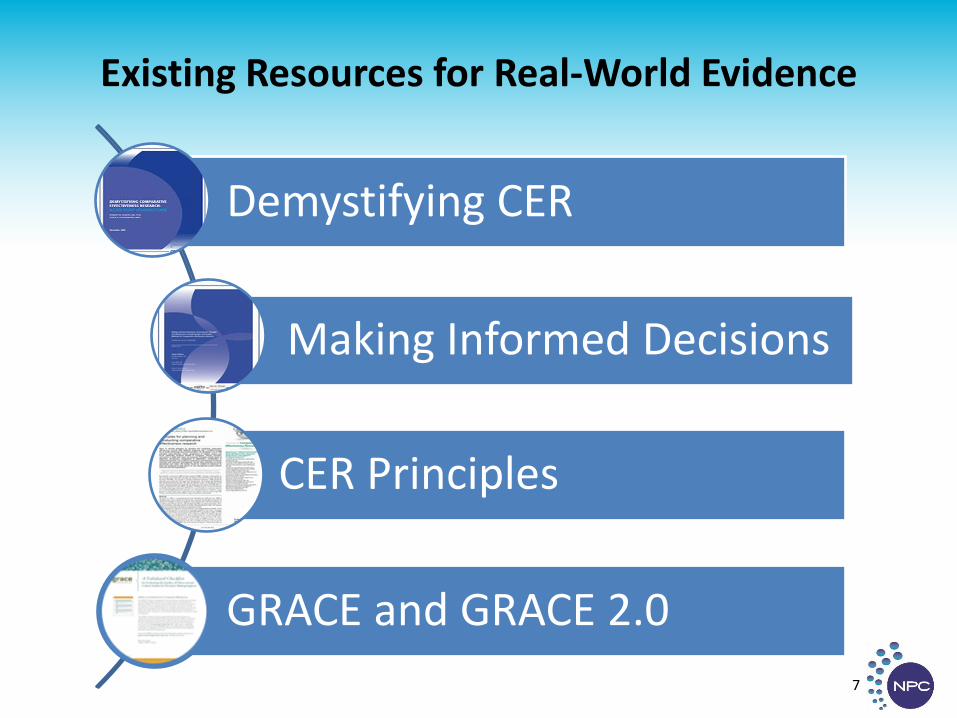
Existing Resources for Real-World Evidence
7
Demystifying CER
Making Informed Decisions
CER Principles
GRACE and GRACE 2.0
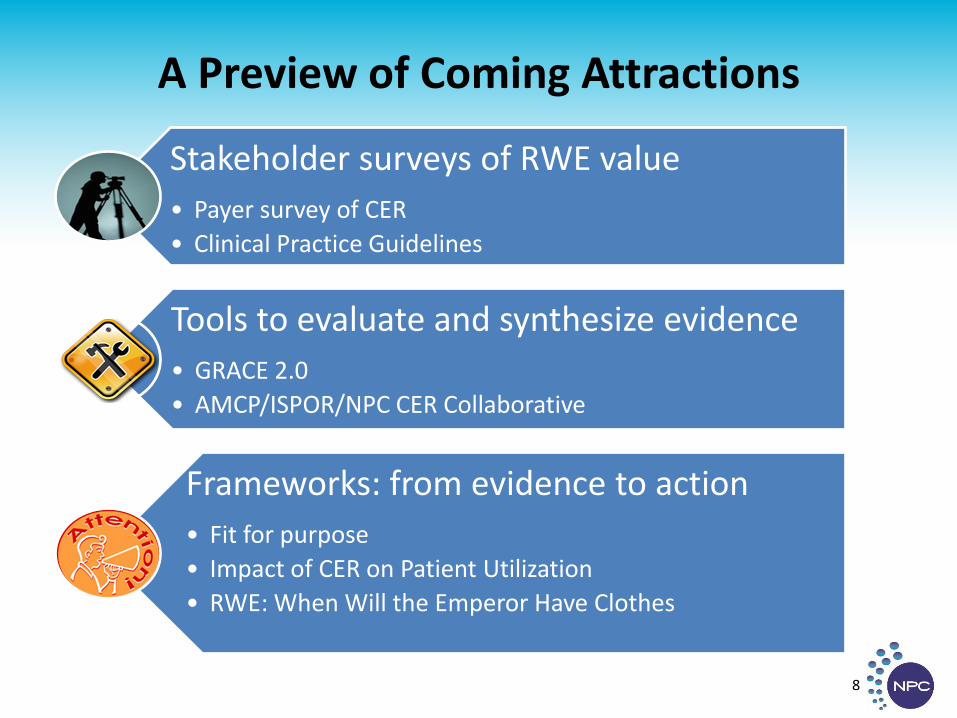
A Preview of Coming Attractions
8
Stakeholder surveys of RWE value
• Payer survey of CER
• Clinical Practice Guidelines
Tools to evaluate and synthesize evidence
• GRACE 2.0
• AMCP/ISPOR/NPC CER Collaborative
Frameworks: from evidence to action
• Fit for purpose
• Impact of CER on Patient Utilization
• RWE: When Will the Emperor Have Clothes
When Is Evidence Sufficient for Decision-Making? A Framework for Understanding the Pace of Evidence Adoption
Robert W. Dubois, MD, PhD Michael Lauer, MD
Eleanor Perfetto, PhD, MS
Dubois RW, Lauer M, Perfetto E. JCER. 2013; 2(4), 383–391.
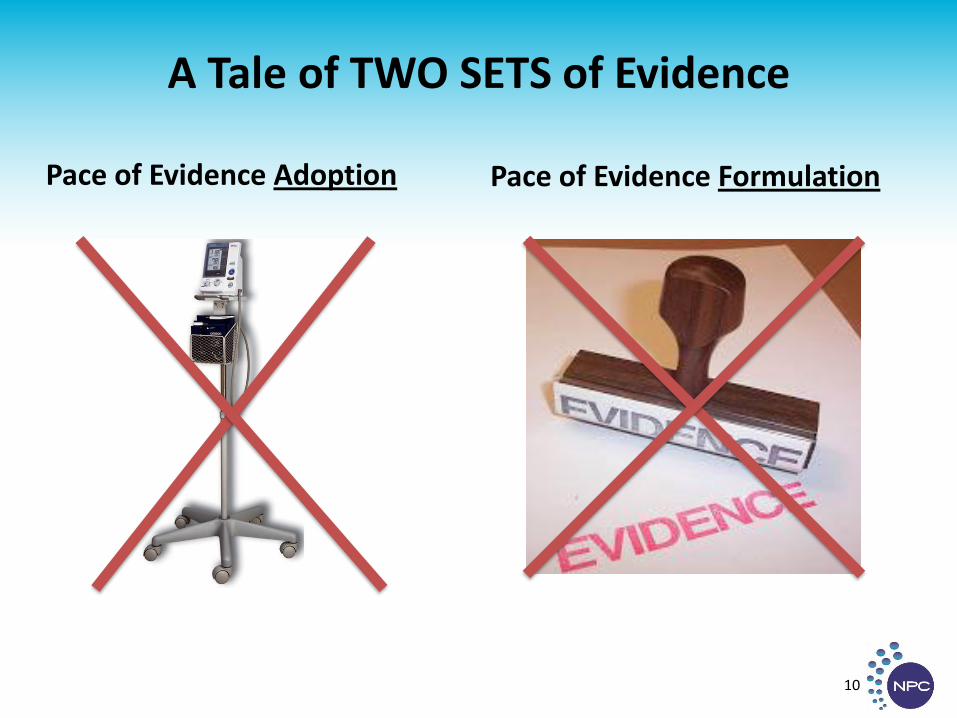
A Tale of TWO SETS of Evidence
10
Pace of Evidence Adoption Pace of Evidence Formulation
Pace of Evidence Adoption
• To understand the pace of evidence adoption, a conceptual framework was proposed
• The framework was applied to three case studies:
– Statins
– Drug Eluting Stents
– Bone Marrow Transplantation for Breast Cancer
• The goal was to identify possible critical factors that affect adoption and optimize translation into routine clinical practice so that those factors can be considered in future work
11
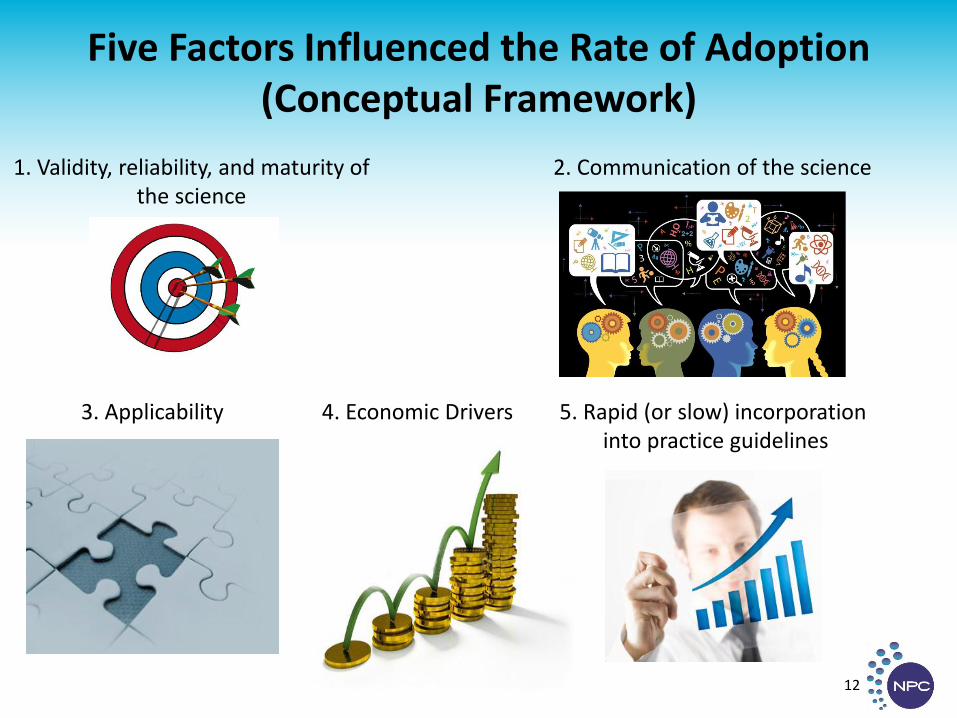
Five Factors Influenced the Rate of Adoption (Conceptual Framework)
12
1. Validity, reliability, and maturity of the science
2. Communication of the science
3. Applicability 4. Economic Drivers 5. Rapid (or slow) incorporation into practice guidelines
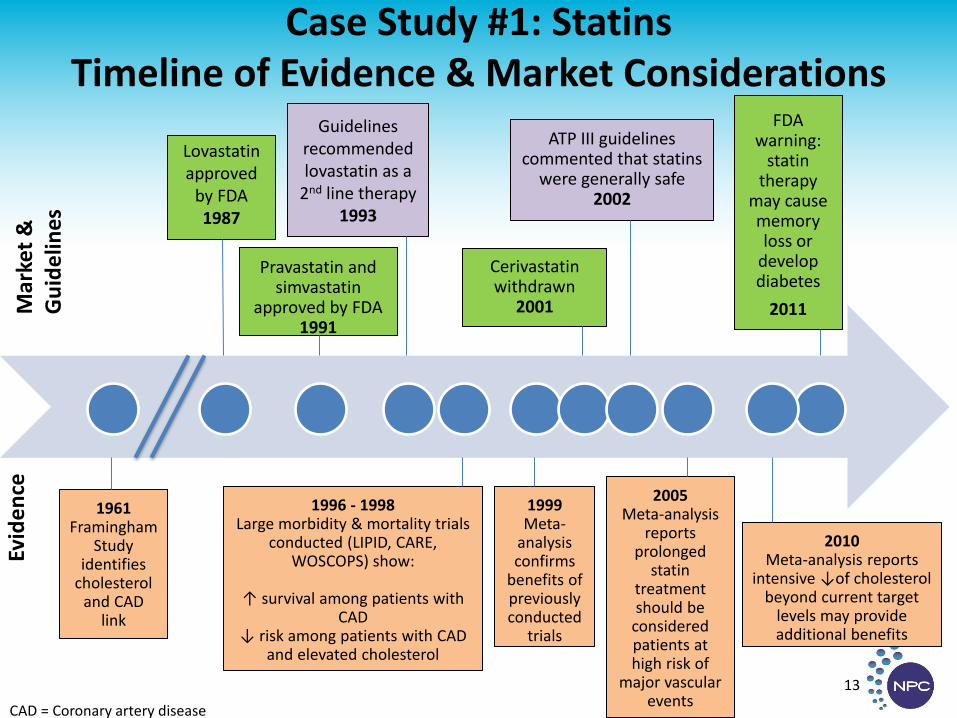
Case Study #1: Statins Timeline of Evidence & Market Considerations
13
Lovastatin approved
by FDA 1987
Pravastatin and simvastatin
approved by FDA 1991
Guidelines recommended lovastatin as a
2nd line therapy 1993
Cerivastatin withdrawn
2001
ATP III guidelines commented that statins
were generally safe 2002
FDA warning:
statin therapy
may cause memory loss or
develop diabetes
2011 Mar
ket
&
Gu
ide
lines
CAD = Coronary artery disease
1996 - 1998 Large morbidity & mortality trials
conducted (LIPID, CARE, WOSCOPS) show:
↑ survival among patients with
CAD ↓ risk among patients with CAD
and elevated cholesterol
Evid
en
ce
1961 Framingham
Study identifies
cholesterol and CAD
link
1999 Meta-
analysis confirms
benefits of previously conducted
trials
2005 Meta-analysis
reports prolonged
statin treatment should be
considered patients at high risk of
major vascular events
2010 Meta-analysis reports
intensive ↓of cholesterol beyond current target
levels may provide additional benefits
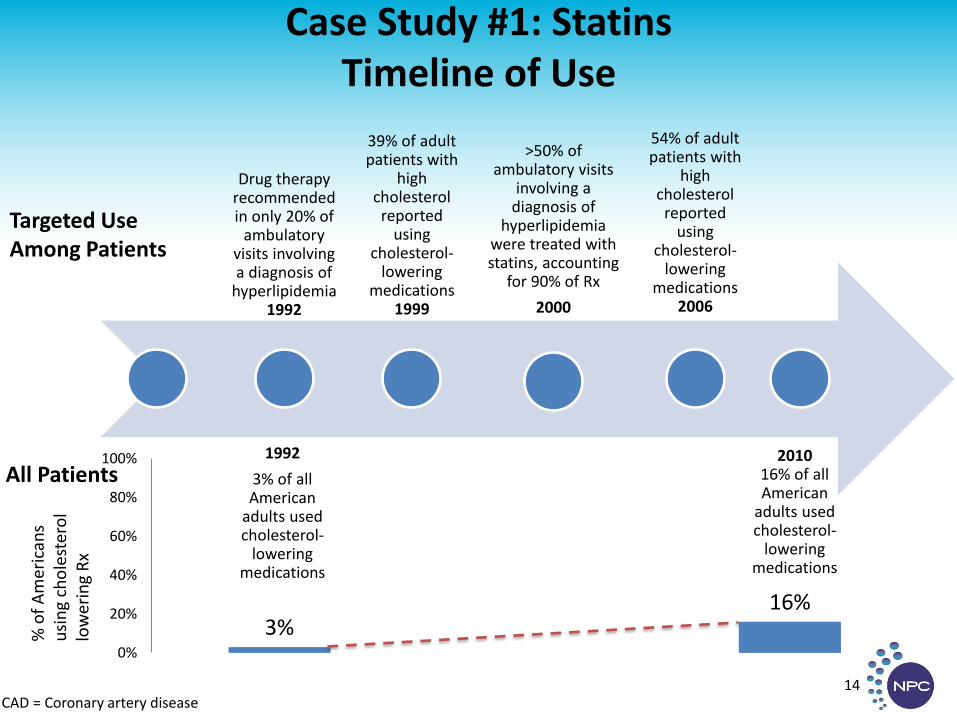
Case Study #1: Statins Timeline of Use
CAD = Coronary artery disease 14
Drug therapy
recommended in only 20% of
ambulatory visits involving a diagnosis of
hyperlipidemia 1992
39% of adult patients with
high cholesterol
reported using
cholesterol-lowering
medications 1999
>50% of
ambulatory visits involving a
diagnosis of hyperlipidemia
were treated with statins, accounting
for 90% of Rx
2000
54% of adult patients with
high cholesterol
reported using
cholesterol-lowering
medications 2006
Targeted Use Among Patients
1992
3% of all American
adults used cholesterol-
lowering medications
2010 16% of all American
adults used cholesterol-
lowering medications
3% 16%
0%
20%
40%
60%
80%
100%All Patients
% o
f A
mer
ican
s u
sin
g ch
ole
ster
ol
low
erin
g R
x
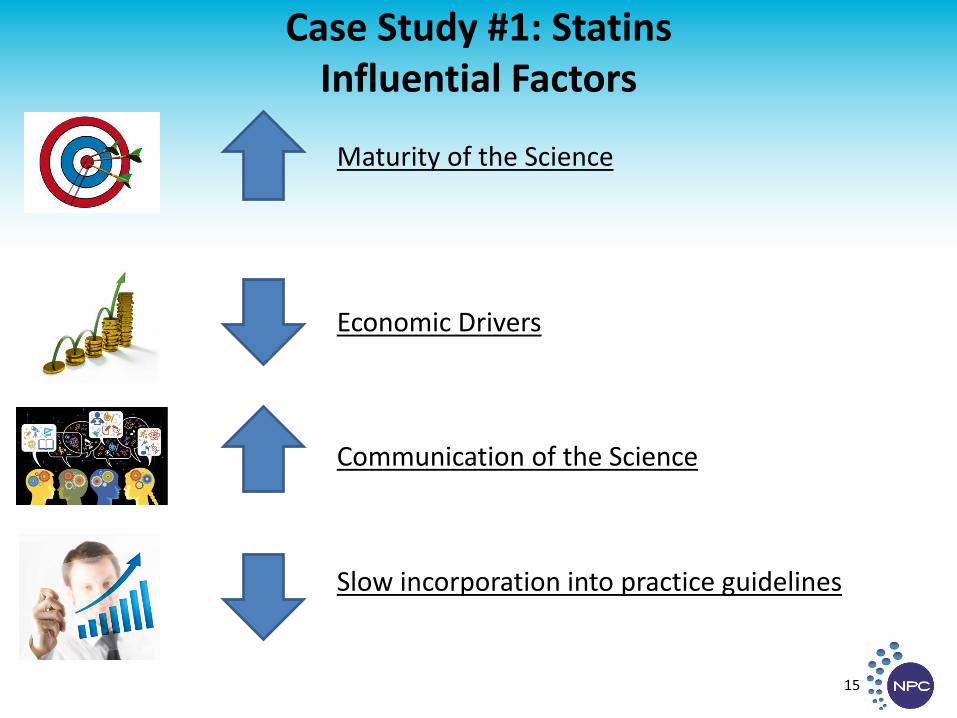
Case Study #1: Statins Influential Factors
15
Maturity of the Science
Economic Drivers
Communication of the Science
Slow incorporation into practice guidelines
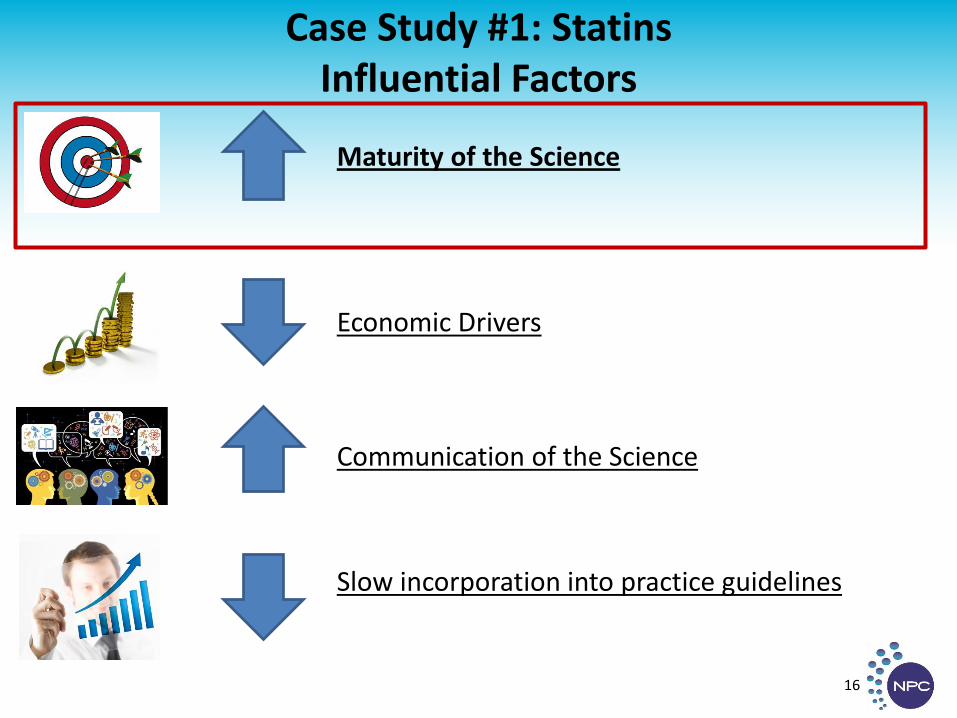
Case Study #1: Statins Influential Factors
16
Maturity of the Science
Economic Drivers
Communication of the Science
Slow incorporation into practice guidelines
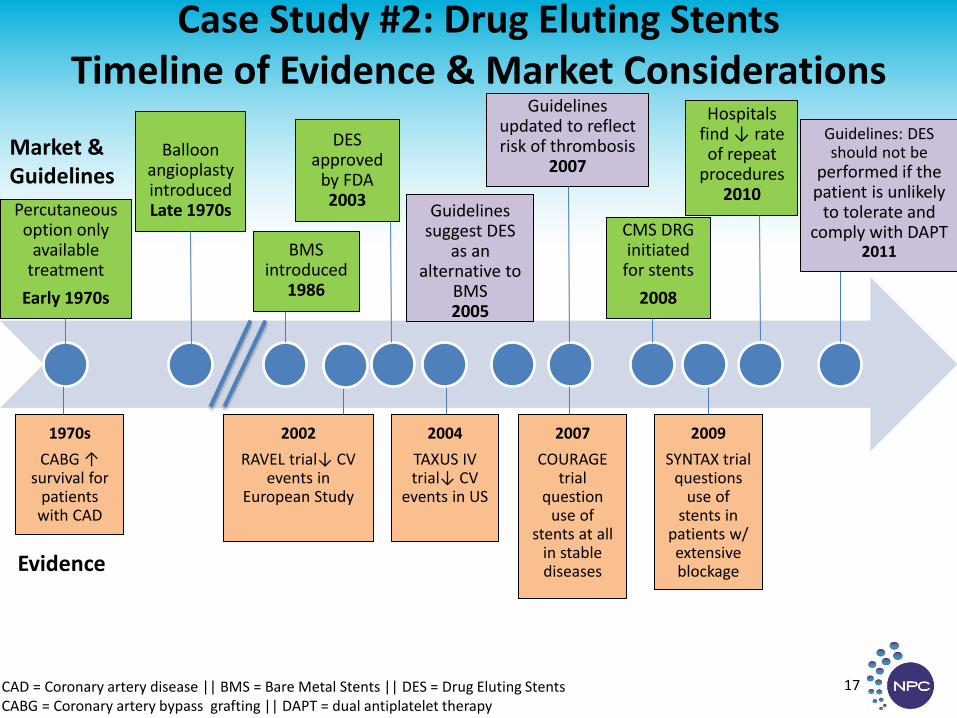
Case Study #2: Drug Eluting Stents Timeline of Evidence & Market Considerations
17 CAD = Coronary artery disease || BMS = Bare Metal Stents || DES = Drug Eluting Stents CABG = Coronary artery bypass grafting || DAPT = dual antiplatelet therapy
Evidence
Market & Guidelines
Balloon
angioplasty introduced Late 1970s
BMS introduced
1986
Guidelines suggest DES
as an alternative to
BMS 2005
Guidelines updated to reflect risk of thrombosis
2007
CMS DRG initiated
for stents
2008
Hospitals find ↓ rate of repeat
procedures 2010
1970s
CABG ↑ survival for
patients with CAD
2002
RAVEL trial↓ CV events in
European Study
2004
TAXUS IV trial↓ CV
events in US
2007
COURAGE trial
question use of
stents at all in stable diseases
2009
SYNTAX trial questions
use of stents in
patients w/ extensive blockage
DES approved
by FDA 2003
Guidelines: DES should not be
performed if the patient is unlikely
to tolerate and comply with DAPT
2011
Percutaneous option only
available treatment
Early 1970s
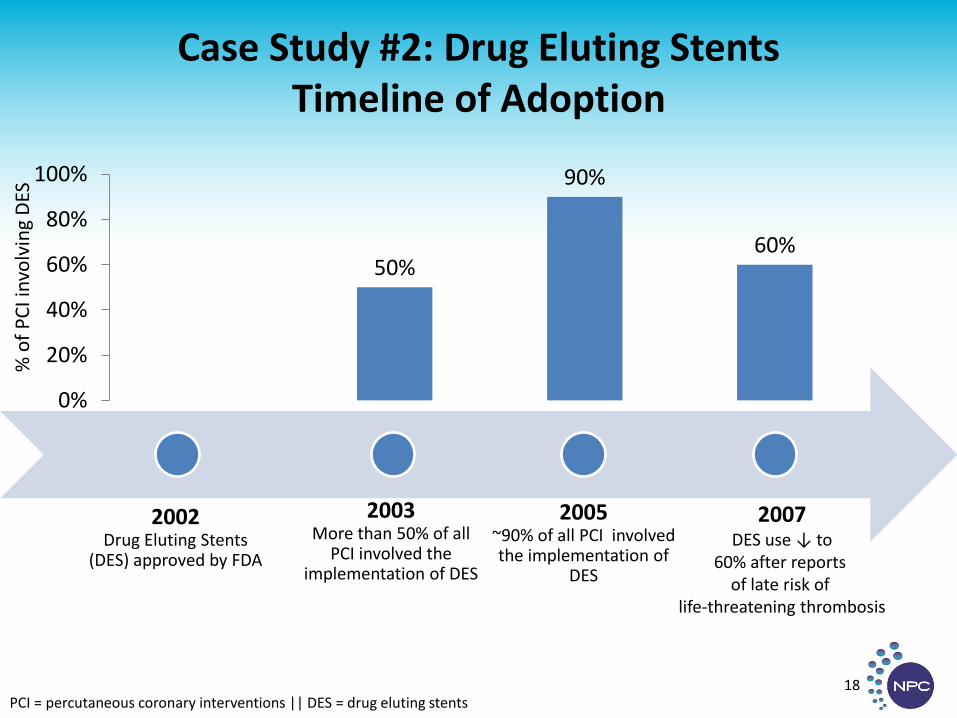
Case Study #2: Drug Eluting Stents Timeline of Adoption
PCI = percutaneous coronary interventions || DES = drug eluting stents
18
2002 Drug Eluting Stents
(DES) approved by FDA
2003 More than 50% of all
PCI involved the implementation of DES
2005 ~90% of all PCI involved the implementation of
DES
50%
90%
60%
0%
20%
40%
60%
80%
100%
2007 DES use ↓ to
60% after reports of late risk of
life-threatening thrombosis
% o
f P
CI i
nvo
lvin
g D
ES
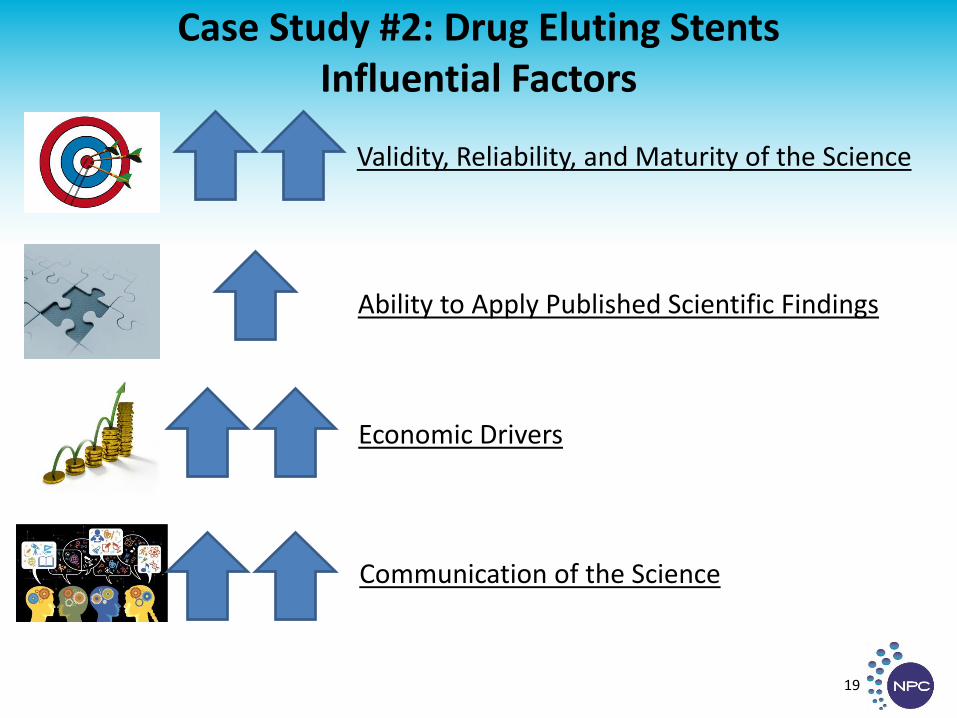
Case Study #2: Drug Eluting Stents Influential Factors
19
Validity, Reliability, and Maturity of the Science
Ability to Apply Published Scientific Findings
Economic Drivers
Communication of the Science
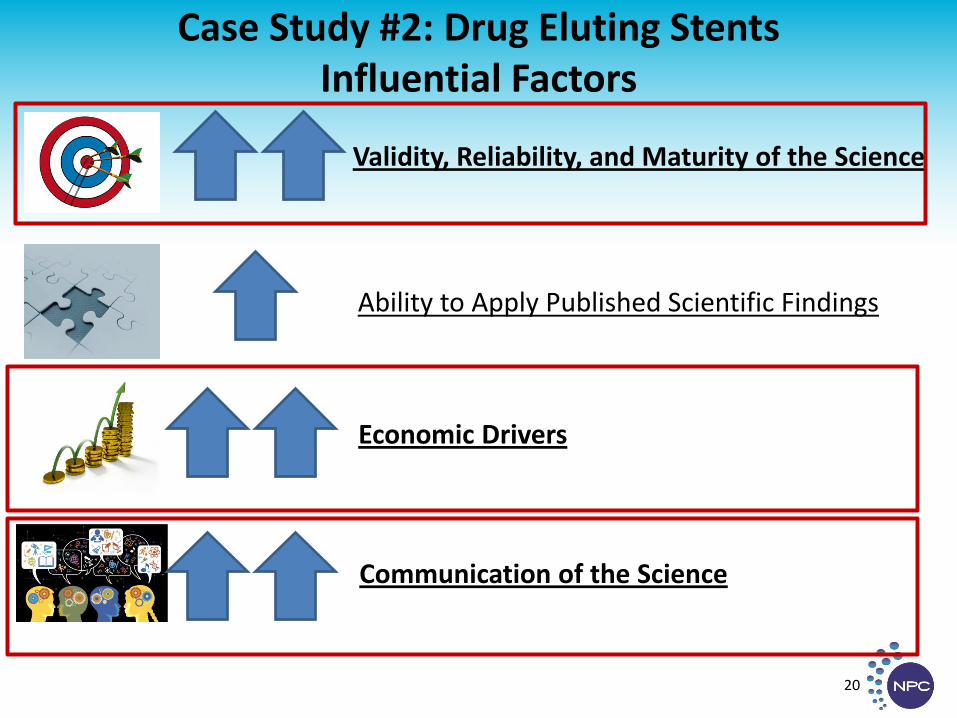
Case Study #2: Drug Eluting Stents Influential Factors
20
Validity, Reliability, and Maturity of the Science
Ability to Apply Published Scientific Findings
Economic Drivers
Communication of the Science
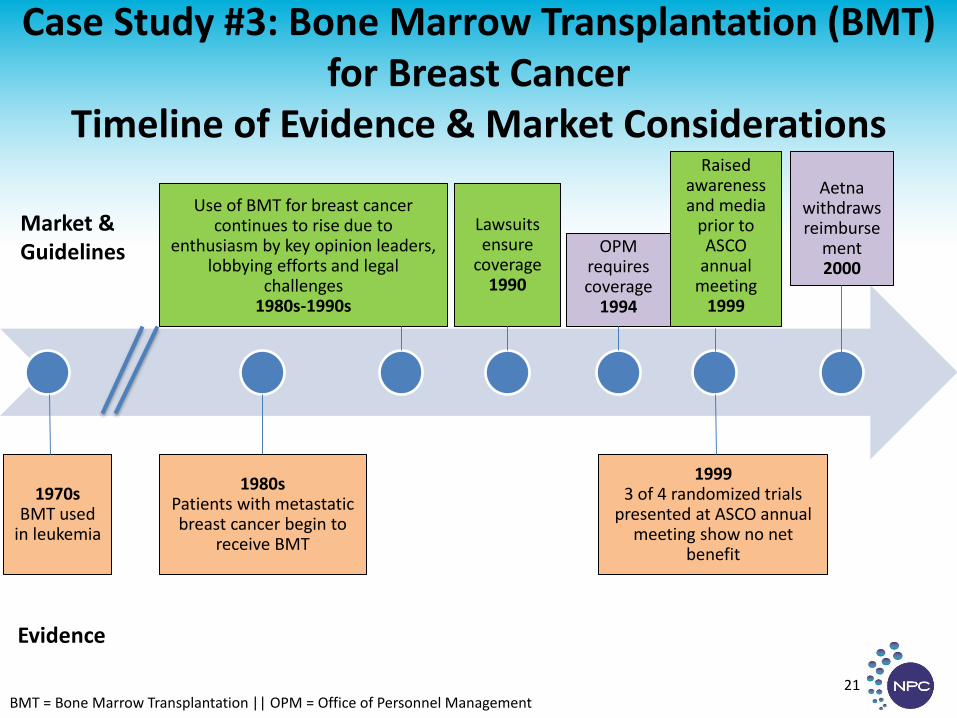
Case Study #3: Bone Marrow Transplantation (BMT) for Breast Cancer
Timeline of Evidence & Market Considerations
BMT = Bone Marrow Transplantation || OPM = Office of Personnel Management 21
Evidence
Market & Guidelines
1970s BMT used
in leukemia
1999 3 of 4 randomized trials
presented at ASCO annual meeting show no net
benefit
Use of BMT for breast cancer continues to rise due to
enthusiasm by key opinion leaders, lobbying efforts and legal
challenges 1980s-1990s
Lawsuits ensure
coverage 1990
Raised
awareness and media
prior to ASCO
annual meeting
1999
OPM requires coverage
1994
Aetna
withdraws reimburse
ment 2000
1980s Patients with metastatic breast cancer begin to
receive BMT
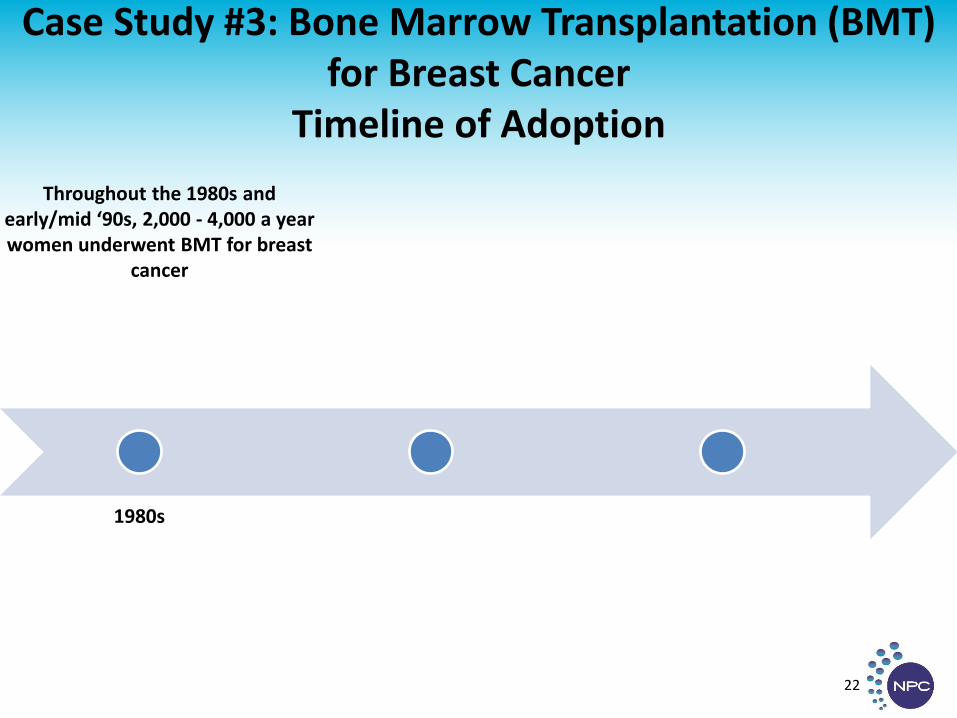
Case Study #3: Bone Marrow Transplantation (BMT) for Breast Cancer
Timeline of Adoption
22
1980s
Throughout the 1980s and early/mid ‘90s, 2,000 - 4,000 a year women underwent BMT for breast
cancer
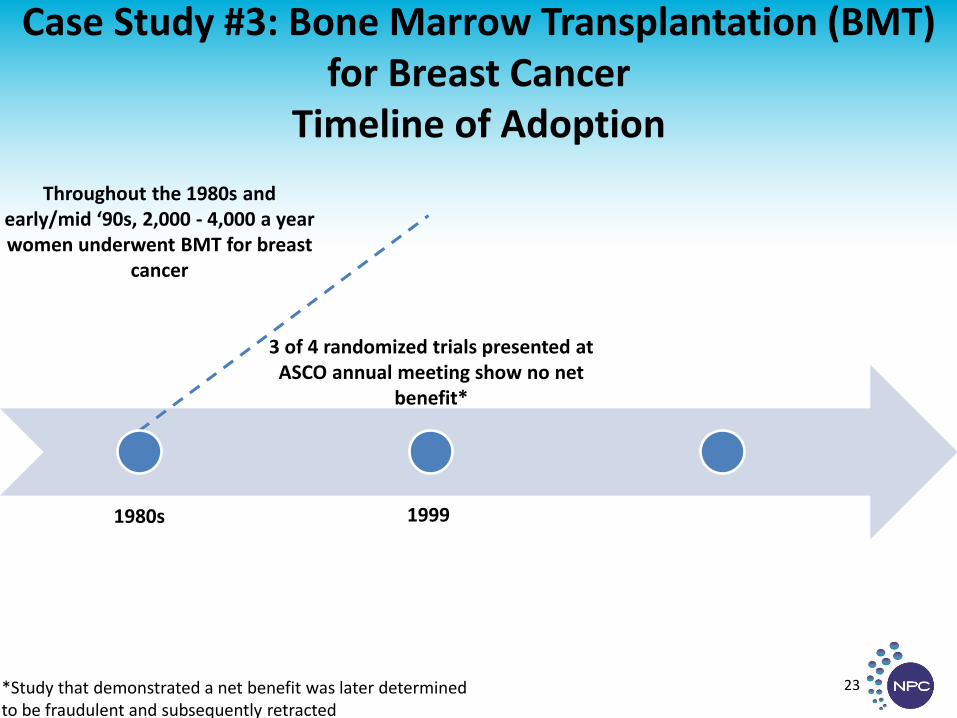
Case Study #3: Bone Marrow Transplantation (BMT) for Breast Cancer
Timeline of Adoption
23
1999 1980s
Throughout the 1980s and early/mid ‘90s, 2,000 - 4,000 a year women underwent BMT for breast
cancer
3 of 4 randomized trials presented at
ASCO annual meeting show no net benefit*
*Study that demonstrated a net benefit was later determined to be fraudulent and subsequently retracted
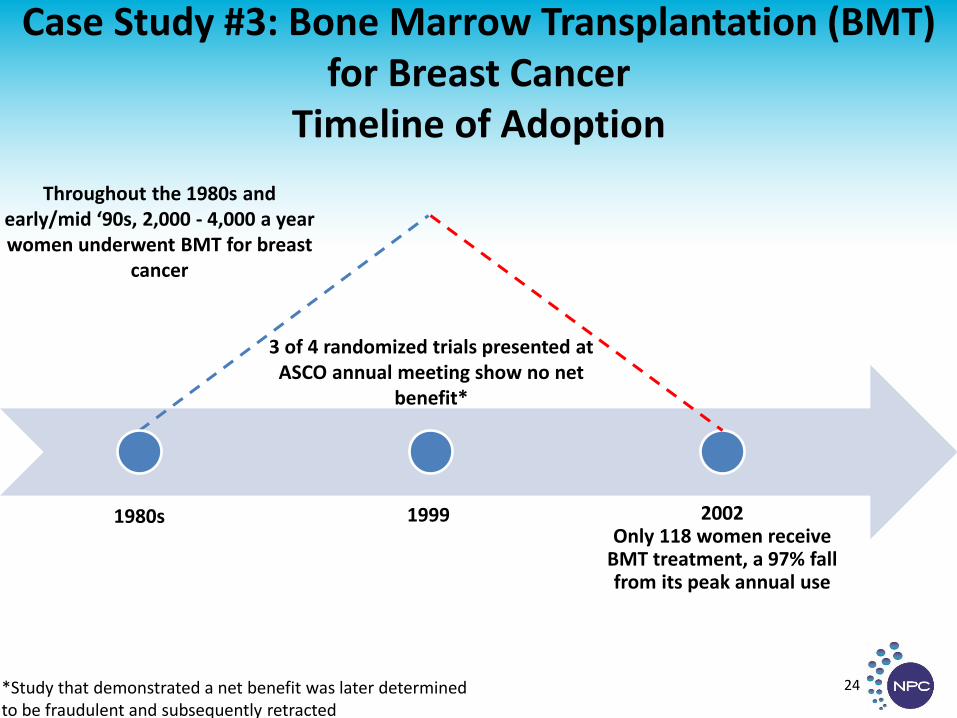
Case Study #3: Bone Marrow Transplantation (BMT) for Breast Cancer
Timeline of Adoption
24
1999 2002 Only 118 women receive
BMT treatment, a 97% fall from its peak annual use
1980s
Throughout the 1980s and early/mid ‘90s, 2,000 - 4,000 a year women underwent BMT for breast
cancer
3 of 4 randomized trials presented at
ASCO annual meeting show no net benefit*
*Study that demonstrated a net benefit was later determined to be fraudulent and subsequently retracted
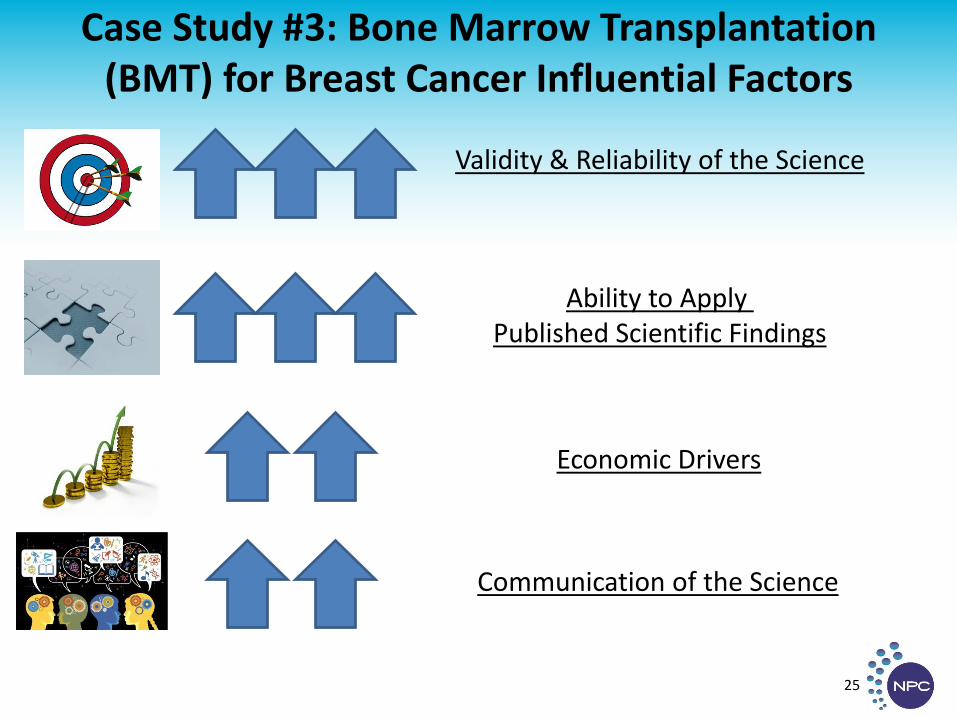
Case Study #3: Bone Marrow Transplantation (BMT) for Breast Cancer Influential Factors
25
Validity & Reliability of the Science
Ability to Apply Published Scientific Findings
Economic Drivers
Communication of the Science
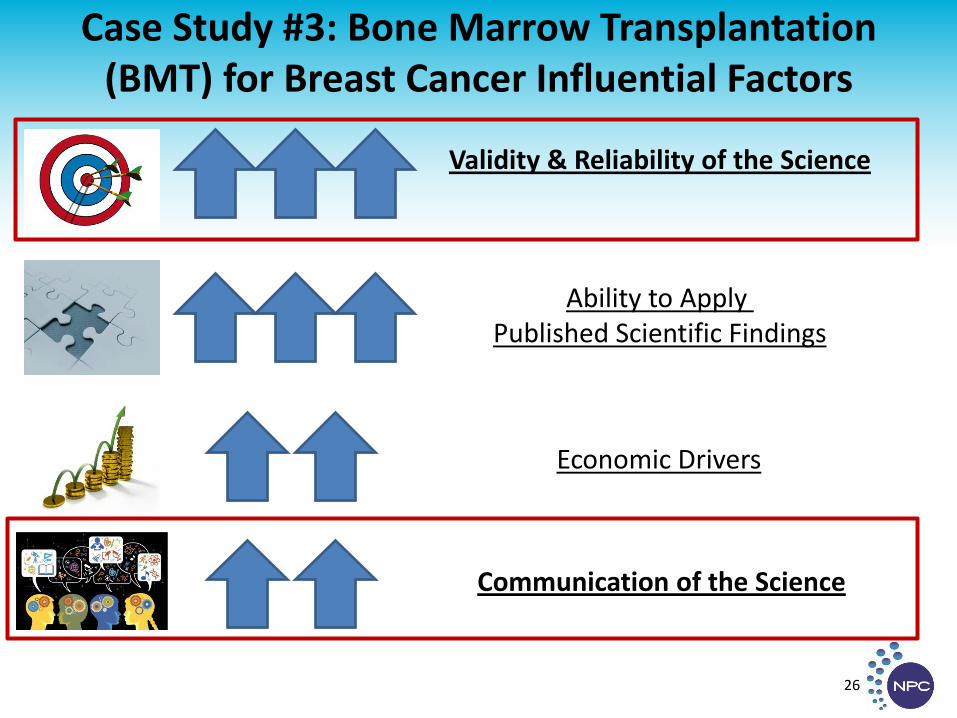
Case Study #3: Bone Marrow Transplantation (BMT) for Breast Cancer Influential Factors
26
Validity & Reliability of the Science
Ability to Apply Published Scientific Findings
Economic Drivers
Communication of the Science
Implications
• This was an exploratory study with a limited sample • However, it indicates that these conceptual factors may
be useful to understanding and accelerating research translation
• Dissemination and translation may be improved by considering experiences with how and when past research was adopted
• Continued development of our proposed framework with additional case examination will further understanding in this area
• Federal support of CER through the Patient-Centered Outcomes Research Trust Fund will continue to grow and can benefit from this type of research
27
RWE Market Impact On Medicines: A Lens for Pharma
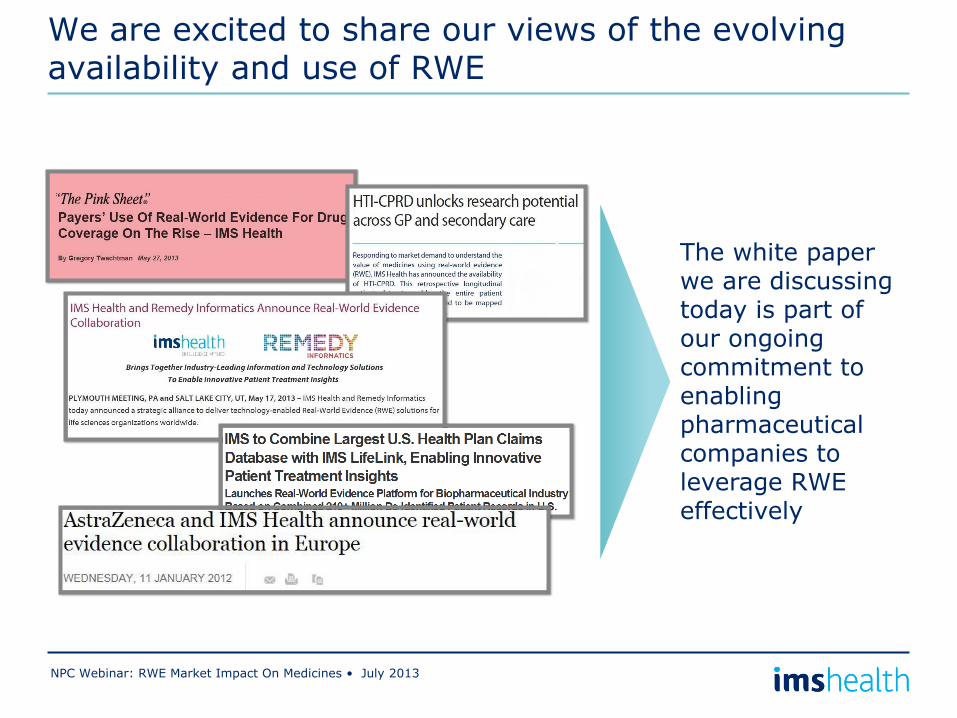
We are excited to share our views of the evolving availability and use of RWE
NPC Webinar: RWE Market Impact On Medicines • July 2013
The white paper we are discussing today is part of our ongoing commitment to enabling pharmaceutical companies to leverage RWE effectively
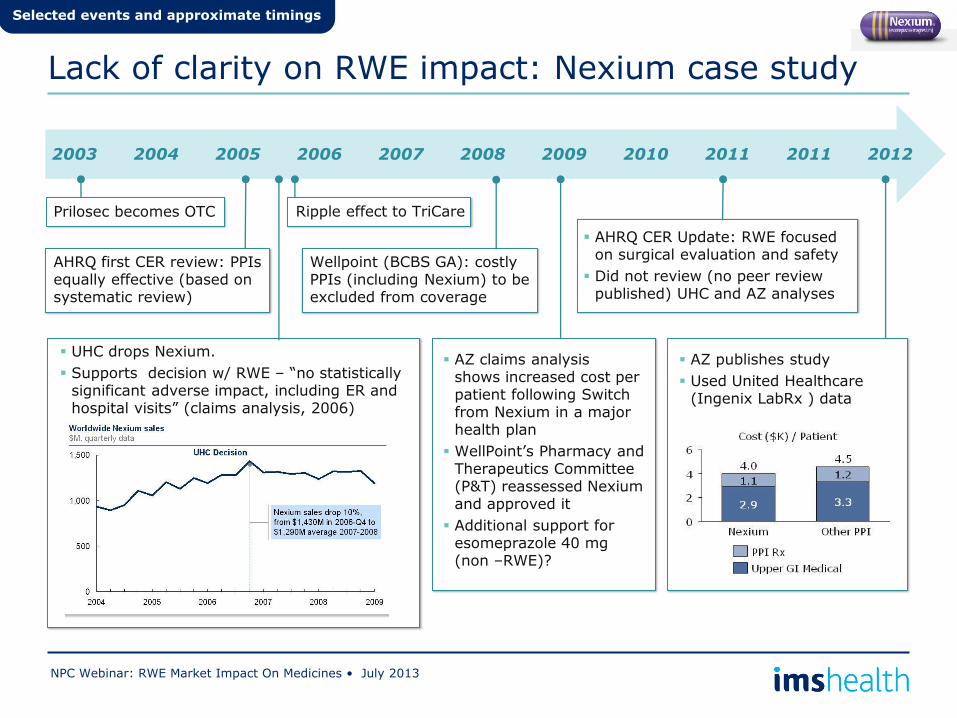
Lack of clarity on RWE impact: Nexium case study
NPC Webinar: RWE Market Impact On Medicines • July 2013
2003 2004 2005 2006 2007 2008 2009 2010 2011
Prilosec becomes OTC
UHC drops Nexium.
Supports decision w/ RWE – “no statistically significant adverse impact, including ER and hospital visits” (claims analysis, 2006)
Wellpoint (BCBS GA): costly PPIs (including Nexium) to be excluded from coverage
AZ claims analysis shows increased cost per patient following Switch from Nexium in a major health plan
WellPoint’s Pharmacy and Therapeutics Committee (P&T) reassessed Nexium and approved it
Additional support for esomeprazole 40 mg (non –RWE)?
AHRQ CER Update: RWE focused on surgical evaluation and safety
Did not review (no peer review published) UHC and AZ analyses
2011 2012
AZ publishes study
Used United Healthcare (Ingenix LabRx ) data
Selected events and approximate timings
Ripple effect to TriCare
AHRQ first CER review: PPIs equally effective (based on systematic review)
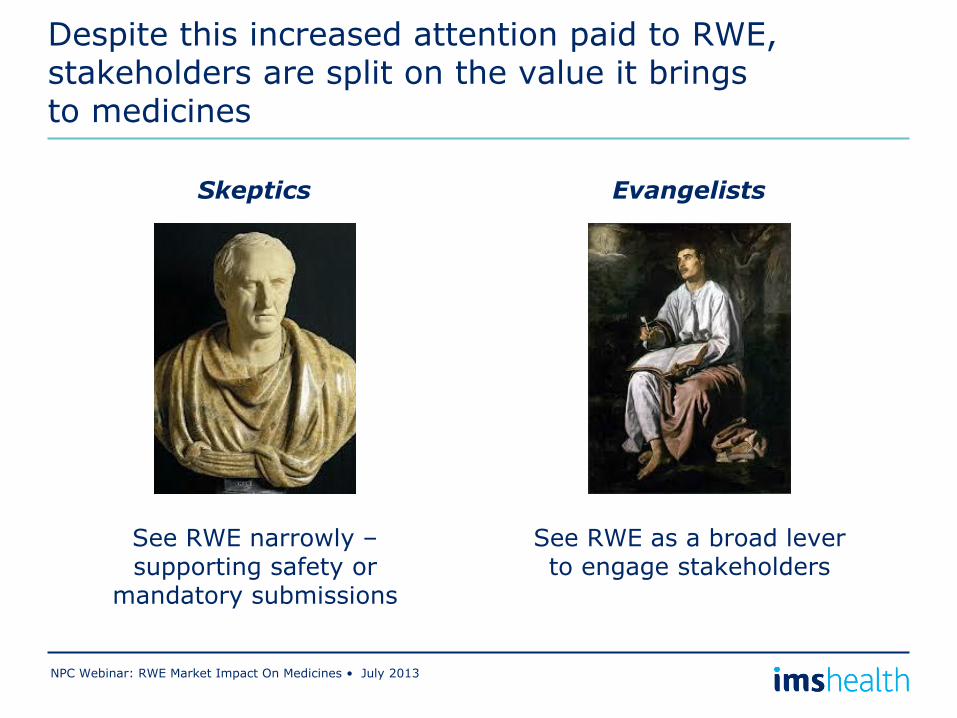
Despite this increased attention paid to RWE, stakeholders are split on the value it brings to medicines
NPC Webinar: RWE Market Impact On Medicines • July 2013
Evangelists
See RWE as a broad lever to engage stakeholders
Skeptics
See RWE narrowly –supporting safety or
mandatory submissions
UK
Canada
Sweden Netherlands US
Italy
Spain
Germany France Denmark
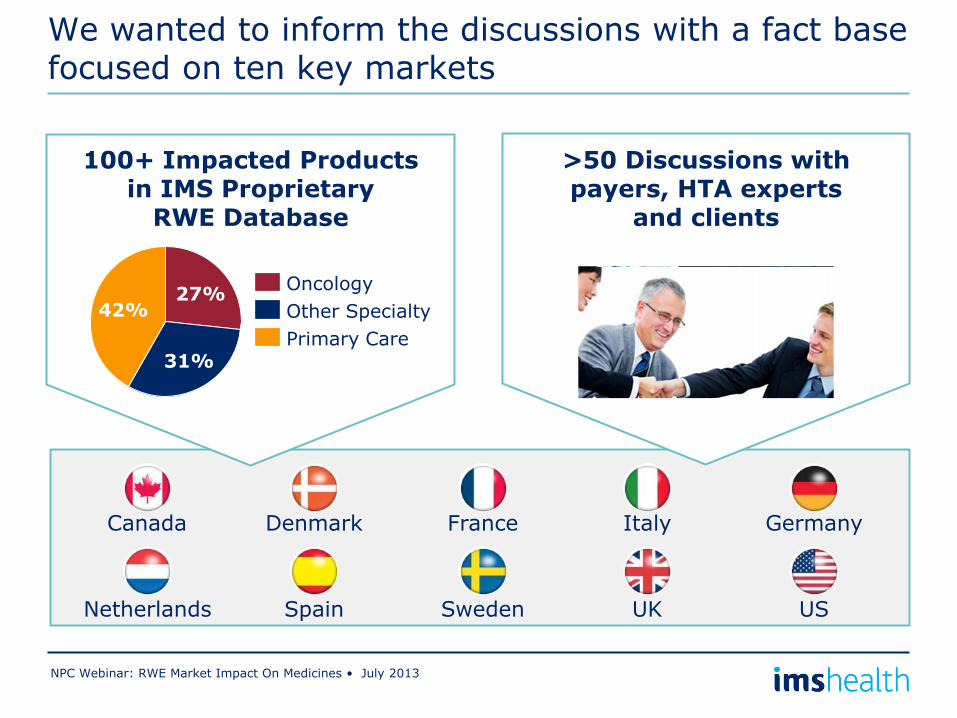
We wanted to inform the discussions with a fact base focused on ten key markets
NPC Webinar: RWE Market Impact On Medicines • July 2013
>50 Discussions with payers, HTA experts
and clients
100+ Impacted Products in IMS Proprietary
RWE Database
42%
31%
27%
Primary Care
Other Specialty
Oncology
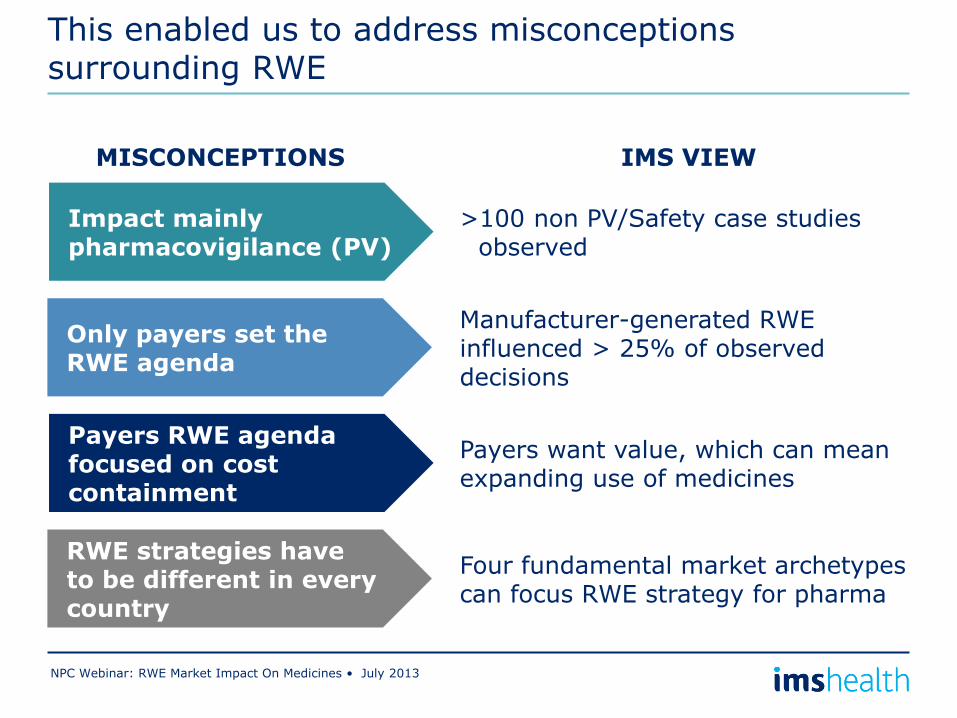
This enabled us to address misconceptions surrounding RWE
NPC Webinar: RWE Market Impact On Medicines • July 2013
>100 non PV/Safety case studies observed
Manufacturer-generated RWE influenced > 25% of observed decisions
Four fundamental market archetypes can focus RWE strategy for pharma
Impact mainly pharmacovigilance (PV)
Only payers set the RWE agenda
RWE strategies have to be different in every country
Payers RWE agenda focused on cost containment
Payers want value, which can mean expanding use of medicines
IMS VIEW MISCONCEPTIONS
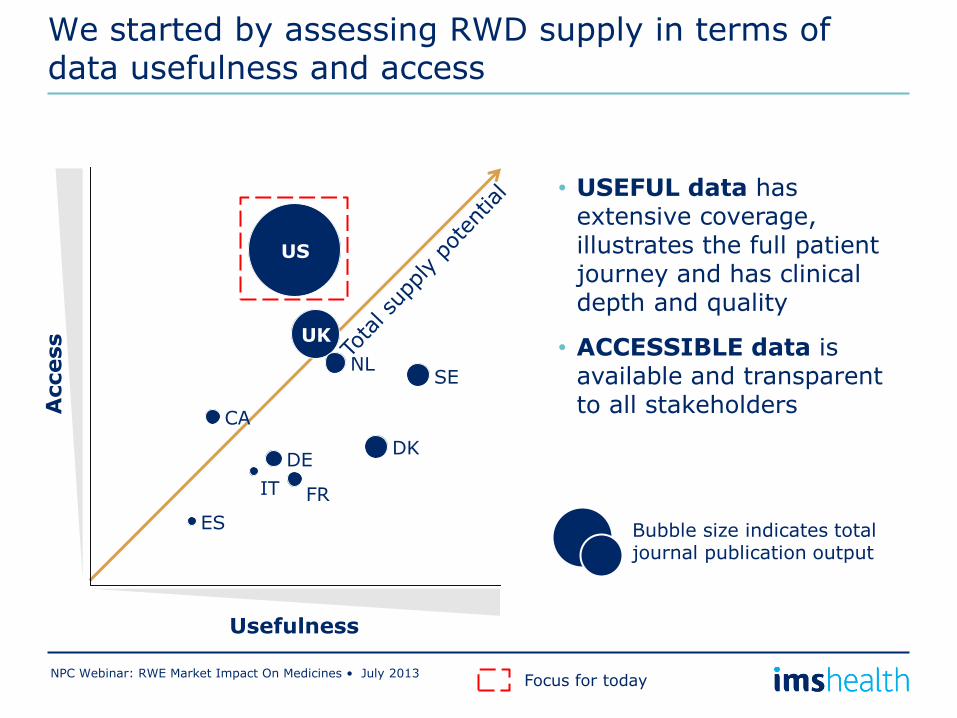
DK
NL SE
CA
US
UK
ES
IT
DE
FR
Usefulness
Access
Bubble size indicates total journal publication output
We started by assessing RWD supply in terms of data usefulness and access
NPC Webinar: RWE Market Impact On Medicines • July 2013
• USEFUL data has extensive coverage, illustrates the full patient journey and has clinical depth and quality
• ACCESSIBLE data is available and transparent to all stakeholders
Focus for today
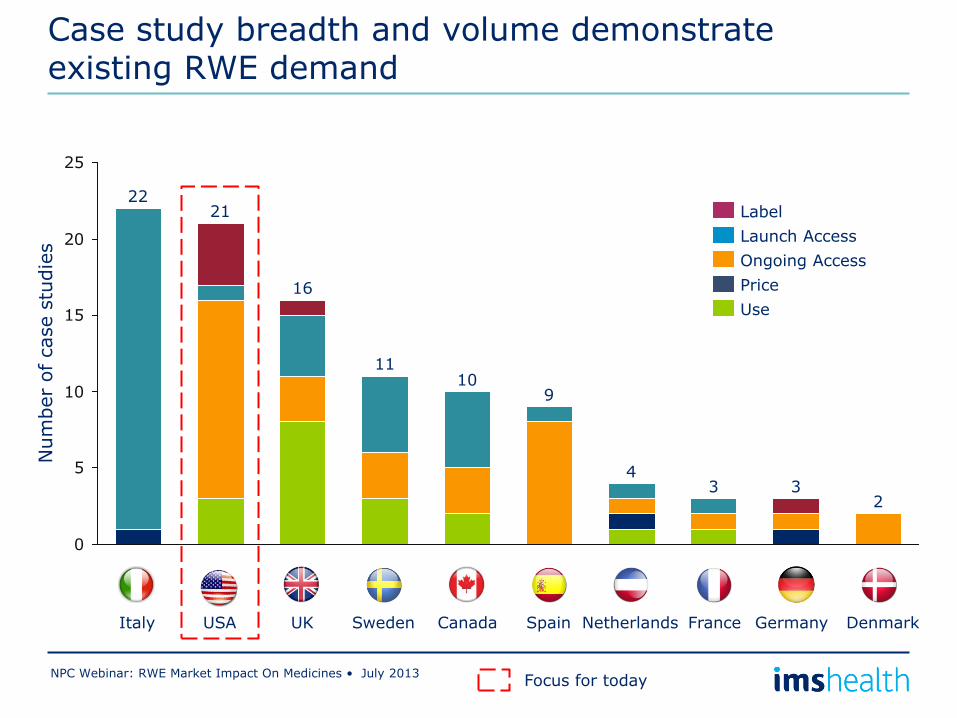
0
5
10
15
20
25
Num
ber
of case s
tudie
s
2 3 3
4
9 10
11
16
21 22
Use
Price
Ongoing Access
Launch Access
Label
Italy USA UK Sweden Canada Spain Netherlands France Germany Denmark
Case study breadth and volume demonstrate existing RWE demand
NPC Webinar: RWE Market Impact On Medicines • July 2013 Focus for today
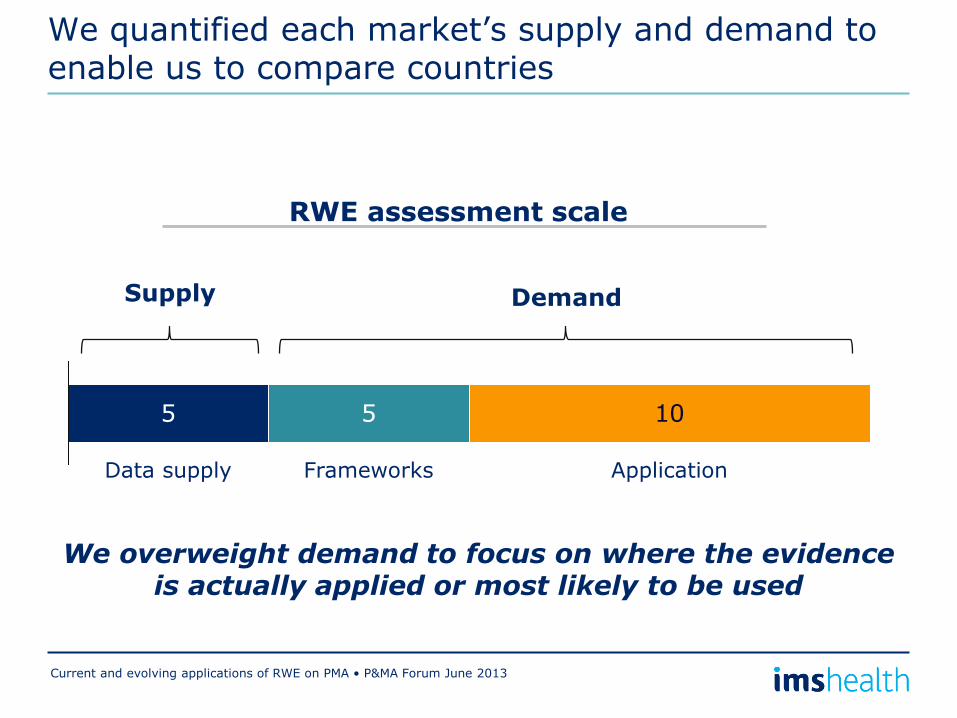
We quantified each market’s supply and demand to enable us to compare countries
Current and evolving applications of RWE on PMA • P&MA Forum June 2013
RWE assessment scale
5 5 10
Application Data supply Frameworks
Supply Demand
We overweight demand to focus on where the evidence is actually applied or most likely to be used
4
2
3
3
1
2
1
1
1
0
0 5 10 15 20
2 1
3 2 1
4 2 1
5 3 1
6 2 2
6 2 3
8 4 1
9 3 3
9 4 3
11 3 4
Supply
Frameworks
Application
UK
Canada
Sweden
Netherlands
USA
Italy
Spain
Germany
France
Denmark
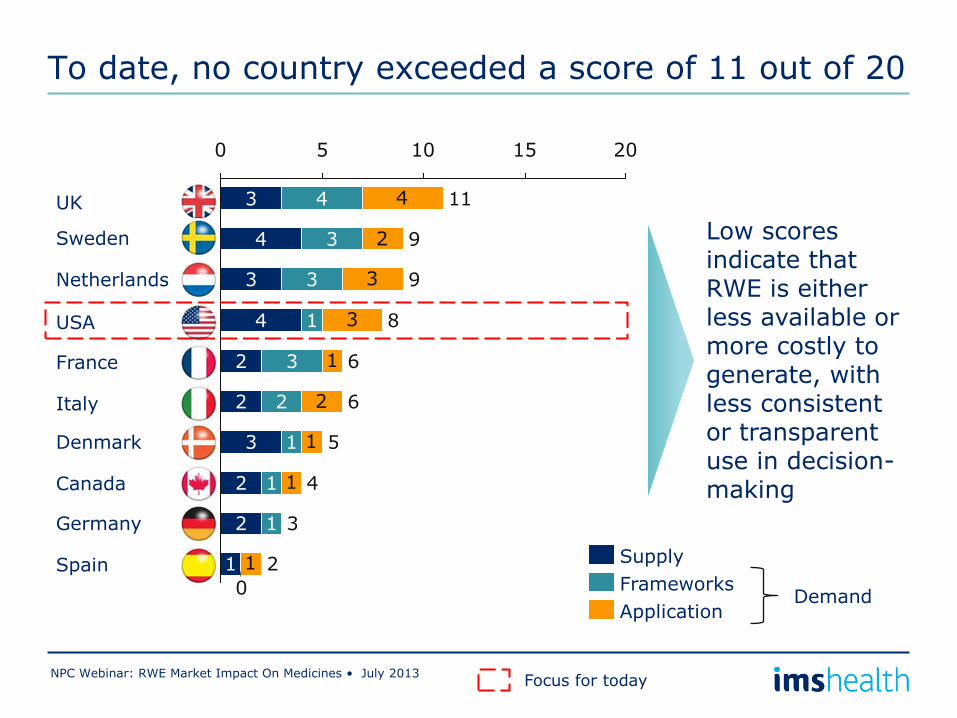
To date, no country exceeded a score of 11 out of 20
NPC Webinar: RWE Market Impact On Medicines • July 2013
Low scores indicate that RWE is either less available or more costly to generate, with less consistent or transparent use in decision-making
Demand
Focus for today
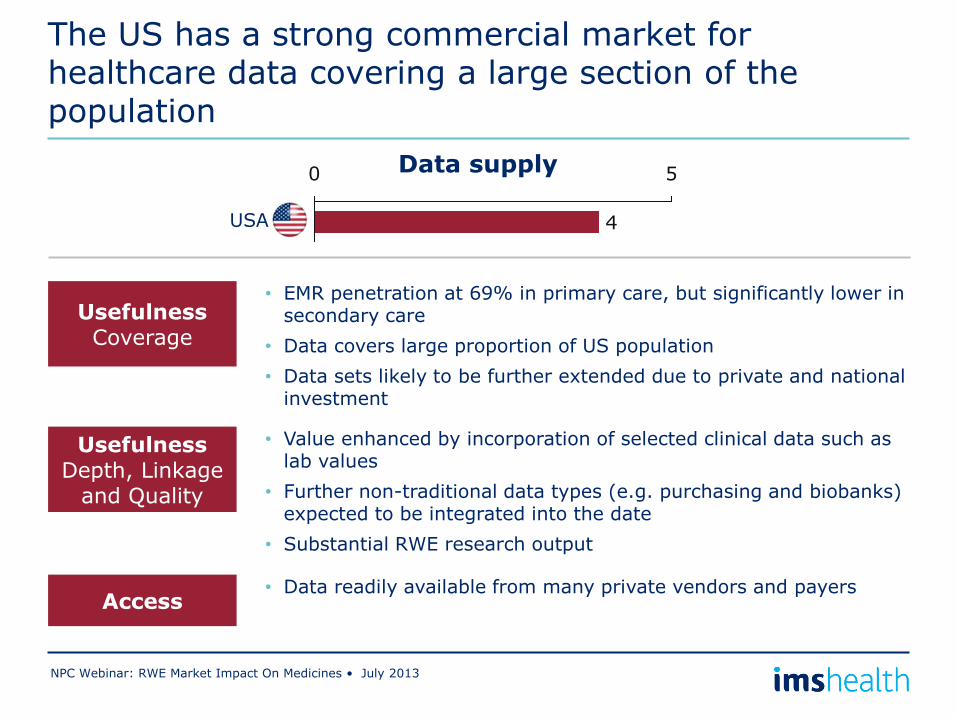
The US has a strong commercial market for healthcare data covering a large section of the population
NPC Webinar: RWE Market Impact On Medicines • July 2013
• EMR penetration at 69% in primary care, but significantly lower in secondary care
• Data covers large proportion of US population
• Data sets likely to be further extended due to private and national investment
Usefulness Coverage
Access • Data readily available from many private vendors and payers
Usefulness Depth, Linkage
and Quality
• Value enhanced by incorporation of selected clinical data such as lab values
• Further non-traditional data types (e.g. purchasing and biobanks) expected to be integrated into the date
• Substantial RWE research output
Data supply
4
0 5
USA
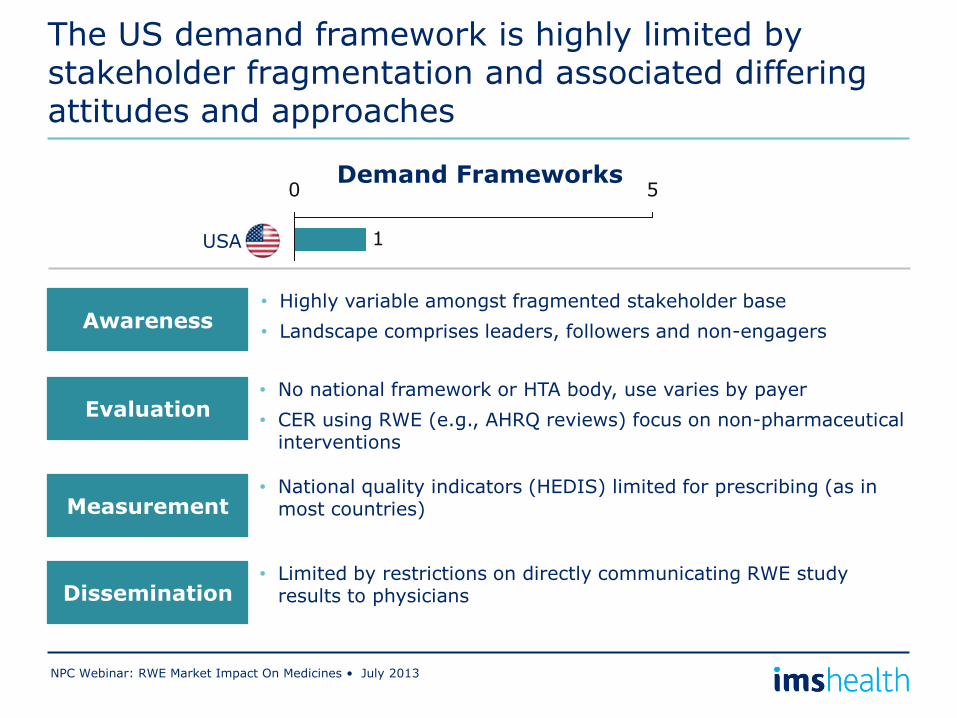
The US demand framework is highly limited by stakeholder fragmentation and associated differing attitudes and approaches
NPC Webinar: RWE Market Impact On Medicines • July 2013
• Highly variable amongst fragmented stakeholder base
• Landscape comprises leaders, followers and non-engagers Awareness
Evaluation • No national framework or HTA body, use varies by payer
• CER using RWE (e.g., AHRQ reviews) focus on non-pharmaceutical interventions
Demand Frameworks
Measurement • National quality indicators (HEDIS) limited for prescribing (as in
most countries)
Dissemination • Limited by restrictions on directly communicating RWE study
results to physicians
1
0 5
USA
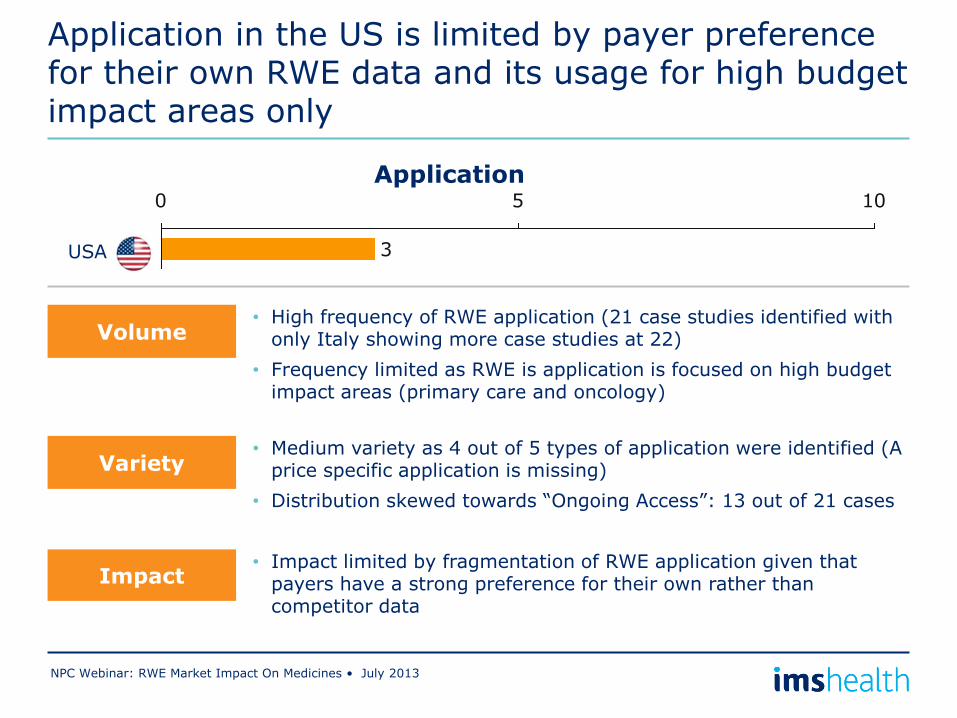
Application in the US is limited by payer preference for their own RWE data and its usage for high budget impact areas only
NPC Webinar: RWE Market Impact On Medicines • July 2013
Volume
Impact
• Medium variety as 4 out of 5 types of application were identified (A price specific application is missing)
• Distribution skewed towards “Ongoing Access”: 13 out of 21 cases
Application
• High frequency of RWE application (21 case studies identified with only Italy showing more case studies at 22)
• Frequency limited as RWE is application is focused on high budget impact areas (primary care and oncology)
Variety
• Impact limited by fragmentation of RWE application given that payers have a strong preference for their own rather than competitor data
USA 3
0 5 10
NPC Webinar: RWE Market Impact On Medicines • July 2013
What does this mean for pharma’s RWE strategy?
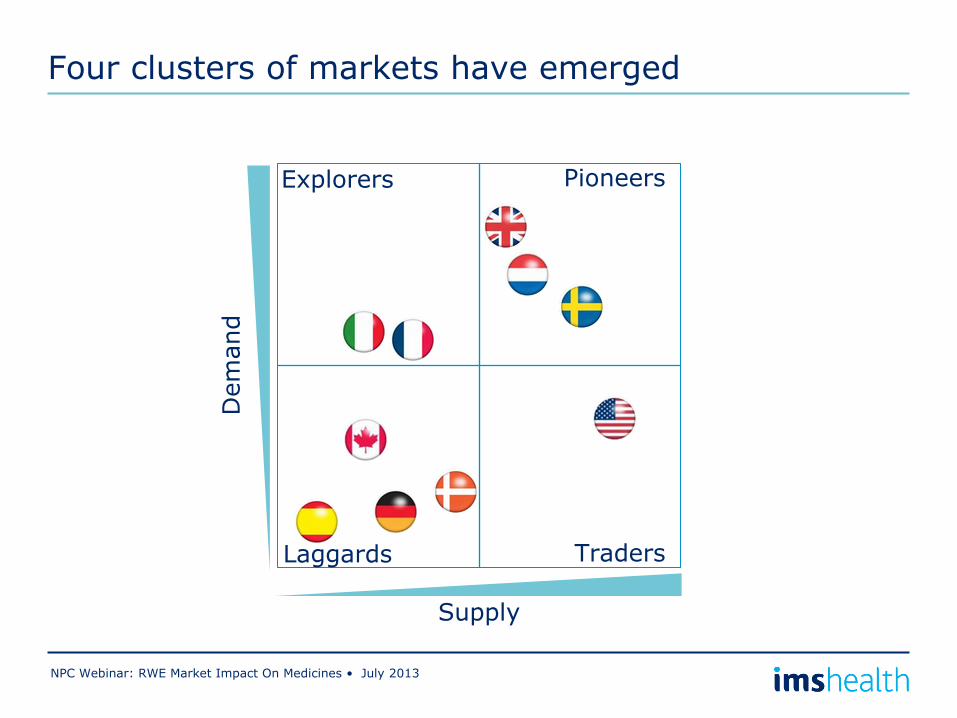
Four clusters of markets have emerged
NPC Webinar: RWE Market Impact On Medicines • July 2013
Explorers
Laggards Traders
Pioneers
Supply
Dem
and
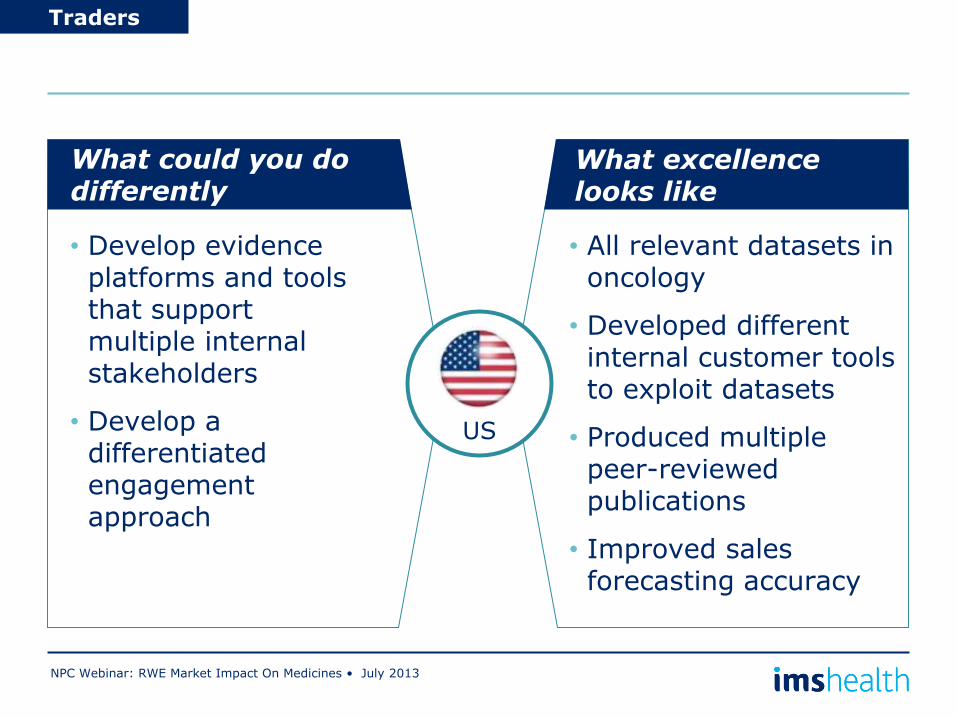
NPC Webinar: RWE Market Impact On Medicines • July 2013
Traders
What could you do differently
What excellence looks like
Text
• Develop evidence platforms and tools that support multiple internal stakeholders
• Develop a differentiated engagement approach
• All relevant datasets in oncology
• Developed different internal customer tools to exploit datasets
• Produced multiple peer-reviewed publications
• Improved sales forecasting accuracy
US
Outcomes Publications
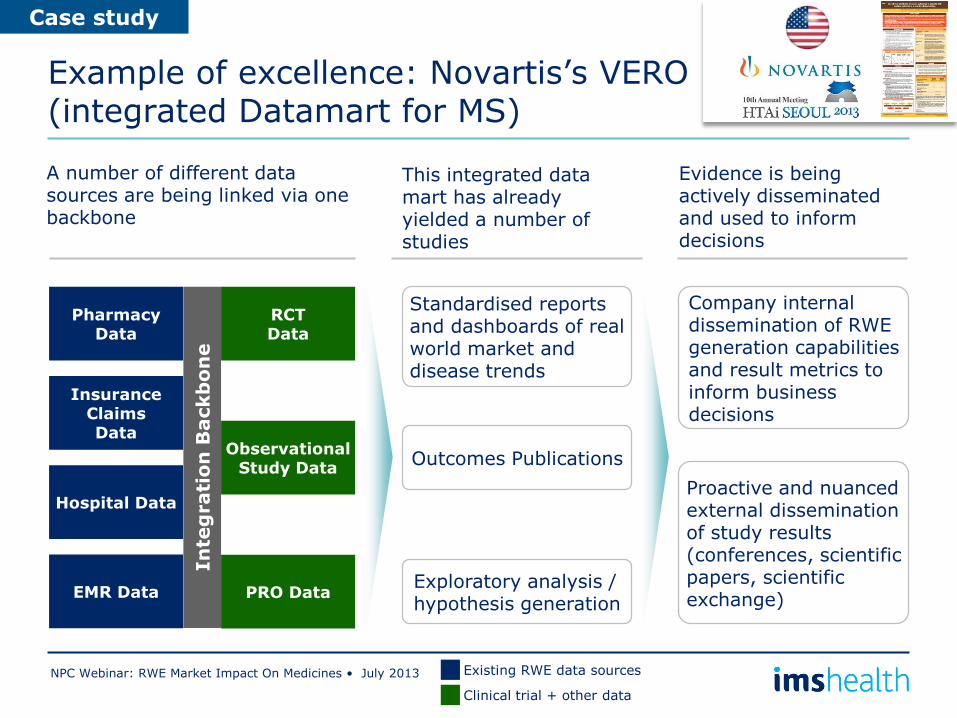
Example of excellence: Novartis’s VERO (integrated Datamart for MS)
NPC Webinar: RWE Market Impact On Medicines • July 2013
A number of different data sources are being linked via one backbone
Pharmacy Data
Insurance Claims Data
Hospital Data
EMR Data
RCT Data
Observational Study Data
PRO Data
In
teg
rati
on
Backb
on
e
This integrated data mart has already yielded a number of studies
Standardised reports and dashboards of real world market and disease trends
Exploratory analysis / hypothesis generation
Evidence is being actively disseminated and used to inform decisions
Company internal dissemination of RWE generation capabilities and result metrics to inform business decisions
Proactive and nuanced external dissemination of study results (conferences, scientific papers, scientific exchange)
Case study
Existing RWE data sources
Clinical trial + other data
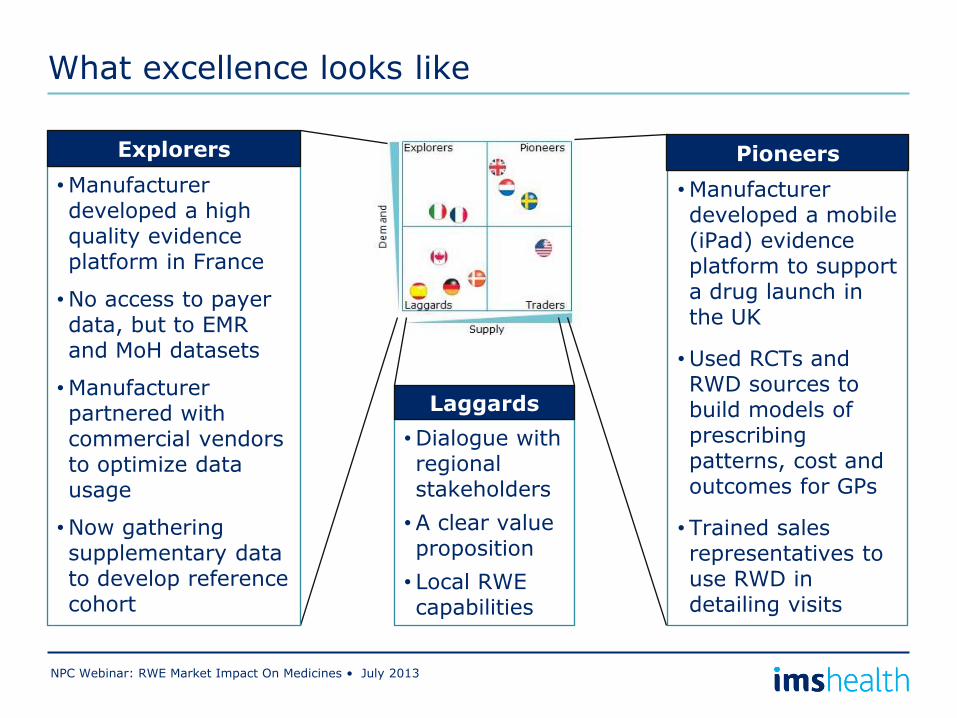
What excellence looks like
NPC Webinar: RWE Market Impact On Medicines • July 2013
•Manufacturer developed a mobile (iPad) evidence platform to support a drug launch in the UK
•Used RCTs and RWD sources to build models of prescribing patterns, cost and outcomes for GPs
• Trained sales representatives to use RWD in detailing visits
Pioneers
•Dialogue with regional stakeholders
•A clear value proposition
• Local RWE capabilities
Laggards
•Manufacturer developed a high quality evidence platform in France
•No access to payer data, but to EMR and MoH datasets
•Manufacturer partnered with commercial vendors to optimize data usage
•Now gathering supplementary data to develop reference cohort
Explorers
Thank you very much for participating!
NPC Webinar: RWE Market Impact On Medicines • July 2013
Suggested Further Reading
Questions, Thoughts, Ideas?
Marla Kessler VP, IMS Consulting Group [email protected]
Dr. Ben Hughes Senior Principal, Real World Evidence Solutions [email protected]
http://www.imsconsultinggroup.com/deployedfiles/consulting/Global/Content/Our%20Latest%20Thinking/Static%20Files/rwe_market_impact_on_medicines.pdf

Submit questions and comments via the Questions section in the Control Panel
To Submit Questions
2 Ways to Ask a Question
Twitter: Message @npcnow using #npcims

Q&A Panel
48
Dr. Ben Hughes Senior Principal, Real World Evidence
Solutions, IMS Health
Marla Kessler Vice President,
IMS Consulting Group
Dr. Eleanor M. Perfetto Professor, Pharmaceutical Health Services
Research, School of Pharmacy, University of Maryland
Dr. Robert W. Dubois Chief Science Officer,
National Pharmaceutical Council
Thank You
• The webinar will be archived and posted on NPC’s website in coming days.
• For further information, contact:
– Dr. Robert Dubois, Chief Science Officer, NPC, [email protected]
– Dr. Eleanor Perfetto, Professor, Pharmaceutical Health Services Research, School of Pharmacy, University of Maryland, [email protected]
– Marla Kessler, VP, IMS Consulting Group, [email protected]
– Dr. Ben Hughes, Senior Principal, Real World Evidence Solutions, [email protected]
49


![[D&D 3.5E - ITA] - Manuale Supplemento - Perfetto Combattente](https://img.pdfslide.us/doc/110x75/56d6c0371a28ab30169972cd/dd-35e-ita-manuale-supplemento-perfetto-combattente.jpg)