Embed Size (px)
Citation preview

THE JOURNAL OF FINANCE • VOL. LXVI, NO. 1 • FEBRUARY 2011
When Is a Liability Not a Liability? TextualAnalysis, Dictionaries, and 10-Ks
TIM LOUGHRAN and BILL MCDONALD∗
ABSTRACT
Previous research uses negative word counts to measure the tone of a text. We showthat word lists developed for other disciplines misclassify common words in financialtext. In a large sample of 10-Ks during 1994 to 2008, almost three-fourths of the wordsidentified as negative by the widely used Harvard Dictionary are words typically notconsidered negative in financial contexts. We develop an alternative negative wordlist, along with five other word lists, that better reflect tone in financial text. We linkthe word lists to 10-K filing returns, trading volume, return volatility, fraud, materialweakness, and unexpected earnings.
A GROWING BODY of finance and accounting research uses textual analysis toexamine the tone and sentiment of corporate 10-K reports, newspaper arti-cles, press releases, and investor message boards. Examples are Antweiler andFrank (2004), Tetlock (2007), Engelberg (2008), Li (2008), and Tetlock, Saar-Tsechansky, and Macskassy (2008). The results to date indicate that negativeword classifications can be effective in measuring tone, as reflected by signifi-cant correlations with other financial variables.
A commonly used source for word classifications is the Harvard Psychoso-ciological Dictionary, specifically, the Harvard-IV-4 TagNeg (H4N) file. Onepositive feature of this list for research is that its composition is beyond thecontrol of the researcher. That is, the researcher cannot pick and choose whichwords have negative implications. Yet English words have many meanings,and a word categorization scheme derived for one discipline might not trans-late effectively into a discipline with its own dialect.
In a survey of textual analysis, Berelson (1952) notes that: “Content analysisstands or falls by its categories. Particular studies have been productive tothe extent that the categories were clearly formulated and well adapted tothe problem” (p. 92). In some contexts, the H4N list of negative words mayeffectively capture the tone of a text. The question we address in this paper iswhether a word list developed for psychology and sociology translates well intothe realm of business.
∗Loughran and McDonald are with University of Notre Dame. We are indebted to Paul Tetlockfor comments on a previous draft. We also thank Robert Battalio, Peter Easton, James Fuehrmeyer,Paul Gao, Campbell Harvey (Editor), Nicholas Hirschey, Jennifer Marietta-Westberg, Paul Schultz,an anonymous referee, an anonymous associate editor, and seminar participants at the 2009 FMAmeeting, University of Notre Dame, and York University for helpful comments. We thank Hang Lifor research assistance.
35

36 The Journal of Finance R©
While measuring document tone using any word classification scheme isinherently imprecise, we provide evidence based on 50,115 firm-year 10-Ksbetween 1994 and 2008 that the H4N list substantially misclassifies wordswhen gauging tone in financial applications. Misclassified words that are notlikely correlated with the variables under consideration—for example, taxes orliabilities—simply add noise to the measurement of tone and thus attenuatethe estimated regression coefficients. However, we also find evidence that somehigh frequency misclassifications in the Harvard list, such as mine or cancer,could introduce type I errors into the analysis to the extent that they proxy forindustry segments or firm attributes.
We make several contributions to the literature on textual analysis. Mostnotably, we find that almost three-fourths (73.8%) of the negative word countsaccording to the Harvard list are attributable to words that are typically notnegative in a financial context. Words such as tax, cost, capital, board, liability,foreign, and vice are on the Harvard list. These words also appear with greatfrequency in the vast majority of 10-Ks, yet often do no more than name aboard of directors or a company’s vice-presidents. Other words on the Harvardlist, such as mine, cancer, crude (oil), tire, or capital, are more likely to identifya specific industry segment than reveal a negative financial event.
We create a list of 2,337 words that typically have negative implications ina financial sense. The prevalence of polysemes in English—words that havemultiple meanings—makes an absolute mapping of specific words into finan-cial sentiment impossible. We can, however, develop lists based on actual usagefrequency that are most likely associated with a target construct. We use theterm Fin-Neg to describe our list of negative financial words. Some of thesewords also appear on the H4N list, but others, such as felony, litigation, re-stated, misstatement, and unanticipated do not.
When testing the 10-K sample, whether tone should be gauged by the entiredocument or just the Management Discussion and Analysis (MD&A) sectionis an empirical question. We show that the MD&A section does not producetone measures that have a more discernable impact on 10-K file date excessreturns. Thus, the MD&A section does not allow us to assess tone through aclearer lens.
In our results, we find that dividing firms into quintiles according to the pro-portion of H4N words (with inflections) in their 10-Ks produces no discernablepattern. That is, the proportion of H4N words does not systematically increaseas 10-K filing returns decrease. However, when we use our financial negativelist to sort firms, we observe a strong pattern. Regressions with multiple con-trol variables confirm the univariate findings of no effect for the proportionalcounts from the Harvard list versus a significant impact for the Fin-Neg list.
We also show that the attenuation bias introduced by misclassifications, es-pecially by high frequency words (which may be overweighted based on simpleproportional measures), can be substantially mitigated by using term weight-ing. Most textual analysis uses a “bag of words” method where a document issummarized in a vector of word counts, and then combined across documents
When Is a Liability Not a Liability? 37
into a term-document matrix. In other disciplines, term weighting is typicallyused in any vector space representation of documents.1 With term weighting,where the enormous differences in frequencies are dampened through a logtransformation and common words are weighted less, both the Harvard listand our Fin-Neg list generally produce similar results.
To expand the word classification categories, we create five additional wordlists. Specifically, in addition to the negative word lists, we consider positive,uncertainty, litigious, strong modal, and weak modal word categories.2 Whenwe assess whether these word lists actually gauge tone, we find significantrelations between our word lists and file date returns, trading volume, subse-quent return volatility, standardized unexpected earnings, and two separatesamples of fraud and material weakness. We also examine whether negativetone classifications are related to future returns in terms of a trading strategy,and find no evidence of return predictability based on the competing measures.
The nature of word usage in firm-related news is not identical across me-dia. Whether our results hold for samples beyond 10-Ks is an importantquestion. We provide preliminary evidence in alternative contexts showingthat in comparison with the Harvard list, the Fin-Neg list has larger cor-relations with returns in samples of seasoned equity offerings and newsarticles.
The remainder of the paper is organized as follows. Section I discusses relatedresearch on textual analysis. Section II introduces the data sources, variables,and term weighting method used in our analysis. Section III describes thevarious word lists and Section IV reports the empirical results. Finally, SectionV concludes.
I. Research on Textual Analysis
Textual analysis is a subset of a broader literature in finance on qualitativeinformation. This literature is confronted by the difficult process of accuratelyconverting qualitative information into quantitative measures. Examples ofqualitative studies not based on textual analysis include Coval and Shumway(2001), who examine the relation between trading volume in futures contractsand noise levels in the trading pits, and Mayew and Venkatachalam (2009), whoanalyze conference call audio files for positive or negative vocal cues revealedby managers’ vocal signatures.
Although we focus on the more common word categorization (bag of words)method for measuring tone, other papers consider alternative approaches basedon vector distance, Naıve Bayes classifications, likelihood ratios, or other clas-sification algorithms. (See, for example, Das and Chen (2001), Antweiler andFrank (2004), or Li (2009)). Li discusses the benefits of using a statistical
1 See Manning and Schutze (2003), Jurafsky and Martin (2009), or Singhal (2009).2 Modal verbs are used to express possibility (weak) and necessity (strong). We extend this
categorization to create our more general classification of modal words.

38 The Journal of Finance R©
approach over a word categorization one, arguing that categorization mighthave low power for corporate filings because “there is no readily available dic-tionary that is built for the setting of corporate filings” (p. 12). Tetlock (2007,p. 1440) discusses the drawbacks of using methods that require the estimationof likelihood ratios based on difficult to replicate and subjective classificationof texts’ tone.3
Authors commonly use external word lists, like Harvard’s General Inquirer,to evaluate the tone of a text. The General Inquirer has 182 tag categories.Examples include positive, negative, strong, weak, active, pleasure, and evenpain categories. Finance and accounting researchers generally focus on theHarvard IV-4 negative and positive word categories, although none seems tofind much incremental value in the positive word lists.
The limitations of positive words in prior tests, as noted by others, is likelyattributable to their frequent negation. It is common to see the framing ofnegative news using positive words (“did not benefit”), whereas corporate com-munications rarely convey positive news using negated negative words (“notdowngraded”).
While not every prior work uses the Harvard negative word list to gauge texttone, it is a typical example of word classification schemes. We choose to use theHarvard list for our tests because, unlike many other word lists, the Harvardlist is nonproprietary. This allows us to assess exactly which words contributemost to the aggregate counts.
Perhaps the best known study in this area is Tetlock (2007), who links theWall Street Journal’s popular “Abreast of the Market” column with subsequentstock returns and trading volume. Tetlock finds that high levels of pessimisticwords in the column precede lower returns the next day. Pessimism is initiallydetermined by word counts using a factor derived from 77 General Inquirer cat-egories in the Harvard dictionary. However, later in his paper, Tetlock focuseson both negative words and weak words, as these are most highly correlatedwith pessimism. Tetlock notes that “negative word counts are noisy measuresof qualitative information” and that the noisy measures attenuate estimatedregression coefficients. In a subsequent study, Tetlock, Saar-Tsechansky, andMacskassy (2008) focus exclusively on the Harvard negative word list usingfirm-specific news stories. Our study shows that the noise of misclassification(nontonal words classified as negative) in the Harvard list is substantial whenanalyzing 10-Ks and that some of these misclassified words might unintention-ally capture other effects.
3 Other researchers link the tone of newspaper articles (Kothari, Li, and Short (2008)) or com-pany press releases (Demers and Vega (2008), Engelberg (2008), and Henry (2008)) with lowerfirm earnings, earnings drift, or stock returns. Also considered are a firm’s 10-K or IPO prospectus(Li (2008, 2009), Hanley and Hoberg (2010), and Feldman et al. (2008)). The main point of thesepapers is that the linguistic content of a document is useful in explaining stock returns, stockvolatility, or trading volume.
When Is a Liability Not a Liability? 39
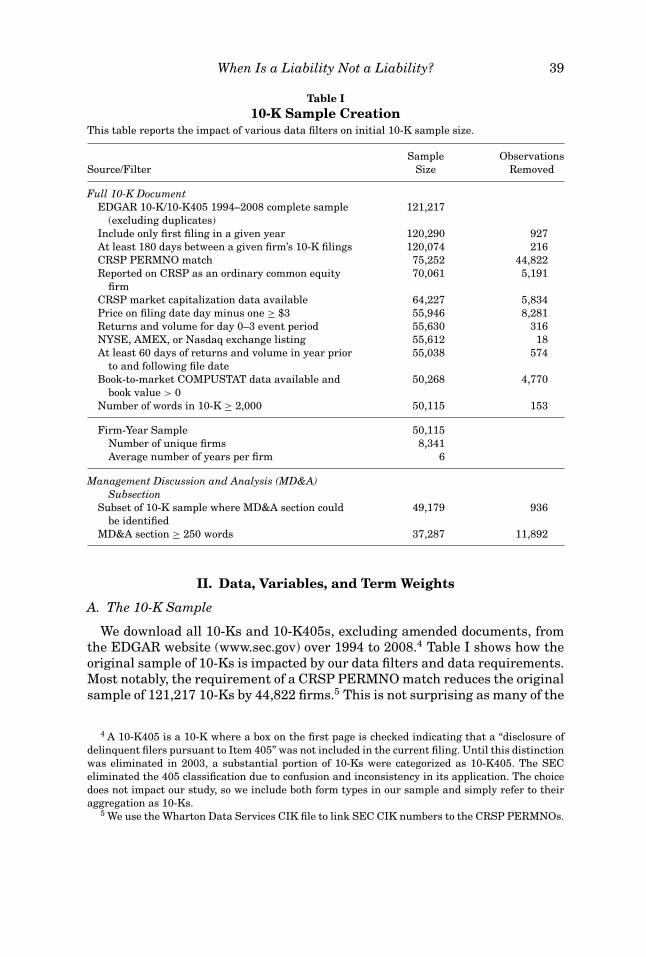
Table I10-K Sample Creation
This table reports the impact of various data filters on initial 10-K sample size.
Sample ObservationsSource/Filter Size Removed
Full 10-K DocumentEDGAR 10-K/10-K405 1994–2008 complete sample
(excluding duplicates)121,217
Include only first filing in a given year 120,290 927At least 180 days between a given firm’s 10-K filings 120,074 216CRSP PERMNO match 75,252 44,822Reported on CRSP as an ordinary common equity
firm70,061 5,191
CRSP market capitalization data available 64,227 5,834Price on filing date day minus one ≥ $3 55,946 8,281Returns and volume for day 0–3 event period 55,630 316NYSE, AMEX, or Nasdaq exchange listing 55,612 18At least 60 days of returns and volume in year prior
to and following file date55,038 574
Book-to-market COMPUSTAT data available andbook value > 0
50,268 4,770
Number of words in 10-K ≥ 2,000 50,115 153
Firm-Year Sample 50,115Number of unique firms 8,341Average number of years per firm 6
Management Discussion and Analysis (MD&A)Subsection
Subset of 10-K sample where MD&A section couldbe identified
49,179 936
MD&A section ≥ 250 words 37,287 11,892
II. Data, Variables, and Term Weights
A. The 10-K Sample
We download all 10-Ks and 10-K405s, excluding amended documents, fromthe EDGAR website (www.sec.gov) over 1994 to 2008.4 Table I shows how theoriginal sample of 10-Ks is impacted by our data filters and data requirements.Most notably, the requirement of a CRSP PERMNO match reduces the originalsample of 121,217 10-Ks by 44,822 firms.5 This is not surprising as many of the
4 A 10-K405 is a 10-K where a box on the first page is checked indicating that a “disclosure ofdelinquent filers pursuant to Item 405” was not included in the current filing. Until this distinctionwas eliminated in 2003, a substantial portion of 10-Ks were categorized as 10-K405. The SECeliminated the 405 classification due to confusion and inconsistency in its application. The choicedoes not impact our study, so we include both form types in our sample and simply refer to theiraggregation as 10-Ks.
5 We use the Wharton Data Services CIK file to link SEC CIK numbers to the CRSP PERMNOs.
40 The Journal of Finance R©
firms with missing PERMNOs are real estate, nonoperating, or asset-backedpartnerships/trusts that are required to file with the SEC.
We require data to be available for regression variables (e.g., returns, size,book-to-market, institutional ownership), and firms to be listed on the NYSE,Amex, or NASDAQ with a reported stock price immediately before the file dateof at least $3. Eliminating low-priced firms reduces the role of bid-ask bouncewhen we examine the market reaction to the 10-K filing. We require the firmto have at least 60 days of trading in the year before and the year after thefiling date. We also require the 10-K document to include more than 2,000words (some filings simply reference other filings). We include only one filingper firm in each calendar year, with at least 180 days between filings. Thesesample selection criteria yield a sample of 50,115 observations consisting of8,341 unique firms.
Part of our analysis focuses on the Management Discussion and Analysissubsection of the 10-K. It can be argued that the MD&A section is wheremanagement is most likely to reveal information through the tone that theyuse. We require at least 250 words to appear in the MD&A section, because inmany cases this information is “incorporated by reference” (typically deferringto the shareholders annual report). Using the 250-word filter, it was muchmore common for firms to incorporate the MD&A section by reference earlierin the sample period (55% in 1994 vs. 9% in 2008).6 We have 37,287 firm-yearobservations for the MD&A results.
B. Parsing the 10-Ks
As in most studies using textual analysis in finance, we use a bag of wordsmethod that requires us to parse the 10-K documents into vectors of wordsand word counts. A detailed description of the parsing process is provided inthe Internet Appendix.7 As we describe in the Internet Appendix, we exclude10-K tables and exhibits from the analysis as these items are more likelyto contain template language that is less meaningful in measuring tone. Forexample, post–Sarbanes-Oxley, most 10-Ks contain Exhibit 31.1, pertainingto the certification of the 10-K by the CEO. The standard exhibit includes anumber of negative words, for example, untrue, omit, weaknesses, and fraud.Thus, when we refer to the “full 10-K” in the text, we are referring to thedocument excluding the tables and exhibits.8
6 When the MD&A section is incorporated by reference to the annual report, it usually appearsin an exhibit that is part of the filing (often with other material). Within the exhibit, the beginningand especially the ending point for the MD&A material typically is not demarcated in a mannerthat facilitates accurate parsing. Thus, we only include MD&A material that appears in the bodyof the primary document.
7 The Internet Appendix is available on the Journal of Finance website athttp://www.afajof.org/supplements.asp.
8 The essential conclusions of the paper remain the same if we include the exhibits.
When Is a Liability Not a Liability? 41
C. 10-K Subsamples
To evaluate the economic relevance of our word lists, we also consider twosamples documenting negative financial events in other studies. First, weconsider a sample of 10-Ks filed by firms subject to shareholder litigation underRule 10b-5.9 All of the firms in this limited sample have been accused of ac-counting fraud. The sample was created by a keyword search for “GAAP” and“Restatement” in 10b-5 class action suits. The Rule 10b-5 allegations arguethat material omissions by managers led to inflated stock prices. Firms in the10b-5 sample include Enron, Boston Chicken, and Cardinal Health.
Our second sample considers Doyle, Ge, and McVay’s (2007) firms disclosingat least one material weakness in internal control between August 2002 andNovember 2005.10 These disclosures are an artifact of Sections 302 and 404 ofthe Sarbanes-Oxley Act. A material weakness in internal control is describedby the Public Company Accounting Oversight Board (2004) as “more thana remote likelihood that a material misstatement of the annual or interimfinancial statements will not be prevented or detected.”
D. Variables
Our primary tests examine stock returns relative to the 10-K filing date. Thefile date return is measured as the 4-day holding period excess return overdays 0 through 3. In all cases, the excess return refers to the firm’s buy-and-hold stock return minus the CRSP value-weighted buy-and-hold market indexreturn over the 4-day event window. The event period for the file date return isbased on Griffin (2003, Table II), who documents that 10-Ks’ “elevated responseextends to day 3” (p. 447).11
In our regressions we include as control variables firm size, book-to-market,share turnover, prefile date Fama–French alpha (Pre FFAlpha), institutionalownership, and a dummy variable for NASDAQ listing.12 The first four ofthese variables are used in Tetlock, Saar-Tsechansky, and Macskassy (2008).To adjust for microstructure effects and different stock trading behaviors, aNASDAQ dummy and the proportion of the firm owned by institutions are alsoadded. Postevent returns are considered using a long-short portfolio based onthe proportion of negative words in the 10-K.
We also examine whether the 10-K tone measures are related to subsequentstandardized unexpected earnings (SUE). In the SUE regressions, we extend
9 We thank Peter Easton, Greg Sommers, Mark Zmijewski, and Chicago Partners LLC forproviding us with the 10b-5 data.
10 The data were downloaded from http://faculty.washington.edu/geweili/ICdata.html in August2008.
11 The exact point at which the 10-K becomes public is confounded by changes in the SEC’sdissemination process during the sample period and the assumption that the public has completelyread and assessed the document. Under the dissemination system established in November 1998,a filing is checked for simple perfunctory errors and then a private contractor makes the documentavailable to the public.
12 See the Appendix at the end of the main text for detailed definitions of the variables describedin this section.

42 The Journal of Finance R©
the control variables to include analyst dispersion and analyst revisions, as inTetlock, Saar-Tsechansky, and Macskassy (2008).
Finally, we include industry dummy variables to control for cross-sectionaleffects in the data. We use the 48-industry classification scheme of Fama andFrench (1997), except for the logit regressions based on the 10b-5 and materialweakness data, where we use a five-industry classification due to the samplesize.
E. Term Weighting
In the information retrieval literature, a critical first step in the vector space(bag of words) model is the selection of a term weighting scheme. In the contextof information retrieval, Jurafsky and Martin (2009, p. 771) note that termweighting “has an enormous impact on the effectiveness of a retrieval system.”Essentially, term weighting acknowledges that raw word counts are not thebest measure of a word’s information content. Weighting schemes address threecomponents: the importance of a term within a document (often measured byproportional occurrence or the log of frequency); some form of normalizationfor document length; and the importance of a term within the entire corpus(typically measured by inverse document frequency).
Weighting schemes are generically labeled tf.idf, where tf (term frequency)represents the method used to account for the word frequency and normaliza-tion, and idf (inverse document frequency) denotes the method used to adjustfor impact across the entire collection. We use one of the most common termweighting schemes with a modification that adjusts for document length.13 IfN represents the total number of 10-Ks in the sample, dfi the number of docu-ments containing at least one occurrence of the ith word, tfi,j the raw count ofthe ith word in the jth document, and aj the average word count in the document,then we define the weighted measure as
wi, j =
⎧⎪⎪⎨⎪⎪⎩
(1 + log(t fi, j))(1 + log(aj))
logNdfi
if t fi, j ≥ 1
0 otherwise(1)
The first term attenuates the impact of high frequency words with a logtransformation. For example, the word loss appears 1.79 million times in oursample while the word aggravates appears only 10 times. It is unlikely that thecollective impact of the word loss is more than 179,000 times that of aggravates.The second term of equation (1) modifies the impact of a word based on itscommonality. For example, the word loss appears in more than 90% of thedocuments, which implies that the second term will decrease the first term
13 In information retrieval, a document is frequently compared with a search query, in whichcase it is less important to adjust for document length. Since we are comparing different documents,length matters. For a more general discussion of term weighting see Manning and Schutze (2003)or Chisholm and Kolda (1999).
When Is a Liability Not a Liability? 43
by more than 90%. Alternatively, because aggravates appears in relatively fewdocuments, the second term now increases the first by a factor of approximatelyeight. In our empirical results, we examine both the simple proportion of wordsfor a given tonal classification and the tf.idf weighted measures.
III. Textual Analysis and Word Lists
There are other labels for textual analysis in different disciplines; termssuch as content analysis, natural language processing, information retrieval,or computational linguistics describe a similar set of text-based methods. Manydifferent disciplines use textual analysis, including psychology, anthropology,linguistics, political science, journalism, and computer science.
Dovring (1954) documents the use of textual analysis as far back as theearly 1600s, when hymns were examined for word choices that threateneda particular religious group. As computers became more accessible, textualanalysis attracted more attention beginning in the 1950s. The arrival of theinternet and the development of search engines prompted new interest in thetopic and generated more sophisticated techniques, primarily appearing underthe rubric of information retrieval.14
The initial General Inquirer (GI) group that produced the early versions ofthe Harvard word lists became most active in the 1960s. The current versionof the Harvard Psychosociological Dictionary, is available through the GI web-site (see http://www.wjh.harvard.edu/∼inquirer/). We focus on the TAGNeg fileused in Tetlock, Saar-Tsechansky, and Macskassy (2008) because it is a non-proprietary list that has been used frequently in prior studies and should berepresentative of negative word lists developed in disciplines other than financeand accounting.
The classification of words in a document should account for inflections, ordifferent forms of the same word. For example, if we consider accident a neg-ative word, we would probably also want to include words such as accidental,accidentally, and accidents. We expand the H4N list by inflecting each word toforms that retain the original meaning of the root word.15 The original H4Nlist includes 2,005 words; our inflected version increases the number to 4,187.Our tests focus on the infected H4N list, which we label H4N-Inf.
Tetlock (2007), Engelberg (2008), and Kothari, Li, and Short (2008) find littleincremental information in the Harvard positive word list, and thus we donot include this GI category in the analysis. Engelberg (2008) argues thatthe Harvard positive word list may fail to correlate with financial disclosuresbecause of erroneous classification (he cites company, shares, and outstandingfrom the Harvard list). For completeness, however, when we create additional
14 For a discussion of the early research in textual analysis, see Stone et al. (1966).15 We expand the word list by explicitly identifying appropriate inflections to avoid errors asso-
ciated with stemming (i.e., assigning morphological variants to common root words). The problemwith stemming is that often a word’s meaning changes when common prefixes or suffixes are added.From the H4N list, for example, odd and bitter take on different meanings when made plural: oddsand bitters.
44 The Journal of Finance R©
word lists we include a positive category even though our primary focus iscomparing the H4N-Inf word list with our Fin-Neg list.
We propose five other word lists: positive (Fin-Pos); uncertainty (Fin-Unc);litigious (Fin-Lit); strong modal words (MW-Strong); and weak modal words(MW-Weak). All these lists are available in the Internet Appendix or athttp://www.nd.edu/∼mcdonald/Word Lists.html.
To create the above word lists, one strategy would be to let the data empir-ically determine the most impactful words. This approach would allow us todevelop a relatively short list of tonal words. The limitation of this approachis the endogeneity problem that would arise going forward. If, for example,managers know there is a list of words that have a significant negative impacton returns, then they will systematically avoid those words. A second strategy,which we follow, is to create a relatively exhaustive list of words that makesavoidance much more challenging.
To create the Fin-Neg, Fin-Pos, Fin-Unc, and Fin-Lit word lists, we first de-velop a dictionary of words and word counts from all 10-Ks filed during 1994to 2008. We carefully examine all words occurring in at least 5% of the doc-uments, to consider their most likely usage in financial documents (includinginflections). Words that we include beyond the 5% level are typically inflectionsof root words that made the original cut.
We account for simple negation only for Fin-Pos words. Simple negation istaken to be observations of one of six words (no, not, none, neither, never, nobody)occurring within three words preceding a positive word. We would not expectto see phrases such as “not terrible earnings” in a report, so we do not considernegation for the negative word lists.
Unlike the H4N-Inf list, the Fin-Neg list is specific to business terminol-ogy. In the language of business, words like increase or decrease are tonallyambiguous. In this case, what these words imply depends on whether theyprecede words such as revenues or costs. Words from the Harvard lists, such asliability or tax, are expected to appear in both positive and negative contextssimply as a structural artifact of accounting language. The critical empiricalquestion is thus whether such words appear often enough to impact the sta-tistical power of word lists derived from other disciplines. Any nontrivial wordlist applied to as many documents as in our 10-K sample will misclassify—theissue is to what extent. A discipline-specific word list can reduce measurementerror, thus increasing power and reducing the associated attenuation bias inparameter estimates. Also, as we will see below, some misclassified words canunintentionally proxy for other effects.
Of the 2,337 words in our Fin-Neg list, about half (1,121) overlap with theH4N-Inf list. Frequently occurring words in our list that are not on the H4N-Inflist include: restated, litigation, termination, discontinued, penalties, unpaid,investigation, misstatement, misconduct, forfeiture, serious, allegedly, noncom-pliance, deterioration, and felony.
Our Fin-Pos word list consists of 353 words including inflections, substan-tially fewer words than in the negative word list. In attempting to select posi-tive words, one quickly realizes that there are few positive words that are not
When Is a Liability Not a Liability? 45
easily compromised. Knowing that readers are using a document to evaluatethe value of a firm, writers are likely to be circumspect and avoid negative lan-guage, instead qualifying positive words, often in ways not easily detected by aparsing program. The tone of negative words has a much more pervasive effect.For example, felony, even if appearing in the phrase “whose felony convictionwas overturned,” is still negative. Words in our Fin-Pos list, such as achieve,attain, efficient, improve, profitable, or upturn are more unilateral in potentialtone. We include a positive word list more in the interest of symmetry than inan expectation of discerning an impact on tone identification.
The Fin-Unc list includes words denoting uncertainty, with emphasis on thegeneral notion of imprecision rather than exclusively focusing on risk. Thelist includes 285 words, such as approximate, contingency, depend, fluctuate,indefinite, uncertain, and variability.
The Fin-Lit list categorizes words reflecting a propensity for legal contest or,per our label, litigiousness. The list includes 731 words such as claimant, depo-sition, interlocutory, testimony, and tort. We also include words like legislationand regulation, which do not necessarily imply a legal contest but may reflect amore litigious environment. Note that many words from the Fin-Neg, Fin-Unc,and Fin-Lit lists overlap.
We extend Jordan’s (1999) categories of strong and weak modal words toinclude other terms expressing levels of confidence. Examples of strong modalwords (MW-Strong) are words such as always, highest, must, and will. Ex-amples of weak modal words (MW-Weak) are could, depending, might, andpossibly. There are 19 MW-Strong words in our list and 27 MW-Weak words.
How generalizable are our word lists to other documents, such as newspaperarticles or press releases? Since our list is generated by examination of a largecollection of words used in 10-Ks, we believe that the Fin-Neg list could beapplied successfully to other financial documents. Although certain negativewords might be used less often in some media releases, there is no reason to be-lieve that misclassification would be more likely. We provide some preliminaryevidence on this question in Section IV.G of the paper.
IV. Results
A. Sample Description
Summary statistics for the full sample of 50,115 10-Ks and subsample of37,287 MD&As are reported in Table II. In total, we examine 2.5 billion wordsin the 10-Ks. For the seven word list variables, a comparison of the mean andmedian values in both the 10-K and MD&A samples suggests that none of thefrequencies exhibit substantial skewness that might be caused by outliers. Asthe Fin-Neg list has only about half as many words as the H4N-Inf list, it isnot surprising that, on average, a lower percentage of 10-K words are in theFin-Neg word list (3.79% vs. 1.39%).
We also examine the means and medians for H4N-Inf and Fin-Neg by year—both show a gradual yet steady upward trend over the sample period, with

46 The Journal of Finance R©
Table IISummary Statistics for the 1994 to 2008 10-K Sample
The first seven variables represent the proportion of occurrences for a given word list rela-tive to the total number of words. The word lists are available in the Internet Appendix or athttp://www.nd.edu/∼mcdonald/Word Lists.html. See the Appendix for the other variable defini-tions. The sample sizes for the last three earnings-related variables are 28,679 for the full 10-Ksample and 21,240 for the MD&A subsample.
Full 10-K Document MD&A Section(N = 50,115) (N = 37,287)
Standard StandardVariable Mean Median Deviation Mean Median Deviation
Word ListsH4N-Inf (H4N w/
inflections)3.79% 3.84% 0.76% 4.83% 4.79% 0.89%
Fin-Neg (negative) 1.39% 1.36% 0.55% 1.51% 1.43% 0.67%Fin-Pos (positive) 0.75% 0.74% 0.21% 0.83% 0.79% 0.32%Fin-Unc (uncertainty) 1.20% 1.20% 0.32% 1.56% 1.48% 0.62%Fin-Lit (litigious) 1.10% 0.95% 0.53% 0.60% 0.51% 0.43%MW-Strong (strong
modal words)0.26% 0.24% 0.11% 0.30% 0.27% 0.17%
MW-Weak (weak modalwords)
0.43% 0.39% 0.21% 0.43% 0.34% 0.32%
Other VariablesEvent period [0,3] excess
return−0.12% −0.19% 6.82% −0.23% −0.28% 7.26%
Size ($billions) $3.09 $0.33 $14.94 $2.12 $0.30 $9.62Book-to-market 0.613 0.512 0.459 0.611 0.501 0.477Turnover 1.519 0.947 2.295 1.695 1.104 2.508One-year preevent FF
alpha0.07% 0.04% 0.20% 0.07% 0.05% 0.21%
Institutional ownership 48.34% 48.07% 28.66% 49.23% 48.52% 29.33%NASDAQ dummy 56.15% 100.00% 49.62% 60.12% 100.00% 48.97%Standardized
unexpected earnings−0.02% 0.03% 0.76% −0.03% 0.03% 0.82%
Analysts’ earningsforecast dispersion
0.17% 0.07% 0.33% 0.19% 0.08% 0.36%
Analysts’ earningsrevisions
−0.21% −0.04% 0.69% −0.24% −0.05% 0.74%
the mean for H4N-Inf rising from about 3.5% to 4.3% and the mean for Fin-Neg rising from about 1.1% to 1.7%. For the 10-K sample, the correlationbetween the H4N-Inf and Fin-Neg lists is a positive 0.701. Yet the correlationsof the two negative word lists with the event period excess returns are notablydifferent, with H4N-Inf and Fin-Neg having correlations of −0.004 and −0.021,respectively.
It is interesting to note the substantial rise in the proportion of negative Har-vard words in the MD&A section. The median proportion of H4N-Inf negativewords is 3.84% for the full 10-K, compared to 4.79% in the MD&A section. Fin-Neg reports a much smaller percentage increase for the median value (1.36%
When Is a Liability Not a Liability? 47
vs. 1.43%). Also note the sharp drop in litigious words contained in the MD&Asection compared to the full 10-K.
The mean market value is about $3.1 billion for the full 10-K sample, whilefor the MD&A sample it is only $2.1 billion. Recall that in the early years of thesample, more than half of all firms incorporate the MD&A section by reference.This large difference in mean market values between the two samples indi-cates that larger firms were more likely to have MD&A sections incorporatedby reference and that focusing on the MD&A section produces a nonrandomsample of the 10-Ks.
B. Examining the Composition of Negative Tone
Which words have a stronger weight in determining the tone of a text? Doesthe frequency of a limited number of common negative words dominate thelikelihood that a text will be classified as pessimistic? Are the most commonHarvard words truly negative in a financial sense? Are some negative wordsspecific to an industry?
For the 10-K sample of 50,115 firms, Table III reports, for both the full 10-Kdocument and the MD&A subsection, the 30 most frequently occurring wordsfrom the H4N-Inf (Panel A) and Fin-Neg (Panel B) lists. The check mark inPanel A indicates whether the word is also on the Fin-Neg list and, similarly,the check mark in Panel B indicates that the word is also on the H4N-Inf list.
The words that do not appear in both the full 10-K sample and the MD&Asubsample are indicated by italics. In Panel A, note that the two samplesdiffer by only two words, with vice and matters in the 10-K sample replacingdecreased and decline in the MD&A sample. Clearly, both the full 10-K andMD&A section use very similar negative words. For this reason, we initiallyfocus our comments on the full 10-K sample results.
The first column following each list of words reports, for each word, thefractional percentage of the total negative word count. For example, the wordcosts accounts for 4.61% of the total count of all the H4N-Inf negative words.
Panel A of Table III demonstrates the considerable misclassification of neg-ative words in 10-K documents according to the Harvard word list. The firstseven words (tax, costs, loss, capital, cost, expense, and expenses) account formore than one-fourth of the total count of “negative” words. Yet in the financialworld, firm costs, sources of capital, or the amount of tax paid are neutral innature; managers using this language are merely describing their operations.
In some nonbusiness situations, foreign or vice might appear as negativewords. In 10-K text, however, it is far more likely that foreign is used in thecontext of international operations or vice is used to refer to vice-presidents ofthe firm.
In textual analysis research, a higher negative word frequency indicates amore pessimistic or negative tone for the text. When we eliminate the fivewords that also appear on the Fin-Neg list (loss, losses, impairment, against,and adverse), Panel A reveals that from just the remaining 25 words, almost50% of the Harvard negative word count is attributable to words that are not

48 The Journal of Finance R©
Table IIIThirty Most Frequent Words Occurring in 10-Ks from the H4N-Inf
and Fin-Neg Word ListsThe H4N-Inf word list is based on the Harvard-IV-4 Psychosociological Dictionary TagNegfile. We extend the original word list to include appropriate inflections. The Fin-Neg wordlist includes negative words from a list of all words occurring in the full sample of 10-Ks filed over 1994 to 2008. The word lists are available in the Internet Appendix or athttp://www.nd.edu/∼mcdonald/Word Lists.html. There are 4,187 H4N-Inf words, based on 2,005root words in the original H4N list. Fin-Neg consists of 2,337 words, including inflections. Theresults in this table are based on the sample of 50,115 10-Ks with complete data for our regressionvariables downloaded from EDGAR for the period 1994 to 2008. The MD&A subsample comprises37,287 observations. Results are presented for the full 10-K documents and the correspondingMD&A portion of the 10-Ks. Words not appearing in both the full 10-K and MD&A subsample listsare italicized.
Panel A: H4N-Inf
Full 10-K Document MD&A Subsection
Word % of Total Word % of Totalin Fin-Neg in Fin-Neg
Fin- Word Cumulative Fin- Word CumulativeNeg Word Count % Neg Word Count %
TAX 4.83% 4.83% COSTS 6.45% 6.45%COSTS 4.61% 9.44% EXPENSES 5.51% 11.96%√LOSS 3.77% 13.21% EXPENSE 4.70% 16.66%CAPITAL 3.62% 16.83% TAX 4.68% 21.34%COST 3.51% 20.34% CAPITAL 4.24% 25.58%EXPENSE 3.12% 23.46% COST 3.70% 29.28%EXPENSES 2.92% 26.38%
√LOSS 3.29% 32.57%
LIABILITIES 2.66% 29.04% DECREASE 3.06% 35.63%SERVICE 2.57% 31.61% RISK 2.97% 38.60%RISK 2.34% 33.95%
√LOSSES 2.62% 41.22%
TAXES 2.23% 36.18% DECREASED 2.21% 43.44%√LOSSES 2.20% 38.38% LIABILITIES 2.15% 45.58%BOARD 2.13% 40.51% LOWER 2.10% 47.69%FOREIGN 1.68% 42.20% TAXES 1.95% 49.63%VICE 1.52% 43.71% SERVICE 1.91% 51.55%LIABILITY 1.41% 45.12% FOREIGN 1.87% 53.42%DECREASE 1.29% 46.41%
√IMPAIRMENT 1.63% 55.05%√
IMPAIRMENT 1.18% 47.59% CHARGES 1.40% 56.44%LIMITED 1.10% 48.69% LIABILITY 1.16% 57.60%LOWER 1.01% 49.70% CHARGE 1.16% 58.76%√AGAINST 1.00% 50.70% RISKS 1.05% 59.80%MATTERS 0.99% 51.69%
√DECLINE 1.00% 60.80%√
ADVERSE 0.94% 52.63% DEPRECIATION 0.92% 61.72%CHARGES 0.94% 53.57% MAKE 0.86% 62.58%MAKE 0.89% 54.46%
√ADVERSE 0.84% 63.42%
ORDER 0.88% 55.33% BOARD 0.79% 64.21%RISKS 0.85% 56.19% LIMITED 0.78% 64.99%DEPRECIATION 0.85% 57.04% EXCESS 0.71% 65.70%CHARGE 0.83% 57.87% ORDER 0.70% 66.40%EXCESS 0.82% 58.69%
√AGAINST 0.70% 67.10%
(continued)

When Is a Liability Not a Liability? 49
Table III—Continued
Panel B: Fin-Neg
Full 10-K Document MD&A Subsection
Word % of Total Word % of Totalin Fin-Neg in Fin-Neg
H4N- Word Cumulative H4N- Word CumulativeInf Word Count % Inf Word Count %
√LOSS 9.73% 9.73%
√LOSS 9.51% 9.51%√
LOSSES 5.67% 15.40%√
LOSSES 7.58% 17.10%CLAIMS 3.15% 18.55%
√IMPAIRMENT 4.71% 21.81%√
IMPAIRMENT 3.04% 21.59% RESTRUCTURING 2.93% 24.74%√AGAINST 2.58% 24.17%
√DECLINE 2.89% 27.62%√
ADVERSE 2.44% 26.61% CLAIMS 2.71% 30.33%RESTATED 2.09% 28.70%
√ADVERSE 2.44% 32.77%√
ADVERSELY 1.75% 30.45%√
AGAINST 2.01% 34.78%RESTRUCTURING 1.72% 32.17%
√ADVERSELY 1.94% 36.72%
LITIGATION 1.67% 33.83% LITIGATION 1.67% 38.40%DISCONTINUED 1.57% 35.40% CRITICAL 1.63% 40.03%TERMINATION 1.35% 36.75% DISCONTINUED 1.62% 41.64%√DECLINE 1.19% 37.93%
√DECLINED 1.30% 42.94%√
CLOSING 1.08% 39.01% TERMINATION 1.06% 44.00%√FAILURE 0.97% 39.98%
√NEGATIVE 0.96% 44.96%
UNABLE 0.84% 40.82%√
FAILURE 0.93% 45.89%√DAMAGES 0.82% 41.64% UNABLE 0.91% 46.80%√DOUBTFUL 0.77% 42.41%
√CLOSING 0.86% 47.65%√
LIMITATIONS 0.75% 43.17% NONPERFORMING 0.81% 48.47%√FORCE 0.74% 43.91%
√IMPAIRED 0.81% 49.28%√
VOLATILITY 0.73% 44.64%√
VOLATILITY 0.79% 50.07%CRITICAL 0.73% 45.37%
√FORCE 0.75% 50.82%√
IMPAIRED 0.70% 46.07%√
NEGATIVELY 0.73% 51.56%TERMINATED 0.70% 46.77%
√DOUBTFUL 0.72% 52.27%√
COMPLAINT 0.63% 47.39%√
CLOSED 0.70% 52.97%√DEFAULT 0.57% 47.96%
√DIFFICULT 0.69% 53.66%√
NEGATIVE 0.51% 48.47%√
DECLINES 0.63% 54.29%√DEFENDANTS 0.51% 48.99%
√EXPOSED 0.60% 54.89%√
PLAINTIFFS 0.51% 49.49%√
DEFAULT 0.59% 55.48%√DIFFICULT 0.50% 50.00%
√DELAYS 0.56% 56.04%
typically negative in the context of financial reporting. If more than the top 25words are examined, we find that almost three-fourths (73.8%) of the Harvardnegative word count typically does not have negative meaning in financialdocuments based on our classification.
Words such as costs from the Harvard list simply add noise to the measure.Misclassification, however, can also bias the measure of tone for specific indus-tries. For example, for both the precious metals and coal industries, mine isthe most common Harvard negative word (it is the second most common fornonmetallic mining). In this case the word is used in the 10-Ks merely to de-scribe operations (e.g., Rochester Mine, gold mine, or coal mine). In an extremeexample, the word mine in the 1999 10-K of Coeur d’Alene Mines Corporationaccounts for over 25% of all the H4N-Inf negative word counts.
50 The Journal of Finance R©
Another example is the word cancer, the tenth most common H4N-Inf neg-ative word in the Fama–French pharmaceutical products industry. For boththe banking and trading industries, by far the most common negative word iscapital. For autos, tire appears in the top 20 most frequent H4N-Inf negativewords; for oil, crude is ranked seventh in frequency. The tendency for some ofthe misclassified words to potentially proxy for other effects provides part ofthe basis for why our negative word list might be a better choice for financialresearchers. Some of the association of the HN4-Inf list with financial variablesmight be attributable to the Harvard list unintentionally capturing industryeffects.
Panel B of Table III reports the 30 most common words according to theFin-Neg list. Of these 30 words, 21 of them also appear on the H4N-Inf list,whereas 9 words do not (claims, restated, restructuring, litigation, discontinued,termination, unable, critical, and terminated). Unlike the Harvard list, themost common Fin-Neg words are ones that are more likely to be negative in afinancial sense.
Both panels of Table III highlight a well-known phenomenon in natural lan-guage processing popularly referred to as Zipf’s law.16 Essentially, this law tellsus that there are typically a small number of very high–frequency words and alarge number of low-frequency words. This reveals why term weighting couldbe important in financial applications where the impact of frequency shouldprobably be muted—for example, a word occurring 10 times more frequently ismost likely not 10 times more informative—and a word’s impact is likely dimin-ished by its commonality. The tf.idf weighting scheme we employ in subsequentregressions attempts to address this phenomenon.
In sum, for any nontrivial list of words, we expect a small number of the wordsto dominate the overall count. For the H4N-Inf word list, the majority of high-frequency words happen to also be words that would typically be consideredmisclassified in the context of financial documents, introducing substantialnoise in measures based on the Harvard list. Further examination of wordrankings within industries and for individual firms indicates that some of thismisclassification error, beyond simply adding noise to the measure, is likely tointroduce spurious correlations.
C. 10-K Filing Period Returns and Negative Word Lists
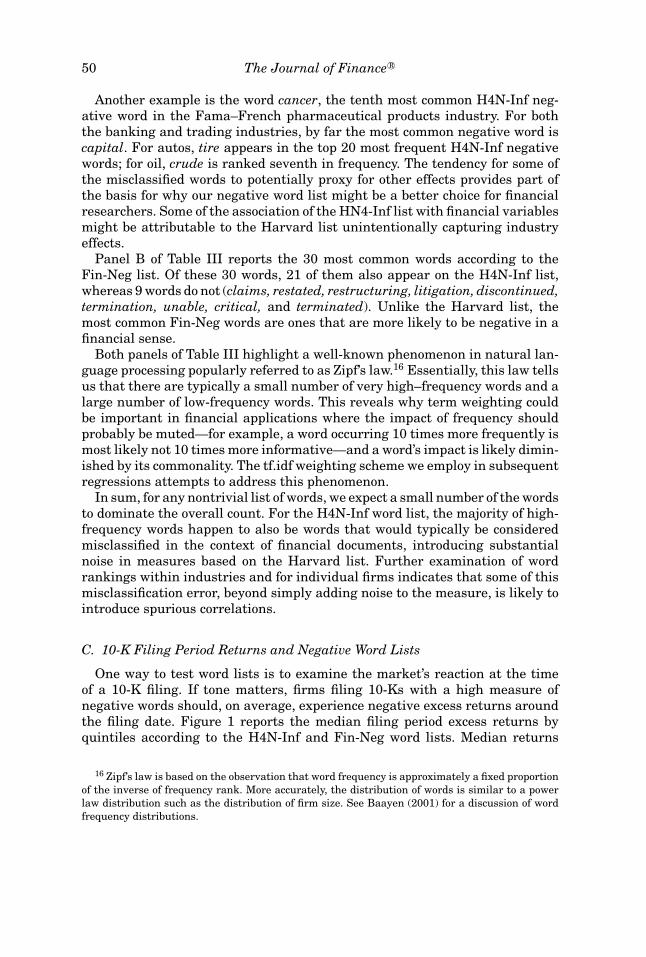
One way to test word lists is to examine the market’s reaction at the timeof a 10-K filing. If tone matters, firms filing 10-Ks with a high measure ofnegative words should, on average, experience negative excess returns aroundthe filing date. Figure 1 reports the median filing period excess returns byquintiles according to the H4N-Inf and Fin-Neg word lists. Median returns
16 Zipf’s law is based on the observation that word frequency is approximately a fixed proportionof the inverse of frequency rank. More accurately, the distribution of words is similar to a powerlaw distribution such as the distribution of firm size. See Baayen (2001) for a discussion of wordfrequency distributions.
When Is a Liability Not a Liability? 51
Figure 1. Median filing period excess return by quintile for the Harvard-IV-4 Psychoso-ciological Dictionary TagNeg word list with inflections (H4N-Inf) and the Financial-Negative (Fin-Neg) word list. For each of the word lists, the sample of 50,115 10-Ks is dividedinto five portfolios based on the proportion of negative words. The filing period return is the holdingperiod excess return for the 10-K file date through the subsequent 3 days, where the excess re-turn is a firm’s common stock buy-and-hold return minus the CRSP value-weighted market indexbuy-and-hold return.
for the H4N-Inf list do not reflect a consistent relation with the proportionof negative words. Firms with a high proportion of Harvard negative wordshave only a slightly lower filing period return in comparison with firms havingrelatively few negative words on those lists.
The pattern produced by the Fin-Neg list is what we would expect if theword lists capture useful information. Firms including a lower percentage ofpessimistic words have slightly negative returns on the 4 days around the 10-K filing date compared to sharply negative median returns for the quintilesincluding a high percentage of negative words. The return pattern for Fin-Negacross the quintiles is monotonic.
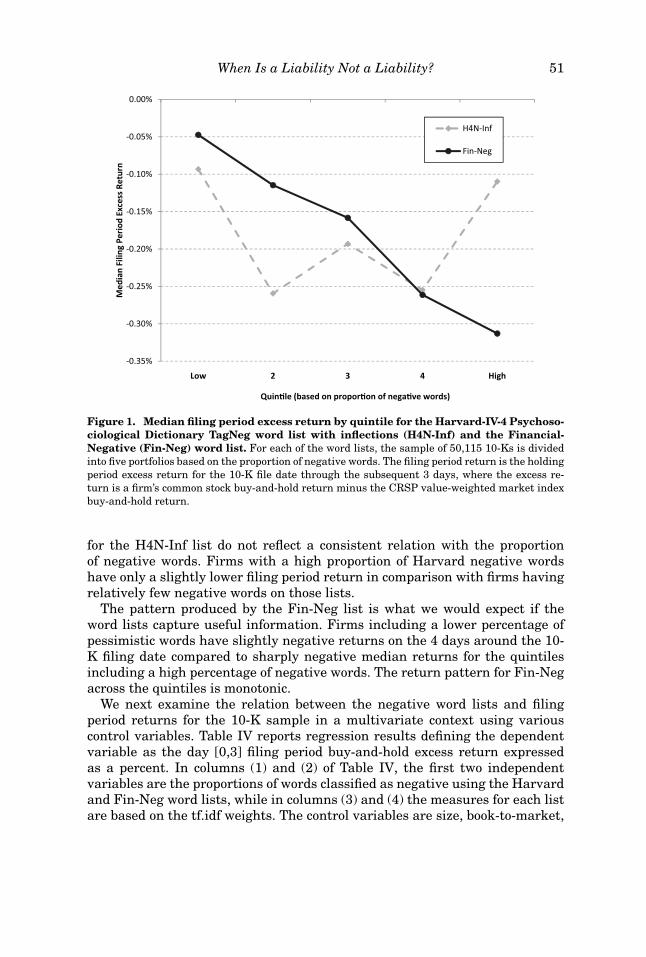
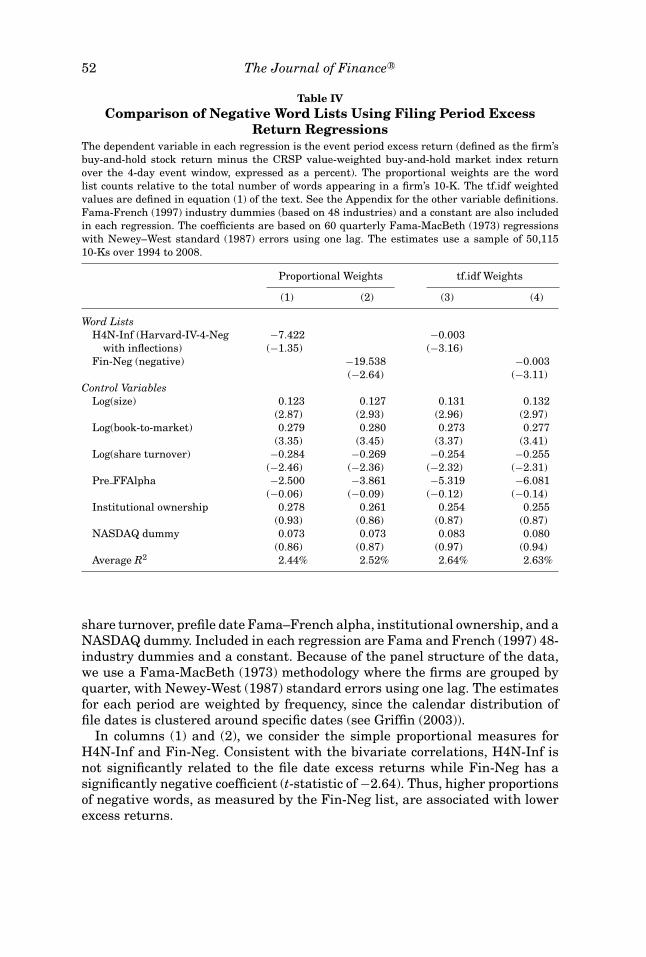
We next examine the relation between the negative word lists and filingperiod returns for the 10-K sample in a multivariate context using variouscontrol variables. Table IV reports regression results defining the dependentvariable as the day [0,3] filing period buy-and-hold excess return expressedas a percent. In columns (1) and (2) of Table IV, the first two independentvariables are the proportions of words classified as negative using the Harvardand Fin-Neg word lists, while in columns (3) and (4) the measures for each listare based on the tf.idf weights. The control variables are size, book-to-market,
52 The Journal of Finance R©
Table IVComparison of Negative Word Lists Using Filing Period Excess
Return RegressionsThe dependent variable in each regression is the event period excess return (defined as the firm’sbuy-and-hold stock return minus the CRSP value-weighted buy-and-hold market index returnover the 4-day event window, expressed as a percent). The proportional weights are the wordlist counts relative to the total number of words appearing in a firm’s 10-K. The tf.idf weightedvalues are defined in equation (1) of the text. See the Appendix for the other variable definitions.Fama-French (1997) industry dummies (based on 48 industries) and a constant are also includedin each regression. The coefficients are based on 60 quarterly Fama-MacBeth (1973) regressionswith Newey–West standard (1987) errors using one lag. The estimates use a sample of 50,11510-Ks over 1994 to 2008.
Proportional Weights tf.idf Weights
(1) (2) (3) (4)
Word ListsH4N-Inf (Harvard-IV-4-Neg −7.422 −0.003
with inflections) (−1.35) (−3.16)Fin-Neg (negative) −19.538 −0.003
(−2.64) (−3.11)Control Variables
Log(size) 0.123 0.127 0.131 0.132(2.87) (2.93) (2.96) (2.97)
Log(book-to-market) 0.279 0.280 0.273 0.277(3.35) (3.45) (3.37) (3.41)
Log(share turnover) −0.284 −0.269 −0.254 −0.255(−2.46) (−2.36) (−2.32) (−2.31)
Pre FFAlpha −2.500 −3.861 −5.319 −6.081(−0.06) (−0.09) (−0.12) (−0.14)
Institutional ownership 0.278 0.261 0.254 0.255(0.93) (0.86) (0.87) (0.87)
NASDAQ dummy 0.073 0.073 0.083 0.080(0.86) (0.87) (0.97) (0.94)
Average R2 2.44% 2.52% 2.64% 2.63%
share turnover, prefile date Fama–French alpha, institutional ownership, and aNASDAQ dummy. Included in each regression are Fama and French (1997) 48-industry dummies and a constant. Because of the panel structure of the data,we use a Fama-MacBeth (1973) methodology where the firms are grouped byquarter, with Newey-West (1987) standard errors using one lag. The estimatesfor each period are weighted by frequency, since the calendar distribution offile dates is clustered around specific dates (see Griffin (2003)).
In columns (1) and (2), we consider the simple proportional measures forH4N-Inf and Fin-Neg. Consistent with the bivariate correlations, H4N-Inf isnot significantly related to the file date excess returns while Fin-Neg has asignificantly negative coefficient (t-statistic of −2.64). Thus, higher proportionsof negative words, as measured by the Fin-Neg list, are associated with lowerexcess returns.
When Is a Liability Not a Liability? 53
We know, however, from Table III that the word counts from these lists aredominated by a relatively small number of words. For the H4N-Inf list, manyof these words are simply adding noise to the measure. In columns (3) and (4)we run the same regressions with the term-weighted measures of H4N-Inf andFin-Neg. In this case, both the word lists are negative in sign, significant, andessentially identical in their impact.
This result captures the essence of subsequent results. That is, as an unad-justed measure Fin-Neg appears superior, which is not surprising since it doesnot contain some of the common words that H4N-Inf misclassifies. The termweighting method, however, mitigates the noise in both measures—especiallyfor the H4N-Inf measure—to an extent that the Fin-Neg list does not dominate.
We should not overstate the regression results. Even for the regressionsusing the weighted measures and all of the control variables, the adjusted R2
is still low (around 2.6% for both regressions). Only a small amount of thevariation in filing period returns is explained by the independent variables.Textual analysis is not the ultimate key to the returns cipher.17
While some studies use the level of word counts as we have, others stan-dardize the measure by looking at changes in proportional occurrence relativeto a historic benchmark (see, for example, Tetlock, Saar-Tsechansky, and Mac-skassy (2008) or Feldman, et al. (2008)). Under some conditions, differencing orsome form of standardization might have the advantage of reducing the impactof words contextually misclassified. Given the results from Table III, it is likelythat much of the variation in differences will be driven by random variationin the frequency of common words. The differencing method also assumes thata reader can remember the frequency of negative words in previous news ar-ticles, columns, or 10-Ks—for example, that today’s column or 10-K has fewernegative words than previous editions, so it may convey a bullish signal.
We report in the Internet Appendix regressions paralleling those in columns(1) and (2) of Table IV, where the proportional measures are normalized dif-ferences. The essential conclusions in terms of signs and significance remainidentical. The results do not suggest, therefore, that differencing mitigates thenoise problem.
In Table V we return to the empirical question of whether the MD&A sectionof the 10-K is a more appropriate measure of tone in a 10-K. For both theH4N-Inf and Fin-Neg lists we consider regressions that analyze word countsfrom only the MD&A section of the 10-K. These regressions have the samecontrol variables as the previous table, yet have a smaller sample size sincefirms must have an identifiable MD&A section with more than 250 words to be
17 To assess the appropriateness of the event window, we consider a simple t-test comparingthe absolute excess return for days [0,5] relative to the file date with the average absolute excessreturn for the 5 days [−5, −1]. The returns remain elevated through day 4, with t-statistics fordays 0 through 5 of 12.8, 16.8, 12.9, 6.9, 3.6, and 1.7. In the regressions of Table IV, only theweighted measures remain significant if we shrink the event window down to days [0,2] and noneof the measures are significant if we use only days [0,1]. In addition to the potential lag betweenthe file date and the release date, the median 10-K contains 20,000 words. The document lengthwould require the average investor some period of time to absorb the information.

54 The Journal of Finance R©
Table VComparison of Negative Word Lists Using Filing Period Excess
Return Regressions: MD&A SectionThe sample is now based on the MD&A section of 10-Ks over 1994 to 2008, where the MD&Asection contains at least 250 words (N = 37,287). The dependent variable in each regression isthe event period excess return (defined as the firm’s buy-and-hold stock return minus the CRSPvalue-weighted buy-and-hold market index return over the 4-day event window, expressed as apercent). The proportional weights are the word list counts relative to the total number of wordsappearing in a firm’s 10-K. The tf.idf weighted values are defined in equation (1) of the text. Seethe Appendix for the other variable definitions. Fama-French (1997) industry dummies (based on48 industries) and a constant are also included in each regression. The coefficients are based on 60quarterly Fama-MacBeth (1973) regressions with Newey-West (1987) standard errors using onelag.
Proportional Weights tf.idf Weights
(1) (2) (3) (4)
Word ListsH4N-Inf (only MD&A) 1.892 −0.005
(0.35) (−1.96)Fin-Neg (only MD&A) −5.344 −0.006
(−0.68) (−1.96)Control Variables
Log(size) 0.157 0.162 0.172 0.172(3.06) (3.10) (3.32) (3.28)
Log(book-to-market) 0.324 0.330 0.334 0.335(3.57) (3.59) (3.64) (3.65)
Log(share turnover) −0.364 −0.362 −0.345 −0.341(−2.84) (−2.82) (−2.79) (−2.76)
Pre FFAlpha −21.977 −22.279 −23.050 −23.168(−0.45) (−0.45) (−0.47) (−0.47)
Institutional ownership 0.271 0.264 0.244 0.245(0.82) (0.79) (0.74) (0.74)
NASDAQ dummy 0.146 0.144 0.141 0.139(1.45) (1.39) (1.40) (1.38)
Average R2 2.45% 2.70% 2.65% 2.76%
included. The results for both word lists using proportional measures are notsignificant and are only marginally significant for the weighted measures. Theresults of this table indicate that the MD&A section does not contain richertonal content.
Also, as previously noted, the sample for which the MD&A section is avail-able varies systematically over time. More firms incorporate the MD&A sectionby reference in the early period, locating the discussion in an exhibit. We donot include these cases in the sample because it becomes difficult to accuratelyparse the MD&A section (typically because the termination point is not iden-tified). The tendency to incorporate by reference is also correlated with firmsize. Thus, the sample changes in a nonrandom way through time. Becausethe empirical results do not indicate that the MD&A section provides more

When Is a Liability Not a Liability? 55
discriminating content and because of the systematic shifts in the sample, weonly consider the full 10-Ks in subsequent tests.
How successful would a trading strategy using the proportional or termweighted negative word counts be? We calculate the Fama and French (1993)four-factor portfolio returns generated by taking a long position in stocks witha low negative word count and a short position in stocks with a high nega-tive count. More precisely, in June of each year starting in 1997, we sort allavailable firms into quintiles based on the prior year’s 10-K Fin-Neg or H4N-Inf word counts.18 Over the next 12 months, the return differences betweenthe long/short portfolios are regressed against the four factors. Although thealphas across the four regressions are positive, none of the values are sta-tistically significant. Hence, after controlling for various factors, the relationbetween 1-year returns and negative word counts is not enough to warrantactive trading by investors.
D. Additional Word Lists, Filing Date Returns, Volume, and PosteventVolatility
We have some evidence that Fin-Neg is related to short-term returns whenthe 10-K is filed. Is there also a relation between Fin-Neg and abnormal tradingvolume or subsequent stock return volatility? In addition, is there a relationbetween the other word lists and these effects around or after the firm’s filingdate?
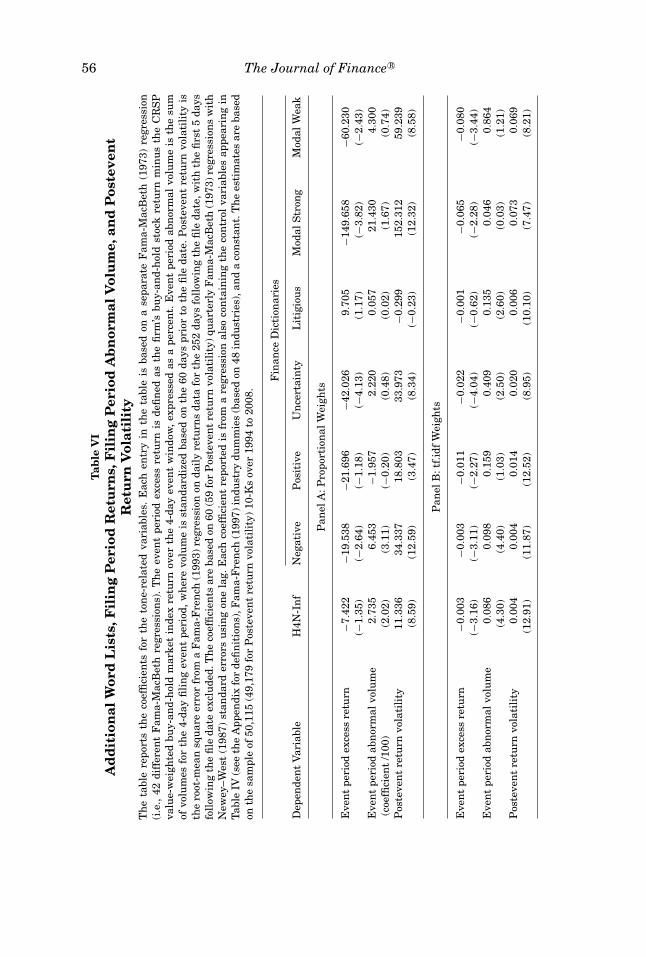
Table VI reports regression results for three different dependent variables:event period excess returns, event period abnormal volume, and posteventreturn volatility. Panel A reports the regression results using proportionalweights while Panel B uses the term weights (tf.idf). Each entry in thetable is based on separate Fama-MacBeth (1973) regressions (42 differentFama–MacBeth regressions in all) with the specified word list along with thecontrol variables and Fama–French industry dummy variables appearing inTable IV. Only the coefficients associated with the word lists are reported inthe table. The word lists are H4N-Inf and our six word lists (negative, positive,uncertainty, litigious, modal strong, and modal weak).
In Table VI, Panel A, which is based on the proportional measure, whenfiling period returns are the dependent variable, the coefficient is negativeand insignificant if H4N-Inf is the only word list included as an independentvariable (besides the control variables). This is the identical regression as incolumn (1) of Table IV. When event period excess returns are the dependentvariable, we find that only the Fin-Neg, uncertainty, modal strong, and modalweak word lists are statistically significant. All these coefficients are negativelysigned. Firms using fewer negative, uncertain, modal strong, and modal weakwords realize a more positive reaction from the market in the filing date eventwindow.
18 We begin in 1997 because this is the first year all firms are required to file digital forms. Theestimated alphas and factor coefficients are reported in the Internet Appendix.
56 The Journal of Finance R©
Tab
leV
IA
dd
itio
nal
Wor
dL
ists
,Fil
ing
Per
iod
Ret
urn
s,F
ilin
gP
erio
dA
bn
orm
alV
olu
me,
and
Pos
teve
nt
Ret
urn
Vol
atil
ity
Th
eta
ble
repo
rts
the
coef
fici
ents
for
the
ton
e-re
late
dva
riab
les.
Eac
hen
try
inth
eta
ble
isba
sed
ona
sepa
rate
Fam
a-M
acB
eth
(197
3)re
gres
sion
(i.e
.,42
diff
eren
tF
ama-
Mac
Bet
hre
gres
sion
s).
Th
eev
ent
peri
odex
cess
retu
rnis
defi
ned
asth
efi
rm’s
buy-
and-
hol
dst
ock
retu
rnm
inu
sth
eC
RS
Pva
lue-
wei
ghte
dbu
y-an
d-h
old
mar
ket
inde
xre
turn
over
the
4-da
yev
ent
win
dow
,ex
pres
sed
asa
perc
ent.
Eve
nt
peri
odab
nor
mal
volu
me
isth
esu
mof
volu
mes
for
the
4-da
yfi
lin
gev
ent
peri
od,w
her
evo
lum
eis
stan
dard
ized
base
don
the
60da
yspr
ior
toth
efi
leda
te.P
oste
ven
tre
turn
vola
tili
tyis
the
root
-mea
nsq
uar
eer
ror
from
aF
ama-
Fre
nch
(199
3)re
gres
sion
onda
ily
retu
rns
data
for
the
252
days
foll
owin
gth
efi
leda
te,w
ith
the
firs
t5
days
foll
owin
gth
efi
leda
teex
clu
ded.
Th
eco
effi
cien
tsar
eba
sed
on60
(59
for
Pos
teve
nt
retu
rnvo
lati
lity
)qu
arte
rly
Fam
a-M
acB
eth
(197
3)re
gres
sion
sw
ith
New
ey–W
est
(198
7)st
anda
rder
rors
usi
ng
one
lag.
Eac
hco
effi
cien
tre
port
edis
from
are
gres
sion
also
con
tain
ing
the
con
trol
vari
able
sap
pear
ing
inT
able
IV(s
eeth
eA
ppen
dix
for
defi
nit
ion
s),F
ama-
Fre
nch
(199
7)in
dust
rydu
mm
ies
(bas
edon
48in
dust
ries
),an
da
con
stan
t.T
he
esti
mat
esar
eba
sed
onth
esa
mpl
eof
50,1
15(4
9,17
9fo
rP
oste
ven
tre
turn
vola
tili
ty)
10-K
sov
er19
94to
2008
.
Fin
ance
Dic
tion
arie
s
Dep
ende
nt
Var
iabl
eH
4N-I
nf
Neg
ativ
eP
osit
ive
Un
cert
ain
tyL
itig
iou
sM
odal
Str
ong
Mod
alW
eak
Pan
elA
:Pro
port
ion
alW
eigh
ts
Eve
nt
peri
odex
cess
retu
rn−7
.422
−19.
538
−21.
696
−42.
026
9.70
5−1
49.6
58−6
0.23
0(−
1.35
)(−
2.64
)(−
1.18
)(−
4.13
)(1
.17)
(−3.
82)
(−2.
43)
Eve
nt
peri
odab
nor
mal
volu
me
2.73
56.
453
−1.9
572.
220
0.05
721
.430
4.30
0(c
oeffi
cien
t/1
00)
(2.0
2)(3
.11)
(−0.
20)
(0.4
8)(0
.02)
(1.6
7)(0
.74)
Pos
teve
nt
retu
rnvo
lati
lity
11.3
3634
.337
18.8
0333
.973
−0.2
9915
2 .31
259
.239
(8.5
9)(1
2.59
)(3
.47)
(8.3
4)(−
0.23
)(1
2.32
)(8
.58)
Pan
elB
:tf.
idf
Wei
ghts
Eve
nt
peri
odex
cess
retu
rn−0
.003
−0.0
03−0
.011
−0.0
22−0
.001
−0.0
65−0
.080
(−3.
16)
(−3.
11)
(−2.
27)
(−4.
04)
(−0.
62)
(−2.
28)
(−3.
44)
Eve
nt
peri
odab
nor
mal
volu
me
0.08
60.
098
0.15
90.
409
0.13
50.
046
0.86
4(4
.30)
(4.4
0)(1
.03)
(2.5
0)(2
.60)
(0.0
3)(1
.21)
Pos
teve
nt
retu
rnvo
lati
lity
0.00
40.
004
0.01
40.
020
0.00
60.
073
0 .06
9(1
2.91
)(1
1.87
)(1
2.52
)(8
.95)
(10.
10)
(7.4
7)(8
.21)
When Is a Liability Not a Liability? 57
In the second row of Panel A, with abnormal trading volume in the 4-dayfiling date period as the dependent variable, only the Harvard and Fin-Negword lists are significant in separate regressions after controlling for othervariables. Since both coefficients have positive signs, the more the negativewords (as measured by the Harvard or Fin-Neg word lists) that appear in the10-K, the higher is the abnormal trading volume during the event window.
The last row of Panel A reports the results when the subsequent returnvolatility is the left-hand-side variable. This variable is calculated outside ofthe 4-day 10-K filing period. In these seven separate Panel A regressions, all ofthe different word lists are highly significant (with the exception of litigious).Since all of the word lists have positive coefficients, a higher proportion ofpositive, negative, or modal words is linked with larger stock return volatilityin the year after the filing. Thus, while event period trading volume is moredifficult to explain, the word lists do a better job at explaining postevent returnvolatility. This volatility-word tone linkage is consistent with the internet stockmessage board evidence presented in Antweiler and Frank (2004).
Panel B reports the separate regression results using the term weightingprocedure (tf.idf). As noted before, this weighting procedure raises the signifi-cance of the word lists by improving the signal-to-noise in the lists. For excessfiling period returns, all of the word lists are significant except for litigious.When event period abnormal trading volume is the dependent variable, all theword lists, except for positive, modal strong, and modal weak, are significant.The last row of Panel B reports that all of the word lists are positively signedand significantly related to subsequent stock return volatility.19
E. 10-b5 Filings and Material Weakness in Internal Controls
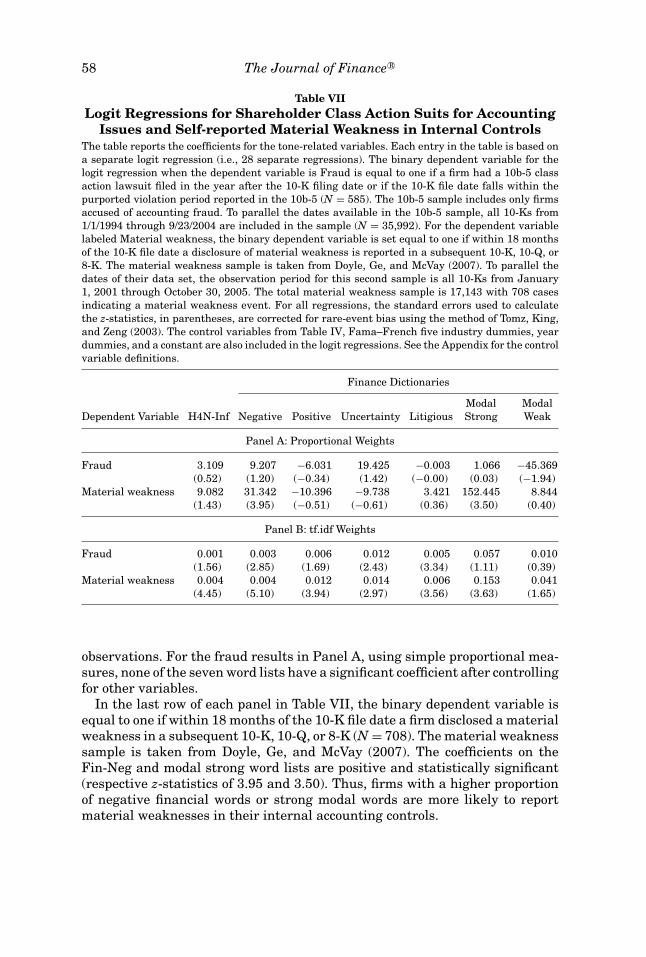
We next examine two different firm samples to see whether the various wordlists capture language usage differences. Do companies accused of accountingimproprieties or firms that self-report material weaknesses in internal controlsuse different language from other firms in their 10-Ks? Table VII reports thelogit regression results; Panel A reports the results using proportional weightswhile Panel B uses the term weighting procedure (tf.idf). Each entry in thetable is based on a separate logit regression, for 28 different regressions inall. The independent variables are the control variables from Table IV and aseparate word list in each regression.
In the first row of each panel, the binary dependent variable is a dummyvariable equal to one if a 10b-5 suit was filed against the firm alleging ac-counting improprieties in the year after the 10-K filing date or if the 10-K wasfiled during the alleged violation period. Between January 1, 1994 and Septem-ber 23, 2004, there were 585 firms in a potential universe of 35,992 firm-year
19 We do not include all of our word lists in one regression due to their high degree of collinear-ity. An alternative is to create an omnibus measure where the proportions are aggregated (withappropriate signs). We conducted the same regressions with an omnibus measure, but in no casedid it dominate simply using the Fin-Neg measure.
58 The Journal of Finance R©
Table VIILogit Regressions for Shareholder Class Action Suits for Accounting
Issues and Self-reported Material Weakness in Internal ControlsThe table reports the coefficients for the tone-related variables. Each entry in the table is based ona separate logit regression (i.e., 28 separate regressions). The binary dependent variable for thelogit regression when the dependent variable is Fraud is equal to one if a firm had a 10b-5 classaction lawsuit filed in the year after the 10-K filing date or if the 10-K file date falls within thepurported violation period reported in the 10b-5 (N = 585). The 10b-5 sample includes only firmsaccused of accounting fraud. To parallel the dates available in the 10b-5 sample, all 10-Ks from1/1/1994 through 9/23/2004 are included in the sample (N = 35,992). For the dependent variablelabeled Material weakness, the binary dependent variable is set equal to one if within 18 monthsof the 10-K file date a disclosure of material weakness is reported in a subsequent 10-K, 10-Q, or8-K. The material weakness sample is taken from Doyle, Ge, and McVay (2007). To parallel thedates of their data set, the observation period for this second sample is all 10-Ks from January1, 2001 through October 30, 2005. The total material weakness sample is 17,143 with 708 casesindicating a material weakness event. For all regressions, the standard errors used to calculatethe z-statistics, in parentheses, are corrected for rare-event bias using the method of Tomz, King,and Zeng (2003). The control variables from Table IV, Fama–French five industry dummies, yeardummies, and a constant are also included in the logit regressions. See the Appendix for the controlvariable definitions.
Finance Dictionaries
Modal ModalDependent Variable H4N-Inf Negative Positive Uncertainty Litigious Strong Weak
Panel A: Proportional Weights
Fraud 3.109 9.207 −6.031 19.425 −0.003 1.066 −45.369(0.52) (1.20) (−0.34) (1.42) (−0.00) (0.03) (−1.94)
Material weakness 9.082 31.342 −10.396 −9.738 3.421 152.445 8.844(1.43) (3.95) (−0.51) (−0.61) (0.36) (3.50) (0.40)
Panel B: tf.idf Weights
Fraud 0.001 0.003 0.006 0.012 0.005 0.057 0.010(1.56) (2.85) (1.69) (2.43) (3.34) (1.11) (0.39)
Material weakness 0.004 0.004 0.012 0.014 0.006 0.153 0.041(4.45) (5.10) (3.94) (2.97) (3.56) (3.63) (1.65)
observations. For the fraud results in Panel A, using simple proportional mea-sures, none of the seven word lists have a significant coefficient after controllingfor other variables.
In the last row of each panel in Table VII, the binary dependent variable isequal to one if within 18 months of the 10-K file date a firm disclosed a materialweakness in a subsequent 10-K, 10-Q, or 8-K (N = 708). The material weaknesssample is taken from Doyle, Ge, and McVay (2007). The coefficients on theFin-Neg and modal strong word lists are positive and statistically significant(respective z-statistics of 3.95 and 3.50). Thus, firms with a higher proportionof negative financial words or strong modal words are more likely to reportmaterial weaknesses in their internal accounting controls.
When Is a Liability Not a Liability? 59
As noted before, the term weighting procedure (tf.idf) improves the explana-tory power of the various word lists. For the fraud regressions, Panel B re-ports that the Fin-Neg, uncertainty, and litigious word lists are all significantlylinked to the 10b-5 fraud lawsuits. For the material weakness category in thesecond row in Panel B, all of the separate word lists (excluding modal weak)have a positive coefficient and are significant. Thus, firms using stronger lan-guage (i.e., more positive, more negative, more modal strong words) are morelikely to disclose a material weakness in internal controls.
For both the 10b-5 and material weakness regressions, it is not clear whatwe should expect about the word list coefficients. That is, we might expecta higher proportion of negative words for firms acknowledging underlyingproblems, or we could expect a lower proportion if managers were trying todisguise underlying problems. Our logit regressions suggest, nevertheless,that word lists can play a role in identifying firms experiencing unusualevents.
F. Negative Word Lists and Standardized Unexpected Earnings (SUE)
Tetlock, Saar-Tsechansky, and Macskassy (2008) find that the proportionof negative words in a news article can be used to predict quarterly earn-ings. They find that the more negative words that are used in a firm-specificnews story, the lower are the firm’s subsequent standardized unexpectedearnings.
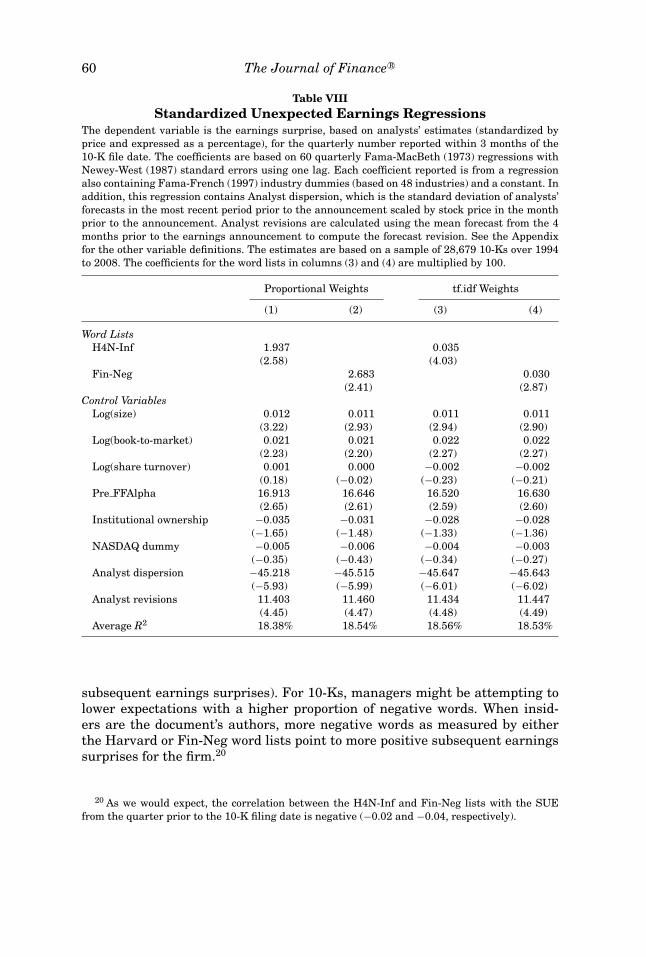
Table VIII provides the relation between standardized unexpected earn-ings and the negative word lists. In the four regressions, the dependentvariable is the earnings surprise based on analyst estimates, standardizedby price, for quarterly information reported within 3 months after the 10-Kfiling. As before, the reported coefficients are based on 60 quarterly Fama-MacBeth (1973) regressions with Newey-West (1987) standard errors usingone lag. The first two columns use proportional weights for the negativeword lists while the last two columns use tf.idf weighting. In the regressions,we also add analyst dispersion and analyst revisions as additional controlvariables.
A number of the control variables are statistically significant. As in Tetlock,Saar-Tsechansky, and Macskassy (2008), the prior period Fama–French alpha,analyst dispersion, and analyst revisions have the expected coefficient sign andsignificance levels. That is, the higher the prior performance, the higher theanalyst revisions, and the lower the analyst dispersion, the larger is the firm’ssubsequent earnings surprise.
In all four columns of Table VIII, the coefficients on both the Harvard andFin-Neg word lists are positive and statistically significant. This is the op-posite of what Tetlock, Saar-Tsechansky, and Macskassy (2008) find for newsstories in the days prior to the quarterly earnings announcement. Clearly, firm-specific news articles before quarterly earnings announcements appear to bean accurate reflection of the direction of subsequent earnings surprises. Morenegative words used by independent journalists indicate pessimism (i.e., lower
60 The Journal of Finance R©
Table VIIIStandardized Unexpected Earnings Regressions
The dependent variable is the earnings surprise, based on analysts’ estimates (standardized byprice and expressed as a percentage), for the quarterly number reported within 3 months of the10-K file date. The coefficients are based on 60 quarterly Fama-MacBeth (1973) regressions withNewey-West (1987) standard errors using one lag. Each coefficient reported is from a regressionalso containing Fama-French (1997) industry dummies (based on 48 industries) and a constant. Inaddition, this regression contains Analyst dispersion, which is the standard deviation of analysts’forecasts in the most recent period prior to the announcement scaled by stock price in the monthprior to the announcement. Analyst revisions are calculated using the mean forecast from the 4months prior to the earnings announcement to compute the forecast revision. See the Appendixfor the other variable definitions. The estimates are based on a sample of 28,679 10-Ks over 1994to 2008. The coefficients for the word lists in columns (3) and (4) are multiplied by 100.
Proportional Weights tf.idf Weights
(1) (2) (3) (4)
Word ListsH4N-Inf 1.937 0.035
(2.58) (4.03)Fin-Neg 2.683 0.030
(2.41) (2.87)Control Variables
Log(size) 0.012 0.011 0.011 0.011(3.22) (2.93) (2.94) (2.90)
Log(book-to-market) 0.021 0.021 0.022 0.022(2.23) (2.20) (2.27) (2.27)
Log(share turnover) 0.001 0.000 −0.002 −0.002(0.18) (−0.02) (−0.23) (−0.21)
Pre FFAlpha 16.913 16.646 16.520 16.630(2.65) (2.61) (2.59) (2.60)
Institutional ownership −0.035 −0.031 −0.028 −0.028(−1.65) (−1.48) (−1.33) (−1.36)
NASDAQ dummy −0.005 −0.006 −0.004 −0.003(−0.35) (−0.43) (−0.34) (−0.27)
Analyst dispersion −45.218 −45.515 −45.647 −45.643(−5.93) (−5.99) (−6.01) (−6.02)
Analyst revisions 11.403 11.460 11.434 11.447(4.45) (4.47) (4.48) (4.49)
Average R2 18.38% 18.54% 18.56% 18.53%
subsequent earnings surprises). For 10-Ks, managers might be attempting tolower expectations with a higher proportion of negative words. When insid-ers are the document’s authors, more negative words as measured by eitherthe Harvard or Fin-Neg word lists point to more positive subsequent earningssurprises for the firm.20
20 As we would expect, the correlation between the H4N-Inf and Fin-Neg lists with the SUEfrom the quarter prior to the 10-K filing date is negative (−0.02 and −0.04, respectively).
When Is a Liability Not a Liability? 61
G. Negative Words in Alternative Contexts—Some Preliminary Evidence
Our study focuses on the comparative power of word lists in assessing docu-ment tone using the specific context of 10-K filings. Although developing com-plete empirical models for other media and other events is beyond the scope ofthis paper, we do offer preliminary correlation evidence of the relative perfor-mance of the Harvard and Fin-Neg dictionaries in two other applications.
First, we consider another context based on SEC filings, but a context muchdifferent from the 10-Ks. Specifically, we use a sample of seasoned equity offer-ings (SEOs) obtained from Thomson Financial and compare the negative tonemeasures with the discount of the offering price relative to the market price.We are able to match Form 424 filings for 3,623 firms over the May 1996 toJune 2007 period. The Form 424 is typically filed within 1 or 2 days of theoffering and consists of the prospectus, issuance expense, indemnification ofdirectors and officers, and other material contracts. The average discount inthe SEO sample is 4.0%.
The simple correlation between the SEO discount and the Harvard dictionaryis 0.042. For the Fin-Neg dictionary the correlation is 0.064. If we modify thetone measures using term weighting, the correlations for the Harvard andFin-Neg list drop to 0.026 and 0.029, respectively. As with the 10-K sample,Fin-Neg appears superior when using simple proportional measures, while theterm-weighted measures are more similar in impact.
Second, the reviewer of this paper calculated the negative tone measures forall news stories relating to U.S. firms in the Dow Jones archive from 1979 to2007, and correlated the tone measures with each firm’s stock returns on theday of and days following the news release.21 The correlation between H4N-Inf and day 0 returns was −0.039. For the Fin-Neg list, the day 0 correlationwas −0.044. The correlations for both lists drop to a range between −0.008and −0.009 for the day 1 and days [2,10] periods, with Fin-Neg being slightlymore negative. The day 0 results again suggest that Fin-Neg is potentially animproved measure, although the advantage is not substantial.
V. Conclusions
We find that almost three-fourths of negative word counts in 10-K filingsbased on the Harvard dictionary are typically not negative in a financial con-text. Common words like depreciation, liability, foreign, and board are not tonalwhen occurring in a 10-K.
Our paper proposes two solutions to this measurement problem. First, byexamining all words that occur in at least 5% of the SEC’s 10-K universe,we create a list of words that we believe typically have a negative meaningin financial reports. In tests on the 10-K filing date, our negative word listis significantly related to announcement returns. Second, we create a term
21 The reviewer used a prior version of the Fin-Neg word list that is very similar to the currentversion.
62 The Journal of Finance R©
weighting scheme that attenuates the impact of high frequency words and al-lows less frequently used words to have greater impact. We find that such ascheme can lower the noise introduced by word misclassifications. In particu-lar, with term weighting, both the Harvard and our negative word lists haveimproved explanatory power and the impact of misclassification appears to bemitigated.
However, while many of the misclassified words simply add noise to the tonalmeasure, some of the misclassified Harvard words, such as cancer, capital,or mine, are strongly linked to the language of specific industry segments.Thus, some of the power of the Harvard lists in relating tone to other financialvariables might be attributable to misclassifications that unintentionally proxyfor other variables. This tendency for some of the misclassified words to proxyfor industry effects provides additional support for the use of our word list infinancial research.
In additional analysis, we also create five other word classifications (positive,uncertainty, litigious, strong modal, and weak modal words). The paper findsevidence that some word lists are related to market reactions around the 10-Kfiling date, trading volume, unexpected earnings, and subsequent stock returnvolatility. Some of our word lists are also linked to firms accused of accountingfraud and to firms reporting material weaknesses in their accounting controls.
Given our results, we recommend the use of term weighting when creatingword counts. Even though the apparent power (with term weighting) of the twonegative word lists is similar, we suggest the use of our list to avoid those wordsin the H4N list that might proxy for industry or other unintended effects. Theother word lists that we created should be used primarily to address specifictopics of interest, especially since in some categories many of the words overlapwith the negative word lists.
Our results do not suggest that textual analysis will resolve, to paraphraseRoll (1988), our profession’s modest ability to explain stock returns. Addition-ally, the existing literature on financial text does not actually determine thecausal link between tone and returns. Tone could simply proxy for other con-temporaneous information—such as the accounting numbers revealed in the10-K—that drives returns. Our results and others’, however, suggest thattextual analysis can contribute to our ability to understand the impact ofinformation on stock returns, and even if tone does not directly cause re-turns it might be an efficient way for analysts to capture other sources ofinformation.
Most important, we show that financial researchers should be cautiouswhen relying on word classification schemes derived outside the domainof business usage. Applying nonbusiness word lists to accounting and fi-nance topics can lead to a high misclassification rate and spurious corre-lations. All textual analysis ultimately stands or falls by the categorizationprocedures.
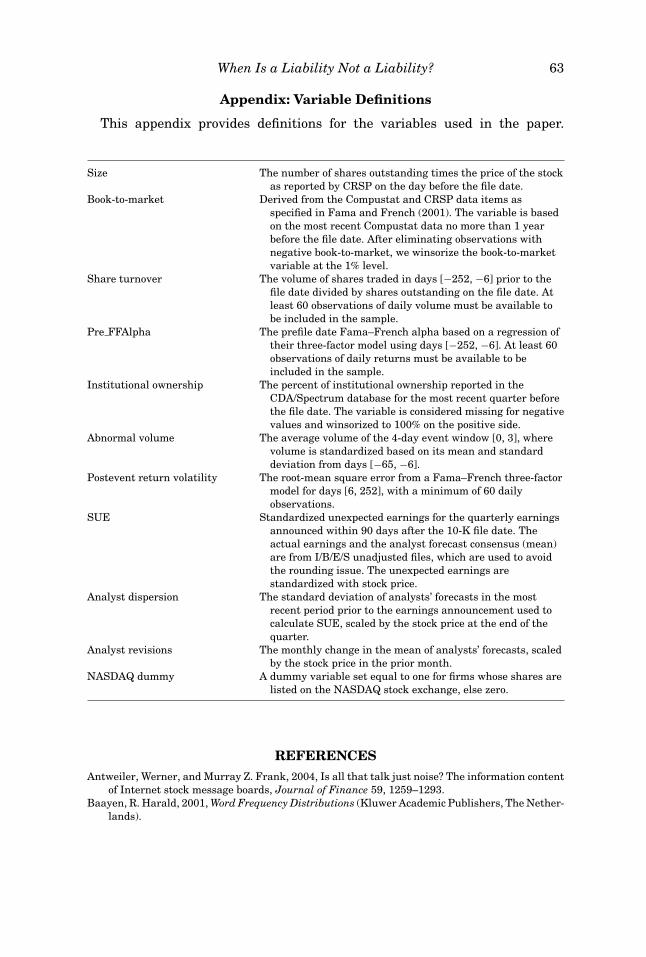
When Is a Liability Not a Liability? 63
Appendix: Variable Definitions
This appendix provides definitions for the variables used in the paper.
Size The number of shares outstanding times the price of the stockas reported by CRSP on the day before the file date.
Book-to-market Derived from the Compustat and CRSP data items asspecified in Fama and French (2001). The variable is basedon the most recent Compustat data no more than 1 yearbefore the file date. After eliminating observations withnegative book-to-market, we winsorize the book-to-marketvariable at the 1% level.
Share turnover The volume of shares traded in days [−252, −6] prior to thefile date divided by shares outstanding on the file date. Atleast 60 observations of daily volume must be available tobe included in the sample.
Pre FFAlpha The prefile date Fama–French alpha based on a regression oftheir three-factor model using days [−252, −6]. At least 60observations of daily returns must be available to beincluded in the sample.
Institutional ownership The percent of institutional ownership reported in theCDA/Spectrum database for the most recent quarter beforethe file date. The variable is considered missing for negativevalues and winsorized to 100% on the positive side.
Abnormal volume The average volume of the 4-day event window [0, 3], wherevolume is standardized based on its mean and standarddeviation from days [−65, −6].
Postevent return volatility The root-mean square error from a Fama–French three-factormodel for days [6, 252], with a minimum of 60 dailyobservations.
SUE Standardized unexpected earnings for the quarterly earningsannounced within 90 days after the 10-K file date. Theactual earnings and the analyst forecast consensus (mean)are from I/B/E/S unadjusted files, which are used to avoidthe rounding issue. The unexpected earnings arestandardized with stock price.
Analyst dispersion The standard deviation of analysts’ forecasts in the mostrecent period prior to the earnings announcement used tocalculate SUE, scaled by the stock price at the end of thequarter.
Analyst revisions The monthly change in the mean of analysts’ forecasts, scaledby the stock price in the prior month.
NASDAQ dummy A dummy variable set equal to one for firms whose shares arelisted on the NASDAQ stock exchange, else zero.
REFERENCESAntweiler, Werner, and Murray Z. Frank, 2004, Is all that talk just noise? The information content
of Internet stock message boards, Journal of Finance 59, 1259–1293.Baayen, R. Harald, 2001, Word Frequency Distributions (Kluwer Academic Publishers, The Nether-
lands).

64 The Journal of Finance R©
Berelson, Bernard R., 1952, Content Analysis in Communication Research (The Free Press, Glen-coe, IL).
Chisholm, Erica, and Tamara G. Kolda, 1999, New term weighting formulas for the vector spacemethod in information retrieval, Technical Report Number ORNL-TM-13756, Oak Ridge Na-tional Laboratory, Oak Ridge, TN.
Coval, Joshua D., and Tyler Shumway, 2001, Is sound just noise? Journal of Finance 56, 1887–1910.Das, Sanjiv, and Mike Chen, 2001, Yahoo! for Amazon: Opinion extraction from small talk on the
web, Working paper, Santa Clara University.Demers, Elizabeth, and Clara Vega, 2008, Soft information in earnings announcements: News or
noise? Working paper, INSEAD.Dovring, Karin, 1954, Quantitative semantics in 18th century Sweden, Public Opinion Quarterly
18, 389–394.Doyle, Jeffrey, Weili Ge, and Sarah McVay, 2007, Accruals quality and internal control over finan-
cial reporting, The Accounting Review 82, 1141–1170.Engelberg, Joseph, 2008, Costly information processing: Evidence from earnings announcements,
Working paper, Northwestern University.Fama, Eugene F., and Kenneth R. French, 1993, Common risk factors in the returns of stocks and
bonds, Journal of Financial Economics 33, 3–56.Fama, Eugene F., and Kenneth R. French, 1997, Industry costs of equity, Journal of Financial
Economics 43, 153–193.Fama, Eugene F., and Kenneth R. French, 2001, Disappearing dividends: Changing firm charac-
teristics or lower propensity to pay? Journal of Financial Economics 60, 3–43.Fama, Eugene F., and James MacBeth, 1973, Risk, return, and equilibrium: Empirical tests,
Journal of Political Economy 81, 607–636.Feldman, Ronen, Suresh Govindaraj, Joshua Livnat, and Benjamin Segal, 2008, The incremental
information content of tone change in management discussion and analysis, Working paper,INSEAD.
Griffin, Paul, 2003, Got information? Investor response to Form 10-K and Form 10-Q EDGARfilings, Review of Accounting Studies 8, 433–460.
Hanley, Kathleen Weiss, and Gerard Hoberg, 2010, The information content of IPO prospectuses,Review of Financial Studies 23, 2821–2864.
Henry, Elaine, 2008, Are investors influenced by the way earnings press releases are written? TheJournal of Business Communication 45, 363–407.
Jordan, R.R., 1999, Academic Writing Course (Longman, London).Jurafsky, Daniel, and James H. Martin, 2009, Speech and Language Processing (Prentice Hall,
Upper Saddle River, NJ).Kothari, S.P., Xu Li, and James Short, 2008, The effect of disclosures by management, analysts,
and financial press on cost of capital, return volatility, and analyst forecasts: A study usingcontent analysis, Working paper, MIT.
Li, Feng, 2008, Annual report readability, current earnings, and earnings persistence, Journal ofAccounting and Economics 45, 221–247.
Li, Feng, 2009, The determinants and information content of the forward-looking statements incorporate filings—a Naıve Bayesian machine learning approach, Working paper, Universityof Michigan.
Manning, Christopher D., and Hinrich Schutze, 2003, Foundations of Statistical Natural LanguageProcessing (MIT Press, Cambridge, MA).
Mayew, William J., and Mohan Venkatachalam, 2009, The power of voice: Managerial affectivestates and future firm performance, Working paper, Duke University.
Newey, Whitney K., and Kenneth D. West, 1987, A simple, positive semi-definite, heteroskedastic-ity and autocorrelation consistent covariance matrix, Econometrica 55, 703–708.
Public Company Accounting Oversight Board (PCAOB), 2004, An audit of internal control overfinancial reporting performed in conjunction with an audit of financial statements. AuditingStandard No. 2, (Washington, DC.)
Roll, Richard, 1988, R2, Journal of Finance 43, 541–566.Singhal, Amit, 2009, Modern information retrieval: A brief overview, Working paper, Google, Inc.
When Is a Liability Not a Liability? 65
Stone, Philip J., Dexter C. Dunphy, Marshall S. Smith, and Daniel M. Ogilvie, 1966, The GeneralInquirer: A Computer Approach to Content Analysis (MIT Press, Cambridge, MA).
Tetlock, Paul C., 2007, Giving content to investor sentiment: The role of media in the stock market,Journal of Finance 62, 1139–1168.
Tetlock, Paul C., M. Saar-Tsechansky, and S. Macskassy, 2008, More than words: Quantifyinglanguage to measure firms’ fundamentals, Journal of Finance 63, 1437–1467.
Tomz, Michael, Gary King, and Langche Zeng, 2003, ReLogit: Rare events logistic regression,Journal of Statistical Software 8, 1–27.