Embed Size (px)
Citation preview
Biochemical Systematics and Ecology 34 (2006) 406e416www.elsevier.com/locate/biochemsyseco
When, during ontogeny, waxes in the blowfly (Calliphoridae)cuticle can act as phylogenetic markers
Olivier Roux, Charles Gers, Luc Legal*
Laboratoire Dynamique de la Biodiversite, Batiment IVR3 UMR 5172, CNRS-Universite Paul Sabatier,
118 Route de Narbonne, F-31062 Toulouse cedex 4, France
Received 11 May 2005; accepted 29 October 2005
Abstract
Cuticular compounds of three species of blowfly, Calliphora vomitoria (Linnaeus), Calliphora vicina (Robineau-Desvoidy) andProtophormia terraenovae (Robineau-Desvoidy), were analysed during ontogeny (eggs to 8-day-old adults) by gas chromatogra-phy. Discrimination among species is mainly due to quantitative rather than qualitative variations. Two different analyticalapproaches were used to judge if the cuticular hydrocarbons might be of interest as phylogenetic markers. Both methods, classicaldiscriminant analysis and an original distance calculation method, led us to assume that the best phylogenetic congruence betweencuticular compound profiles and both morphological and molecular phylogenies were found for young adult females.� 2006 Elsevier Ltd. All rights reserved.
Keywords: Diptera; Calliphoridae; Calliphora vomitoria; Calliphora vicina; Protophormia terraenovae; Cuticular compounds; Gas chromatogra-
phy; Ontogeny; Phylogeny
1. Introduction
Analysis of cuticular compounds of Diptera, by gas chromatography, was initiated in Drosophila 20 years ago(Jallon, 1984). These mixtures of compounds, which are mainly hydrocarbons, are chemically diverse and occur indifferent proportions (Howard and Blomquist, 1982; Lockey, 1980, 1988). This is explained in part by the variousfunctions of cuticular compounds. First of all, they protect insects from dehydration as they constitute a hydrophobiclayer which furthermore protects them from external attack, e.g., bacterial, insecticide, fungi (Blomquist et al., 1987;Lockey, 1988). They also play the roles of sex attractant and aphrodisiac, alarm pheromones, defence secretions, casterecognition clues and kairomones (Howard and Blomquist, 1982, 2005). Moreover, some adaptative pressures wereshown to modulate their composition depending on abiotic conditions (Brown et al., 2000) or reproductive strategiesin social insects such as ants and cockroaches (Dietemann et al., 2003).
The main variability of these compounds is not based on their presence/absence but much more on their relativequantities (Carlson and Service, 1979, 1980; Dore et al., 1986). The different proportions can be considered as
* Corresponding author. Tel.: þ33 5 61 55 61 36; fax: þ33 5 61 55 61 96.
E-mail address: [email protected] (L. Legal).
0305-1978/$ - see front matter � 2006 Elsevier Ltd. All rights reserved.
doi:10.1016/j.bse.2005.10.013
407O. Roux et al. / Biochemical Systematics and Ecology 34 (2006) 406e416
phenotypic characters (Page et al., 1997). Cuticular compound analysis has been used as an additional taxonomic toolto characterize various Dipteran disease vectors (Phillips et al., 1988) like Anopheles (Anyanwu et al., 2000; Carlsonand Service, 1979, 1980; Carlson et al., 1979; Milligan et al., 1986), Simulium (Carlson and Walsh, 1981; Mafuyaiet al., 1994), sandfly (Mahamat and Hassanali, 1998) and Glossina sp. (Nelson et al., 1988).
Moreover, some intra-specific variability has been found in some species that can be exploited during bio-geographical and ontogenetic studies (Brown et al., 1998; Chen et al., 1990; Hooper et al., 1996; Jallon and David,1987). However, few studies (Espelie and Payne, 1991; Goodrich, 1970; Hebanowska et al., 1990; Howard et al.,1995) performed on insects have taken account of every stage (from egg to adult).
Use of cuticular compounds in a phylogenetic approach has to take into account the fact that during ontogeny, thecomposition of these compounds may vary quantitatively and also qualitatively. The question that arises is, therefore,at which stage(s) is it relevant to consider cuticular compounds as phylogenetic markers? Moreover, can cuticularcompounds actually be used as phylogenetic markers?
Among the first wave of necrophagous insects, three species e Calliphora vomitoria (Linnaeus), Calliphora vicina(Robineau-Desvoidy) and Protophormia terraenovae (Robineau-Desvoidy) e are the most frequently found. Thesespecies possess a ubiquitous geographical distribution. Only hydrocarbons from C. vomitoria have already been stud-ied during ontogeny (Trabalon et al., 1988, 1992).
Stevens and Wall (2001) studied phylogenetic relations among Calliphoridae, including our model species. A com-parison of the variations in the pool of cuticular compounds during ontogeny and molecular phylogeny is proposed inthe present work.
The goal of this work is not to perform a complete phylogeny of Calliphoridae but to check if, for a few species atvarious ontogenic stages, it is possible to assume that hydrocarbons provide a phylogenetic signal despite obviousenvironmental variations.
2. Materials and methods
2.1. Rearing conditions and experimental groups
Flies of the three species were reared in standard environmental conditions, i.e., at 24� 1 �C under 75% relativehumidity. They were fed with sugar, water and minced beef flesh (15% fat content) ad libitum. Minced beef was usedas oviposition medium. Maggots were fed on minced beef placed on wet peat. For each stage, five specimens wereindividually analysed by gas chromatography in order to follow the ontogeny.
For eggs: one group per species. For larvae and prepupae: 10 groups for the two Calliphora sp., six groups forP. terraenovae. The number of groups corresponded to the number of days necessary for development. For pupae:10 groups for the two Calliphora sp., six groups for P. terraenovae. For adults, two sets of groups were made up aftersexing: for the three species the first eight groups corresponding to the ages of 1, 2, 3, 4, 5, 6, 9, 12 h (�15 min) andeight other groups from 1 to 8 days (�1 h) (one group per day). So, a total of 80 males and 80 females were individ-ually analysed for each species. Individuals were killed and conserved by freezing at �25 �C.
In order to make sure that only quantitative variations occurred between reared and wild individuals and thereforethat cuticular lipids can be used for phylogenetic analyses, one male and one female of C. vicina were captured inSeptember 2005 in Toulouse (south-western France) and the cuticular profiles were compared to those of correspond-ing reared individuals.
2.2. Analysis of cuticular compounds
Each sample was placed on a silica gel column (2 cm, 70e230 mesh, 60 A) to obtain only hydrocarbon compoundsand washed with 1 ml of hexane. The samples were dried and re-dissolved in 25 mL of hexane.
Special adaptation of the extraction mode was necessary for eggs and pupae. For eggs, because of their small size,the injection sample of 5 mL was obtained without washing on a silica gel column. For pupae, Goodrich (1970)showed that there were no hydrocarbons on Lucilia cuprina pupae and after several analyses, it appeared that the resultwas the same for C. vomitoria, C. vicina and P. terraenovae. Beament (1945) described a lipid layer on the inner-sideof the puparium. So, the extraction of hydrocarbons was conducted on the nymph’s membrane after the pupae hadbeen opened at the cephalic extremity.
408 O. Roux et al. / Biochemical Systematics and Ecology 34 (2006) 406e416
Analyses were performed on a gas chromatograph HP 5890 series II with a split/splitless injector at 280 �C, anapolar HT5 capillary column (25 m� 0.22 mm ID, 0.1 mm film thickness), and a flame ionization detector at320 �C. The GC was coupled to a computer and data were processed with HP millennium software.
Five microliters were injected into the column and elution was carried out with helium at 1 ml/min. The oven temper-ature was programmed from 60 �C to 200 �C at 10 �C/min, from 200 �C to 320 �C at 3 �C/min and 320 �C for 6 min.
2.3. Hydrocarbon identification
Alkanes were adjusted using standard solutions (from C8 to C40, AccuStandard Inc.). For all other peaks, the fin-gerprint method was used (superposition of chromatograms). Integration was carried out using a combination of visualpattern recognition and retention time data. Normally, the retention time alone can be used to identify the same peak indifferent runs. However, the complexity of our samples and the proximity of each peak necessitated manual peak num-bering to ensure that the same peak in consecutive runs had the same retention time (Mafuyai et al., 1994). Note that inthe present work, importance was given to recognizing homologous peaks but not to their chemical identification.Only unambiguous linear hydrocarbons are mentioned.
2.4. Statistical analyses
For each stage, discriminant analysis was carried out to separate the three species (Systat 8.0). A Jack-knifed es-timation of the proportion of correct classifications was performed; each individual was classified using discriminantfunctions which were formed using all the data except the data for that individual. The proportion of correct classi-fications thus provided an unbiased and a relatively efficient measure of the reliability of the technique (Kendall et al.,1983).
2.5. Phylogenetic analyses
All analyses were performed on a Pentium III 500 MHz PC computer using software version 4.0b10 of PAUP*,written by Swofford (2001). All heuristic searches for optimal trees were carried out by TBR (Tree-bisection-reconnection) branch swapping. Negative branch lengths were allowed, but set to zero for tree-score calculation.Steepest descent options were not in effect.
Distance (minimum evolution) measurement used mean character difference. Starting tree(s) were obtained vianeighbour joining.
Hydrocarbons were coded depending on their relative concentrations from 0: absence; 1: 0.1e5%; 2: 5e10%;3: 10e20%; 4: 20e30%; 5: 30e50% (no single compound ever accounted for more than 50% of the total compositionof cuticular wax).
As a first approach we did not attempt to conduct a phylogenetic classification; thus, we decided not to include anyoutgroup in our data set, trees were thus presented unrooted. When some multiple sub-equal trees were found, a Ma-jority Rule (50%) consensus tree was calculated. We used this type of calculation at two levels: first to discriminate ourthree species at different stages, i.e., eggs, larvae, prepupae, pupae and adults (separating males and females); secondbetween each species in order to discriminate different stages.
3. Results
3.1. Cuticular wax composition of the three species
A total of 745 individuals were analysed: 270 C. vomitoria, 245 (þ a ‘‘wild’’ male and female) C. vicina and 229P. terraenovae.
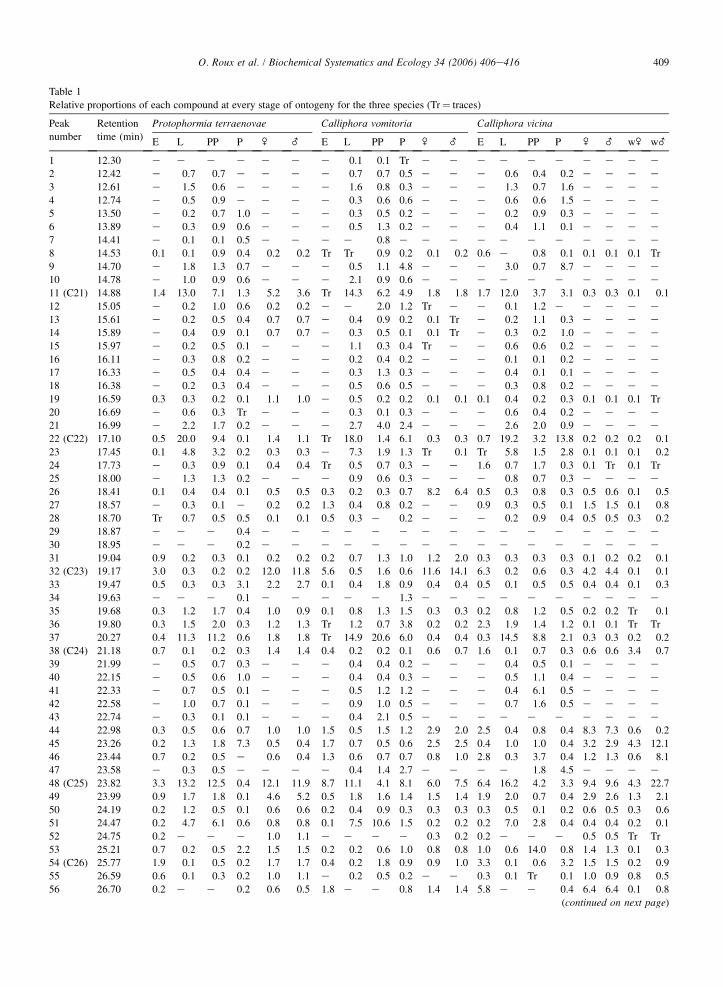
In all, 83 compounds were discriminated through gas chromatography (Table 1). Different categories of com-pounds were discovered, some widespread and present in all species and stages. Another category was specific tosome stages and finally a few compounds were species specific.
Some compounds represent basic and general constituents of cuticular wax. Their specificity is not noticeable at thespecies level but may be useful to separate and characterize different sub-families of Diptera. Among these very
409O. Roux et al. / Biochemical Systematics and Ecology 34 (2006) 406e416
Table 1
Relative proportions of each compound at every stage of ontogeny for the three species (Tr¼ traces)
Peak
number
Retention
time (min)
Protophormia terraenovae Calliphora vomitoria Calliphora vicina
E L PP P \ _ E L PP P \ _ E L PP P \ _ w\ w_
1 12.30 e e e e e e e 0.1 0.1 Tr e e e e e e e e e e2 12.42 e 0.7 0.7 e e e e 0.7 0.7 0.5 e e e 0.6 0.4 0.2 e e e e
3 12.61 e 1.5 0.6 e e e e 1.6 0.8 0.3 e e e 1.3 0.7 1.6 e e e e
4 12.74 e 0.5 0.9 e e e e 0.3 0.6 0.6 e e e 0.6 0.6 1.5 e e e e
5 13.50 e 0.2 0.7 1.0 e e e 0.3 0.5 0.2 e e e 0.2 0.9 0.3 e e e e6 13.89 e 0.3 0.9 0.6 e e e 0.5 1.3 0.2 e e e 0.4 1.1 0.1 e e e e
7 14.41 e 0.1 0.1 0.5 e e e e 0.8 e e e e e e e e e e e
8 14.53 0.1 0.1 0.9 0.4 0.2 0.2 Tr Tr 0.9 0.2 0.1 0.2 0.6 e 0.8 0.1 0.1 0.1 0.1 Tr
9 14.70 e 1.8 1.3 0.7 e e e 0.5 1.1 4.8 e e e 3.0 0.7 8.7 e e e e10 14.78 e 1.0 0.9 0.6 e e e 2.1 0.9 0.6 e e e e e e e e e e
11 (C21) 14.88 1.4 13.0 7.1 1.3 5.2 3.6 Tr 14.3 6.2 4.9 1.8 1.8 1.7 12.0 3.7 3.1 0.3 0.3 0.1 0.1
12 15.05 e 0.2 1.0 0.6 0.2 0.2 e e 2.0 1.2 Tr e e 0.1 1.2 e e e e e
13 15.61 e 0.2 0.5 0.4 0.7 0.7 e 0.4 0.9 0.2 0.1 Tr e 0.2 1.1 0.3 e e e e14 15.89 e 0.4 0.9 0.1 0.7 0.7 e 0.3 0.5 0.1 0.1 Tr e 0.3 0.2 1.0 e e e e
15 15.97 e 0.2 0.5 0.1 e e e 1.1 0.3 0.4 Tr e e 0.6 0.6 0.2 e e e e
16 16.11 e 0.3 0.8 0.2 e e e 0.2 0.4 0.2 e e e 0.1 0.1 0.2 e e e e17 16.33 e 0.5 0.4 0.4 e e e 0.3 1.3 0.3 e e e 0.4 0.1 0.1 e e e e
18 16.38 e 0.2 0.3 0.4 e e e 0.5 0.6 0.5 e e e 0.3 0.8 0.2 e e e e
19 16.59 0.3 0.3 0.2 0.1 1.1 1.0 e 0.5 0.2 0.2 0.1 0.1 0.1 0.4 0.2 0.3 0.1 0.1 0.1 Tr
20 16.69 e 0.6 0.3 Tr e e e 0.3 0.1 0.3 e e e 0.6 0.4 0.2 e e e e21 16.99 e 2.2 1.7 0.2 e e e 2.7 4.0 2.4 e e e 2.6 2.0 0.9 e e e e
22 (C22) 17.10 0.5 20.0 9.4 0.1 1.4 1.1 Tr 18.0 1.4 6.1 0.3 0.3 0.7 19.2 3.2 13.8 0.2 0.2 0.2 0.1
23 17.45 0.1 4.8 3.2 0.2 0.3 0.3 e 7.3 1.9 1.3 Tr 0.1 Tr 5.8 1.5 2.8 0.1 0.1 0.1 0.2
24 17.73 e 0.3 0.9 0.1 0.4 0.4 Tr 0.5 0.7 0.3 e e 1.6 0.7 1.7 0.3 0.1 Tr 0.1 Tr
25 18.00 e 1.3 1.3 0.2 e e e 0.9 0.6 0.3 e e e 0.8 0.7 0.3 e e e e
26 18.41 0.1 0.4 0.4 0.1 0.5 0.5 0.3 0.2 0.3 0.7 8.2 6.4 0.5 0.3 0.8 0.3 0.5 0.6 0.1 0.5
27 18.57 e 0.3 0.1 e 0.2 0.2 1.3 0.4 0.8 0.2 e e 0.9 0.3 0.5 0.1 1.5 1.5 0.1 0.8
28 18.70 Tr 0.7 0.5 0.5 0.1 0.1 0.5 0.3 e 0.2 e e e 0.2 0.9 0.4 0.5 0.5 0.3 0.2
29 18.87 e e e 0.4 e e e e e e e e e e e e e e e e
30 18.95 e e e 0.2 e e e e e e e e e e e e e e e e
31 19.04 0.9 0.2 0.3 0.1 0.2 0.2 0.2 0.7 1.3 1.0 1.2 2.0 0.3 0.3 0.3 0.3 0.1 0.2 0.2 0.1
32 (C23) 19.17 3.0 0.3 0.2 0.2 12.0 11.8 5.6 0.5 1.6 0.6 11.6 14.1 6.3 0.2 0.6 0.3 4.2 4.4 0.1 0.1
33 19.47 0.5 0.3 0.3 3.1 2.2 2.7 0.1 0.4 1.8 0.9 0.4 0.4 0.5 0.1 0.5 0.5 0.4 0.4 0.1 0.3
34 19.63 e e e 0.1 e e e e e 1.3 e e e e e e e e e e
35 19.68 0.3 1.2 1.7 0.4 1.0 0.9 0.1 0.8 1.3 1.5 0.3 0.3 0.2 0.8 1.2 0.5 0.2 0.2 Tr 0.1
36 19.80 0.3 1.5 2.0 0.3 1.2 1.3 Tr 1.2 0.7 3.8 0.2 0.2 2.3 1.9 1.4 1.2 0.1 0.1 Tr Tr
37 20.27 0.4 11.3 11.2 0.6 1.8 1.8 Tr 14.9 20.6 6.0 0.4 0.4 0.3 14.5 8.8 2.1 0.3 0.3 0.2 0.2
38 (C24) 21.18 0.7 0.1 0.2 0.3 1.4 1.4 0.4 0.2 0.2 0.1 0.6 0.7 1.6 0.1 0.7 0.3 0.6 0.6 3.4 0.7
39 21.99 e 0.5 0.7 0.3 e e e 0.4 0.4 0.2 e e e 0.4 0.5 0.1 e e e e
40 22.15 e 0.5 0.6 1.0 e e e 0.4 0.4 0.3 e e e 0.5 1.1 0.4 e e e e
41 22.33 e 0.7 0.5 0.1 e e e 0.5 1.2 1.2 e e e 0.4 6.1 0.5 e e e e
42 22.58 e 1.0 0.7 0.1 e e e 0.9 1.0 0.5 e e e 0.7 1.6 0.5 e e e e43 22.74 e 0.3 0.1 0.1 e e e 0.4 2.1 0.5 e e e e e e e e e e
44 22.98 0.3 0.5 0.6 0.7 1.0 1.0 1.5 0.5 1.5 1.2 2.9 2.0 2.5 0.4 0.8 0.4 8.3 7.3 0.6 0.2
45 23.26 0.2 1.3 1.8 7.3 0.5 0.4 1.7 0.7 0.5 0.6 2.5 2.5 0.4 1.0 1.0 0.4 3.2 2.9 4.3 12.1
46 23.44 0.7 0.2 0.5 e 0.6 0.4 1.3 0.6 0.7 0.7 0.8 1.0 2.8 0.3 3.7 0.4 1.2 1.3 0.6 8.1
47 23.58 e 0.3 0.5 e e e e 0.4 1.4 2.7 e e e e 1.8 4.5 e e e e
48 (C25) 23.82 3.3 13.2 12.5 0.4 12.1 11.9 8.7 11.1 4.1 8.1 6.0 7.5 6.4 16.2 4.2 3.3 9.4 9.6 4.3 22.7
49 23.99 0.9 1.7 1.8 0.1 4.6 5.2 0.5 1.8 1.6 1.4 1.5 1.4 1.9 2.0 0.7 0.4 2.9 2.6 1.3 2.1
50 24.19 0.2 1.2 0.5 0.1 0.6 0.6 0.2 0.4 0.9 0.3 0.3 0.3 0.3 0.5 0.1 0.2 0.6 0.5 0.3 0.6
51 24.47 0.2 4.7 6.1 0.6 0.8 0.8 0.1 7.5 10.6 1.5 0.2 0.2 0.2 7.0 2.8 0.4 0.4 0.4 0.2 0.1
52 24.75 0.2 e e e 1.0 1.1 e e e e 0.3 0.2 0.2 e e e 0.5 0.5 Tr Tr
53 25.21 0.7 0.2 0.5 2.2 1.5 1.5 0.2 0.2 0.6 1.0 0.8 0.8 1.0 0.6 14.0 0.8 1.4 1.3 0.1 0.3
54 (C26) 25.77 1.9 0.1 0.5 0.2 1.7 1.7 0.4 0.2 1.8 0.9 0.9 1.0 3.3 0.1 0.6 3.2 1.5 1.5 0.2 0.9
55 26.59 0.6 0.1 0.3 0.2 1.0 1.1 e 0.2 0.5 0.2 e e 0.3 0.1 Tr 0.1 1.0 0.9 0.8 0.5
56 26.70 0.2 e e 0.2 0.6 0.5 1.8 e e 0.8 1.4 1.4 5.8 e e 0.4 6.4 6.4 0.1 0.8
(continued on next page)
410 O. Roux et al. / Biochemical Systematics and Ecology 34 (2006) 406e416
general compounds: peaks 11 (C21), 32 (C23), 48 (C25) and 60 (C27) are well distributed (Carlson and Service, 1980;Chen et al., 1990; Desena et al., 1999a,b; Mpuru et al., 2001).
More specific are compounds that are discriminatory of various stages. Among these, it is possible to separate thosewhich are specific to immature stages (larval, prepupal and pupal instar) like compounds corresponding to peaks 16e18, 20 and 21, 25, 39e42, 47, 81 and 83.
Some other compounds are widely distributed but absent for one species at the larval stage such as peaks 75 and 76for C. vomitoria. Only one compound was found to be strictly specific to pupae: peak 57. As for larvae, some compoundsare lacking at this specific stage for some species (absence of peaks 46 and 59 for P. terraenovae). Finally, a last categoryof compound was found to be specific for adults and optional for eggs for the three species (peaks 52 and 78).
From eggs to adults, the quantity of each hydrocarbon increases with the size of the stage. But, from 1-day-oldadults to 8-day-old adults (same size), the total quantity of hydrocarbons also increases. The maximum amplitudeof the FID response corresponded to 80 mV and 200 mV, respectively (data not shown).
A ‘‘wild’’ male and female of C. vicina were checked to see if some qualitative and/or quantitative changes in thecuticular pattern are visible. As shown in Table 1, we can notice that no qualitative variations were found but somequantitative ones were. However, relative quantities for each compound were similar (or at least went in the samedirection) between our ‘‘wild’’ controls and our laboratory strain.
3.2. Discriminant analysis
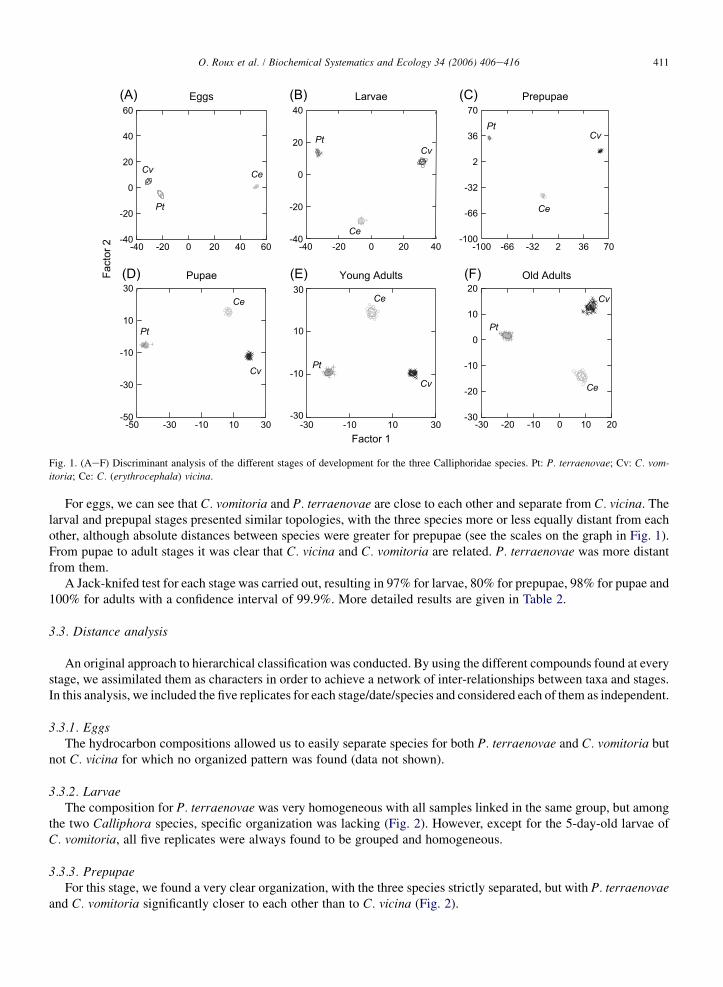
Fig. 1 shows the graphic results of six analyses corresponding to the different stages. For each of these analyses,the three species were well discriminated. However, distances between species were not constant for the variousstages.
Table 1 (continued)
Peak
number
Retention
time (min)
Protophormia terraenovae Calliphora vomitoria Calliphora vicina
E L PP P \ _ E L PP P \ _ E L PP P \ _ w\ w_
57 26.86 e e e 0.1 e e e e e 0.5 e e e e e 0.1 e e e e
58 27.00 e 0.1 0.1 0.1 1.3 1.3 0.5 e e 0.6 1.3 1.2 0.8 e 0.7 0.1 1.2 1.1 0.5 8.2
59 27.10 3.2 0.1 Tr e 0.7 0.6 0.4 e e 0.3 0.4 0.5 0.4 0.3 2.5 0.5 1.4 1.5 11.1 6.4
60 (C27) 27.45 16.7 0.5 0.8 35.1 15.0 15.5 13.2 0.2 1.1 12.4 6.7 7.4 13.0 e 0.7 30.2 12.9 13.7 35 17.6
61 27.97 5.6 0.2 0.3 0.7 4.5 4.9 0.5 e e 1.0 2.4 2.1 3.5 e 0.1 0.8 7.2 7.1 0.8 1.4
62 28.15 0.8 Tr 0.1 0.3 1.1 1.2 0.1 e e 0.4 0.6 0.6 0.5 e e 0.7 1.2 1.1 0.8 0.3
63 28.38 2.7 0.1 0.1 0.4 1.2 1.1 0.1 e e 0.2 0.3 0.3 1.0 e e 0.5 1.4 1.4 0.1 0.5
64 28.63 1.0 Tr 0.1 0.7 0.8 0.8 0.4 e e 0.7 0.6 0.6 1.2 0.1 0.4 0.6 1.5 1.4 0.2 0.3
65 29.02 2.1 0.1 0.2 3.7 2.8 2.9 1.4 0.1 0.6 5.1 2.5 2.4 2.1 1.1 4.6 5.4 4.1 4.1 0.8 1.7
66 (C28) 29.56 4.0 1.0 9.3 7.9 1.3 1.3 1.6 0.9 3.0 2.1 1.5 1.6 3.0 Tr 0.1 3.3 2.1 2.2 0.5 0.9
67 30.17 2.0 e e 0.3 0.6 0.6 1.2 e e 0.8 e e 1.1 e e 0.5 2.3 2.3 0.2 0.6
68 30.91 2.0 Tr 0.3 0.3 1.0 0.9 11.4 0.3 1.5 1.8 4.7 5.1 9.2 0.1 1.1 0.7 5.5 5.8 22.3 6.8
69 31.10 e e Tr 0.4 1.1 1.4 1.7 0.3 4.9 3.1 2.7 2.2 0.6 e 0.5 0.6 1.0 1.1 0.3 0.1
70 31.40 e 0.1 0.1 0.2 0.3 0.4 1.2 Tr 0.4 2.1 1.3 1.1 0.3 0.5 8.5 1.9 0.4 0.3 1.4 Tr
71 31.60 e e e e e e 0.6 e e e e e 1.0 e e e 2.5 2.4 0.3 0.2
72 (C29) 31.84 23.6 1.0 3.1 16.1 5.1 5.2 17.0 0.2 1.5 9.3 10.5 10.1 4.8 0.2 1.3 11.8 3.7 3.8 0.2 0.9
73 32.08 3.6 0.3 0.4 0.5 2.0 2.1 5.6 0.2 1.2 2.1 5.7 5.1 5.8 0.1 1.8 0.4 3.5 3.3 0.4 0.5
74 32.40 3.0 0.2 0.4 2.0 1.8 1.9 1.3 0.1 0.4 0.9 1.0 1.3 1.6 e e 0.2 0.7 0.6 0.3 0.1
75 32.54 1.9 0.2 0.4 1.0 1.3 1.3 3.0 e e 2.0 2.1 2.1 2.0 0.1 1.1 0.5 1.3 1.3 1.1 0.8
76 32.81 1.7 0.1 1.0 1.3 0.8 0.8 1.7 e e 1.4 2.2 1.9 0.8 0.1 0.1 0.7 0.7 0.7 0.4 0.1
77 33.59 3.0 0.4 0.7 2.7 1.7 1.7 3.3 Tr 0.6 1.6 2.1 2.0 1.4 0.1 1.3 0.8 0.6 0.6 0.2 0.2
78 (C30) 35.30 1.6 e e e 0.4 0.4 0.7 e e e 0.9 1.0 0.8 e e e 0.4 0.5 0.2 0.1
79 35.66 e 0.2 0.3 0.8 e e e 0.2 1.1 1.7 Tr e e e e 0.8 e e e e
80 36.03 1.0 0.6 0.5 0.8 0.5 0.4 6.3 0.1 1.2 1.5 3.9 3.6 1.5 0.1 0.8 7.0 1.0 0.9 0.3 0.4
81 36.19 e 0.2 1.5 0.7 e e e 0.1 0.6 0.5 e e e 0.4 2.7 0.4 e e e e82 (C31) 36.68 1.9 0.6 0.5 1.1 0.8 0.8 1.9 0.2 0.8 1.4 3.6 2.8 0.8 0.2 0.8 2.0 0.4 0.4 0.1 0.1
83 36.95 e 0.3 0.2 0.3 e e e 0.3 0.6 0.7 e e e 0.2 0.2 e e e e e
Names of un-ambiguous linear hydrocarbons are indicated. E: eggs; L: larvae; PP: prepupae; P: pupae and _: males and \: females. ‘‘w: wild spec-
imen’’, for C. vicina.
411O. Roux et al. / Biochemical Systematics and Ecology 34 (2006) 406e416
For eggs, we can see that C. vomitoria and P. terraenovae are close to each other and separate from C. vicina. Thelarval and prepupal stages presented similar topologies, with the three species more or less equally distant from eachother, although absolute distances between species were greater for prepupae (see the scales on the graph in Fig. 1).From pupae to adult stages it was clear that C. vicina and C. vomitoria are related. P. terraenovae was more distantfrom them.
A Jack-knifed test for each stage was carried out, resulting in 97% for larvae, 80% for prepupae, 98% for pupae and100% for adults with a confidence interval of 99.9%. More detailed results are given in Table 2.
3.3. Distance analysis
An original approach to hierarchical classification was conducted. By using the different compounds found at everystage, we assimilated them as characters in order to achieve a network of inter-relationships between taxa and stages.In this analysis, we included the five replicates for each stage/date/species and considered each of them as independent.
3.3.1. EggsThe hydrocarbon compositions allowed us to easily separate species for both P. terraenovae and C. vomitoria but
not C. vicina for which no organized pattern was found (data not shown).
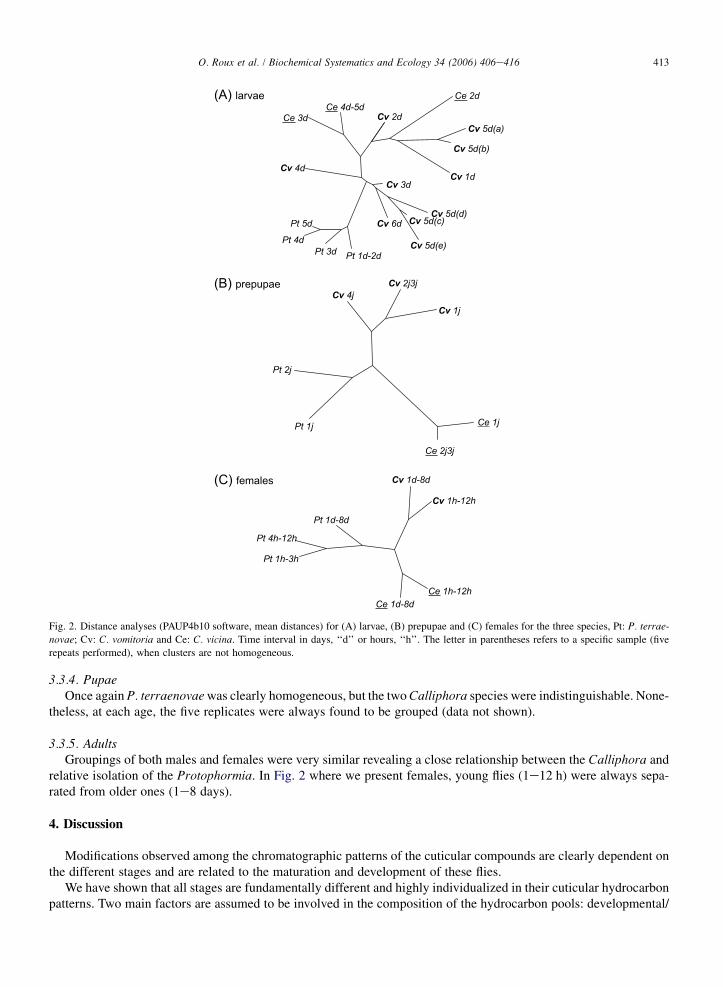
3.3.2. LarvaeThe composition for P. terraenovae was very homogeneous with all samples linked in the same group, but among
the two Calliphora species, specific organization was lacking (Fig. 2). However, except for the 5-day-old larvae ofC. vomitoria, all five replicates were always found to be grouped and homogeneous.
3.3.3. PrepupaeFor this stage, we found a very clear organization, with the three species strictly separated, but with P. terraenovae
and C. vomitoria significantly closer to each other than to C. vicina (Fig. 2).
-30 -20 -10 0 10 20-30
-20
-10
0
10
20
Pt
Cv
Ce
(F)
-30 -10 10 30-30
-10
10
30
Pt
Cv
Ce
(E)
-50 -30 -10 10 30-50
-30
-10
10
30
Pt
Cv
Ce
(D)
-100 -66 -32 2 36 70-100
-66
-32
2
36
70Pt
Cv
Ce
(C)
-40 -20 0 20 40Ce
Pt
Cv
(B)
-40 -20 0 20 40 60-40
-20
0
20
40
60
-40
-20
0
20
40
Pt
CvCe
(A)
Factor 1
Fact
or 2
Eggs Larvae Prepupae
Pupae Young Adults Old Adults
Fig. 1. (AeF) Discriminant analysis of the different stages of development for the three Calliphoridae species. Pt: P. terraenovae; Cv: C. vom-
itoria; Ce: C. (erythrocephala) vicina.
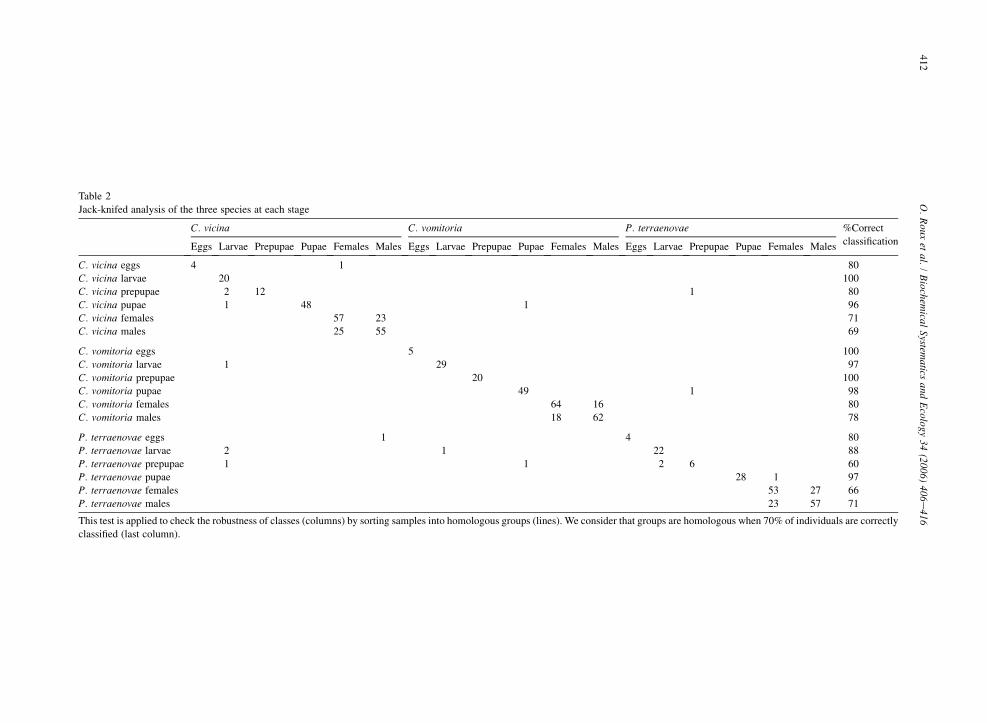
Table 2
Jack-knifed analysis
P. terraenovae %Correct
classificationales Males Eggs Larvae Prepupae Pupae Females Males
C. vicina eggs 80
C. vicina larvae 100
C. vicina prepupae 1 80
C. vicina pupae 96
C. vicina females 71
C. vicina males 69
C. vomitoria eggs 100
C. vomitoria larvae 97
C. vomitoria prepupa 100
C. vomitoria pupae 1 98
C. vomitoria females 16 80
C. vomitoria males 62 78
P. terraenovae eggs 4 80
P. terraenovae larvae 22 88
P. terraenovae prepu 2 6 60
P. terraenovae pupae 28 1 97
P. terraenovae femal 53 27 66
P. terraenovae males 23 57 71
This test is applied to We consider that groups are homologous when 70% of individuals are correctly
classified (last colum
41
2O
.R
ouxet
al./
Biochem
icalSystem
aticsand
Ecology
34(2006)
406e416
of the three species at each stage
C. vicina C. vomitoria
Eggs Larvae Prepupae Pupae Females Males Eggs Larvae Prepupae Pupae Fem
4 1
20
2 12
1 48 1
57 23
25 55
5
1 29
e 20
49
64
18
1
2 1
pae 1 1
es
check the robustness of classes (columns) by sorting samples into homologous groups (lines).
n).
413O. Roux et al. / Biochemical Systematics and Ecology 34 (2006) 406e416
3.3.4. PupaeOnce again P. terraenovae was clearly homogeneous, but the two Calliphora species were indistinguishable. None-
theless, at each age, the five replicates were always found to be grouped (data not shown).
3.3.5. AdultsGroupings of both males and females were very similar revealing a close relationship between the Calliphora and
relative isolation of the Protophormia. In Fig. 2 where we present females, young flies (1e12 h) were always sepa-rated from older ones (1e8 days).
4. Discussion
Modifications observed among the chromatographic patterns of the cuticular compounds are clearly dependent onthe different stages and are related to the maturation and development of these flies.
We have shown that all stages are fundamentally different and highly individualized in their cuticular hydrocarbonpatterns. Two main factors are assumed to be involved in the composition of the hydrocarbon pools: developmental/
Ce 3d
(A) larvae
(C) females
(B) prepupae
Cv 3d
Cv 5d(d)
Cv 5d(c)
Cv 5d(e)
Cv 6d
Pt 1d-2dPt 3d
Pt 4d
Pt 5d
Cv 4d
Ce 4d-5d
Cv 2d
Ce 2d
Cv 5d(a)
Cv 5d(b)
Cv 1d
Ce 1h-12h
Ce 1d-8d
Pt 1h-3h
Pt 1d-8d
Cv 1h-12h
Pt 4h-12h
Cv 1d-8d
Cv 4j
Cv 2j3j
Cv 1j
Ce 2j3j
Pt 1j
Pt 2j
Ce 1j
Fig. 2. Distance analyses (PAUP4b10 software, mean distances) for (A) larvae, (B) prepupae and (C) females for the three species, Pt: P. terrae-
novae; Cv: C. vomitoria and Ce: C. vicina. Time interval in days, ‘‘d’’ or hours, ‘‘h’’. The letter in parentheses refers to a specific sample (five
repeats performed), when clusters are not homogeneous.
414 O. Roux et al. / Biochemical Systematics and Ecology 34 (2006) 406e416
genetic factors and physiological state/environmental conditions (Howard and Blomquist, 1982; Blomquist et al.,1987; Espelie and Payne, 1991; Ferveur and Jallon, 1996; Hebanowska et al., 1990; Lockey, 1980; Howard et al.,1995). In order to examine only the developmental/genetic characters among the three species studied, we standard-ized the environmental conditions and especially the feeding substrate.
Like morphological features and metabolic enzyme structure, hydrocarbon components are genetically fixed andrepresent a unique, species-specific phenotype (Coyne et al., 1994; Kaib et al., 1991; Lockey, 1991). The presence,absence or abundance of cuticular hydrocarbons is related to the presence, absence, or kinetics of the biosyntheticenzymes. One of our goals was to determine whether it is possible to use cuticular compounds as phylogeneticmarkers. The first step was to check the congruence between our two grouping methods, i.e., discriminant analysisand distance calculation conducted using PAUP. This congruence is variable depending on the type of analysisperformed.
It is thus clear that for eggs, larvae and prepupae, no congruence was reached with some conflicting results depend-ing on the methods: eggs, PAUP: [[C. vomitoria, C. vicina] P. terraenovae], Discriminant: [[C. vomitoria, P. terrae-novae] C. vicina]; larvae, PAUP: [[C. vomitoria, C. vicina] P. terraenovae], Discriminant: [[C. vicina, P. terraenovae]C. vomitoria]; prepupae, PAUP: [[P. terraenovae, C. vicina] C. vomitoria], Discriminant: [[C. vicina, C. vomitoria]P. terraenovae]. But, for pupae and adults, there was congruence between the two methods. Furthermore, therewas unambiguous grouping of the two Calliphora, and separation of the Protophormia species.
By comparing discriminant analyses and distance calculations, we found that even if most of the results are similar,distance methods are more sensitive to slight variability.
We compared the topologies obtained using both discriminant and distance methods with the work of Stevens andWall (2001). These authors sequenced 2148 nucleotides from the large ribosomal sub-unit RNA (LSU, 28S). Theyshowed that P. terraenovae is clearly separate from the two Calliphoridae species: [[C. vicina, C. vomitoria] P. ter-raenovae]. Cuticular compounds cannot be accurately used as phylogenetic markers of the first stages but can be forthe following stages (starting from pupae to adults). In conclusion, a chemical phylogeny based on 5- to 12-h-old fe-males was found to be the most congruent with molecular data.
From an evolutionary point of view, some controversies exist concerning the possible use of cuticular compoundsas phylogenetic markers (Brandl et al., 1992; Kutnik et al., 2004). The main criticisms are that environmental and/oradaptative influences, such as diet (Espelie and Bernays, 1989; Liang and Silverman, 2000), microclimate (Howardet al., 1995), season (Nielsen et al., 1999; Steiner et al., 2002) and geographic origin (Chen et al., 1990; Brown et al.,1998; Dapporto et al., 2004), mask the phylogenetic signals of these phenotypic characters. Recently, Kutnik et al.(2004), in termites clearly showed that depending on the type of genes used (mitochondrial versus nuclear), a congru-ence can be found or not with phylogenetic signals produced by cuticular compounds.
When checking a randomly caught male and female of C. vicina (the only species that we were able to find wild inToulouse), we realized that no qualitative changes in the overall composition of hydrocarbons were found. However,some important quantitative changes were observed. Even if, most of time, the relative proportions of compoundswere similar to those of our laboratory strain, we suggest that environmental factors are only acting on these quanti-tative variations. The maintenance of the qualitative pattern supported our hypothesis that each species of fly possessesa specific cuticular signature. Therefore, the possibility to perform some phylogenetic studies seems to be relevantusing cuticular hydrocarbons with the important restriction of choosing the most suitable stage to establisha phylogeny.
Acknowledgements
We thank the Institut de Recherche Criminelle de la Gendarmerie Nationale (Captain Malgorn, Lieutenant Gaudry,B. Chauvet, F. Lefebvre) for their scientific and technical advice and for providing P. terraenovae specimens and of-fering financial support. We thank Andrea Dejean for revising the English of the manuscript.
References
Anyanwu, G.I., Molyneux, D.H., Phillips, A., 2000. Variation in cuticular hydrocarbons among strains of the Anopheles gambiae sensu stricto by
analysis of cuticular hydrocarbons using gas liquid chromatography of larvae. Mem. Instit. Oswaldo Cruz 95, 295e300.
Beament, J.W.L., 1945. The cuticular lipids of insects. J. Exp. Biol. 21, 115e131.
415O. Roux et al. / Biochemical Systematics and Ecology 34 (2006) 406e416
Blomquist, G.J., Nelson, D.R., De Renobales, M., 1987. Chemistry, biochemistry and physiology of insect cuticular lipids. Arch. Insect Biochem.
Physiol. 6, 227e265.
Brandl, R., Kaib, M., Bagine, R., 1992. Cuticular hydrocarbon profiles: a tool in insect taxonomy? Verh. Dtsch. Zool. Ges. 85, 183.
Brown, W.V., Morton, R., Lacey, M.J., Spradbery, J.P., Mahon, R.J., 1998. Identification of the geographical source of adults of the Old World
screw-worm fly, Chrysomya bezziana villeneuve (Diptera: Calliphoridae) by multivariate analysis of cuticular hydrocarbons. Comp. Biochem.
Physiol. B Biochem. Mol. Biol. 119, 391e399.
Brown, W.V., Rose, H.A., Lacey, M.J., Wright, K., 2000. The cuticular hydrocarbons of the giant soil-burrowing cockroach Macropanesthia rhi-noceros Saussure (Blattodea: Blaberidae: Geoscapheinae): analysis with respect to age, sex and location. Comp. Biochem. Physiol. B Bio-
chem. Mol. Biol. 127, 261e277.
Carlson, D.A., Reinert, J.F., Bernier, U.R., Sutton, B.D., Seawright, J.A., 1979. Analysis of the cuticular hydrocarbons among species of the
Anopheles quadrimaculatus complex (Diptera: Culicidae). J. Am. Mosq. Control Assoc. Suppl. 13, 103e111.
Carlson, D.A., Service, M.W., 1979. Differentiation between species of the Anopheles gambiae Giles complex (Diptera: Culicidae) by analysis of
cuticular hydrocarbons. Ann. Trop. Med. Parasitol. 73, 589e592.
Carlson, D.A., Service, M.W., 1980. Identification of mosquitoes of Anopheles gambiae species complex A and B by analysis of cuticular com-
ponents. Science 207, 1089e1091.
Carlson, D.A., Walsh, J.F., 1981. Identification of two West African black flies (Diptera: Simuliidae) of the Simulium damnosum species complex
by analysis of cuticular paraffins. Acta Trop. 38, 235e239.
Chen, C.S., Mulla, M.S., March, R.B., Chaney, J.D., 1990. Cuticular hydrocarbon patterns in Culex quinquefasciatus as influenced by age, sex and
geography. Bull. Soc. Vector Ecol. 15, 129e139.
Coyne, J.A., Crittenden, A.P., Mah, K., 1994. Genetics of a pheromonal difference contributing to reproductive isolation in Drosophila. Science
265, 1461e1464.
Dapporto, L., Palagi, E., Turillazzi, S., 2004. Cuticular hydrocarbons of Polistes dominulus as a biogeographic tool: a study of populations from
the Tuscan Archipelago and surrounding areas. J. Chem. Ecol. 30, 2139e2151.
Desena, M.L., Clark, J.M., Edman, J.D., Symington, S.B., Scott, T.W., Clark, G.G., Peter, T.M., 1999a. Potential for aging female Aedes aegypti
(Diptera: Culicidae) by gas chromatographic analysis of cuticular hydrocarbons, including a field evaluation. J. Med. Entomol. 36, 811e823.
Desena, M.L., Edman, J.D., Clark, J.M., Symington, S.B., Scott, T.W., 1999b. Aedes aegypti (Diptera: Culicidae) age determination by cuticular
hydrocarbon analysis of female legs. J. Med. Entomol. 36, 824e830.
Dietemann, V., Peeters, C., Liebig, J., Thivet, V., Holldobler, B., 2003. Cuticular hydrocarbons mediate discrimination of reproductives and non-
reproductives in the ant Myrmecia gulosa. Proc. Natl Acad. Sci. U.S.A. 100, 10341e10346.
Dore, J.C., Michelot, D., Gordon, G., Labia, R., Zagatti, P., Renou, M., Descoins, C., 1986. Approche factorielle des relations entre 8 tribus de
lepidopteres Tortricidae et 41 molecules a effet attractif sur les males. Ann. Soc. Entomol. Fr. 22, 387e402.
Espelie, K.E., Bernays, E.A., 1989. Diet-related differences in the cuticular lipids of Manduca sexta larvae. J. Chem. Ecol. 15, 2003e2017.
Espelie, K.E., Payne, J.A., 1991. Characterization of the cuticular lipids of the larvae and adults of the pecan weevil, Curculio caryae. Biochem.
Syst. Ecol. 19, 127e132.
Ferveur, J.F., Jallon, J.M., 1996. Genetic control of male cuticular hydrocarbons in Drosophila melanogaster. Genet. Res. 67, 211e218.
Goodrich, B.S., 1970. Cuticular lipids of adults and puparia of the Australian sheep blowfly Lucilia cuprina. J. Lipids Res. 11, 1e6.
Hebanowska, E., Malinski, E., Latowska, A., Dubis, E., Pihlaja, K., Oksman, P., Nawrot, J., Szafranek, J., 1990. A comparison of cuticular
hydrocarbons of larvae and beetles of the Tribolium destructor. Comp. Biochem. Physiol. B Biochem. Mol. Biol. 96, 815e820.
Hooper, G.H.S., Brown, W.V., Lacey, M.J., Hunter, D., 1996. Cuticular hydrocarbons of the Australian plague locust, Chortoicetes terminifera
(Walker) (Orthoptera), collected from wildly separated geographical locations. Aust. J. Entomol. 35, 257e262.
Howard, R.W., Blomquist, G.J., 1982. Chemical ecology and biochemistry of insect hydrocarbons. Annu. Rev. Entomol. 27, 149e172.
Howard, R.W., Howard, C.D., Colquhoun, S., 1995. Ontogenetic and environmentally induced changes in cuticular hydrocarbons of Oryzaephilus
surinamensis (Coleoptera). Ann. Entomol. Soc. Am. 88, 485e495.
Howard, R.W., Blomquist, G.J., 2005. Ecological, behavioral, and biochemical aspects of insect hydrocarbons. Annu. Rev. Entomol. 50, 571e593.
Jallon, J.M., 1984. A few chemical words exchanged by Drosophila during courtship & mating. Behav. Genet. 14, 441e478.
Jallon, J.M., David, J.R., 1987. Variation in cuticular hydrocarbons among the eight species of Drosophila melanogaster subgroup. Evolution 41,
294e302.
Kaib, M., Brandl, R., Bagine, R.K.N., 1991. Cuticular hydrocarbon profiles: a valuable tool in termite taxonomy. Naturwissenschaften 78,
176e179.
Kendall, M., Stuart, A., Ord, J.K., 1983. The advanced theory of statistics. In: Griffin, C. (Ed.), Design and Analysis, and Time Series, fourth ed.,
vol. III, 780 pp. (London).
Kutnik, M., Uva, P., Brinkworth, L., Bagneres, A.G., 2004. Phylogeography of two European Reticulitermes (Isoptera) species: the Iberian refu-
gium. Mol. Ecol. 13, 3099e3113.
Liang, D., Silverman, J., 2000. ‘‘You are what you eat’’: diet modifies cuticular hydrocarbons and nestmate recognition in the Argentine ant, Line-
pithema humile. Naturwissenschaften 87, 412e416.
Lockey, K.H., 1980. Insect cuticular hydrocarbons. Comp. Biochem. Physiol. B Biochem. Mol. Biol. 65, 457e462.
Lockey, K.H., 1988. Lipids of the insect cuticle: origin, composition and function. Comp. Biochem. Physiol. B Biochem. Mol. Biol. 89, 595e645.
Lockey, K.H., 1991. Insect hydrocarbon classes: implication for chemotaxonomy. Insect Biochem. 21, 91e97.
Mafuyai, H.B., Phillips, A., Molyneux, D.H., Milligan, P., 1994. Identification of the larvae of the Simulium damnosum complex from Nigeria by
analysis of cuticular hydrocarbons. Trop. Med. Parasitol. 45, 130e132.
Mahamat, H., Hassanali, A., 1998. Cuticular hydrocarbon composition analysis for taxonomic differentiation of phlebotomine sandfly species in
Kenya. J. Med. Entomol. 35, 778e781.
416 O. Roux et al. / Biochemical Systematics and Ecology 34 (2006) 406e416
Milligan, P.J.M., Phillips, A., Molyneux, D.H., Subbarao, S.K., White, G.B., 1986. Differentiation of Anopheles culicifacies Giles (Diptera:
Culicidae) sibling species by analysis of cuticular components. Bull. Entomol. Res. 76, 529e537.
Mpuru, S., Blomquist, G.J., Schal, C., Roux, M., Kuenzli, M., Dusticier, G., Clement, J.-L., Bagneres, A.-G., 2001. Effect of age and sex on the
production of internal and external hydrocarbons and pheromones in the housefly, Musca domestica. Insect Biochem. Mol. Biol. 31, 139e155.
Nelson, D.R., Carlson, D.A., Fatland, C.L., 1988. Cuticular hydrocarbons of tsetse flies. II: Glossina fuscipes, G. palpalis palpalis, G. p. gambien-
sis, G. tachinoides and G. brevipalpis. J. Chem. Ecol. 14, 963e987.
Nielsen, J., Boomsma, J.J., Oldham, N.J., Petersen, H.C., Morgan, E.D., 1999. Colony-level and season-specific variation in cuticular hydrocarbon
profiles of individual workers in the ant Formica truncorum. Insectes Soc. 46, 58e65.
Page, M., Nelson, L.J., Blomquist, G.J., Seybold, S.J., 1997. Cuticular hydrocarbons as chemotaxonomic characters of pine engraver beetles (Ips
spp.) in the grandicollis subgeneric group. J. Chem. Ecol. 23, 1053e1099.
Phillips, A., Milligan, P.J.M., Broomfield, G., Molyneux, D.H., 1988. Identification of medically important Diptera by analysis of cuticular hy-
drocarbons. Syst. Assoc. 37, 39e59.
Steiner, F.M., Schlick-Steiner, B.C., Nikiforov, A., Kalb, R., Mistrik, R., 2002. Cuticular hydrocarbons of Tetramorium ants from central Europe:
analysis of GCeMS data with self-organizing maps (SOM) and implications for systematics. J. Chem. Ecol. 28, 2569e2584.
Stevens, J., Wall, R., 2001. Genetic relationships between blowflies (Calliphoridae) of forensic importance. Forensic Sci. Int. 120, 116e123.
Swofford, D.L., 2001. PAUP e Phylogenetic Analysis Using Parsimony. Version 4.0b10. Sinauer Associates, Sunderland, Massachussetts.
Trabalon, M., Campan, M., Clement, J.L., Lange, C., Miquel, M.T., 1992. Cuticular hydrocarbons of Calliphora vomitoria (Diptera): relation to
age and sex. Gen. Comp. Endocrinol. 85, 208e216.
Trabalon, M., Lange, C., Clement, J.L., Campan, M., 1988. Les hydrocarbures cuticulaires de la femelle de Calliphora vomitoria (Dipteres). C. R.
Acad. Sci. Fr. 308, 569e573.


![÷ƾإÀ¬² È é£êµ©¤µ S ÁÔÐ'g U q= 2 »] Gt À¿ öÿa · Cuticle Nippers OS-206-518 Cuticle Nipper Double Spring Box Joint 5", 20 sales@organsurgical.com Cuticle](https://img.pdfslide.us/doc/110x75/5f0d3f4f7e708231d4396623/-s-g-u-q-2-gt-a-cuticle-nippers.jpg)