Embed Size (px)
Citation preview
When do we attain our objectives? On the role of indicators, values and
uncertainty in environmental management
Mirka Laurila-Pant
Doctoral Programme in Interdisciplinary Environmental Sciences Ecosystems and Environment Research Programme
Faculty of Biological and Environmental Sciences University of Helsinki
Finland
ACADEMIC DISSERTATION
To be presented for public examination with the permission of the Faculty of
Biological and Environmental Sciences of the University of Helsinki,
in the Auditorium 1041, Biocenter 2 (Viikinkaari 5),
on the 4th of September, 2020 at 12 o’clock noon.
Helsinki 2020
© Mirka Laurila-Pant (summary)
© Elsevier (article I and III)
© Authors (article II)
Cover photo by Mirka Laurila-Pant
ISBN 978-951-51-6271-7 (Paperback)
ISBN 978-951-51-6272-4 (PDF, e-thesis)
ISSN 2342-5423 (print)
ISSN 2342-5431 (Online)
Dissertationes Schola Doctoralis Scientiae Circumiectalis,
Alimentariae, Biologicae.
Unigrafia
Helsinki 2020
Supervisors Ph.D Annukka Lehikoinen
Faculty of Biological and Environmental Sciences
University of Helsinki
Finland
Ph.D. Samu Mäntyniemi
Natural Resources Institute
Finland
Thesis advisory Prof. Otso Ovaskainen
committee Faculty of Biological and Environmental Sciences
University of Helsinki
Finland
Ph.D Laura Uusitalo
Finnish Environmental Institute
Finland
Reviewers Ph.D Ángel Borja
Marine Research Division
AZTI-Tecnalia
Spain
Ph.D Jannicke Moe
Norwegian Institute for Water Research
Norway
Thesis opponent Ph.D David Barton
Norwegian Institute for Nature Research
Norway
Custos Prof. Sirkku Juhola
Faculty of Biological and Environmental Sciences
University of Helsinki
LIST OF ARTICLES INCLUDED
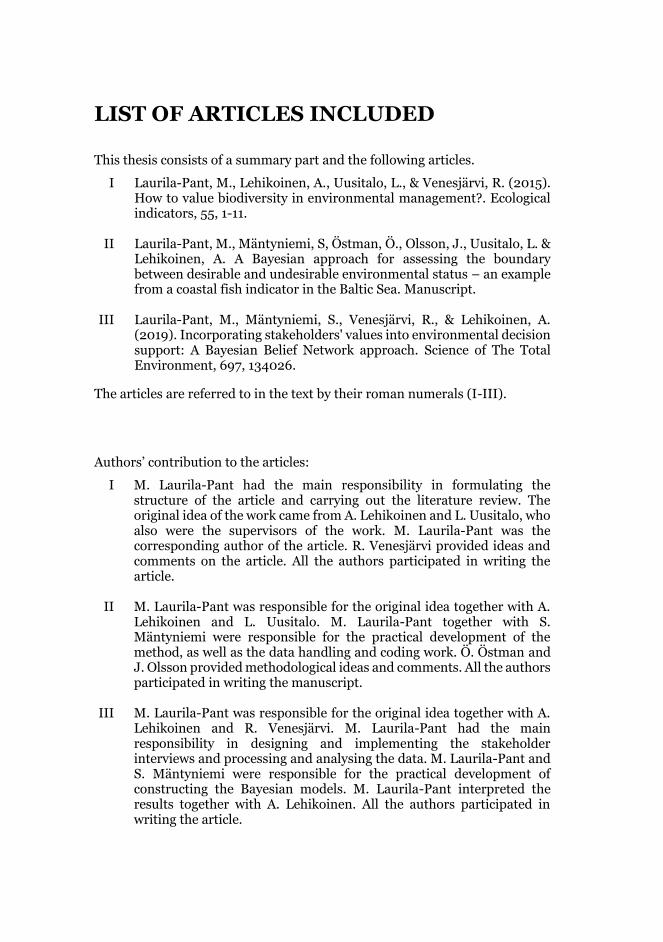
This thesis consists of a summary part and the following articles.
I Laurila-Pant, M., Lehikoinen, A., Uusitalo, L., & Venesjärvi, R. (2015). How to value biodiversity in environmental management?. Ecological indicators, 55, 1-11.
II Laurila-Pant, M., Mäntyniemi, S, Östman, Ö., Olsson, J., Uusitalo, L. & Lehikoinen, A. A Bayesian approach for assessing the boundary between desirable and undesirable environmental status – an example from a coastal fish indicator in the Baltic Sea. Manuscript.
III Laurila-Pant, M., Mäntyniemi, S., Venesjärvi, R., & Lehikoinen, A. (2019). Incorporating stakeholders' values into environmental decision support: A Bayesian Belief Network approach. Science of The Total Environment, 697, 134026.
The articles are referred to in the text by their roman numerals (I-III).
Authors’ contribution to the articles:
I M. Laurila-Pant had the main responsibility in formulating thestructure of the article and carrying out the literature review. The original idea of the work came from A. Lehikoinen and L. Uusitalo, who also were the supervisors of the work. M. Laurila-Pant was the corresponding author of the article. R. Venesjärvi provided ideas and comments on the article. All the authors participated in writing the article.
II M. Laurila-Pant was responsible for the original idea together with A.Lehikoinen and L. Uusitalo. M. Laurila-Pant together with S.Mäntyniemi were responsible for the practical development of themethod, as well as the data handling and coding work. Ö. Östman andJ. Olsson provided methodological ideas and comments. All the authorsparticipated in writing the manuscript.
III M. Laurila-Pant was responsible for the original idea together with A.Lehikoinen and R. Venesjärvi. M. Laurila-Pant had the mainresponsibility in designing and implementing the stakeholderinterviews and processing and analysing the data. M. Laurila-Pant andS. Mäntyniemi were responsible for the practical development ofconstructing the Bayesian models. M. Laurila-Pant interpreted theresults together with A. Lehikoinen. All the authors participated inwriting the article.
CONTENTS
LIST OF ARTICLES INCLUDED ...................................................................... 4
Abstract.............................................................................................................. 6
1 Introduction ................................................................................................ 9
2 Concepts and methods ............................................................................. 14
2.1 Decision-making and decision analysis ............................................ 14
2.2 Bayesian inference and decision support ........................................... 17
3 Results and contributions ........................................................................ 24
3.1 Selection of suitable indicators (Article [I]) ...................................... 24
3.2 Sufficiently good status of an indicator (Article [II]) ........................ 27
3.3 The role of values in multi-criteria decision-making (Article [III]) . 32
4 Discussion ................................................................................................. 37
Acknowledgments ........................................................................................... 41
References ....................................................................................................... 43
ABSTRACT
In environmental policy and management, the main objectives are to protect
and enhance the environmental status so that we can preserve the services and
benefits ecosystems provide for the society. To evaluate whether the
management objectives are met, there is a need to measure the prevailing
status of the system in focus, and to define the desirable versus the undesirable
state. How these tasks are implemented will impact our judgement about
whether the system needs restoration or not, or if ongoing or planned
exploitation of natural resources can be seen as sustainable. Indicators thus
provide means for the precise definition of the objectives by setting
measurable target states to be achieved.
However, it is not straightforward to judge, whether or not the objectives
have been attained. The first question is, what we should measure, i.e. what is
an appropriate indicator. The second question is, what the sufficiently good
status of the indicator is, i.e. how to define the target level. Third, after we
have decided what to measure and how to interpret the measurements, we
have to think, how the different decision criteria are weighted in relation to
each other. This thesis approaches the above-mentioned questions from the
multidisciplinary and probabilistic perspective, providing novel ideas and
tools.
Maintaining biodiversity is one of the key objectives mentioned in the
Marine Strategy Framework Directive (MSFD) and the Baltic Sea Action Plan
(BSAP). Article I of the thesis reviews alternative metrics for measuring (i.e.
indicating) biodiversity and discusses the ecological, economic and
sociocultural perspectives to its valuation. The paper suggests integrating
these three perspectives into a multi-objective framework. Furthermore, a
formal guideline for decision support is proposed when quantitatively
evaluating alternative management decisions against biodiversity.
Article II elaborates the uncertainty related to the process of determining
the prevailing status of an indicator as well as the boundary value used as the
threshold between a desirable (Good Environmental Status “GES”) and a non-
desirable state (“Sub-GES”). The current indicator-based management
protocols such as the MSFD and the BSAP have not acknowledged the
uncertainty of the GES boundary value, instead, the boundary value is given
as a fixed value with no associated uncertainty. Article II presents an
alternative way to define the target level and assess the prevailing status of one
ecological indicator, the abundance of perch (Perca fluviatilis) - an indicator
adopted by both BSAP and MSFD to represent the status of coastal fish
communities in the central and northern Baltic Sea. A Bayesian model is
developed to evaluate the prevailing relative abundance and the GES boundary
for it while acknowledging the uncertainty related to these estimates.
Multi-Criteria Decision Analysis (MCDA) is an approach used to frame and
formally solve decision-making problems with multiple, often contradictory
objectives. As society at large covers a variety of interests towards the services
and benefits that ecosystems provide, the unavoidable trade-offs in
environmental multi-objective decision-making processes easily lead to
conflicts. In Article III, a Bayesian approach is developed to quantify the
uncertainty about the stakeholder groups’ consensus concerning the valuation
of ecological attributes. When integrated into a MCDA model, it is possible to
visualise what we know about the level of disagreement or agreement and
analyse the optimal decisions from the perspective of each group.
The qualitative verbal management objectives (e.g. the “sustainable
development” or “good environmental status”) are vague in their precise
meaning and can thus complexify the societal discourse. Indicators can be
thought to specify their definitions. By setting quantitative metrics for
expressing the objectives and defining the rules for their weighing, they allow
transparent discussion and judgement whether the objectives are actually met
or not. However, the use of indicators does not remove the uncertainty nor the
value judgements related to environmental decisions. The inherent
uncertainty that arises from the limited knowledge of the system - both the
ecological and social part of it - cannot be avoided. However, by adopting a
multi-disciplinary perspective which utilises modern modelling methods and
normative decision theory, this thesis demonstrate a probabilistic view on the
issue and develops tools to tackle it.

9
1 INTRODUCTION
The health of the Earth’s ecosystems is an essential part of the life-support for
the human species and all other forms of life. However, the growing human
populations and the accelerating demand on natural resources poses the
biggest threats on the health of ecosystems (Cohen, 1995; McKee et al., 2004;
Steffen et al., 2015; Tilman et al., 2017) and ecological resilience (Allen et al.,
2016). Ecosystems are under multiple simultaneous and interconnected
pressures due to climate change, eutrophication, habitat loss,
overexploitation, pollution and many others (Crain et al., 2009; Halpern et al.,
2008; Korpinen et al., 2012; Grizzetti et al., 2017; Olsen et al., 2018), and are
experiencing losses in biodiversity, ecosystem functioning and the production
of ecosystem services. Ecosystem services provide food, transportation, and
cultural and recreational services for the people (Costanza et al., 1999), thus
the health of ecosystems is not only ecologically important but is also
recognized as having economic and sociocultural significance.
In addition to this, today’s environmental management problems are
multidisciplinary and complex, where ecological information alone is
insufficient. Environmental management is not only about managing the
environment itself, but more importantly, it is about managing human
behaviour and the behavioural drivers creating the pressures on ecosystems
(Jager and Mosler, 2007; Vlek and Steg, 2007). Society values the
consequences of the management decisions and thus defines the objectives by
using its own preferences and sociocultural viewpoints. The viewpoints,
however, vary according to what each actor has at stake (Scholte et al., 2016;
Ruiz-Frau et al., 2018). As the viewpoints can be contrasting, the tension
between the actors involved cannot always be avoided (Minteer and Miller
2011).
Complex socio-ecological problems, where the high degree of disagreement
and uncertainty around the decision-making process makes it impossible to
find one optimal solution, are termed as wicked problems (Rittel and Webber
1973; Balint et al., 2011). The environmental management decisions should be
10
made across sectoral boundaries, interlinking the ecological and social values
in the same decision analytic framework to improve the planning and
management of the sustainable use of natural resources and allocation of those
activities. The traditional sectoral –based and fragmented management have
been found to be insufficient to capture this type of complexity (Bigagli, 2017;
Smith et al., 2017).
This has created the need to develop a more comprehensive formal
framework, labelled as Ecosystem-Based Management (EBM), which
recognise the complexity and interactions within ecological systems, but also
between the ecosystem and society (Ruckelshaus et al., 2008; Gregory et al.,
2013; Langhans et al., 2019). The strong policy integration regarding
objectives, knowledge exchange, methods, and tools, as well as engagement, is
essential when aiming for long-term sustainable management in ecosystems
(Langhans et al., 2019). The EBM is a collaborative framework aiming to
capture more holistically, what needs to be protected when the ultimate goal
is healthy and productive ecosystems. The EBM provides a formal basis for
international treaties such as the Convention of Biological Diversity (CBD;
UNEP, 1992), and in the indicator-based environment management schemes
such as the Marine Strategy Framework Directive (MSFD; European
Commission, 2008) and the Baltic Sea Action Plan (BSAP; HELCOM, 2007).
The EBM aims to promote sustainable development and management,
where the focus is in meeting the present needs without risking the ability of
future generations to meet their needs (Brundtland, 1987; Tallis et al., 2010;
Berg et al., 2015; Soma et al., 2015). The sustainable environmental
management, in turn, is composed of three pillars that are economic,
environmental, and social (Barnard and Elliott, 2015). The three pillars can be
either viewed to have equal importance in environmental management
(Young, 1997; Newport et al., 2003; Morse, 2015), assuming that balance can
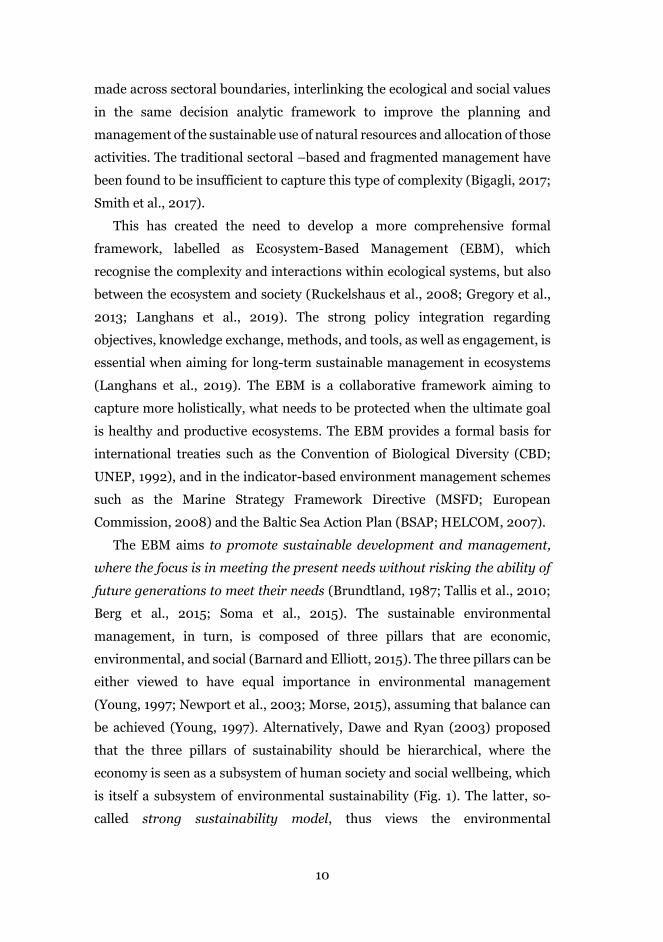
be achieved (Young, 1997). Alternatively, Dawe and Ryan (2003) proposed
that the three pillars of sustainability should be hierarchical, where the
economy is seen as a subsystem of human society and social wellbeing, which
is itself a subsystem of environmental sustainability (Fig. 1). The latter, so-
called strong sustainability model, thus views the environmental
11
sustainability as the ultimate limiting element, recognizing the healthy
environment is a prerequisite for social wellbeing and that the monetary
system is relevant only as part of the human society.
Thus, if following the strong sustainability model, environmental policy and
management should prioritize the ecological status to safeguard a liveable
Globe and preserve the services and benefits ecosystems provide for the
society (Borja et al., 2013, Borja et al., 2016). Environmental protection
requires the ability to quantitatively measure the current status of the system
in focus and describe the desirable and undesirable states of it. How these
tasks are executed may have a major impact on our judgements concerning
whether the exploitation of natural resources can be seen as sustainable or if
protective actions are needed. However, the management objectives can be
imprecise in their meaning, lacking quantitative description (Hugé et al., 2013;
Boyes et al., 2016), and eventually leaving a lot of room for interpretation and
thus complicate the mutual understanding between the parties involved.
Figure 1. The hierarchical, strong model of sustainable development. The relationship between the three pillars of sustainability objectives suggest that both economy and social wellbeing are constrained by environmental limits.
12
The main aim of this thesis is to recognize and analyse the role of values
and uncertainty associated with the target setting in environmental
management. Through one review article and two research articles
(appendices I-III), this thesis addresses the following research aims:
I. Defining appropriate indicators to judge whether the management
objectives are attained.
II. Clarifying the sufficiently good status of an indicator by acknowledging
and estimating uncertainty of the quantitative target level to be
achieved.
III. Acknowledging the role of valuation, i.e. to determine how the different
decision-criteria (i.e. attributes) can be weighted.
Article [I] takes a decision-analytic standpoint by discussing the ecological,
economic and sociocultural metrics for valuing biodiversity in
multidisciplinary environmental decision-making problems. The work
analyses the interplay between these three perspectives and suggests
integrating them into a multi-objective ecosystem-based management (EBM)
framework. In the end, a sequence of steps to follow when quantitatively
evaluating environmental management against biodiversity is proposed.
Article [II] studies the uncertainty associated with the indicator-based status
assessments, used to judge whether the management objectives are attained
(i.e. whether the “the Good Environmental Status” is attained or not). The
currently used indicator-based protocols (e.g. MSFD and BSAP) do not fully
acknowledge and estimate the uncertainty rising from different sources.
Therefore, this work aims to propose a Bayesian approach to define the
quantitative target level, i.e. boundary value between a desirable (Good
Environmental Status “GES”) and a non-desirable state (“Sub-GES”) and
assess the prevailing status of one ecological indicator, the abundance of perch
(Perca fluviatilis) - an indicator adopted by both BSAP and MSFD to represent
the status of coastal fish communities in the central and northern Baltic Sea.
Lastly, Article [III] focuses on the mutual weighting of multiple parallel
management objectives (i.e. decision-making criteria) - in this case ecological
13
attributes to be maintained as part of a marine spatial planning process. The
article presents an approach for incorporating stakeholder groups’ views into
the environmental planning and decision-making process. The study presents
a Bayesian approach to combine the variety of perceptions, quantifying the
uncertainty about the stakeholder group consensus and demonstrates how the
results can be integrated in a formal decision support model.
14
2 CONCEPTS AND METHODS
2.1 Decision-making and decision analysis
Environmental policy and management problems are inherently multifaceted
and wicked (Rittel and Webber 1973; Balint et al., 2011), and thus involve
inevitable compromises and uncertainties (Uusitalo et al., 2015) in different
parts of the rational decision-making process. In this thesis, formal decision
analysis is the key conceptual framework used to address decisions in a
systematic way (Keeney, 1982). Formal decision analysis identifies, represents
and formally evaluates all the aspects and consequences related to the
decision-making process (Howard, 1988). For example, regulatory bodies (e.g.
policy-makers, environmental permit authorities, environmental protection
agencies) i) grant permissions for developers (e.g. wind farm operator, a
dredging company, industrial plan) using ecosystems or ii) decide whether
remediation actions are needed to improve the status of the system (Boyes and
Elliott, 2014, 2015; Elliott, 2014). Formal decision analysis can assist in
selecting when to grant permission for actions, which action to select, or where
to allocate actions by integrating knowledge, and allows to acknowledge the
uncertainty and visualize the results (Barton et al., 2012; Lehikoinen et al.,
2014; Rahikainen et al., 2014). Therefore, it is a systematic quantitative
approach allowing mutual rating between different management strategies.
The key aim of formal decision analysis is to identify those actions or policies
that simultaneously maximize the expected utility and minimize the expected
risks and costs (Keeney, 1982; Burgman, 2005; Kiker et al., 2005).
To translate and communicate key features of complex environmental
management problems to regulatory bodies, researchers and other
stakeholders, a framework to conceptualize environmental management
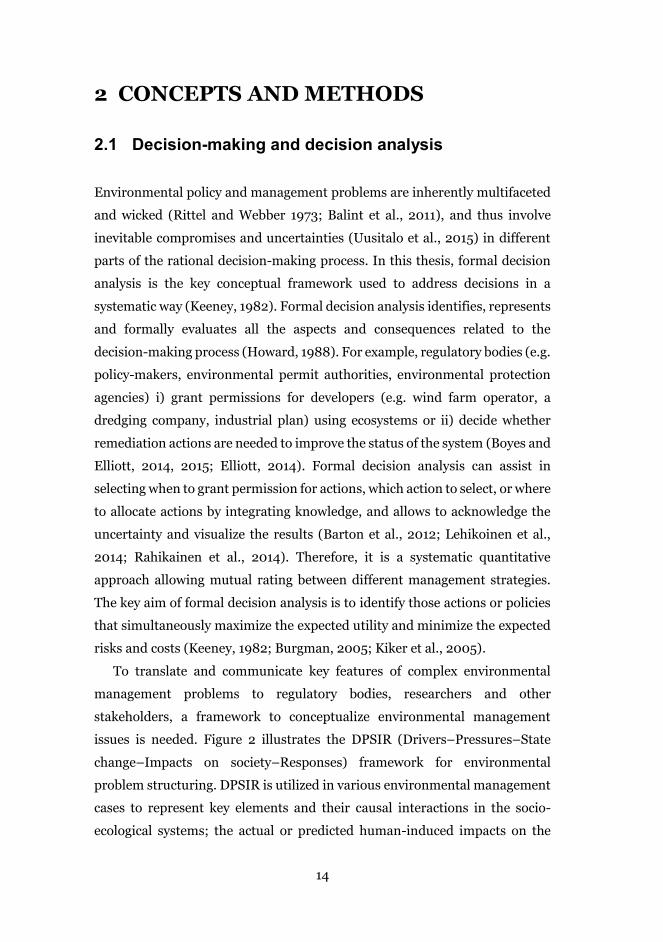
issues is needed. Figure 2 illustrates the DPSIR (Drivers–Pressures–State
change–Impacts on society–Responses) framework for environmental
problem structuring. DPSIR is utilized in various environmental management
cases to represent key elements and their causal interactions in the socio-
ecological systems; the actual or predicted human-induced impacts on the
15
environment and the interdependence of the components (Smeets and
Weterings, 1999; Atkins et al., 2011; Patrício et al., 2016a; Elliott et al., 2017).
The DPSIR framework assumes a chain of causal relations beginning with the
Drivers that are forces to motivate human activities related to the basic human
needs (e.g. food, air, drinking water, goods, and safety). These Drivers create
Pressures on the environment through different anthropogenic activities (e.g.
extraction of living resources, transportation, agriculture, and coastal
infrastructure) that directly or indirectly affect the State change of the
ecosystem (e.g. degrading habitats, reducing population size, changing
Box 1. Concepts related to the decision-making as they are denoted in this
summary.
Decision analysis: a normative practice of decision-making including
procedures, philosophies, methods, and tools for identifying, clearly
representing, and formally assessing important aspects of a decision. To define
formally optimal courses of actions by applying maximum expected utility
principle and to illustrate the outcome of the formal decision analysis for
decision makers and other agents. (Keeney, 1982; Howard,1988)
Decision theory: a theory of rational decision-making. Divided into two
disciplines: descriptive decision theory, which aims to analyses how people
actually make decisions, and normative decision theory, which aims to analyse
the outcomes of decisions or how people are required or ought to choose when
faced with decision problem. (Peterson, 2009)
Decision-making: a process of identifying and selecting between alternative
choices based on the values and views of a decision-maker. (Keeney, 1982; 1996)
Rational decision-making and planning model: a multi-step process for
making rationally sound decisions: 1) definition of the problems and objectives,
2) identification of alternative actions or policies, 3) evaluation of alternative
actions or policies, 4) implementation of decisions, and 5) monitoring of effects
of actions. (Taylor, 1998)
Multi-criteria decison analysis: an approach to consider multiple
potentially conflicting decision criteria in decision making. Helps a decision
maker to structure the problems and acknowledge other stakeholders’ values
and judgement (Belton and Stewart, 2002)
16
population structures and increasing eutrophication). The changes in the
ecosystems induce Impacts on society, meaning the human perspective on
how the loss or gain of the ecosystem status is valued. – Based on the Impacts
on society -element, the need for Responses is defined. These are management
measures or actions to mitigate or restore the ecosystem status via the links
between the Drivers, Pressures or State change.
The special focus of this thesis is to define the Impacts on society as this
element includes the decision criteria linked to the attainment of management
objectives (Fig. 2). When the observed (Article [II]) or predicted (Article [III])
changes in terms of decision criteria are quantified, this information can be
used to indicate the need for management measures and to search for optimal
management strategies. Indicators are technical tools used to quantitatively
measure the changes in target attributes. In order to use indicators to define
whether the objective is attained or not, the target level of the indicator needs
to be set. Depending on the target level, the quantitative boundary value
defines whether the measured prevailing status of the system is above or below
Figure 2. The DPSIR framework to structure problems in complex environmental management analysis. Representing the key theme in the focus of the thesis, the Impacts on society-element is highlighted.
17
the societally approved threshold level. However, as it is only possible to make
an estimation of the actual status by using selected indicators, the status
evaluations always includes uncertainty that should be acknowledged to avoid
the chance of misclassification of the status (Article [II]).
However, perspectives in valuing the changes are manifold. Different
ecological, economic or sociocultural viewpoints may rise when studying how
the society perceives the loss or gain in the state of a particular attribute used
as a decision criterion (Article [I]). Therefore, all variety of views should be
taken into account when aiming for a collectively fair and rational decision-
making process (Dietz, 2003). Also, when the attainment of the environmental
objectives is evaluated by using multiple, even contradictory, decision criteria,
it is challenging to avoid disagreement among the associated individuals and
parties. By analysing the level and type of the disagreement within and
between different stakeholder groups can help in identifying a collectively
more optimal management strategy (Article [III]).
2.2 Bayesian inference and decision support
As this thesis focuses on the heterogeneity of views, stochastic variability in
data and the following uncertainty in environmental management problems,
the Bayesian approach is a natural methodological choice. There are many
theoretical introductory books about Bayesian statistics that provide a basis
for the approach (e.g. Gelman et al., 2013; Kruschke, 2014; Blasco, 2017). In
Articles [II] and [III], the aim was to evaluate and acknowledge in the decision
analysis the uncertainty about unknown population parameters; related to the
target state between the desirable and undesirable environmental status [II]
and the opinions of the stakeholders [III], respectively. These methods are
widely used in the field of population analyses and fisheries stock assessments
(e.g. Michielsens et al., 2006; Mäntyniemi et al., 2013; 2015) where the
interest lies on those hidden population parameters that are not directly
observable. However, in the environmental status assessment and
participatory decision-making protocols these types of approaches to
18
acknowledge and estimate uncertainty about these hidden population
parameters is lacking.
In decision-making science, uncertainty is defined as a lack of exact
knowledge (Refsgaard et al., 2007; Ascough et al., 2008). There is extensive
literature on the categorization of different types of uncertainties (e.g. Walker
et al., 2003; Burgman, 2005; Refsgaard et al., 2007). Uncertainty is often
divided into three categories as epistemic, linguistic and aleatoric
uncertainties. Epistemic (knowledge) uncertainty reflects imperfect
knowledge, which could be reduced by further research and empirical studies.
Epistemic uncertainty can include uncertainty in systematic and measurement
errors, model uncertainty and subjective judgement. Linguistic uncertainty
arises as our natural language is not exact and is distributed into vagueness,
context dependence, ambiguity, indeterminacy and under specificity.
Aleatoric uncertainty rises from the inherent randomness and natural
variability of the system.
Bayesian inference applies the Bayes' theorem (Lunn et al., 2012; Gelman
et al., 2013) to update the beliefs concerning a hypothesis as more information
becomes available. The person implementing the analysis has to specify their
choices and prior assumption, in other words, the probability is handled as a
subjective degree of belief (Huber, 2005; Berger, 2006). These choices are
related to a) the exact model structure (the dependencies between the
parameters of interest, i.e. mean values and measures of variation), b) the type
of the distribution of the values within the parameter of interest (e.g. normal,
beta, etc.) and c) the prior knowledge (i.e. prior distributions describing the
level of knowledge about the parameter of interests before seeing the data)
(Kruschke, 2014).
In Bayesian inference, the initial knowledge (prior distribution) is updated
when more information (data, interpreted via the likelihood function)
becomes available, and thus creating the new updated knowledge about the
topic of interest (posterior distribution) (Gelman et al., 2013). Bayesian
inference computes the posterior probability according to Bayes' theorem,
which can be written mathematically as
19
𝑝(𝜃|𝑦) =𝑝(𝑦|𝜃)𝑝(𝜃)
𝑝(𝑦)(1)
, where θ refers to our parameters of interest, in other words, some event or
hypothesis we want to learn about, and y is the observable data. Therefore,
𝑝(𝜃) and 𝑝(𝜃|𝑦) are the prior (“probability of the hypothesis before
introducing the new data”) and posterior (“probability of the hypothesis,
given the new data”) parameter distributions, respectively, and the term
𝑝(𝑦|𝜃) denotes the probability density of data y given the parameters θ. The
term 𝑝(𝑦) = ∫ 𝑝(𝑦|𝜃)𝑝(𝜃)𝑑𝜃 is the marginal (predictive) probability of y to
evaluate how probable is the new data under all possible hypotheses. Thus,
𝑝(𝑦) acts as normalizing constant ensuring that 𝑝(𝜃|𝑦) is a valid probability
distribution integrating to 1.
Adding prior information is a unique feature of Bayesian statistical
inference, which allowsthe use of available knowledge about the subject before
collecting new data (Ellison, 2004; Van Dongen, 2006). Therefore, any
knowledge about the subject beforehand should be given as prior distribution.
Priors are given as probability distribution incorporating the related
uncertainty of each parameter. These express how much is known about the
subject before the evidence is disclosed. The level of prior knowledge can vary
from fully informative (i.e. having exact knowledge of the subject) to
uninformative (i.e. maximal uncertainty, where all the possible outcomes are
equally likely) (Van Dongen, 2006). When the previous publications, expert
knowledge or data of the subject are lacking and it is preferred to have a prior
with minimal influence on our inference, an uninformative prior is typically
selected. Then the aim is to maximize the role of the observed data in the
estimated parameters compared to the priors (Van de Schoot et al., 2014). The
interpretation of data is controlled by the prior knowledge about the link
between parameters 𝜃 and data 𝑦, which is encoded in 𝑝(𝑦|𝜃) (Equation 1).
The key difference between Bayesian and frequentist statistics is how the
probability is utilized and introduced. Bayesian statistics gives probabilities
for both hypotheses and data but both Bayesians and frequentists assume that
the specified hypothesis (parameter specifying the conditional distribution of
the data) is true and that the observed data is sampled from that conditional
20
distribution (Ellison, 2004; Blasco, 2017). If the interest lies in the estimation
of uncertainty about a parameter of interest, it can be achieved using the
Bayesian approach. Conversely, the frequentist approaches, including
bootstrapping, provide measures of uncertainty (e.g. standard error of the
sample mean) about potential values of point estimators of the parameter of
interest under an assumed true value for the parameter of interest. These lack
the quantitative measures of uncertainty about the parameter of interest itself.
Even if the population mean was known exactly, the potential point estimators
still have non-zero variance.
The inherent subjectivity of the Bayesian inference has been used as an
argument against the Bayesian approach (Van Dongen, 2006; Senn, 2011;
Blasco, 2017). However, scientists who utilize frequentist statistics also use
varying levels of (hidden) prior knowledge when comparing and discussing
their results against the results from previous studies (Blasco, 2017).
Therefore, when we draw conclusions from our results, based on either
Bayesian or frequentist statistics, we do not base on only our data but also on
the previous results. However, in Bayesian inference, the prior information is
an explicit part of the analysis, which is more transparent and also more
objective than qualitative comparison.
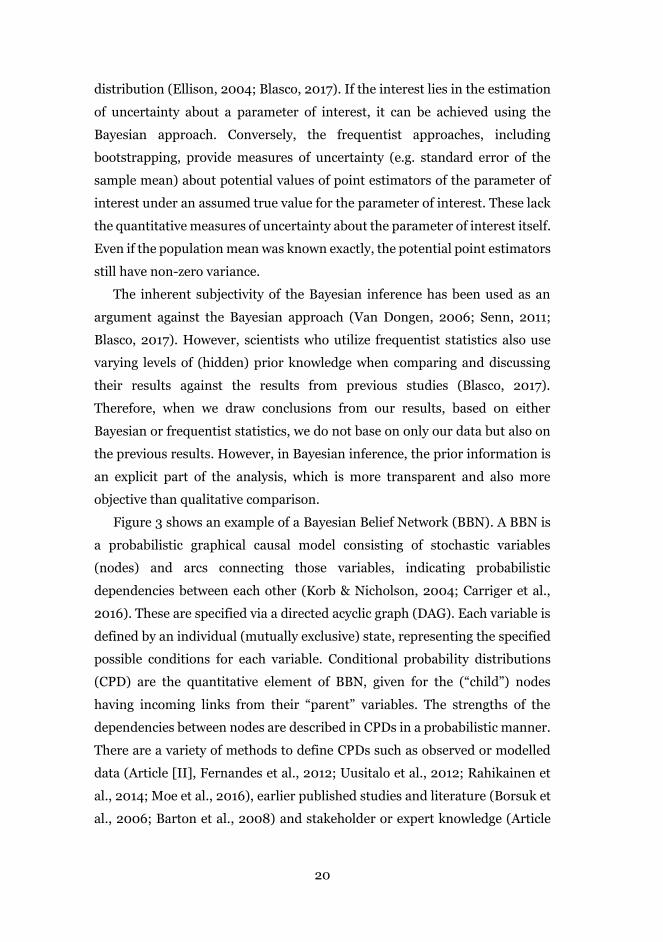
Figure 3 shows an example of a Bayesian Belief Network (BBN). A BBN is
a probabilistic graphical causal model consisting of stochastic variables
(nodes) and arcs connecting those variables, indicating probabilistic
dependencies between each other (Korb & Nicholson, 2004; Carriger et al.,
2016). These are specified via a directed acyclic graph (DAG). Each variable is
defined by an individual (mutually exclusive) state, representing the specified
possible conditions for each variable. Conditional probability distributions
(CPD) are the quantitative element of BBN, given for the (“child”) nodes
having incoming links from their “parent” variables. The strengths of the
dependencies between nodes are described in CPDs in a probabilistic manner.
There are a variety of methods to define CPDs such as observed or modelled
data (Article [II], Fernandes et al., 2012; Uusitalo et al., 2012; Rahikainen et
al., 2014; Moe et al., 2016), earlier published studies and literature (Borsuk et
al., 2006; Barton et al., 2008) and stakeholder or expert knowledge (Article
21
[III], O'Hagan et al., 2006; Mäntyniemi et al., 2013; Shaw et al., 2016). BBN
can also be used for predictive inference from causes to their likely
consequences, diagnostic inference from consequences to their likely causes,
and omnidirectional mixed inference (Korb & Nicholson, 2004; Carriger et al.,
2016).
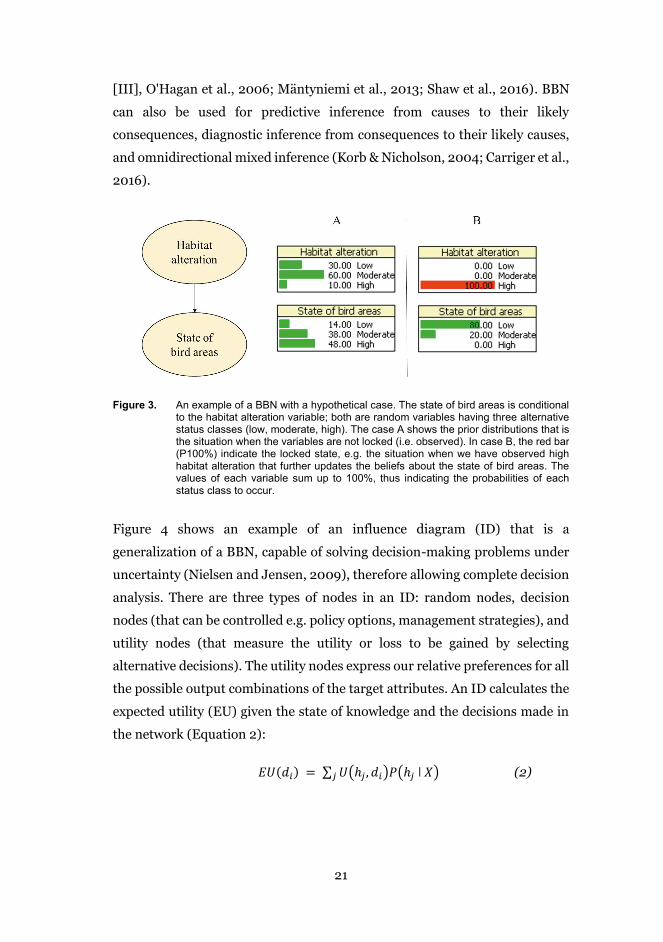
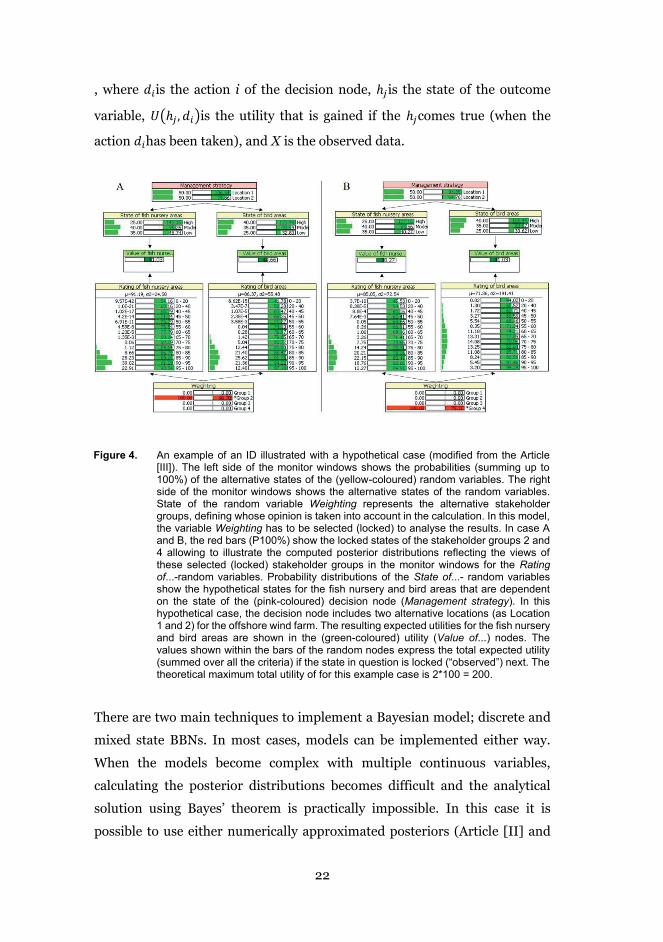
Figure 4 shows an example of an influence diagram (ID) that is a
generalization of a BBN, capable of solving decision-making problems under
uncertainty (Nielsen and Jensen, 2009), therefore allowing complete decision
analysis. There are three types of nodes in an ID: random nodes, decision
nodes (that can be controlled e.g. policy options, management strategies), and
utility nodes (that measure the utility or loss to be gained by selecting
alternative decisions). The utility nodes express our relative preferences for all
the possible output combinations of the target attributes. An ID calculates the
expected utility (EU) given the state of knowledge and the decisions made in
the network (Equation 2):
𝐸𝑈(𝑑𝑖) = ∑ 𝑈(ℎ𝑗, 𝑑𝑖)𝑃(ℎ𝑗 ǀ 𝑋)𝑗 (2)
Figure 3. An example of a BBN with a hypothetical case. The state of bird areas is conditional to the habitat alteration variable; both are random variables having three alternative status classes (low, moderate, high). The case A shows the prior distributions that is the situation when the variables are not locked (i.e. observed). In case B, the red bar (P100%) indicate the locked state, e.g. the situation when we have observed high habitat alteration that further updates the beliefs about the state of bird areas. The values of each variable sum up to 100%, thus indicating the probabilities of each status class to occur.
22
, where 𝑑𝑖is the action i of the decision node, ℎ𝑗is the state of the outcome
variable, 𝑈(ℎ𝑗 , 𝑑𝑖)is the utility that is gained if the ℎ𝑗comes true (when the
action 𝑑𝑖has been taken), and X is the observed data.
There are two main techniques to implement a Bayesian model; discrete and
mixed state BBNs. In most cases, models can be implemented either way.
When the models become complex with multiple continuous variables,
calculating the posterior distributions becomes difficult and the analytical
solution using Bayes’ theorem is practically impossible. In this case it is
possible to use either numerically approximated posteriors (Article [II] and
Figure 4. An example of an ID illustrated with a hypothetical case (modified from the Article [III]). The left side of the monitor windows shows the probabilities (summing up to 100%) of the alternative states of the (yellow-coloured) random variables. The right side of the monitor windows shows the alternative states of the random variables. State of the random variable Weighting represents the alternative stakeholder groups, defining whose opinion is taken into account in the calculation. In this model, the variable Weighting has to be selected (locked) to analyse the results. In case A and B, the red bars (P100%) show the locked states of the stakeholder groups 2 and 4 allowing to illustrate the computed posterior distributions reflecting the views of these selected (locked) stakeholder groups in the monitor windows for the Rating of...-random variables. Probability distributions of the State of...- random variables show the hypothetical states for the fish nursery and bird areas that are dependent on the state of the (pink-coloured) decision node (Management strategy). In this hypothetical case, the decision node includes two alternative locations (as Location 1 and 2) for the offshore wind farm. The resulting expected utilities for the fish nursery and bird areas are shown in the (green-coloured) utility (Value of...) nodes. The values shown within the bars of the random nodes express the total expected utility (summed over all the criteria) if the state in question is locked (“observed”) next. The theoretical maximum total utility of for this example case is 2*100 = 200.
23
[III]) or discretized distributions (Article [III]). In many models, using
discrete BBN models can be inadequate as discretizing variables results in
information being lost, conditional probability tables can become too large, or
the network with multiple variables linked to each other can become too
substantial, as the variety of tools to create discrete BBN can be insufficient
(Korb and Nicholson, 2004). Monte Carlo simulation is a common way to
numerically approximate the posterior distribution by using randomly drawn
values from the posterior distribution (Gilks et al., 1996). Therefore, the
posteriors for the parameters can be estimated using Monte Carlo Markov
Chain (MCMC) sampling with tools such as WinBUGS, OpenBUGS, and JAGS.
Discrete BBN tools, such as Hugin software, can use continuous variables only
when Gaussian (normal) distribution is used and a continuous node cannot be
a parent of a discrete child node or used in IDs. The Bayesian models in this
thesis have been analysed using Markov Chain Monte Carlo (MCMC)
simulation methods with OpenBUGS (Spiegelhalter et al., 2007; Article [III])
and JAGS (Plummer 2003; Article [II]) software and discrete BBN with Hugin
(Madsen et al., 2005; Article [III]) software.
24
3 RESULTS AND CONTRIBUTIONS
The following chapters approach these questions from the multidisciplinary
and probabilistic standpoint, providing novel ideas and tools.
3.1 Selection of suitable indicators (Article [I])
When the qualitative verbal management objectives are set as “Maintaining
biodiversity”, “Sustainable development” or “Good Environmental Status”,
what do these mean precisely and how do we know when we have attained
these objectives? The ambiguity of the definition can lead to difficulties in
societal discourse and attaining common regional and international objectives
(Borja et al., 2013). Using formal decision analysis requires that the objectives
have measurable attributes that clearly reflect the attainment of the
management objective. Thus, the attributes should be described in a
quantitative and structured way, in order to define management objectives
and assess the performance of environmental management (Rossberg et al.,
2017). Selected attributes should capture dependencies of the system under
study, i.e. to define how the direct and indirect pressures of the alternative
management strategies are assumed to impact these attributes. However, to
be able to measure the changes in attributes, quantitative indicators or metrics
should be defined (Borja et al., 2013). Indicators are useful tools providing
information about the current state and the changes of the selected attributes
to the decision-makers as well as to society (Coll et al., 2016; Siddig et al.,
2016). In the decision analysis, indicators can be used to better understand the
causalities between the selected management activities and the environment
(Coll et al., 2016; Olander et al., 2018).
Article [I] focuses on the management objective to maintain biodiversity,
as it is one of the most important management objectives outlined in different
international treaties such as the CBD (UNEP, 1992), in European Union (EU)
legislations such as the Birds Directive (EEC, 2009), the Habitats Directive
(ECC, 1992), as well as in the indicator-based management schemes such as
Water Framework Directive (WFD; European Commission, 2000), BSAP
25
(HELCOM, 2007) and MSFD (European Commission, 2008). However,
despite the wide-scale international efforts to implement policies and
legislations that set objectives and guidance to protect the vulnerable species
and habitats, global biodiversity is constantly declining in an accelerating rate
(Fraixedas et al., 2019; Langhans et al., 2019). Biodiversity represents the
diversity of life on Earth, thus it is a complex issue connecting different levels
from genes to species (Féral, 2002), their functional forms and adaptations
(Flynn et al., 2011), to the habitats and ecosystems together, not forgetting the
variability within and between them (Whittaker, 1960, Magurran, 2004).
There is considerably evidence that loss of biodiversity causes massive
degradation of ecosystems (Pinto et al., 2014; Castello et al., 2016; Johnson et
al., 2017), as well as the ecosystem functioning, stability, productivity, and
services they provide (Cardinale et al., 2012; Isbell et al., 2017). Consequently,
maintaining biodiversity is not just ecological, but also an economic and
sociocultural matter.
Article [I] took a decision analytic viewpoint on quantitatively evaluating
the environmental management against the loss or gain in biodiversity. Using
the DPSIR framework, the likely impact of the alternative environmental
management action on biodiversity is represented by the State change –
element (Fig. 2) that could refer to the change in the ecological attributes.
Furthermore, the Impacts on society- element includes the human
perspective, thus determining the degree of the impact on the societal
preferences, i.e. how the society values or weighs the loss or gain in the
decision criteria defined by these attributes (Fig. 2). Thus, Article [I] analysed
the economic, sociocultural and ecological indicator approaches for measuring
the value of biodiversity in environmental management.
In monetary valuation, the impact of change in biodiversity by
implementing alternative management actions are quantified by economic or
human welfare values. The economic perspective can offer globally
comparative values and provides the link between the environmental problem
and political decision-making processes (TEEB, 2010a). Ecosystem services,
i.e. the benefits people extract from ecosystems, are one way to quantify
biodiversity in economic terms (Lamarque et al., 2011, Mace et al., 2012).
26
Ecosystem services can be divided into provisioning (e.g. production of food
and water), regulating and maintenance (e.g. natural hazard regulation, water
purification, pest control) and cultural services (e.g. spiritual, recreational,
historical, scientific) (Haines-Young and Potschin, 2018). Therefore, the role
of biodiversity in ecosystem services can be either a regulator of ecosystem
processes, a final ecosystem service or a good (Mace et al., 2012).
However, the sociocultural values can alternatively provide information on
how nature is appreciated without any link to the monetary value. Local people
may have cultural or spiritual values for ecological components or regions
(TEEB, 2010b) that provide different ethical and cultural values and mental
well-being for the society (Christie et al., 2012; James et al., 2013). For
instance, the knowledge and values from indigenous people can widen the
scope and the objective setting of environmental management (Parviainen et
al., 2019). For instance, Article [III] demonstrates how societal values can be
incorporated in the decision analysis model to be used as a decision criteria to
improve mutual understanding in environmental decision-making. However,
the distinction between the economic or human welfare and societal wellbeing
is not always straightforward. The social values and more importantly social
wellbeing related to the cultural ecosystem services are understudied as the
services are usually valued only in economic terms (Schmidt et al., 2016).
In sustainable environmental management, the ecological value forms the
foundation when measuring whether the management objectives are met or
not (Fig. 1). The ecological aspect can be measured by using classical
biodiversity indices that describe the richness and distribution of species (e.g.
the Shannon–Weiner diversity and the Berger–Parker indices [Hill, 1973],
Pielou’s evenness index [Pielou, 1969]). When we set target states for these
indices, it defines the minimum level of biodiversity that society seeks to
preserve. Thus, setting target states denotes the first social aspects of the
decision analysis to determine whether the satisfactory level of biodiversity is
achieved or not. To capture the complexity of the ecological system, Table 2 in
Article [I] shows more holistic eco-social approaches that integrate the weights
and target level setting by the expert or stakeholder together with estimates of
the functional and structural status of the systems.
27
Article [I] suggests integrating these three perspectives of valuing
biodiversity into a multi-objective EBM framework to consider the
comprehensive ecological status as well as the economic and sociocultural
importance of a healthy ecosystem. In the proposed holistic decision-making
process, sociocultural values could indicate the ecological target attributes and
ecosystem services that are most significant for society, whereas a price on loss
or gain of biodiversity could provide globally more comparative and plausible
values. Ecological indicators could be used as a basis of the decision analysis
offering quantitative measures and threshold values that inform about the role
of biodiversity in the health of ecosystems. However, to integrate these three
perspectives into a single decision analytic framework can be challenging and
requires a lot of data and complicated integrative models from both the
ecological impacts and monetary values together with the costs of
implementing the management measures.
3.2 Sufficiently good status of an indicator (Article [II])
Society selects different ecological, economic and sociocultural indicators
outlining what an appropriately good status of the environment should look
like and when the management objectives are attained (Article [I]). Next, after
an appropriate set of indicators are selected, there is a need for further study
on what these indicators actually measure and how much uncertainty is
related to these measurements.
In the status evaluation schemes such as WFD (European Commission,
2000), BSAP (HELCOM, 2007) and MSFD (European Commission, 2008),
ecological indicators are commonly utilized approaches to use information
from the monitoring programs that assess trends and changes in system over
time (Danovaro et al., 2016). The information is used in the indicator-based
approaches to compare the prevailing status of a system to a reference
condition or value assumed to reflect sustainable conditions, and thus denote
the target state of the ecosystem. Thus, according to the MSFD, based on the
target state, the boundary value differentiating the desirable (Good
28
Environmental Status “GES”) from the undesirable (“Sub-GES”) states of the
system, is defined.
However, it is not straightforward to set the boundary value of an indicator
to be used in decision-making due to imperfect knowledge about the actual
status of a system. The sources of uncertainty when making inferences about
the actual state of a system are manifold. Natural processes cause variation
due to abiotic (e.g. temperature, precipitation) and biotic (e.g. predation,
cohort-dynamics) factors, in contrast to human-induced variation due
processes such as climate change, eutrophication and introduction of invasive
species. Additionally, sampling procedures involve multiple sources of errors
linked to the estimation of the actual state of a system, due to natural variation
between the sampling sites, differences in sampling protocols and inadequate
sampling effort (Borja et al., 2014; Carstensen & Lindegarth, 2016; Wach et
al., 2019).
Uncertainty related to indicator values have been studied earlier (Balsby et
al., 2013; Lehikoinen et al., 2014; Probst, 2017), however, in these studies the
definition of the boundary value(s), have been considered as fixed, lacking the
estimates of uncertainty. Article [II] claims that acknowledging the
uncertainty related to the boundary value of an indicator is also significant, as
it sets criterion that is used when evaluating the need for management and
conservation decisions, as well as the level of sustainable use of the ecosystem
services. For instance, if the uncertainty is not acknowledged and handled
properly, the state of an indicator can be misclassified as desirable, when in
reality it is not, leading to wrong management actions to be taken (Moe et al.,
2015).
Thus, Article [II] presented a Bayesian approach to status evaluation that
was applied to an ecological indicator currently used in the regional status
assessment in the Baltic Sea, ‘Abundance of coastal key fish species’
(HELCOM, 2018). Bayesian statistics is proposed as it estimates the epistemic
uncertainty about the unknown parameter, i.e. the true state of the system.
The true state of the system is always a hidden variable that cannot be directly
observed but represents the ultimate variable of interest. As a first step, this
developed approach studied the variation of the population abundance index
29
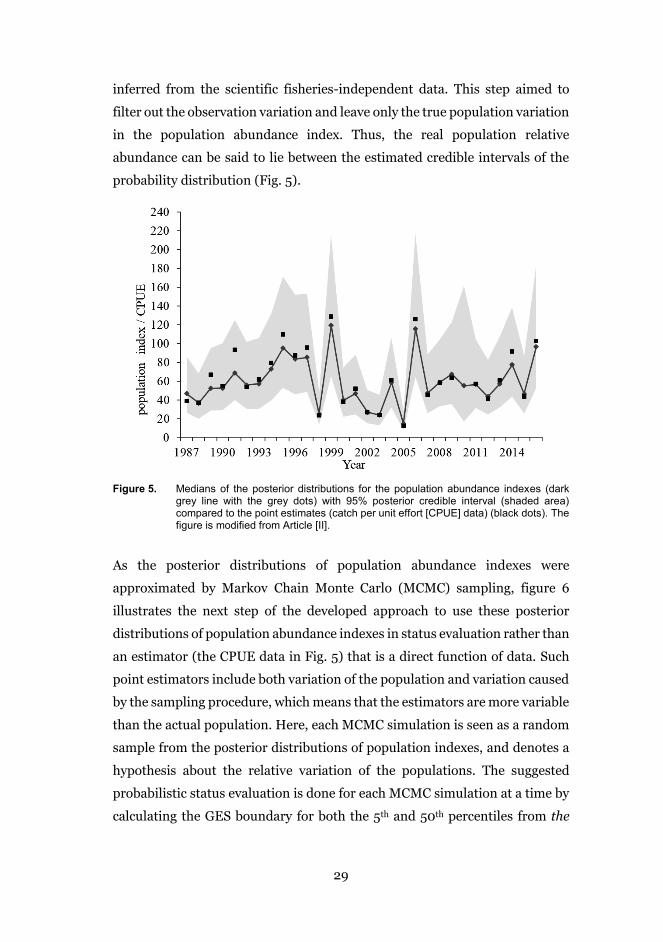
inferred from the scientific fisheries-independent data. This step aimed to
filter out the observation variation and leave only the true population variation
in the population abundance index. Thus, the real population relative
abundance can be said to lie between the estimated credible intervals of the
probability distribution (Fig. 5).
As the posterior distributions of population abundance indexes were
approximated by Markov Chain Monte Carlo (MCMC) sampling, figure 6
illustrates the next step of the developed approach to use these posterior
distributions of population abundance indexes in status evaluation rather than
an estimator (the CPUE data in Fig. 5) that is a direct function of data. Such
point estimators include both variation of the population and variation caused
by the sampling procedure, which means that the estimators are more variable
than the actual population. Here, each MCMC simulation is seen as a random
sample from the posterior distributions of population indexes, and denotes a
hypothesis about the relative variation of the populations. The suggested
probabilistic status evaluation is done for each MCMC simulation at a time by
calculating the GES boundary for both the 5th and 50th percentiles from the
Figure 5. Medians of the posterior distributions for the population abundance indexes (dark grey line with the grey dots) with 95% posterior credible interval (shaded area) compared to the point estimates (catch per unit effort [CPUE] data) (black dots). The figure is modified from Article [II].
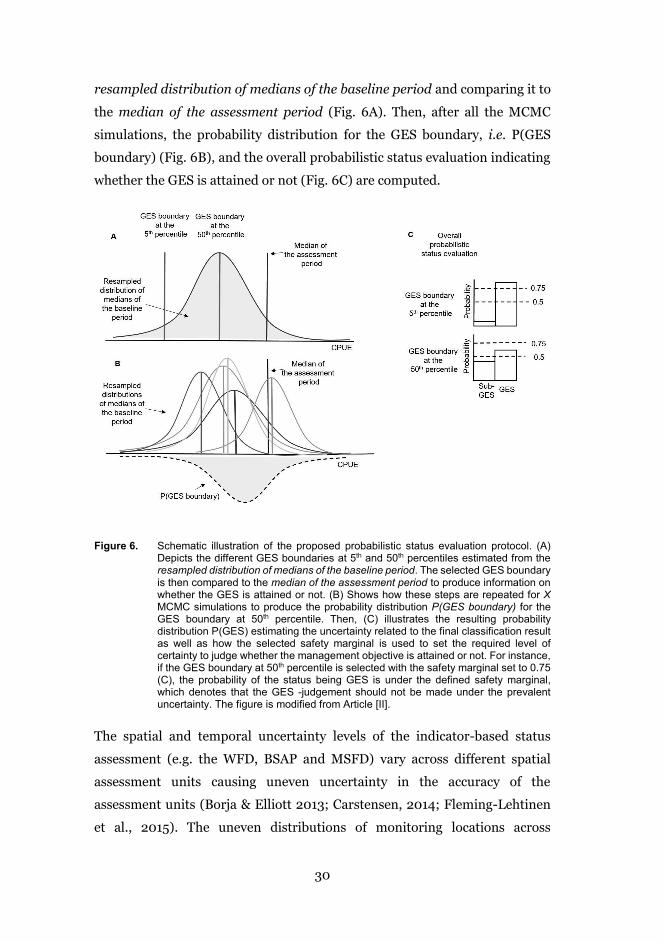
30
resampled distribution of medians of the baseline period and comparing it to
the median of the assessment period (Fig. 6A). Then, after all the MCMC
simulations, the probability distribution for the GES boundary, i.e. P(GES
boundary) (Fig. 6B), and the overall probabilistic status evaluation indicating
whether the GES is attained or not (Fig. 6C) are computed.
The spatial and temporal uncertainty levels of the indicator-based status
assessment (e.g. the WFD, BSAP and MSFD) vary across different spatial
assessment units causing uneven uncertainty in the accuracy of the
assessment units (Borja & Elliott 2013; Carstensen, 2014; Fleming-Lehtinen
et al., 2015). The uneven distributions of monitoring locations across
Figure 6. Schematic illustration of the proposed probabilistic status evaluation protocol. (A) Depicts the different GES boundaries at 5th and 50th percentiles estimated from the resampled distribution of medians of the baseline period. The selected GES boundary is then compared to the median of the assessment period to produce information on whether the GES is attained or not. (B) Shows how these steps are repeated for X MCMC simulations to produce the probability distribution P(GES boundary) for the GES boundary at 50th percentile. Then, (C) illustrates the resulting probability distribution P(GES) estimating the uncertainty related to the final classification result as well as how the selected safety marginal is used to set the required level of certainty to judge whether the management objective is attained or not. For instance, if the GES boundary at 50th percentile is selected with the safety marginal set to 0.75 (C), the probability of the status being GES is under the defined safety marginal, which denotes that the GES -judgement should not be made under the prevalent uncertainty. The figure is modified from Article [II].
31
European Seas (Patrício et al., 2016b) may lead to a lack of appropriate data
for the assessments and difficulties in to the use of agreed indicators for
instance in the MSFD. As Bayesian inference gives probabilistic uncertainty
estimates for the parameters of interest based on the available data (McNeish,
2016), Article [II] proposes to use this type of approach in areas where the
systematic monitoring and time-series data are relatively shorter or
discontinuous.
To define the target level and set the corresponding boundary value for an
ecological indicator can be difficult due to the uncertainty about the actual
status of the system. The results of Article [II] shows how the Bayesian
inference can be used to infer the level of knowledge we actually have, when it
comes to the hidden GES boundary value. The developed probabilistic GES
boundary allows holistic acknowledgement of the epistemic uncertainty
arising from the variation related to the observation process and thus reduce
the risk of misclassification. When the uncertainty behind the classification
result is transparently presented to the decision-makers it may lead to more
transparent and better-informed decision-making. In addition to this, the
probability distribution of the GES boundary requires the decision-makers to
state the acceptable level of risk for the potential misclassification, thus being
transparent about their risk attitude (Fig. 6C). As the information concerning
the amount and type of uncertainty may alter the risk attitude (Chow and
Sarin, 2002), it can have an impact on the conservation or restoration
decisions based on the indicator-based status assessments. Thus, the risk
attitude plays significant part in the decision-making process, as it may affect
the decision-maker’s definition of the need for management actions
(Burgman, 2005; Keith, 2009; Brunette et al., 2017).
Consequently, with the probabilistic classification result, the decision-
makers have to make a statement regarding the acceptable safety marginal for
the risk of misclassification of an indicator’s status. The probabilistic safety
marginals have been also used e.g. in the management of the Baltic salmon
(Salmo salar) stocks (Kuikka et al., 2014; ICES, 2019). The safety marginal
operates behind the final judgement of the decision-maker, setting the
required level of certainty to judge whether the management objective is
32
attained or not. For instance, when the safety marginal is set to 0.75, GES
would be achieved with the minimum probability of 0.75 (Figure 6C).
Article [II] also highlighted the importance to recognize the ways in which
the uncertainty in the environmental management process is communicated.
However, the uncertainty in the status evaluation should not be taken as a sign
for inaction or hesitation to proceed with management measures; instead, it
should be seen as a call for more information (De Santo, 2010). Even though
the remediation measures are costly, neglecting them due to uncertain results
can cause even higher expenses (Nygård et al., 2016).
3.3 The role of values in multi-criteria decision-making (Article [III])
Whether the respondent would be a member of the public, industry, or
government party, protecting, enhancing and sustainably managing
environmental resources is seen as an extremely important process. However,
environmental management problems are usually wicked and thus lack a
unanimous definition (Rittel and Webber 1973). Therefore, while
management objectives to protect and enhance the environment are
ambitious, the meaning for different stakeholders is not the same (Voinov,
2017). Participatory modelling involving multiple stakeholders in the process
of formal decision analysis can be a useful approach when dealing with wicked
problems (Voinov et al., 2016; Voinov, 2017). Participatory modelling can
increase transparency and improve the mutual understanding between
participants (Voinov and Bousquet, 2010; Voinov et al., 2016). When decision-
making aims for a collectively fair outcome, any stakeholder who has an
interest or is affected by the management decisions should be heard (Dietz,
2003; Gopnik et al., 2012). When multiple stakeholders are involved in
decision-making, interdependencies and power relationships among the
participants become significant, which can have an impact on the overall
process (Kørnøv and Thissen, 2000). Even though all the views should be
considered, it may not always be possible or even necessary to weigh them
equally (Dietz, 2003). Society’s commitment to management decisions have
33
found to affect the level on which the new regulations and rules are followed,
and thus affect the effectiveness of the management (Jones et al., 2011;
Haapasaari et al., 2012).
In a specific decision-making problem, the attributes that are affected by
the decisions and thus should be protected are needed to be specified.
Therefore, to be able to rank the alternative management actions or policies
between each other, the weigh or value for each of the attributes should be
provided. Even when there are two contrasting ecological attributes (e.g. fish
nursery area and important bird area), the information of their ecological
characteristics such as vulnerability, conservation status or abundance is
needed to be able to select the action that provides the highest utility. In turn,
the decision analysis becomes more complicated when the economic or
sociocultural aspects are included in the analysis as required in the EBM
framework.
The role of valuation has a significant role in participatory decision-
making, as the perceived utility or harm is always perspective-dependent and
thus the defined decision criteria reflect the views who have set them up
(Schiller et al., 2001). Stakeholder involvement often creates several,
contradictory decision criteria to evaluate whether the management objective
is attained or not. Thus, when several decision criteria are set, there is a need
to determine how and from which perspective the decision criteria should be
weighted in relation to each other. The Multi-Criteria Decision Analysis
(MCDA) is an approach used to frame decision-making problems with
multiple decision criteria to measure the level of attainment of the
management objectives (Huang et al., 2011). However, the inevitable trade-
offs in environmental MCDA easily lead to conflicts, as the society’s voice is
not uniform because divergent stakeholder groups have their opposing views
and interests towards the services and benefits ecosystems provide
(Langemeyer et al., 2016).
34
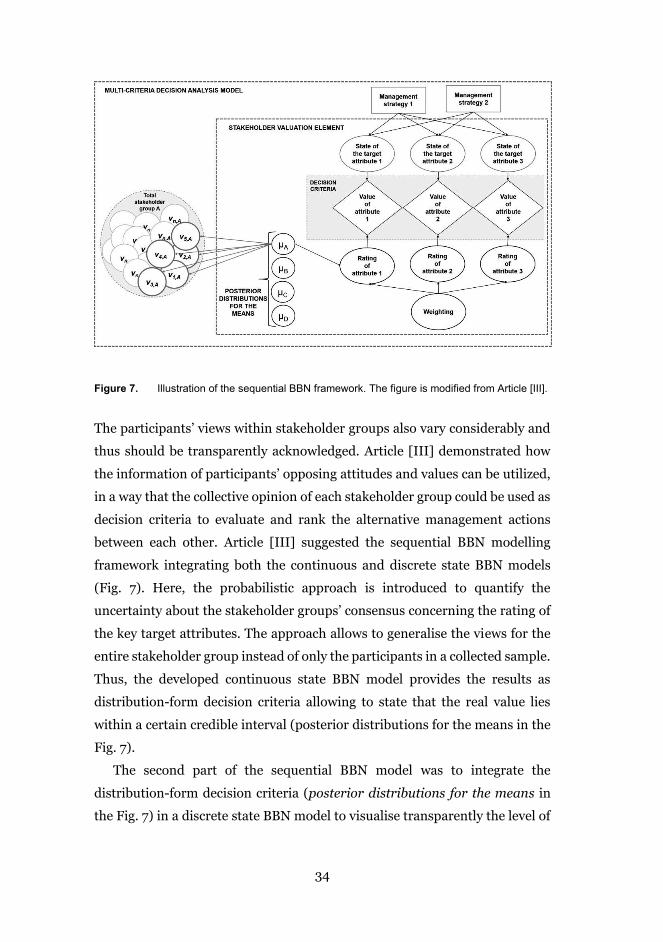
The participants’ views within stakeholder groups also vary considerably and
thus should be transparently acknowledged. Article [III] demonstrated how
the information of participants’ opposing attitudes and values can be utilized,
in a way that the collective opinion of each stakeholder group could be used as
decision criteria to evaluate and rank the alternative management actions
between each other. Article [III] suggested the sequential BBN modelling
framework integrating both the continuous and discrete state BBN models
(Fig. 7). Here, the probabilistic approach is introduced to quantify the
uncertainty about the stakeholder groups’ consensus concerning the rating of
the key target attributes. The approach allows to generalise the views for the
entire stakeholder group instead of only the participants in a collected sample.
Thus, the developed continuous state BBN model provides the results as
distribution-form decision criteria allowing to state that the real value lies
within a certain credible interval (posterior distributions for the means in the
Fig. 7).
The second part of the sequential BBN model was to integrate the
distribution-form decision criteria (posterior distributions for the means in
the Fig. 7) in a discrete state BBN model to visualise transparently the level of
Figure 7. Illustration of the sequential BBN framework. The figure is modified from Article [III].
35
disagreement or agreement regarding the decision criteria (Stakeholder
valuation element in the Fig. 7). For instance, researchers and non-
governmental organizations may have contradictory views on how the
decision criteria should be valued or weighed, related to other stakeholder
groups whose views can be influenced by different economic, ecological or
sociocultural perspectives. The graphical tool developed utilizing the Hugin
software, provides a transparent and interactive presentation to support
discussion between stakeholder groups and learn more about each other's
thinking.
Furthermore, Article [III] demonstrated how the Stakeholder valuation
element could function as a part of a MCDA model. Here, the Stakeholder
valuation element was extended to an ID by adding two decision nodes. As
part of a MCDA, the valuation element can be used as decision criteria, in a
probabilistic evaluation of the alternative strategies, guiding managers to
select socially more optimal and acceptable solutions by comparing the views
from different stakeholders. As a hypothetical example, a manager could have
a situation where the decision-making includes the selection between two
alternative routes (as Route 1 and 2) for the maritime traffic (Management
strategy 1 in Fig. 7). Both of the routes could create divergent pressures on the
environment, which then could cause changes in the environment status
(State of target attribute 1, 2 and 3 in Fig. 7). Thus, the manager could select
the route that causes less harm for the environment and society, i.e. providing
the highest total expected utility. Alternatively, the manager might need to find
the most optimal solution between the two (or more) parallel management
strategies, for instance, Management strategy 1 together with Management
strategy 2, which could include two alternative locations (as Location 1 and 2)
for the offshore wind farm (Fig. 7). The selection between the alternative
strategies could create a decision-making dilemma as Location 1 could be in
the same vicinity of Route 1 when the decision could be either to centralize the
actions and consequently cause higher pressure in one location but
alternatively keep other areas untouched. Another possibility could be to
distribute the activities where the pressure per area is lower but allocated to a
larger area.

36
Using the stakeholder valuation element, managers could analyse whether
the centralized allocation of pressure is a more socially optimal decision than
distributing the actions (Article [III]). As wicked environmental management
problems are challenging to solve, the developed approach offers a transparent
way to find a solution that represents the optimal compromise in the presence
of potentially conflicting objectives.
37
4 DISCUSSION
This thesis elaborates on the important question how – in the presence of
uncertainties arising from numerous sources, combined with varying ways of
interpretation and prioritization by people - society can define whether its
environmental quality objectives are met and consequently, whether actions
for attaining them in the future are needed. Through one review article and
two research articles, the thesis explores this question by drawing special
attention to multidisciplinary approaches, acknowledging the interplay of the
environmental data and human values behind the environmental decision-
making processes. To tackle the uncertainties, special effort is put on applying
Bayesian modelling methods and normative decision theory to approach the
presented question and to develop tools that could advance informed and
collectively good environmental decision-making.
Rationality in decision-making can be viewed as the rationality of the
procedure (i.e. defining the objectives, identifying and evaluating alternative
actions or policies to implementation and monitoring) or as the rationality of
the process outcome (i.e. selection of the alternative that maximizes the utility)
(Kørnøv and Thissen, 2000). Rationality in the procedure does not always
result in rational and satisfying outcomes due to imperfect knowledge,
multiple preferences and unrecognized values, as well as potentially irrational
human behaviour (Kørnøv and Thissen, 2000). These can even cause the
rejection of the illogical or unclear outcome (Calabretta et al., 2017). This
thesis developed methods to support the rational outcome.
Ecological indices, based on monitoring data and statistics, can be used as
target attributes in environmental quality assessments. However, the indices
as such may be inadequate measures to support decision-making, as in the
presence of multiple target attributes there is a need to take a stand on their
mutual weighting (Ruiz-Frau et al., 2011; Kobryn et al., 2018), which means
value statements have to be brought in. For example, an endangered species
may for ecological reasons be valued higher than a least-concern species; that
is, higher diversity of species leads to more resilient ecosystems, thus the loss
of species is something to be avoided (Ihaksi et al., 2011). However,
38
endangered species can also be valued from an ethical viewpoint, that is,
humans have no right to destroy species. Some species may matter to people
in monetary terms. For instance, fishermen’s livelihood is tightly linked to
healthy fish populations. At the same time, the same fish may have high
sociocultural importance in terms of e.g. the cultural heritage of fishing and
the local communities built on it (Reed et al., 2013; Acott et al., 2014; Ignatius
et al., 2019). When conducting the literature review and analysis for Article [I],
I realised the underlying reasoning behind the perceived value of an attribute
is a mixture of preferences and separating these can be challenging. There has
clearly been a need for such sort of an analysis, as Article [I] has been read
extensively and been well cited based on data retrieved from several databases
(e.g. Mendeley, Scopus, Web of Science).
Uncertainty is generally defined as the lack of precise knowledge about the
system under study (Refsgaard et al., 2007; Ascough et al., 2008). Thus, with
any approach, epistemic uncertainty about the actual state of the system is
unavoidable. However, new information about the system does not always
reduce the uncertainty as additional knowledge may reveal uncertainties that
were not known or understood previously (Walker et al., 2003). On the other
hand, by adding new knowledge into the system, it is possible to acknowledge
the limitations of our understanding (van der Sluis, 1997). The advantage of
using Bayesian statistical modelling tools is that these models estimate the
inherent epistemic uncertainty, and correspondingly, the level of prevailing
knowledge about the system. As Bayesian model allows us to include our prior
knowledge about the system and causalities between the model parameters,
our past understanding can actually help to achieve more logical and clear
model results together with new data.
Even though the quantitative target levels of the indicators are essential in
environmental decision-making, in the end, how they are interpreted in
decision-making is crucial. When modelling tools are used to assist decision-
making, the emphasis should be to ensure that information provided by the
model result is understood unequivocally by both the statistical modeller and
the decision-maker (Cartwright et al., 2016). In practice, this can be a
challenging task, as the scope and extent of decision-making can vary widely
39
at various scales from local to global governance (Bennett and Satterfield,
2018). For instance, all large-scale policy processes (e.g. the adoption and
implementation of the MSFD) involve large numbers of independent parties
or actors to facilitate negotiations and debates to achieve an optimal solution.
It is clear that when we are dealing with large-scale issues the preferences and
selected risk attitudes can vary highly between the actors. Therefore, such
probabilistic approaches might ultimately complicate the already complex
decision-making process. I think that the probabilistic approach shows
significant potential to solve real environmental policy and management
problems, but care should be taken on how and from whose viewpoint the risk
attitude for the target level are set and how well the scientific knowledge is
understood by the decision-makers.
Vague definition of environmental management objectives complexify
societal discourse (Cummings et al 2018). As the effects of the management
measures are perceived differently between actors, an important part of
environmental decision-making is to communicate the diverse values and
preferences that people hold and assign to the environment (Walz et al., 2019).
Participatory processes can speed up the integration of scientific results into
actions by integrating societal values as an inherent part of the modelling
(Voinov et al., 2014). Thus, by improving the awareness of each other’s
preferences and reasoning behind them can advance collectively fair decision-
making (Dietz, 2003; Gopnik et al., 2012). The collaborative decision-making
framework suggested in Article [III] could improve the understanding of both
decision makers and stakeholders on the unavoidable compromises and
uncertainties related to the decisions that are required. In addition to this,
participatory processes can also be seen as a way to share knowledge and
understanding.
Trade-offs between the alternative management measures cannot be
avoided when making management decisions to solve wicked environmental
problems. Decision-makers are often required to make a decision to either
favor environmental protection over the regional employment and economic
growth or vice versa (Naughton-Treves et al., 2005; Minteer and Miller, 2011).
However, these objectives do not always diminish each other. When decision

40
makers have holistic understanding of the complex and multidisciplinary
decision-making problem including the ecological, economic and
sociocultural values, it is possible to make decisions that are more acceptable
and just. I hope that these ideas and tools developed in this thesis will be useful
when trying to find solutions for the complex environmental management
problems, as well as promote more multidisciplinary viewpoint decision-
making.
41
ACKNOWLEDGMENTS
First, I wish to thank my supervisors, Dr. Annukka Lehikoinen and Dr. Samu
Mäntyniemi for their guidance and encouragement throughout these years.
Annukka, you have always given me support when needed and your
determined and inspiring attitude towards research have guided me to find my
own paths and interests as a researcher. I am grateful for Samu of all the
encouragement and patience he has given me during these past years. Writing
a PhD thesis is never straightforward and obstacles cannot be avoided.
Nevertheless, I can say that I have been very lucky to have two excellent and
easily approachable supervisors who had guided me during this journey.
I would like to thank the reviewers of this thesis, Dr. Angel Borja and Dr.
Jannicke Moe, as well as the opponent, Dr. David Barton, for their time and
expertise they have put into this work. I would also like to thank Prof. Sirkku
Juhola for being my custos and helping me to go through the final steps of
finalizing my thesis. I wish to thank my thesis advisory committee, consisting
of Dr. Laura Uusitalo and Prof. Otso Ovaskainen for guiding me over the years
for which I am truly grateful. The meetings have been a great opportunity for
me to receive comments about my work and get some new ideas to go forward.
Special thanks to Laura for her contribution and guidance (especially) during
the early stages of my PhD journey. I would also like to thank my co-authors
Dr. Riikka Venesjärvi, Dr. Örjan Östman and Dr. Jens Olsson who have
contributed in the research articles and shared their expertise and ideas.
I want to thank all the current and former members of the Fisheries and
Environmental Management (FEM) research group. I have been a part of the
research group since the beginning of my PhD journey and I am very grateful
to have the possibility to work as well as spend time with such amazing group
of people. I would also like thank the people in the Kotka Maritime Research
Centre (KMRC) where my whole career in science started many years ago.
Many thanks to former DENVI coordinator, Dr. Anni Tonteri, and current
coordinator, Dr. Karen Sims-Huopaniemi, for their help and guidance through
the administrative issues and to the YEB doctoral school for funding my travel
abroad on conferences, summer school and research visit.
42
This work has mainly been funded by the Doctoral Programme in
Interdisciplinary Environmental Sciences (DENVI). I would like to thank
DENVI for offering me the three-year funding for my work and making it
possible to carry out my research. A part of the work has also been done with
funding from TOPCONS project (Interreg 2007-2013 South-East Finland-
Russia ENPI CBC).
Last but definitely not least, I would like to thank my family and friends. I
wish to thank all my friends who have shared so many fun times, discussions
and laughs with me over the years. Kiitokset vanhemmilleni, Tuijalle ja
Mikalle, että uskoitte minuun ja valoitte itsevarmuutta kokeilla siipiäni ja
haastaa itseni. Ja haluan myös kiittää veljiäni, Miroa, Laria ja Toivoa sekä
koko muuta perhettä tuesta, jota olen kaikkina näinä vuosina saanut. To my
dear husband Pankaj, I want to give special thanks for all the support,
understanding and patience during this journey. I could not have achieved this
without you. I am grateful that I can share my life with you and our beautiful
little daughter, Viveka.
43
REFERENCES
Acott, T. G., & Urquhart, J. (2014). Sense of place and socio-cultural values in
fishing communities along the English Channel. In Social issues in
sustainable fisheries management (pp. 257-277). Springer, Dordrecht.
Allen, C. R., Angeler, D. G., Cumming, G. S., Folke, C., Twidwell, D., & Uden,
D. R. (2016). Quantifying spatial resilience. Journal of Applied Ecology,
53(3), 625-635.
Ascough Ii, J. C., Maier, H. R., Ravalico, J. K., & Strudley, M. W. (2008).
Future research challenges for incorporation of uncertainty in
environmental and ecological decision-making. Ecological modelling,
219(3-4), 383-399.
Atkins, J. P., Burdon, D., Elliott, M., & Gregory, A. J. (2011). Management of
the marine environment: integrating ecosystem services and societal
benefits with the DPSIR framework in a systems approach. Marine
pollution bulletin, 62(2), 215-226.
Balint, P. J., Stewart, R. E., Desai, A., & Walters, L. C. (2011). Wicked
environmental problems: managing uncertainty and conflict. Island
Press.
Balsby, T. J., Carstensen, J., & Krause-Jensen, D. (2013). Sources of
uncertainty in estimation of eelgrass depth limits. Hydrobiologia,
704(1), 311-323.
Barnard, S., & Elliott, M. (2015). The 10-tenets of adaptive management and
sustainability: an holistic framework for understanding and managing
the socio-ecological system. Environmental Science & Policy, 51, 181-
191.
Barton, D. N., Saloranta, T., Moe, S. J., Eggestad, H. O., & Kuikka, S. (2008).
Bayesian belief networks as a meta-modelling tool in integrated river
basin management—Pros and cons in evaluating nutrient abatement
decisions under uncertainty in a Norwegian river basin. Ecological
economics, 66(1), 91-104.
Barton, D. N., Kuikka, S., Varis, O., Uusitalo, L., Henriksen, H. J., Borsuk, M.,
... & Linnell, J. D. (2012). Bayesian networks in environmental and
44
resource management. Integrated environmental assessment and
management, 8(3), 418-429.
Belton, V., & Stewart, T. (2002). Multiple criteria decision analysis: an
integrated approach. Springer Science & Business Media.
Bennett, N. J., & Satterfield, T. (2018). Environmental governance: A practical
framework to guide design, evaluation, and analysis. Conservation
Letters, 11(6), e12600.
Berg, T., Fürhaupter, K., Teixeira, H., Uusitalo, L., & Zampoukas, N. (2015).
The Marine Strategy Framework Directive and the ecosystem-based
approach–pitfalls and solutions. Marine pollution bulletin, 96(1-2), 18-
28.
Berger, J. (2006). The case for objective Bayesian analysis. Bayesian analysis,
1(3), 385-402.
Bigagli, E. (2017). Is it possible to implement a complex adaptive systems
approach for marine systems? The experience of Italy and the Adriatic
Sea. Ocean & coastal management, 149, 81.
Blasco, A. (2017). Bayesian data analysis for animal scientists. New York:
Springer.
Borja, A., & Elliott, M. (2013). Marine monitoring during an economic crisis:
the cure is worse than the disease.
Borja, A., Elliott, M., Andersen, J. H., Cardoso, A. C., Carstensen, J., Ferreira,
J. G., ... & Uusitalo, L. (2013). Good environmental status of marine
ecosystems: what is it and how do we know when we have attained it?.
Marine Pollution Bulletin, 76(1-2), 16-27.
Borja, A., Prins, T. C., Simboura, N., Andersen, J. H., Berg, T., Marques, J. C.,
... & Uusitalo, L. (2014). Tales from a thousand and one ways to
integrate marine ecosystem components when assessing the
environmental status. Frontiers in Marine Science, 1, 72.
Borja, A., Elliott, M., Snelgrove, P. V., Austen, M. C., Berg, T., Cochrane, S., ...
& Lynam, C. P. (2016). Bridging the gap between policy and science in
assessing the health status of marine ecosystems. Frontiers in Marine
Science, 3, 175.
45
Borsuk, M. E., Reichert, P., Peter, A., Schager, E., & Burkhardt-Holm, P.
(2006). Assessing the decline of brown trout (Salmo trutta) in Swiss
rivers using a Bayesian probability network. Ecological Modelling,
192(1-2), 224-244.
Boyes, S. J., & Elliott, M. (2014). Marine legislation–The ultimate
‘horrendogram’: International law, European directives & national
implementation. Marine pollution bulletin, 86(1-2), 39-47.
Boyes, S. J., & Elliott, M. (2015). The excessive complexity of national marine
governance systems–Has this decreased in England since the
introduction of the Marine and Coastal Access Act 2009?. Marine
Policy, 51, 57-65.
Boyes, S. J., Elliott, M., Murillas-Maza, A., Papadopoulou, N., & Uyarra, M. C.
(2016). Is existing legislation fit-for-purpose to achieve Good
Environmental Status in European seas?. Marine Pollution Bulletin,
111(1-2), 18-32.
Brundtland GH (1987). Our common future. United Nations.
Brunette, M., Foncel, J., & Kéré, E. N. (2017). Attitude towards Risk and
Production Decision: An Empirical analysis on French private forest
owners. Environmental Modeling & Assessment, 22(6), 563-576.
Burgman, M. (2005). Risks and decisions for conservation and environmental
management. Cambridge University Press.
Calabretta, G., Gemser, G., & Wijnberg, N. M. (2017). The interplay between
intuition and rationality in strategic decision making: A paradox
perspective. Organization Studies, 38(3-4), 365-401.
Cardinale, B. J., Duffy, J. E., Gonzalez, A., Hooper, D. U., Perrings, C., Venail,
P., ... & Kinzig, A. P. (2012). Biodiversity loss and its impact on
humanity. Nature, 486(7401), 59.
Carriger, J. F., Barron, M. G., & Newman, M. C. (2016). Bayesian networks
improve causal environmental assessments for evidence-based policy.
Environmental science & technology, 50(24), 13195-13205.
Carstensen, J. (2014). Need for monitoring and maintaining sustainable
marine ecosystem services. Frontiers in Marine Science, 1, 33.
46
Carstensen, J., & Lindegarth, M. (2016). Confidence in ecological indicators: a
framework for quantifying uncertainty components from monitoring
data. Ecological indicators, 67, 306-317.
Cartwright, S. J., Bowgen, K. M., Collop, C., Hyder, K., Nabe-Nielsen, J.,
Stafford, R., ... & Sibly, R. M. (2016). Communicating complex
ecological models to non-scientist end users. Ecological Modelling,
338, 51-59.
Castello, L., & Macedo, M. N. (2016). Large‐ scale degradation of Amazonian
freshwater ecosystems. Global Change Biology, 22(3), 990-1007.
Chow, C. C., and Sarin, R. K., (2002). Known, unknown and unknowable
uncertainties. Theory and Decision 52: 127–138.
Christie, M., Fazey, I., Cooper, R., Hyde, T., & Kenter, J. O. (2012). An
evaluation of monetary and non-monetary techniques for assessing the
importance of biodiversity and ecosystem services to people in
countries with developing economies. Ecological economics, 83, 67-78.
Cohen, J. E. (1995). Population growth and earth's human carrying capacity.
Science, 269(5222), 341-346.
Coll, M., Shannon, L. J., Kleisner, K. M., Juan-Jordá, M. J., Bundy, A., Akoglu,
A. G., ... & Diallo, I. (2016). Ecological indicators to capture the effects
of fishing on biodiversity and conservation status of marine ecosystems.
Ecological Indicators, 60, 947-962.
Costanza, R. (1999). The ecological, economic, and social importance of the
oceans. Ecological economics, 31(2), 199-213.
Crain, C. M., Halpern, B. S., Beck, M. W., & Kappel, C. V. (2009).
Understanding and managing human threats to the coastal marine
environment. Annals of the New York Academy of Sciences, 1162(1), 39-
62.
Cummings, J. W., Converse, S. J., Smith, D. R., Morey, S., & Runge, M. C.
(2018). Implicit decision framing as an unrecognized source of
confusion in endangered species classification. Conservation Biology,
32(6), 1246-1254.
Danovaro, R., Carugati, L., Berzano, M., Cahill, A. E., Carvalho, S., Chenuil, A.,
... & Dzhembekova, N. (2016). Implementing and innovating marine
47
monitoring approaches for assessing marine environmental status.
Frontiers in Marine Science, 3, 213.
Dawe, N. K., & Ryan, K. L. (2003). The faulty three-legged-stool model of
sustainable development. Conservation biology, 17(5), 1458-1460.
De Santo, E. M. (2010). ‘Whose science?’ Precaution and power-play in
European marine environmental decision-making. Marine Policy,
34(3), 414-420.
Dietz, T. (2003). What is a good decision? Criteria for environmental decision
making. Human Ecology Review, 33-39.
Elliott, M. (2014). Integrated marine science and management: wading
through the morass. Marine Pollution Bulletin, 86(1-2).
Elliott, M., Burdon, D., Atkins, J. P., Borja, A., Cormier, R., De Jonge, V. N., &
Turner, R. K. (2017). “And DPSIR begat DAPSI (W) R (M)!”-a unifying
framework for marine environmental management. Marine pollution
bulletin, 118(1-2), 27-40.
Ellison, A. M. (2004). Bayesian inference in ecology. Ecology letters, 7(6), 509-
520.
European Economic Community (EEC). (1992). Council directive 92/43EEC
of 21 May 1992 on the conservation of natural habitats and of wild fauna
and flora. Official Journal L206:7–50.
European Economic Community (EEC). (2009). Directive 2009/147/EC of the
European Parliament and of the Council of 30 November 2009 on the
conservation of wild birds on the conservation of wild birds (codified
version). Official Journal L20:7–25.
European commission Directive 2000/60/EC of the European Parliament and
of the Council of 23 October 2000 Establishing a Framework for
Community Action in the Field of Water Policy (2000), p. 2000
European Commission, (2008). Directive 2008/56/EC of the European
Parliament and of the Council establishing a framework for community
action in the field of marine environmental policy (Marine Strategy
Framework Directive). Off. J. Eur. Union L164, 19–40.
48
Féral, J. P. (2002). How useful are the genetic markers in attempts to
understand and manage marine biodiversity?. Journal of experimental
marine biology and ecology, 268(2), 121-145.
Fernandes, J. A., Kauppila, P., Uusitalo, L., Fleming-Lehtinen, V., Kuikka, S.,
& Pitkanen, H. (2012). Evaluation of reaching the targets of the Water
Framework Directive in the Gulf of Finland. Environmental science &
technology, 46(15), 8220-8228.
Fleming-Lehtinen, V., Andersen, J. H., Carstensen, J., Łysiak-Pastuszak, E.,
Murray, C., Pyhälä, M., & Laamanen, M. (2015). Recent developments
in assessment methodology reveal that the Baltic Sea eutrophication
problem is expanding. Ecological Indicators, 48, 380-388.
Flynn, D. F., Mirotchnick, N., Jain, M., Palmer, M. I., & Naeem, S. (2011).
Functional and phylogenetic diversity as predictors of biodiversity–
ecosystem‐ function relationships. Ecology, 92(8), 1573-1581.
Fraixedas, S., Galewski, T., Ribeiro-Lopes, S., Loh, J., Blondel, J., Fontès, H.,
... & Geijzendorffer, I. R. (2019). Estimating biodiversity changes in the
Camargue wetlands: An expert knowledge approach. PloS one, 14(10).
Gelman, A., Carlin, J. B., Stern, H. S., Dunson, D. B., Vehtari, A., & Rubin, D.
B. (2013). Bayesian data analysis. Chapman and Hall/CRC.
Gilks, W. R., Richardson, S., & Spiegelhalter, D. J. (1996). Introducing Markov
Chain Monte Carlo. Markov chain Monte Carlo in practice, 1, 19.
Gopnik, M., Fieseler, C., Cantral, L., McClellan, K., Pendleton, L., & Crowder,
L. (2012). Coming to the table: Early stakeholder engagement in marine
spatial planning. Marine Policy, 36(5), 1139-1149.
Gregory, A. J., Atkins, J. P., Burdon, D., & Elliott, M. (2013). A problem
structuring method for ecosystem-based management: The DPSIR
modelling process. European Journal of Operational Research, 227(3),
558-569.
Grizzetti, B., Pistocchi, A., Liquete, C., Udias, A., Bouraoui, F., & Van De Bund,
W. (2017). Human pressures and ecological status of European rivers.
Scientific reports, 7(1), 205.
49
Haapasaari, P., Mäntyniemi, S., & Kuikka, S. (2012). Baltic herring fisheries
management: stakeholder views to frame the problem. Ecology and
Society, 17(3).
Haines-Young, R., & Potschin, M. B. (2018). Common international
classification of ecosystem services (CICES) V5. 1 and guidance on the
application of the revised structure. Nottingham, UK: Fabis Consulting
Ltd.
Halpern, B. S., Walbridge, S., Selkoe, K. A., Kappel, C. V., Micheli, F., D'agrosa,
C., ... & Fujita, R. (2008). A global map of human impact on marine
ecosystems. Science, 319(5865), 948-952.
HELCOM, (2007). The Baltic Sea action plan. In: HELCOM Ministerial
Meeting Krakow, Poland, 15 November 2007, p. 101.
HELCOM (2018): State of the Baltic Sea – Second HELCOM holistic
assessment 2011-2016. Baltic Sea Environment Proceedings 155.
Hill, M. O. (1973). Diversity and evenness: a unifying notation and its
consequences. Ecology, 54(2), 427-432.
Howard, R. A. (1988). Decision analysis: practice and promise. Management
science, 34(6), 679-695.
Huang, I. B., Keisler, J., & Linkov, I. (2011). Multi-criteria decision analysis in
environmental sciences: Ten years of applications and trends. Science
of the total environment, 409(19), 3578-3594.
Huber, F. (2005). Subjective probabilities as basis for scientific reasoning?.
The British journal for the philosophy of science, 56(1), 101-116.
Hugé, J., Waas, T., Dahdouh-Guebas, F., Koedam, N., & Block, T. (2013). A
discourse-analytical perspective on sustainability assessment:
interpreting sustainable development in practice. Sustainability
science, 8(2), 187-198.
ICES (2019). Baltic Salmon and Trout Assessment Working Group
(WGBAST). ICES Scientific Reports. 1:23. 312 pp.
http://doi.org/10.17895/ices.pub.4979
Ignatius, S., Delaney, A., & Haapasaari, P. (2019). Socio-cultural values as a
dimension of fisheries governance: The cases of Baltic salmon and
herring. Environmental science & policy, 94, 1-8.
50
Ihaksi, T., Kokkonen, T., Helle, I., Jolma, A., Lecklin, T., & Kuikka, S. (2011).
Combining conservation value, vulnerability, and effectiveness of
mitigation actions in spatial conservation decisions: an application to
coastal oil spill combating. Environmental Management, 47(5), 802-
813.
Isbell, F., Gonzalez, A., Loreau, M., Cowles, J., Diaz, S., Hector, A., ... &
Turnbull, L. A. (2017). Linking the influence and dependence of people
on biodiversity across scales. Nature, 546(7656), 65-72.
Jager, W., & Mosler, H. J. (2007). Simulating human behavior for
understanding and managing environmental resource use. Journal of
Social Issues, 63(1), 97-116.
James, G. K., Adegoke, J. O., Osagie, S., Ekechukwu, S., Nwilo, P., & Akinyede,
J. (2013). Social valuation of mangroves in the Niger Delta region of
Nigeria. International Journal of Biodiversity Science, Ecosystem
Services & Management, 9(4), 311-323.
Johnson, C. N., Balmford, A., Brook, B. W., Buettel, J. C., Galetti, M.,
Guangchun, L., & Wilmshurst, J. M. (2017). Biodiversity losses and
conservation responses in the Anthropocene. Science, 356(6335), 270-
275.
Jones, N., Ross, H., Lynam, T., Perez, P., & Leitch, A. (2011). Mental models:
an interdisciplinary synthesis of theory and methods.
Keeney, R. L. (1982). Decision analysis: an overview. Operations research,
30(5), 803-838.
Keeney, R. L. (1996). Value-focused thinking: Identifying decision
opportunities and creating alternatives. European Journal of
operational research, 92(3), 537-549.
Keith, D. A. (2009). The interpretation, assessment and conservation of
ecological communities. Ecological management & restoration, 10, S3-
S15.
Kiker, G. A., Bridges, T. S., Varghese, A., Seager, T. P., & Linkov, I. (2005).
Application of multicriteria decision analysis in environmental decision
making. Integrated Environmental Assessment and Management: An
International Journal, 1(2), 95-108.
51
Kobryn, H. T., Brown, G., Munro, J., & Moore, S. A. (2018). Cultural ecosystem
values of the Kimberley coastline: An empirical analysis with
implications for coastal and marine policy. Ocean & coastal
management, 162, 71-84.
Korb, K. B., & Nicholson, A. E. (2004). Bayesian artificial intelligence. CRC
press.
Kørnøv, L., & Thissen, W. A. (2000). Rationality in decision-and policy-
making: implications for strategic environmental assessment. Impact
assessment and project appraisal, 18(3), 191-200.
Korpinen, S., Meski, L., Andersen, J. H., & Laamanen, M. (2012). Human
pressures and their potential impact on the Baltic Sea ecosystem.
Ecological Indicators, 15(1), 105-114.
Kruschke, J. (2014). Doing Bayesian data analysis: A tutorial with R, JAGS,
and Stan. Academic Press.
Kuikka, S., Vanhatalo, J., Pulkkinen, H., Mäntyniemi, S., & Corander, J.
(2014). Experiences in Bayesian inference in Baltic salmon
management. Statistical Science, 29(1), 42-49.
Lamarque, P., Quetier, F., & Lavorel, S. (2011). The diversity of the ecosystem
services concept and its implications for their assessment and
management. Comptes rendus biologies, 334(5-6), 441-449.
Langemeyer, J., Gómez-Baggethun, E., Haase, D., Scheuer, S., & Elmqvist, T.
(2016). Bridging the gap between ecosystem service assessments and
land-use planning through Multi-Criteria Decision Analysis (MCDA).
Environmental Science & Policy, 62, 45-56.
Langhans, S. D., Jähnig, S. C., Lago, M., Schmidt-Kloiber, A., & Hein, T.
(2019). The potential of ecosystem-based management to integrate
biodiversity conservation and ecosystem service provision in aquatic
ecosystems.
Lehikoinen, A., Helle, I., Klemola, E., Mäntyniemi, S., Kuikka, S., & Pitkänen,
H. (2014). Evaluating the impact of nutrient abatement measures on
the ecological status of coastal waters: a Bayesian network for decision
analysis. International Journal of Multicriteria Decision Making, 4(2),
114-134.
52
Lunn, D., Jackson, C., Best, N., Spiegelhalter, D., & Thomas, A. (2012). The
BUGS book: A practical introduction to Bayesian analysis. Chapman
and Hall/CRC.
Mace, G. M., Norris, K., & Fitter, A. H. (2012). Biodiversity and ecosystem
services: a multilayered relationship. Trends in ecology & evolution,
27(1), 19-26.
Madsen, A. L., Jensen, F., Kjaerulff, U. B., & Lang, M. (2005). The Hugin tool
for probabilistic graphical models. International Journal on Artificial
Intelligence Tools, 14(03), 507-543.
Magurran, A. E. (2004). Measuring biological diversity. John Wiley & Sons.
McKee, J. K., Sciulli, P. W., Fooce, C. D., & Waite, T. A. (2004). Forecasting
global biodiversity threats associated with human population growth.
Biological Conservation, 115(1), 161-164.
McNeish, D. (2016). On using Bayesian methods to address small sample
problems. Structural Equation Modeling: A Multidisciplinary Journal,
23(5), 750-773.
Michielsens, C. G., McAllister, M. K., Kuikka, S., Pakarinen, T., Karlsson, L.,
Romakkaniemi, A., ... & Mäntyniemi, S. (2006). A Bayesian state space
mark recapture model to estimate exploitation rates in mixed-stock
fisheries. Canadian Journal of Fisheries and Aquatic Sciences, 63(2),
321-334.
Minteer, B. A., & Miller, T. R. (2011). The New Conservation Debate: ethical
foundations, strategic trade-offs, and policy opportunities. Biological
Conservation, 144(3), 945-947.
Moe, S. J., Solheim, A. L., Soszka, H., Gołub, M., Hutorowicz, A., Kolada, A.,
... & Białokoz, W. (2015). Integrated assessment of ecological status and
misclassification of lakes: the role of uncertainty and index
combination rules. Ecological Indicators, 48, 605-615.
Moe, S. J., Haande, S., & Couture, R. M. (2016). Climate change, cyanobacteria
blooms and ecological status of lakes: a Bayesian network approach.
Ecological modelling, 337, 330-347.
Morse, S. (2015). Developing sustainability indicators and indices. Sustainable
Development, 23(2), 84-95.
53
Mäntyniemi, S., Haapasaari, P., Kuikka, S., Parmanne, R., Lehtiniemi, M., &
Kaitaranta, J. (2013). Incorporating stakeholders' knowledge to stock
assessment: Central Baltic herring. Canadian Journal of Fisheries and
Aquatic Sciences, 70(4), 591-599.
Mäntyniemi, S. H., Whitlock, R. E., Perälä, T. A., Blomstedt, P. A., Vanhatalo,
J. P., Rincón, M. M., ... & Kuikka, O. S. (2015). General state-space
population dynamics model for Bayesian stock assessment. ICES
Journal of Marine Science, 72(8), 2209-2222.
Naughton-Treves, L., Holland, M. B., & Brandon, K. (2005). The role of
protected areas in conserving biodiversity and sustaining local
livelihoods. Annu. Rev. Environ. Resour., 30, 219-252.
Newport, D., Chesnes, T., & Lindner, A. (2003). The “environmental
sustainability” problem: ensuring that sustainability stands on three
legs. International Journal of Sustainability in Higher Education, 4(4),
357-363.
Nielsen, T. D., & Jensen, F. V. (2009). Bayesian networks and decision graphs.
Springer Science & Business Media.
Nygård, H., Oinonen, S., Hällfors, H. A., Lehtiniemi, M., Rantajärvi, E., &
Uusitalo, L. (2016). Price vs. value of marine monitoring. Frontiers in
Marine Science, 3, 205.
O'Hagan, A., Buck, C. E., Daneshkhah, A., Eiser, J. R., Garthwaite, P. H.,
Jenkinson, D. J., ... & Rakow, T. (2006). Uncertain judgements:
eliciting experts' probabilities. John Wiley & Sons.
Olander, L. P., Johnston, R. J., Tallis, H., Kagan, J., Maguire, L. A., Polasky,
S., ... & Palmer, M. (2018). Benefit relevant indicators: Ecosystem
services measures that link ecological and social outcomes. Ecological
indicators, 85, 1262-1272.
Olsen, E., Kaplan, I. C., Ainsworth, C., Fay, G., Gaichas, S., Gamble, R., ... &
Johnson, K. F. (2018). Ocean futures under ocean acidification, marine
protection, and changing fishing pressures explored using a worldwide
suite of ecosystem models. Frontiers in Marine Science, 5, 64.
Parviainen, T., Lehikoinen, A., Kuikka, S., & Haapasaari, P. (2019). Risk
frames and multiple ways of knowing: Coping with ambiguity in oil spill
54
risk governance in the Norwegian Barents Sea. Environmental Science
& Policy, 98, 95-111.
Patrício, J., Elliott, M., Mazik, K., Papadopoulou, K. N., & Smith, C. J. (2016a).
DPSIR—two decades of trying to develop a unifying framework for
marine environmental management?. Frontiers in Marine Science, 3,
177.
Patrício, J., Little, S., Mazik, K., Papadopoulou, K. N., Smith, C. J., Teixeira,
H., ... & Kaboglu, G. (2016b). European marine biodiversity monitoring
networks: strengths, weaknesses, opportunities and threats. Frontiers
in Marine Science, 3, 161.
Peterson, M. (2009). An Introduction to Decision Theory (Cambridge
Introductions to Philosophy). Cambridge: Cambridge University Press.
Pielou, E. C. (1969). An introduction to mathematical ecology. An introduction
to mathematical ecology.
Pinto, R., de Jonge, V. N., & Marques, J. C. (2014). Linking biodiversity
indicators, ecosystem functioning, provision of services and human
well-being in estuarine systems: Application of a conceptual
framework. Ecological indicators, 36, 644-655.
Plummer, M. (2003). JAGS: A program for analysis of Bayesian graphical
models using Gibbs sampling. In Proceedings of the 3rd international
workshop on distributed statistical computing (Vol. 124, No. 125, p. 10).
Probst, W. N. (2017). A generic aggregation approach to account for statistical
uncertainty when combining multiple assessment results. Ecological
indicators, 73, 686-693.
Rahikainen, M., Helle, I., Haapasaari, P., Oinonen, S., Kuikka, S., Vanhatalo,
J., ... & Hoviniemi, K. M. (2014). Toward integrative management
advice of water quality, oil spills, and fishery in the Gulf of Finland: a
Bayesian approach. Ambio, 43(1), 115-123.
Reed, M., Courtney, P., Urquhart, J., & Ross, N. (2013). Beyond fish as
commodities: Understanding the socio-cultural role of inshore fisheries
in England. Marine Policy, 37, 62-68.
Refsgaard, J. C., van der Sluijs, J. P., Højberg, A. L., & Vanrolleghem, P. A.
(2007). Uncertainty in the environmental modelling process–a
55
framework and guidance. Environmental modelling & software, 22(11),
1543-1556.
Rittel, H. W., & Webber, M. M. (1973). Dilemmas in a general theory of
planning. Policy sciences, 4(2), 155-169.
Rossberg, A. G., Uusitalo, L., Berg, T., Zaiko, A., Chenuil, A., Uyarra, M. C., ...
& Lynam, C. P. (2017). Quantitative criteria for choosing targets and
indicators for sustainable use of ecosystems. Ecological indicators, 72,
215-224.
Ruckelshaus, M., Klinger, T., Knowlton, N., & DeMaster, D. P. (2008). Marine
ecosystem-based management in practice: scientific and governance
challenges. BioScience, 58(1), 53-63.
Ruiz-Frau, A., Edwards-Jones, G., & Kaiser, M. J. (2011). Mapping stakeholder
values for coastal zone management. Marine Ecology Progress Series,
434, 239-249.
Ruiz-Frau, A., Krause, T., & Marbà, N. (2018). The use of sociocultural
valuation in sustainable environmental management. Ecosystem
services, 29, 158-167.
Schiller, A., Hunsaker, C. T., Kane, M. A., Wolfe, A. K., Dale, V. H., Suter, G.
W., ... & Konar, V. C. (2001). Communicating ecological indicators to
decision makers and the public. Conservation Ecology, 5(1).
Schmidt, K., Sachse, R., & Walz, A. (2016). Current role of social benefits in
ecosystem service assessments. Landscape and Urban Planning, 149,
49-64.
Scholte, S. S., Todorova, M., van Teeffelen, A. J., & Verburg, P. H. (2016).
Public support for wetland restoration: what is the link with ecosystem
service values?. Wetlands, 36(3), 467-481.
Senn, S. (2011). You may believe you are a Bayesian but you are probably
wrong. Rationality, Markets and Morals, 2(48-66), 27.
Shaw, E., Kumar, V., Lange, E., & Lerner, D. N. (2016). Exploring the utility of
Bayesian Networks for modelling cultural ecosystem services: A
canoeing case study. Science of the Total Environment, 540, 71-78.
Siddig, A. A., Ellison, A. M., Ochs, A., Villar-Leeman, C., & Lau, M. K. (2016).
How do ecologists select and use indicator species to monitor ecological
56
change? Insights from 14 years of publication in Ecological Indicators.
Ecological Indicators, 60, 223-230.
Smeets, E., & Weterings, R. (1999). Environmental indicators: Typology and
overview.
Smith, D. C., Fulton, E. A., Apfel, P., Cresswell, I. D., Gillanders, B. M.,
Haward, M., ... & Ward, T. M. (2017). Implementing marine ecosystem-
based management: lessons from Australia. ICES Journal of Marine
Science, 74(7), 1990-2003.
Soma, K., van Tatenhove, J., & van Leeuwen, J. (2015). Marine Governance in
a European context: Regionalization, integration and cooperation for
ecosystem-based management. Ocean & Coastal Management, 117, 4-
13.
Spiegelhalter, D., Thomas, A., Best, N., & Lunn, D. (2007). OpenBUGS user
manual, version 3.0. 2. MRC Biostatistics Unit, Cambridge.
Steffen, W., Broadgate, W., Deutsch, L., Gaffney, O., & Ludwig, C. (2015). The
trajectory of the Anthropocene: the great acceleration. The
Anthropocene Review, 2(1), 81-98.
Tallis, H., Levin, P. S., Ruckelshaus, M., Lester, S. E., McLeod, K. L., Fluharty,
D. L., & Halpern, B. S. (2010). The many faces of ecosystem-based
management: making the process work today in real places. Marine
Policy, 34(2), 340-348.
Taylor, N. (1998). Urban planning theory since 1945. SAGE Publications.
TEEB (The Economics of Ecosystems and Biodiversity). (2010a).The
Economics of Ecosystems and Biodiversity Ecological and Economic
Foundations. Edited by Pushpam Kumar. Earthscan, London and
Washington
TEEB (The Economics of Ecosystems and Biodiversity). (2010b) The
Economics of Ecosystems and Biodiversity: Mainstreaming the
Economics of Nature: A synthesis of the approach, conclusions and
recommendations of TEEB.
Tilman, D., Clark, M., Williams, D. R., Kimmel, K., Polasky, S., & Packer, C.
(2017). Future threats to biodiversity and pathways to their prevention.
Nature, 546(7656), 73-81.
57
UNEP (United Nations Environment Programme). (1992).The United Nations
Convention on Biological Diversity.
Uusitalo, L., Kuikka, S., Kauppila, P., Söderkultalahti, P., & Bäck, S. (2012).
Assessing the roles of environmental factors in coastal fish production
in the northern Baltic Sea: A Bayesian network application. Integrated
environmental assessment and management, 8(3), 445-455.
Uusitalo, L., Lehikoinen, A., Helle, I., & Myrberg, K. (2015). An overview of
methods to evaluate uncertainty of deterministic models in decision
support. Environmental Modelling & Software, 63, 24-31.
Van de Schoot, R., Kaplan, D., Denissen, J., Asendorpf, J. B., Neyer, F. J., &
Van Aken, M. A. (2014). A gentle introduction to Bayesian analysis:
Applications to developmental research. Child development, 85(3),
842-860.
van der Sluis, J.P., (1997). Anchoring amid uncertainty: on the management
of uncertainties in risk assessment of anthropogenic climate change.
Ph.D. Dissertation. University of Utrecht, Netherlands, 260 pp.
Van Dongen, S. (2006). Prior specification in Bayesian statistics: three
cautionary tales. Journal of theoretical biology, 242(1), 90-100.
Vlek, C., & Steg, L. (2007). Human Behavior and Environmental
Sustainability: Problems, Driving Forces, and Research Topics. Journal
of social issues, 63(1), 1-19.
Voinov, A., & Bousquet, F. (2010). Modelling with stakeholders.
Environmental Modelling & Software, 25(11), 1268-1281.
Voinov, A., Seppelt, R., Reis, S., Nabel, J. E., & Shokravi, S. (2014). Values in
socio-environmental modelling: persuasion for action or excuse for
inaction. Environmental modelling & software, 53, 207-212.
Voinov, A., Kolagani, N., McCall, M. K., Glynn, P. D., Kragt, M. E., Ostermann,
F. O., ... & Ramu, P. (2016). Modelling with stakeholders–next
generation. Environmental Modelling & Software, 77, 196-220.
Voinov, A. (2017). Participatory modeling for sustainability. In M. A. Abraham
, Encyclopedia of Sustainable Technologies . Elsevier.
https:doi.orghttps:doi.org10.1016B978-0-12-409548-9.10532-9
58
Wach, M., Guéguen, J., Chauvin, C., Delmas, F., Dagens, N., Feret, T., ... &
Tison-Rosebery, J. (2019). Probability of misclassifying river ecological
status: A large-scale approach to assign uncertainty in macrophyte and
diatom-based biomonitoring. Ecological indicators, 101, 285-295.
Walker, W. E., Harremoës, P., Rotmans, J., Van Der Sluijs, J. P., Van Asselt,
M. B., Janssen, P., & Krayer von Krauss, M. P. (2003). Defining
uncertainty: a conceptual basis for uncertainty management in model-
based decision support. Integrated assessment, 4(1), 5-17.
Walz, A., Schmidt, K., Ruiz-Frau, A., Nicholas, K. A., Bierry, A., de Vries
Lentsch, A., ... & Rosário, I. T. (2019). Sociocultural valuation of
ecosystem services for operational ecosystem management: mapping
applications by decision contexts in Europe. Regional Environmental
Change, 1-15.
Whittaker, R. H. (1960). Vegetation of the Siskiyou mountains, Oregon and
California. Ecological monographs, 30(3), 279-338.
Young, J. W. (1997). A framework for the ultimate environmental index–
putting atmospheric change into context with sustainability.
Environmental Monitoring and Assessment, 46(1-2), 135-149.


![Gamification and Employee Engagement: Theoretical … · Gamification and Employee Engagement: Theoretical Review on the Role of HR [185]only when players attain objectives, opportunities](https://img.pdfslide.us/doc/110x75/5b8df8c109d3f2187e8cd902/gamification-and-employee-engagement-theoretical-gamification-and-employee.jpg)


![Goal Intent Attain[1]](https://img.pdfslide.us/doc/110x75/577d35691a28ab3a6b90617a/goal-intent-attain1.jpg)