Embed Size (px)
Citation preview
When Do Variable Flow Fume Hoods Save Energy? Implications for lab design and behavior modification
Michael Gevelber, Robert Choate, Kevin Sheehan, Brian Lo Boston University, Mechanical Engineering
Outline•Why all the fuss about fumehoods & energy?
•What is the conventional wisdom to save energy?
•When won’t a VAV fume hood save energy?
•Analysis of several BU lab buildings
•Pay back analysis
•Monitoring & behavior modification

How much energy/$ does a fume hood use?
• For $3.38/cfm, a 1000cfm hood costs $3,380/year• Analysis by Mills and Sartor, LBL 2005 paper
LBL Fume Hood Energy Model: Provides basis to use local climate, energy rates, efficiency to calc $/cfm & load costs
http://fumehoodcalculator.lbl.gov/index.php
National Impact of Fume Hoods• Mills and Sartor 2006 paper
• Significant energy use in US: ~750,000 hoods$4.2 billion/yr, 5100 MW of electric demand 26 TWh of electricity & 193 X 1012 BTU/yr
• Solutions– New designs– What to do about existing hoods?
• Variable close the sash• Constant volume should they be changed
to variable?Question: When will these solutions for existing
hoods really pay off? Should we use variable for new hoods?
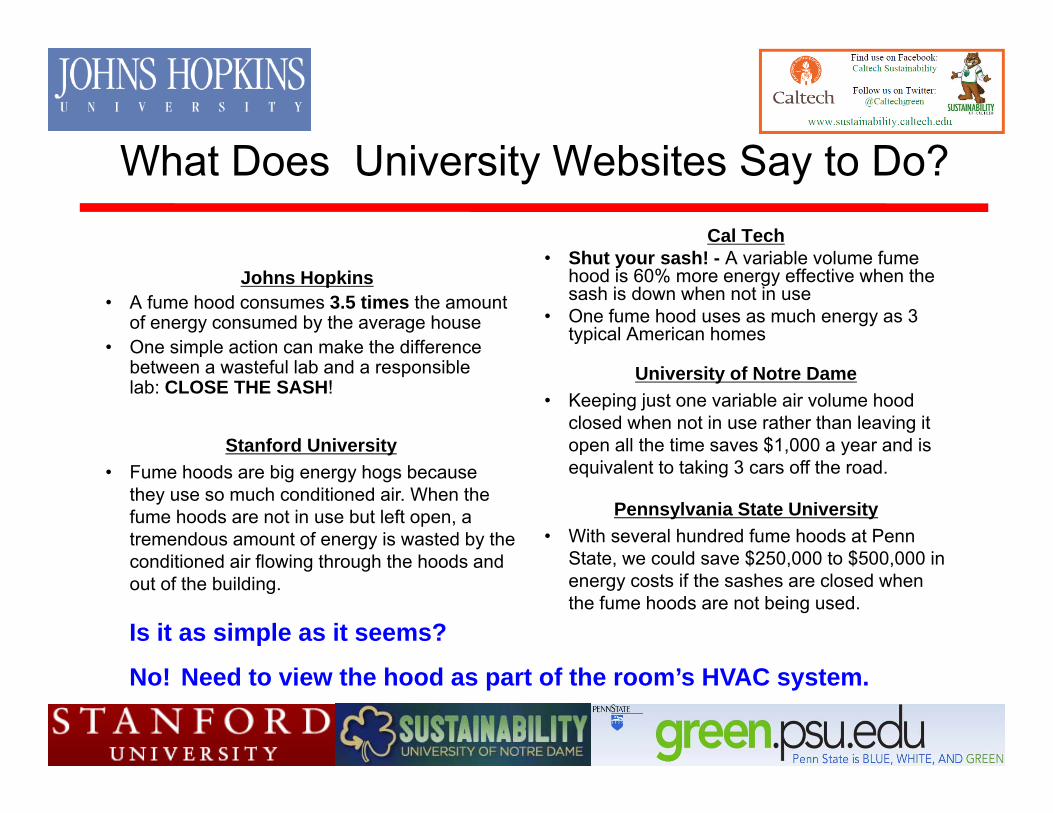
What Does University Websites Say to Do?
Johns Hopkins• A fume hood consumes 3.5 times the amount
of energy consumed by the average house • One simple action can make the difference
between a wasteful lab and a responsible lab: CLOSE THE SASH!
Cal Tech• Shut your sash! - A variable volume fume
hood is 60% more energy effective when the sash is down when not in use
• One fume hood uses as much energy as 3 typical American homes
Stanford University• Fume hoods are big energy hogs because
they use so much conditioned air. When the fume hoods are not in use but left open, a tremendous amount of energy is wasted by the conditioned air flowing through the hoods and out of the building.
University of Notre Dame• Keeping just one variable air volume hood
closed when not in use rather than leaving it open all the time saves $1,000 a year and is equivalent to taking 3 cars off the road.
Pennsylvania State University• With several hundred fume hoods at Penn
State, we could save $250,000 to $500,000 in energy costs if the sashes are closed when the fume hoods are not being used.
Is it as simple as it seems?
No! Need to view the hood as part of the room’s HVAC system.

Variable Volume Fume Hoods
• System maintains constant face velocity, varies flow rate
• High capital cost but lower operating costs– IF the sash is closed
• Easy, inexpensive modification with large return– Reduce face velocity to 100 ft/min– Education and monitoring program
Photo Credit: oregonstate.edu/vent/bypass
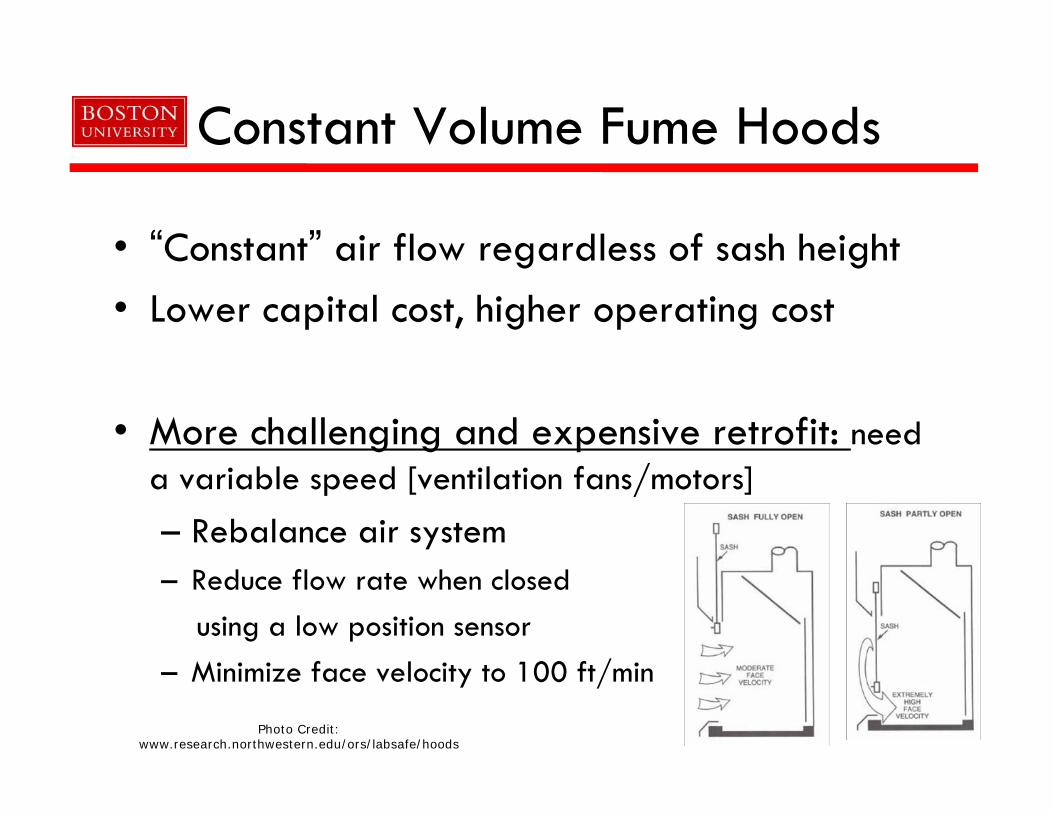
Constant Volume Fume Hoods
• “Constant” air flow regardless of sash height• Lower capital cost, higher operating cost
• More challenging and expensive retrofit: need a variable speed [ventilation fans/motors]– Rebalance air system– Reduce flow rate when closed
using a low position sensor– Minimize face velocity to 100 ft/min
Photo Credit:www.research.northwestern.edu/ors/labsafe/hoods
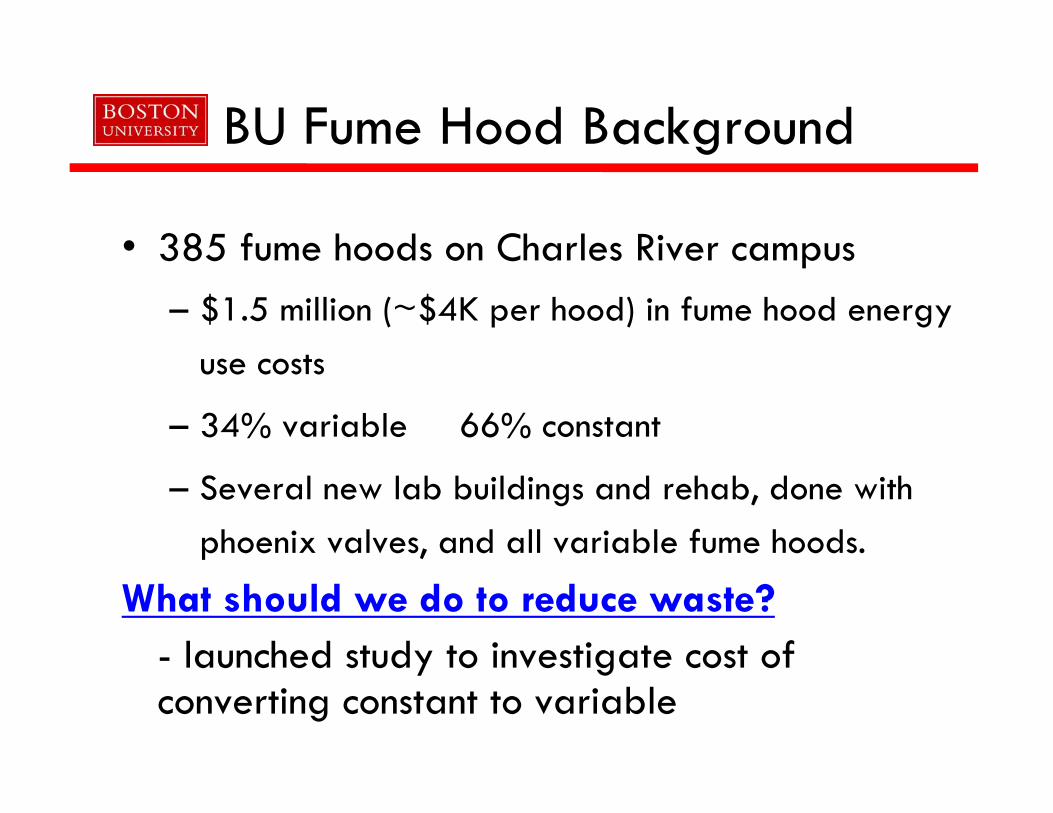
BU Fume Hood Background
• 385 fume hoods on Charles River campus– $1.5 million (~$4K per hood) in fume hood energy
use costs
– 34% variable 66% constant
– Several new lab buildings and rehab, done with phoenix valves, and all variable fume hoods.
What should we do to reduce waste?- launched study to investigate cost of converting constant to variable

Hood/Room Exhaust Savings Analysis
• Total exhaust includes:
+
• Min total exhaust based on room ACH
• Lab safety requirements:6<ACH<12
If , No Savings
hoodQgenQ
Hood Exhaust
hoodQ genQ

Hood/Room Exhaust Savings
Savings Depend on:• No. of Hoods in room• ACH spec: 6 – 10
– UnOcc ACH reduction (4)
• Hood min/ max flow• User behavior
Savings per Hood
0
100
200
300
400
500
600
700
800
900
1 2 3 4 5 6 7 8Number of hoods
Saving
s pe
r ho
od CFM
ACH 6
ACH 8
ACH 10
Assumptions:1000 sq ft room1000 cfm hoods
63%-88% of “expected savings”
30%-70% of “expected savings”
• Need to redo analysis for different size hoods
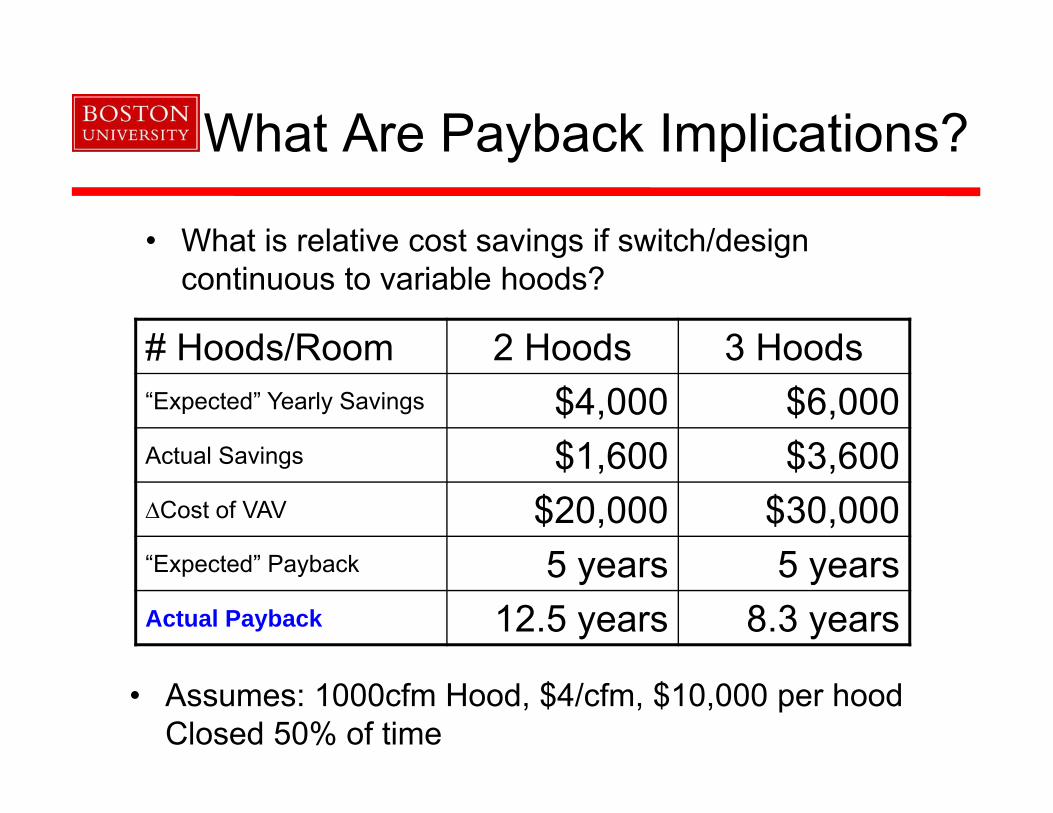
What Are Payback Implications?
• What is relative cost savings if switch/design continuous to variable hoods?
# Hoods/Room 2 Hoods 3 Hoods“Expected” Yearly Savings $4,000 $6,000Actual Savings $1,600 $3,600∆Cost of VAV $20,000 $30,000“Expected” Payback 5 years 5 yearsActual Payback 12.5 years 8.3 years
• Assumes: 1000cfm Hood, $4/cfm, $10,000 per hood Closed 50% of time
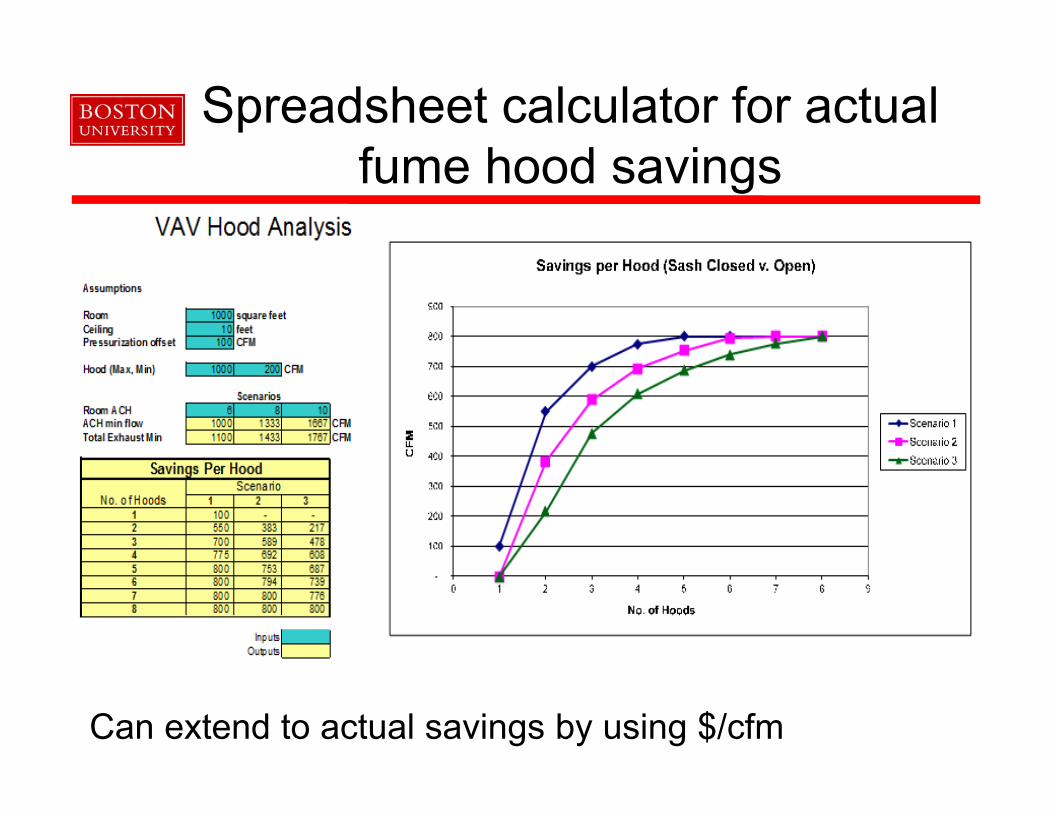
Spreadsheet calculator for actual fume hood savings
Can extend to actual savings by using $/cfm

A Look at Fume Hoodsin 3 Lab Buildings at BU
Photonics8 St. Mary’s St
• 290,000 ft2
• 32 Fume Hoods
Life Sciences24 Cummington
• 148,000 ft2
• 79 VAV Hoods• 10 CV Hoods
Science Center590 Comm
• 284,000 ft2
• 169 Fume Hoods
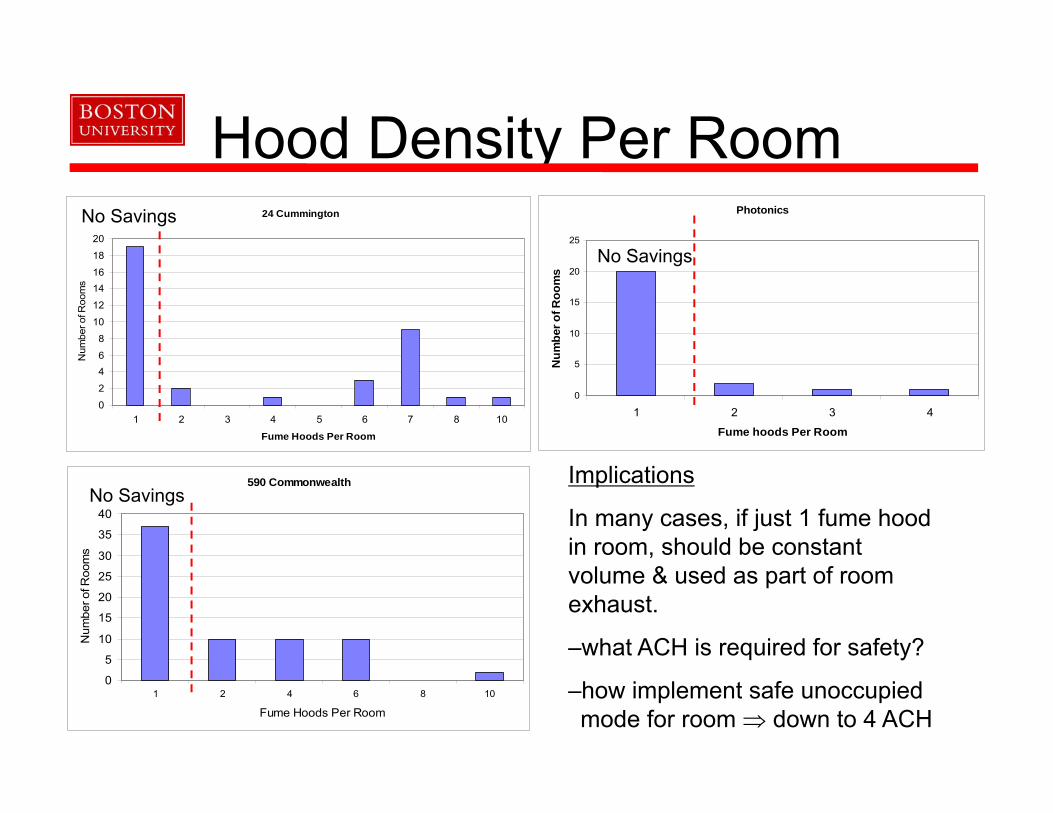
Hood Density Per Room
590 Commonwealth
0
5
10
15
20
25
30
35
40
1 2 4 6 8 10
Fume Hoods Per Room
Num
ber o
f Roo
ms
24 Cummington
0
2
46
8
10
12
1416
18
20
1 2 3 4 5 6 7 8 10
Fume Hoods Per Room
Num
ber o
f Roo
ms
Photonics
0
5
10
15
20
25
1 2 3 4
Fume hoods Per Room
Num
ber o
f Roo
ms
No Savings
No Savings
No SavingsImplications
In many cases, if just 1 fume hood in room, should be constant volume & used as part of room exhaust.
–what ACH is required for safety?
–how implement safe unoccupied mode for room down to 4 ACH

Fume Hoods Size (cfm) Distribution
590 Commonwealth
0
10
20
30
40
50
60
70
400 600 800 1000 2000
Fume Hood Size (cfm)
Num
ber
of F
ume
Hoo
ds
24 Cummington
0
5
10
15
20
25
30
400 600 800 1000 1200 1400 1600 1800 2000 More
Fume Hoods Size (cfm)
Num
ber o
f Fum
e Ho
ods
Photonics
0
2
4
6
8
10
12
14
400 600 800 1000 1200 More
Fume Hoods Size
Num
er o
f Fum
e Ho
ods
• Red indicates one hood per room

Fume Hood Position Monitoring System For Behavior Modification
• Use Building Automation System to track which hoods are left open– Report on monthly basis to lab managers, staff, &
professors– Need a champion in building, track only hoods that
matter• Simple iterative algorithm
• Lots of people will take your $ to provide a fancy system, but the above is easy to implement
0
20
40
60
80
100
120
12 AM 4 AM 8 AM 12 PM 4 PM 8 PM
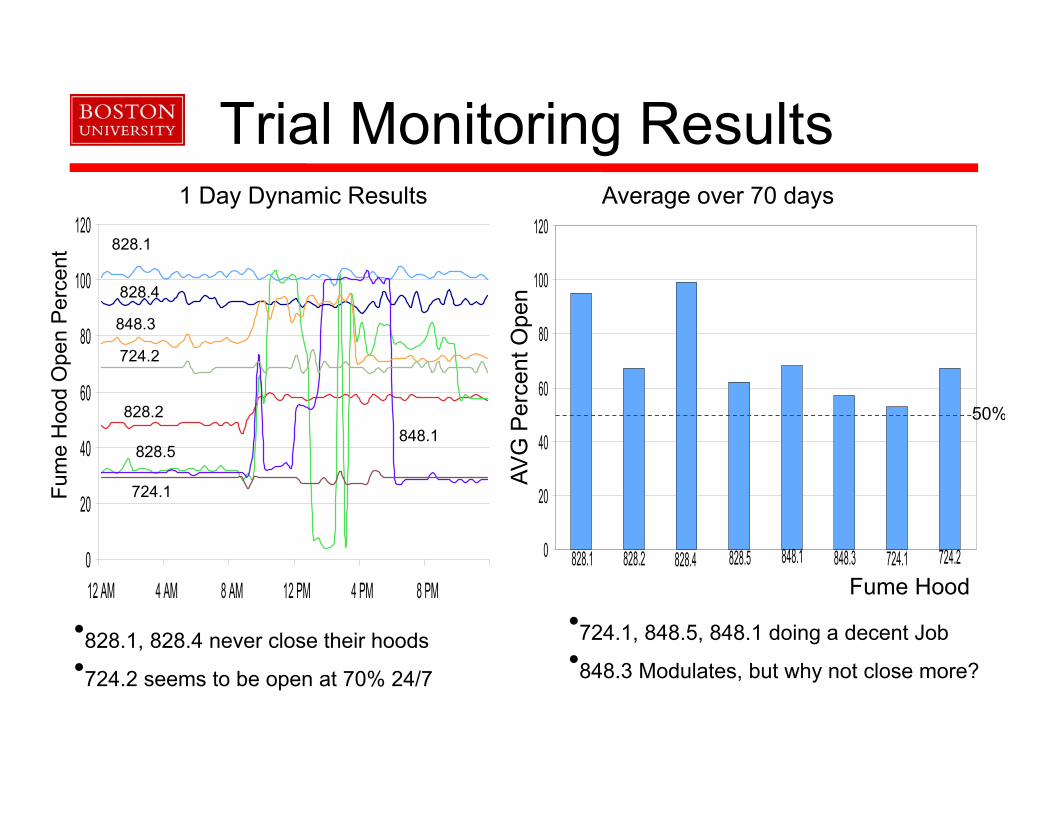
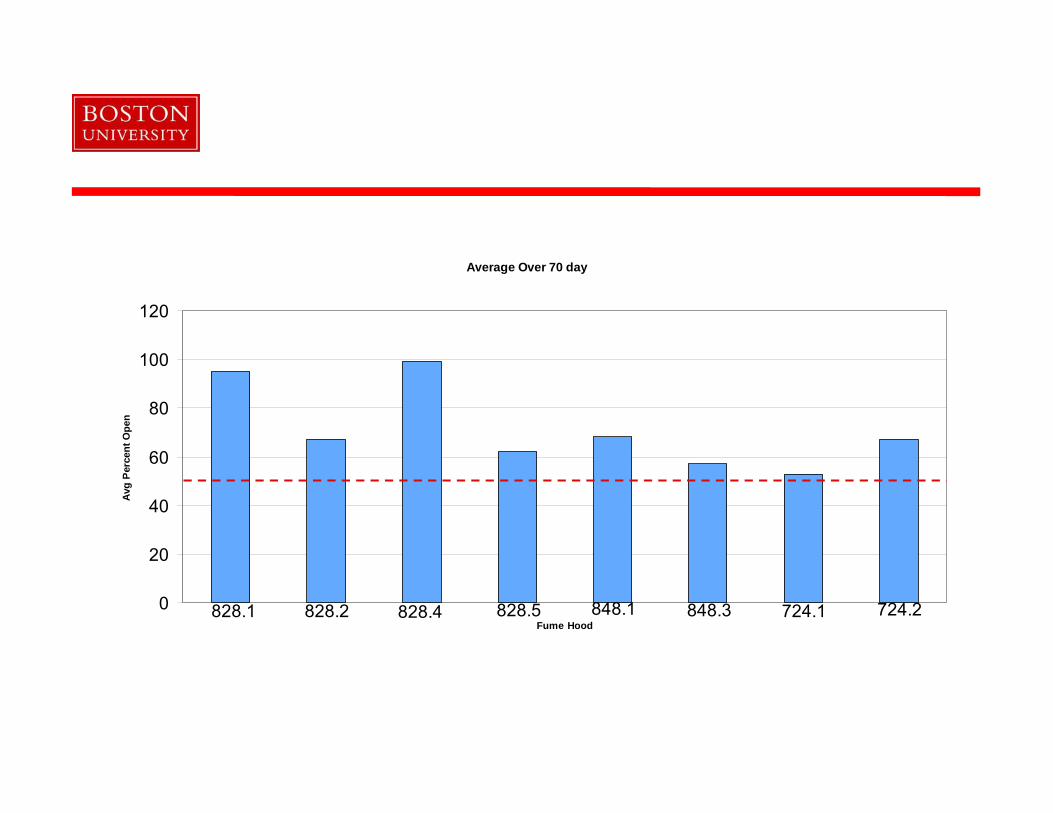
Trial Monitoring Results1 Day Dynamic Results Average over 70 days
828.4
828.1
848.3
724.2
828.2
828.5
724.1
848.1
•828.1, 828.4 never close their hoods •724.2 seems to be open at 70% 24/7
•724.1, 848.5, 848.1 doing a decent Job•848.3 Modulates, but why not close more?
Fum
e H
ood
Ope
n P
erce
nt
724.2724.1848.3848.1828.5828.4828.2828.10
20
40
60
80
100
120
Fume Hood
AVG
Per
cent
Ope
n
50%
Summary
• Hoods are energy hogs, BUT we need to look how they function as part of room and building HVAC systems to figure out potential savings
• Savings for VAV Hoods likely to be less for rooms with only 2-3 hoods in them, maybe none for 1.
• For those rooms where there’s an impact, consider Fume Hood monitoring, large variation of behavior & changes term by term
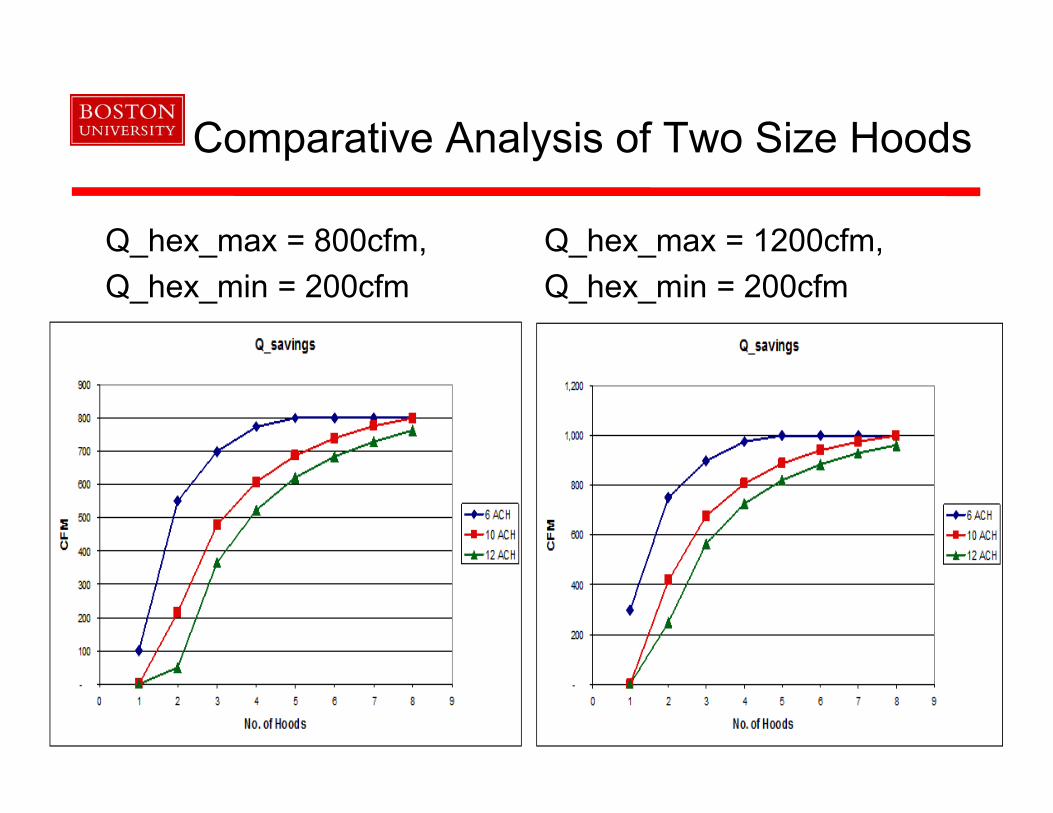
Comparative Analysis of Two Size Hoods
Q_hex_max = 800cfm,Q_hex_min = 200cfm
Q_hex_max = 1200cfm,Q_hex_min = 200cfm
Average Over 70 day
724.2724.1848.3848.1828.5828.4828.2828.10
20
40
60
80
100
120
Fume Hood
Avg
Per
cent
Ope
n

1 day Dynamic Results
0
20
40
60
80
100
120
12 AM 4 AM 8 AM 12 PM 4 PM 8 PMTime
Fum
e H
ood
Ope
n Pe
rcen
t