Embed Size (px)
Citation preview

Policy Research Working Paper 9688
When Do Refugees Return Home?
Evidence from Syrian Displacement in Mashreq
Lori BeamanHarun OnderStefanie Onder
Macroeconomics, Trade and Investment Global Practice June 2021
Pub
lic D
iscl
osur
e A
utho
rized
Pub
lic D
iscl
osur
e A
utho
rized
Pub
lic D
iscl
osur
e A
utho
rized
Pub
lic D
iscl
osur
e A
utho
rized

Produced by the Research Support Team
Abstract
The Policy Research Working Paper Series disseminates the findings of work in progress to encourage the exchange of ideas about development issues. An objective of the series is to get the findings out quickly, even if the presentations are less than fully polished. The papers carry the names of the authors and should be cited accordingly. The findings, interpretations, and conclusions expressed in this paper are entirely those of the authors. They do not necessarily represent the views of the International Bank for Reconstruction and Development/World Bank and its affiliated organizations, or those of the Executive Directors of the World Bank or the governments they represent.
Policy Research Working Paper 9688
This paper provides an empirical analysis of refugee returns to the Syrian Arab Republic. Since 2011, about 5.6 million Syrians—more than a quarter of the country’s pre-conflict population—have been registered as refugees. By mid-2018, only about 1.8 percent of them had returned to Syria voluntarily. This paper compiles a novel data set with administrative data for 2.16 million refugees, existing and new household surveys, a new conflict-events database, and
nightlights data for Syria to analyze the correlates of these returns. A reduction in conflict intensity and an increase in luminosity in Syria strongly increase the likelihood of refugees’ return. Differential return rates are observed along key demographic characteristics, such as age, gender, and family status between high and low conflict intensity areas. Interestingly, improvements in the conditions faced by refugees in exile can also increase the likelihood of return.
This paper is a product of the Macroeconomics, Trade and Investment Global Practice. It is part of a larger effort by the World Bank to provide open access to its research and make a contribution to development policy discussions around the world. Policy Research Working Papers are also posted on the Web at http://www.worldbank.org/prwp. The authors may be contacted at [email protected].

When Do Refugees Return Home? Evidencefrom Syrian Displacement in Mashreq∗
Lori Beaman,† Harun Onder,‡ and Stefanie Onder§
Key words: return migration, forced displacement, refugeesJEL codes: F22, D74, J61
∗An earlier version of this paper was prepared as a background note for the World Bank report “TheMobility of Displaced Syrians: An Economic and Social Analysis”. All errors are ours. The findings,interpretations, and conclusions expressed in this study do not necessarily reflect the views of the WorldBank, its Board of Directors, the governments they represent, or the UNHCR. We would like to thankthe participants of the 2020 Research Conference on Forced Displacement in Copenhagen organized bythe World Bank-UNHCR Joint Data Center with the Evidence for Policy Design (EPoD) and MiddleEast Initiative (MEI) at Harvard University and Population Studies and Training Center at BrownUniversity, seminar participants at the School of International Studies in American University, andSaroj Kumar Jha, Eric Le Borgne, Kevin Carey, Erhan Artuc, and Caglar Ozden for valuable commentsand suggestions. Natasha Ahuja, Ola Hisou, Gina Kosmidou, Michael Morris and Francesca Truffaprovided excellent research assistance.†Department of Economics and Institute for Policy Research, Northwestern University, Evanston,
IL‡Macroeconomics, Trade, and Investment Global Practice, World Bank Group, Washington, DC§School of International Service, American University, Washington, DC

1 Introduction
The recent literature on forced migration has largely focused on measuring the economic
impact of refugees on host countries.1 However, an important factor that shapes this
impact is refugees’ self-selection through return migration. An expansive literature on
temporary (voluntary) migration has shown that ignoring this selection can distort the
assessment of migrants’ assimilation profiles and, by corollary, their economic impact.2
This line of work has also revealed important properties of return decisions but only that
of economic migrants. We now know that refugees are distinct in many ways, including
their human capital investments and dynamic earnings profiles while in the destination
country, which is often attributed to differences in their subjective return probability
(Cortes (2004) and Galor and Stark (1991)). In this paper, we bring together these two
strands of literature by analyzing the return decisions of 2.16 million Syrian refugees
who were displaced between January 2011 and March 2018.
Starting from 2011, more than 5.6 million Syrians fled one of the most destructive
wars in recent decades, which led to more than 400,000 directly conflict-related deaths,
physical damage to about half of the schools and hospitals in major urban centers, and
deepened sectarian divisions (World Bank, 2017). The outflow of refugees peaked in
2013, but never ceased completely. In the meantime, according to the United Nations
High Commissioner for Refugees (UNHCR), 103,090 - about 1.8 percent - were verified
to return to the Syrian Arab Republic by mid-2018, the end point of our analysis.3 Our
sample covers those refugees registered by UNHCR in the Middle East and North Africa
Region (excluding Turkey and European countries), including returnees and those who1See Becker and Ferrara (2019), Verme and Schuettler (2019), and Ruiz and Vargas-Silva (2015)
for detailed reviews of the forced migration literature.2For an excellent review of this literature, see Dustmann and Görlach (2016).3The latest figures from UNHCR suggest that the return percentage has doubled to 4.1 percent
or 230,418 refugees by the end of 2019. However, this figure is still small in magnitude with the vastmajority of refugees remaining in their respective host countries.
2

stayed.
Our objective is to identify the factors that facilitated or hampered the return of
these refugees. However, an inherent challenge in the literature on conflict and forced
migration is the absence of a complete longitudinal data set for conditions in countries
of asylum and origin that can be mapped onto refugee characteristics. Establishing
causality is even more challenging. We make progress on the first part by combin-
ing different sources and types of data. For demographic characteristics of refugees
and their arrival and return information, we use administrative data from the Profile
Global Registration System (ProGres) database of UNHCR. For the conditions faced
by refugees in exile, we use vulnerability surveys conducted by UN agencies in Jordan
and Lebanon, and complement these with a new household survey comprising similar
demographic and socioeconomic modules but also including vignettes about the drivers
of return. Finally, for conditions in Syria, we have compiled a novel monthly conflict
events data set to use along with nighttime light emissions data that proxies access to
utilities.
These sources are utilized in two different but complementary ways. First, we exploit
the temporal and spatial variation of the nightlights and conflict events series to build a
sub-district-month panel for conditions inside Syria. This is used to analyze the impact
of changes in conflict and luminosity patterns on return in an aggregate manner using
ordinary least squares (OLS) and Poisson quasi maximum likelihood (PQML) count
models. Second, we use the detailed information on refugee characteristics provided by
ProGres together with conditions in countries of asylum,4 to analyze individual return
decisions. Given that we have arrival and - where applicable - return dates for each
refugee, we can study their likelihood of return for a given month using both discrete4Since the conditions in countries of asylum are only captured for a small sample of registered
refugees in Lebanon and Jordan, we approximate host country conditions with district averages forthe full sample.
3

and continuous time proportional hazard models, such as the complementary log-log
model (cloglog) and Cox proportional hazard model (Cox), respectively. This helps to
deal with the right-censored nature of the return problem.
Our results show that security (measured in the refugee’s home district) is an impor-
tant determinant of return. A one standard deviation improvement in security (mea-
sured by the change in a composite Conflict Events Index (CEI)5 between the previous
two quarters) increases returns by 6 percent when using the PQML model. Improved
access to electricity (measured at the refugee’s home sub-district level), and by extension
utilities, also encourages returns. In particular, a one standard deviation improvement
in luminosity (measured analogously to the CEI, comparing changes between the previ-
ous two quarters) increases returns by 3.8 percent. Overall, the conditions in Syria have
the expected signs aligned with the risk-adjusted expected payoff-based explanations
in standard models of migration (e.g., Sjaastad (1962) and Borjas (1987)).
Next, we turn to the analysis of what type of refugee is more likely to return to
Syria. Our results paint a complex picture of the decision-making process underlying
the spontaneous return behavior of refugees. Not only the individual characteristics
of a refugee, but also the social structure surrounding her can shape the likelihood
of return. For example, generally the likelihood of return increases dramatically with
age. In terms of social structure, a refugee who is a member of the immediate and
extended family of the principal applicant has a considerably higher hazard rate than
the principal applicant’s spouse. These patterns are further sensitive to the conditions
in Syria (i.e. conflict intensity), particularly for men. These results are consistent with
international experience, which suggests that individual family members - often single,
older men - return to the country of origin first to assess the situation on the ground,5The CEI is computed for each district-month using principal components analysis of normalized
key conflict events, such as light skirmishes, airstrikes, artillery strikes, and chemical attacks, as wellas the casualty-count.
4
while the remainder of the family remains in exile (World Bank, 2019).
Lastly, we analyze how conditions in the countries of asylum correlate with return
probabilities. Interestingly, our results do not support the common perception that
harsh conditions in host communities make refugees return. In fact, we find that more
food secure refugees are more likely to return. For example, a one standard deviation
increase in food security increases the hazard rate of return by 0.27%. We find similar,
but less robust, results for refugees with better housing conditions.
Our results and analysis are closely linked with the literature on the economic anal-
ysis of forced displacement. This literature includes a rapidly growing number of works
that consider the effects of forced migration on locals in the following areas: employ-
ment, wage, entrepreneurship and consumption (Braun and Kvasnicka (2014); Moser
et al. (2014); Ruiz and Vargas-Silva (2015); Borjas and Monras (2017); Tumen (2016);
and Alix-Garcia et al. (2018)), the incidence of crime and hostility, (Bell et al. (2013);
Hangartner et al. (2019)), and electoral outcomes (Dustmann et al. (2019)). These
papers, however, do not consider the return dynamics of refugees. The omission of
positive or negative self-selection of refugees through return migration can potentially
distort impact and economic performance assessments as shown by Abramitzky et al.
(2014) in the case of economic migration patterns during the Age of Mass Migration
(1850–1913) in the United States. A limited number of other papers, e.g. Cattaneo and
Peri (2016) and Clemens (2017), consider endogenous displacement driven by climate
and violence shocks, but they do not analyze return migration.
The analysis in this paper also contributes to a second, and more established, strand
of literature, which focuses on temporary migrations. An important share of this work
focuses on the differences between the economic behavior of those migrants who intend
to return and those who do not. Galor and Stark (1990) and Borjas and Bratsberg
(1996) argue, respectively, that a positive probability (or intention) of future return
5

to home country leads to higher savings and higher labor force participation among
migrants. Bauer and Sinning (2011) and Dustmann (1997) provide empirical evidence
for these arguments using migrant savings and labor force participation data from Ger-
many, respectively. Bijwaard and Wahba (2014) compare the return trends of migrants
in the Netherlands and show that the effect of host-country income on propensity of
return migration is U-shaped, with migrants from low and high income groups being
more likely to return. Gibson and McKenzie (2011) use a cross-section survey of top
high-school performers of cohorts from 1976 to 2004 in Tonga, Papua New Guinea, and
New Zealand to assess the determinants of migration and return decisions. For this
group, return is found to be primarily linked to family and lifestyle reasons rather than
wage differentials across countries.
Some of our results are analogous to those in the temporary migration literature
(e.g., the positive associations between income and return in the case of migrants and
between more meals and return in the case of tenured refugees). However, these are
probably driven by different mechanisms. To elaborate on this point, we use a simple
migration model to show that for Syrian refugees, most of whom live near subsistence
level, the costs associated with return could be prohibitive. In this case, a permanent
improvement in host country conditions has two effects on the comparison of expected
lifetime utility across return and stay options. First, it reduces the opportunity cost
of the return decision. Second, it makes the return option less attractive as the gap
between future utilities in return and no-return scenarios decreases with a higher per-
manent income in exile. For initially high income levels, with a small increase in income,
the second effect dominates and return becomes less attractive. In contrast, when start-
ing from an income that is too close to the return cost, a small increase in income relaxes
the opportunity cost of return drastically, which dominates the second effect and makes
return more attractive.
6

The number of refugees who have returned is still very small, so we caveat that the
decision process behind these refugees choosing to return may be very different than
what we will observe with a larger mass return. The analysis of hypothetical vignettes,
which were administered to a representative sample of refugees in Lebanon and Jordan,
suggests that conditions in Syria - in particular whether the family’s house in Syria was
destroyed and the conditions of schools - will play a major role in the return decision
going forward. The contribution of the paper, however, is instead to understand factors
related to early, voluntary return.
This paper continues as follows. The next section briefly provides contextual in-
formation regarding the displacement of Syrians. The third section describes our data
and empirical strategy. We discuss our results in the fourth section. Finally, we discuss
some key results by employing a simple framework in the fifth section, before conclud-
ing. The appendices provide additional material: detailed variable descriptions and
robustness checks.
2 Syrian Refugees in Mashreq: Background6
When the first “Arab Spring” protests erupted in 2011, Syria was a country of 20.7
million people. After a growth spell in the preceding decade, GDP per capita reached
USD 2,806 in 2010. Despite the seemingly improving economic conditions, however, the
social unrest escalated rapidly and by mid-2011 a full-scale armed conflict was already
unfolding. Since then, the conflict has led to more than 400,000 directly conflict-induced
fatalities and millions of indirect casualties, often by means of severe deprivation.
The brutal conflict in Syria has also created the world’s largest forced displacement
crisis since World War II. As of end-2019, over half of the country’s pre-conflict popu-6This section refers to the findings of World Bank (2019) unless noted otherwise.
7

lation remains displaced. About 5.6 million Syrians are registered as refugees outside
of their country and another 6.2 million persons are displaced within Syria’s borders.
Of the refugees, most (3.6 million) reside in Turkey, with another 1.8 million in other
countries in the Middle East and North Africa.
In proportion to host country populations, refugees in Mashreq are among the largest
displaced groups in the world, as shown in Table 1. In Lebanon, about 0.91 million
registered refugees (close to 20 percent of the country’s population before the Syrian
conflict) inhabit informal settlements which are spread across a large part of Lebanon,
with concentrations near the Syrian border and in Beqaa. In Jordan, about a fifth
of the 0.66 million registered Syrian refugees stay in three camps (Zaatari in Mafraq
governorate, Azraq and Mrajeeb Al Fhood in Zarqa governorate). Those refugees who
live outside camps are largely spread across Amman, Mafraq and Irbid governorates. In
Iraq, the number of refugees is small compared to the country’s total population (about
0.7 percent), but they constitute 5 percent of Iraq’s Kurdistan Region population, where
almost all refugees reside with 40 percent staying in camps.
The Syrian refugees in Mashreq are an economically active population. In 2018, the
labor force participation (LFP) rate of Syrian men was 68 percent in Lebanon and 63.3
percent in Jordan (World Bank (2017)). In comparison to the LFP of Syrian men in
Syria (79.1 percent), these rates are lower. However, unemployment and underemploy-
ment are likely to be more prevalent in Syria, for which (and for Iraq) we do not have
comprehensive data . The female LFP has been typically low in Lebanon, Jordan and
Syria, at 10, 13 and 12 percent, respectively.
In both Lebanon and Jordan, Syrian labor is concentrated in the manufacturing,
construction and agriculture sectors, mostly on an informal basis. The regulations re-
stricting employment of foreign labor were in place before the arrival of Syrian refugees
in both countries. In Lebanon, a decree that dates back to 1964 (Decree No. 17561,
8

Article 9), gives mandate to the Ministry of Labor to announce sectors that are closed
to non-Lebanese nationals annually. With resolutions No. 1/19 in 2013 and No. 1/197
in 2014, the only professions open to Syrians were narrowed down to agriculture, con-
struction, and cleaning. In Jordan, a Ministry of Labor decision dated January 4, 2016
restricted the sectors open to non-Jordanians to manufacturing, construction, and agri-
culture. The Jordanian government has undertaken a number of measures to formalize
the labor force participation of Syrian refugees. In February 2016, the government
announced the “Jordan Compact", which comprised commitment to issue formal work
permits to 200,000 Syrian refugees and eased procedures to obtain them (e.g., the
foreign passport requirement was abolished and exemptions from a series of medical
check-ups were granted). By June 2018, an estimated 105,404 work permits were is-
sued: 29 percent in the agriculture sector, 43 percent in construction and 11 percent in
manufacturing.
In addition to labor market activity, refugees are also eligible for assistance through
various programs managed by host country governments and international organiza-
tions like UNHCR, UNICEF, and the WFP. Basic-needs support takes the form of
winterization assistance, cash assistance, and basic needs kits. Eligibility for assistance
is typically determined by a set of common indicators of vulnerability with associated
thresholds. A survival minimum expenditure basket (MEB) and family size are used to
determine the value of the cash transfers. For example, in Jordan, the MEB for a family
of four was estimated at 387 Jordanian dinars (JD) per person per month, and the total
size of the transfers (UNHCR and WFP combined), was 196 JD in 2018. Despite these
efforts, however, poverty prevails among Syrian refugees. According to World Bank
(2019), the extreme poverty rate of Syrian refugees in Jordan (51-61 percent) and to a
lesser extent in Lebanon (37-50 percent) remained close to that in Syria (55-67 percent)
in 2018.
9

Under these conditions, and despite the active conflict in Syria, there has been a
small, but non-negligible, number of returns to Syria. Although the exact number is
not known, as returnees may wish to remain confidential for security reasons, UNHCR
announced 213,418 verified spontaneous returns from 2016 until end-2019. Accordingly,
among all refugees registered in the respective countries, about 15.4 percent in Iraq, 8.1
percent in Jordan, and 5.9 percent in Lebanon were verified to have returned to Syria
in that period.
Figure 1 provides a pairwise comparison between those who returned and those
who stayed in terms of their case size, age, and adult education distributions. The top
panel shows that smaller households constitute a greater share of the returnee sample
as compared to the non-returnees. The median case sizes are five for the returnees
and 5.3 for the non-returnees. The middle panel shows that whereas children (<15)
constitute a smaller share of the returnee sample, seniors (>55) constitute a larger
share, pushing the median age of returnees above that of non-returnees. Finally, the
bottom panel shows that the median years of schooling among returnees is lower than
that of the non-returnees. Individuals with no schooling comprise about 19 percent of
the adult returnee population, while the same category comprise less than 12 percent
of the non-returnee population.
A separate comparison across countries in our data set shows that refugees also
stayed for different durations in different countries. Refugees in Lebanon stayed longer
than the refugees in the other two countries included in the study. The average returnee
from Lebanon remained in the country of asylum for about 1.5 years more than peers
from Iraq and 10 months longer than those from Jordan. One may consider differences
in arrival year as a driving factor in explaining such differences in duration of stay, that
is, if refugees arrived earlier in one country, then they will stay longer. However, this
is not true. The relative distribution of arrival times is very similar across all three
10

countries covered in this study.
We next turn to analyzing the factors that helped or hindered the return of Syrian
refugees until early 2018.
3 Data and Empirical Strategy
Return migration decisions are potentially influenced by expected payoffs in both the
country of origin and country of asylum, as well as the individual characteristics of
refugees. To analyze these factors, we need a comprehensive data set, which is often
not available especially in active conflict situations. In what follows, we describe the
strategy we followed in exploiting the available information.
3.1 Data
With an active conflict situation in Syria, a complete longitudinal data set for conditions
in countries of asylum and origin was not available. Thus, we adopt a pragmatic
approach that combines different sources and types of data.
Refugee attributes: We use the Profile Global Registration System (ProGres)
database, which is compiled by UNHCR to record each person of concern who ap-
proaches it.7 Our version comprised about 2.16 million Syrian refugees in the Middle
East and North Africa region (Turkey and European countries are not included), with
a cutoff date of March 2018.
The ProGres database is a limited administrative database, which functions like a
civil register. It includes a broad set of social and demographic characteristics for each
recorded individual: e.g., sex, age, marriage status, religion, ethnicity, occupation, and7Registration with UNHCR is not mandatory; Lebanon suspended registration in 2015 but UNHCR
continued to collect data for the new arrival cases that approached it in order to include them in theirassistance provision process.
11

education. In addition, information on their registration status is recorded, including
refugee status, arrival and, where applicable, return date, and sub-district-level location
information for last residence in Syria and current residence in the country of asylum.
It also identifies kinship of individuals within each “case" (e.g., familial relationships of
everyone within a case to the principal applicant, ranging from members of the nuclear
family to extended family, such as in-laws and aunts).
Following the initial registration, entries are updated in subsequent contacts. Up-
date frequencies vary from one operation to another, with at least 5 percent of all
observations being updated in a given month.8 Therefore, although information on
single-shot events like arrival and return dates is fixed, other information like occupa-
tion, education and marital status may change over time. In the case of education and
marital status, these changes are largely driven by the aging of the refugee. However,
the occupation variable is more problematic, since it could refer to current employ-
ment or past employment (including in Syria) depending on when it was last updated.
Therefore, while we are able to use all of the demographic and registration information
of the ProGres database, we exclude the occupation variable from the main analysis.
Conditions in countries of asylum: We use vulnerability surveys conducted by
UN agencies in Jordan and Lebanon. These surveys assess living conditions of registered
refugees at the case, household, and individual levelS, and monitor protection, shelter,
education, health, water and sanitation, as well as poverty and food coping strategies.
Our data from the Vulnerability Assessment Framework (VAF) in Jordan comprises
two years: 2015 and 2017 (sampled cases: 2,163 and 2,001), which are comparable.
Samples are weighted by the share of refugees in each governorate, and representa-
tive at the 95% confidence interval. Data from the Vulnerability Assessment of Syrian8For example, in Tunisia where UNHCR has fewer than 600 persons of concern, the information is
updated every 3 months, while in the Arab Republic of Egypt the cycle is every 18 months, which isthe maximum in the region. For the overall data set, we can assume that the information is up-to-dateon average for 2017.
12

Refugees (VASyR) in Lebanon covers three years: 2015, 2016, and 2017 (sampled house-
holds: 4,105, 4,596, and 4966, respectively). VASyR surveys employ a two-stage cluster
sampling approach: first, to ensure geographical representativeness, 30 clusters are ran-
domly selected in proportion to refugee population size and, then, 5 to 6 randomly
selected households in each selected cluster are visited.
There are a number of challenges when using the VAF and VASyr surveys. The
first is the limited comparability of questions across surveys. This limits the number
of variables we can use to measure conditions in Lebanon and Jordan consistently.
Nonetheless, we are able to proxy for living conditions and access to employment by
computing a composite food security index using principal components analysis (PCA)
of normalized food consumption variables. The latter include the average number of
meals per day, and the average number of days a week a case did not have to borrow
food, restrict portion sizes, limit the number of meals or restrict consumption of adults.
A PCA index is also computed for housing conditions, using normalized dummies for
whether the case has an acceptable roof and windows, and access to a (private) latrine.
The second problem is the limited sample size of the two surveys. To take advan-
tage of the much larger ProGres database of nearly 2.2. million refugees, we compute
area averages for the above-mentioned case-level host community conditions, aggregat-
ing to the smallest possible geographic unit available (district level for Lebanon and
governorate level for Jordan). This information is then matched with all refugees in
the ProGres database that have location information in Lebanon and Jordan, yielding
a sample of 1.85 million refugees.
Finally, we worry about reporting bias. Respondents may have felt they were more
likely to receive assistance if they reported worse living conditions. The bias could
also go the other way if refugees want to signal their gratitude for the assistance they
receive. The problem is even more acute given our research question. Those who intend
13

to return may have systematically different tendencies in reporting. It is possible that
those who plan to return no longer feel the need to mis-report their income, and this
would generate a bias in the correlation between the return decision and asylum country
conditions. We attempt to solve this problem in two ways. First, we exploit the fact
that we observe whether refugees return to Syria for 1-3 years after the survey data
was collected. We can therefore remove the responses from cases who ultimately return
when aggregating the data to the district and governorate levels. This should at least
keep the reporting bias constant across geographic areas. Second, we employ a fixed
effect specification which looks at changes in conditions in Lebanon and Jordan, which
will remove differences in reporting bias which are time invariant.
Conditions in Syria: To capture conflict dynamics, we compiled a novel conflict
events data set, covering all districts in Syria between January 2011 and August 2018
at a monthly frequency. This data set provides a record of verified conflict-driven
casualties, changes in area control, and key conflict events (light skirmishes, airstrikes,
artillery strikes, and chemical attacks) using more than 7,000 news items and multiple
databases.9 Whereas casualties are recorded as a count variable in this case, other
conflict events are defined categorically with two or more values, e.g., yes, no for presence
of combat activity and low, medium, high for the intensity of it. This allows us to
differentiate between different types of conflict events while assessing the impact on
the return decisions of refugees: a priori, some conflict events, like chemical attacks,
are expected to pose a greater deterrent to return than others. Such decomposition of
conflict events also helps us to reduce potential endogeneity concerns between return
and the proxies of conflict intensity, e.g., casualties. Finally, we also computed a Conflict9These include the following: ACLED, Carter Center Syria Conflict Resolution Database, Institute
of War Syria Events Database, University of Maryland Global Terrorism Database, Syrian Observatoryfor Human Rights Database, Syrian Shuhada Database, The Uppsala Conflict Data Program andThe Violations Documentation Center among others. In addition, activity-specific databases havebeen consulted, including airwars.org and Arms Control Organization timeline of confirmed chemicalweapon use in Syria.
14

Events Index (CEI) for each district-month using PCA of normalized conflict activity.10
This index is used where a more complete picture of the conflict conditions is considered.
For non-security-related conditions in Syria, it was not possible to acquire a com-
parable and geographically comprehensive time series. Instead, we use nighttime lights
measurements from the Suomi National Polar Partnership (SNPP) satellite, which was
launched by NASA and NOAA in 2011. The satellite uses a Visible Infrared Imag-
ing Radiometer Suite (VIIRS) instrument to collect low light imaging data in spectral
bands covering emissions generated by electric lights, excluding stray light, lightning,
lunar illumination, and cloud-cover. Temporal averaging is done on a monthly and
annual basis starting from April 2012.
For the purposes of this study, we used the monthly data set with zonal statistics
up to ADM3-level aggregation, comprising governorate, district, and sub-district divi-
sions. The nightlights in this scheme can be interpreted narrowly as the availability of
electricity (grid or generator) or more generally as a proxy measure for the existence of
utilities, economic activity or the conflict-driven isolation of a given location. Figure 2
maps the evolution of visual nightlights and the CEI onto each other. From April 2012
(the first available data point) until April 2015 (midpoint of series), total luminosity
decreased by 65% across Syria. By April 2018, about half of these losses were offset,
with the exception of areas with persistently intensive conflict like Aleppo and Idleb.
Lastly, Figure 3 provides an overview of the evolution of the Syrian conflict by
year, across districts within Syria. The figure plots the number of casualties per year
and shows the variation in conflict intensity both over time and over space. This is the
variation we will use in our analysis below. However, it is important to note that several
districts have experienced persistently high levels of conflict since its advent. This is
illustrated by Figure 4, which correlates the district-level return percentage with the10The components included key conflict events (light skirmishes, airstrikes, artillery strikes, and
chemical attacks) and the casualty-count for the district-month.
15

mean CEI over our sample period. Since return decisions are likely impacted by the
persistence of conflict, we classify districts into high and low conflict districts, using the
top 10th percentile of the mean CEI as a cut-off point.11 We will use this classification
to explore the extent to which return decisions of key social and demographic groups
are impacted by the persistence of conflict.
Survey of refugees in Lebanon and Jordan: In a survey of 900 Syrian refugees
in Jordan and Lebanon, we randomly varied the details of the scenario or vignette
presented to a given individual respondent. Some refugee families are certainly more
predisposed to wanting to return than others. By describing hypothetical scenarios, but
ones which hit fairly close to home, and varying key factors within those scenarios should
help us identify what factors are important to many refugee families when deciding
whether to return.
For all respondents in all vignettes, we asked “How likely is this family to return
to Syria in the next 2 months?” where the respondent could answer using a Likert
scale, ranging from “Very likely” to “Very unlikely”. For the analysis below, we use an
indicator which is equal to one if a respondent says the family is either very likely or
likely to return, and 0 if the respondent says neutral, unlikely or very unlikely.
Each respondent was presented with three vignettes, where key aspects of the sce-
narios were randomly varied across respondents. These three vignettes were designed
to probe the impact of different pull and push factors on the refugees’ return deci-
sion, allowing us to go beyond the data limitations of the above analysis. That is,
the vignettes not only explore the impact of security on return decisions, but also of
employment prospects in both the country of asylum and Syria, the status of property
in the home community, and the availability of financial assistance.
In particular, the first vignette probes three questions: first, whether the ability to11According to this classification, Jebel Saman, Deir-ez-Zor, Homs, Al Ma’ra, and Duma are high-
conflict districts.
16

work in the host country affects the return decision and moreover if the ability to work
is more or less important among highly skilled workers. Second, whether the length
of time that security has been stabilized in the origin community affects the return
decision. Third, whether financial assistance, and the level of that assistance, affects
the return decision.
The second vignette has two key aspects of the scenario which varies across respon-
dents. The first varies whether the wife of a refugee family from Syria, now living in
either Lebanon or Jordan (the country was matched to the country where the respon-
dent was currently residing), was working as a housekeeper or stayed home to take
care of the family. The second aspect varied the opportunities of the husband of the
family to get work back in their home community in Syria. The vignette also sought
to understand how a family may decide to send some, but not all, family members to
return and elicits the likelihood of each family member to return.
The third and final vignette varied what information a hypothetical family in either
Lebanon or Jordan had about their home back in Syria. A respondent was told that the
family’s house in Syria was either destroyed or intact and unoccupied. The information
was provided to the family either by a resident of the village or from family members
who remained in their village in Syria.
As part of this survey, we also collected information on the vulnerability of the sur-
veyed refugees using the subset of common questions from the VAF and VASyr surveys.
Since the data for this survey was collected through a third party unaffiliated with the
UNHCR - and, thus, any decision to allocate assistance - we would expect answers on
income, food security, and poverty coping strategies to be more truthful. These data
provide important contextual information on the correlations between income, food
security and employment status.
Overall, our ability to put together a comprehensive data set with key dimensions
17

(micro-characteristics of refugees, conflict dynamics, and the conditions in the countries
of asylum and origin) has made the analysis of return decisions possible. The next
section will discuss how we leverage the different dimensions of this data set for our
purposes.
3.2 Empirical Strategy
The analysis proceeds in two parts: we first analyze a panel data set, constructed at the
sub-district level within Syria,12 to understand the relationship between returns and se-
curity and access to utilities in Syria. Formally, we estimate the following specification:
ln(returnssmt) = α + β1∆CEIdmt + β2∆luminositydmt + β3AoCdmt (1)
+δd + τt + εdmt,
where returnssmt is the number of refugees originally from sub-district s in Syria who
returned to Syria in month m of year t. Also included are district fixed effects δd and
year fixed effects, τt.13 Since refugees will make the decision to return home based on
past conflict events and recent changes in standards of living like electricity reliability,
we look at a lag of both the conflict events index (CEI) and luminosity. In particular
we construct ∆CEIdmt as the change in the conflict events index for district d between
the quarter immediately prior to month m in year t from the previous quarter.14 The
second term on the right hand side ∆luminositysmt is analogously constructed using
the same lagged time periods. The third term AoCsmt is a series of Area of Control
dummy variables, which capture who is in control of sub-district s in month m in year12Syria is a unitary state, but for administrative purposes it is divided into 14 governorates, which
are further divided into 65 districts and 281 sub-districts.13As a robustness check, we also include month of the year fixed effects to pick up seasonal changes
in migration patterns.14Note that the conflict data is only available at the district level.
18

t. These include a dummy for who controls the area (i.e., only government forces,
only non-government forces, or contested). The omitted category is sole control by
the Government of Syria, which held about half of the sub-districts during our sample
period. Standard errors are clustered at the district level to account for arbitrary serial
correlation over time within districts.
An important challenge we face in this analysis is the low incidence of actual returns.
With less than 4% return records in our registration data, 67% of month-sub-district
observations have zero returns. Of all 257 sub-districts, 29 sub-districts (11%) have no
returns during the entire sample period. The mean return in the entire sample period
is 3 individuals in a given month, with a variance of 281. To address this problem,
we estimate a Poisson Quasi Maximum Likelihood (PQML) count model, with robust
standard errors clustered by district (Wooldridge, 1999). Specifically, we estimate by
Maximum Likelihood estimator equations such that
E(returnssmt) = δdexp(β1∆CEIdmt + β2∆lumsmt + β3AoCsmt + τt) (2)
where the variables are defined as in equation 1. Note that the β coefficients in Equation
2 represent the semi-elasticity of returns with respect to changes in conflict intensity
or luminosity in the origin district. The PQML count model is particularly suitable
because it is robust to arbitrary distributional assumptions so long as the conditional
mean is specified by 2.
In the second part of the empirical analysis we aim to exploit the heterogeneity of
individual characteristics to identify other correlates of refugee returns. With detailed
arrival and return information from the ProGres database, we construct an unbalanced
individual-level panel. Each refugee i is observed repeatedly from her arrival month
until the month that she either chose to return back to Syria or March 2018 - the last
19
month for which we have ProGres data. However, this is a right-censored panel (i.e.,
the majority of individuals did not return by the end of our records). Thus, we use
survival analysis. By estimating the hazard rate of return for a given point (month)
in time, conditional on refugee i not having returned yet, survival models account for
the right-censoring and time-varying explanatory variables that are problematic when
using OLS or a binary dependent variable model, such as logit or probit to estimate
transition probabilities (Cameron and Trivedi (2005) and Jenkins (2005)).
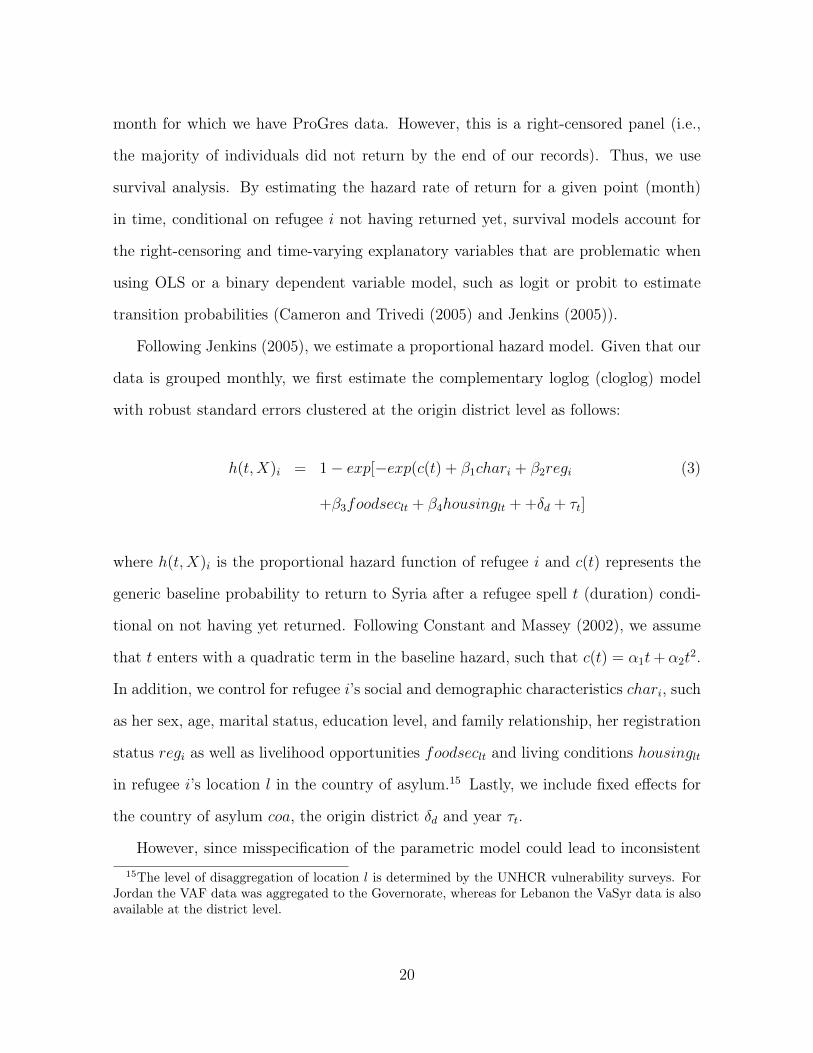
Following Jenkins (2005), we estimate a proportional hazard model. Given that our
data is grouped monthly, we first estimate the complementary loglog (cloglog) model
with robust standard errors clustered at the origin district level as follows:
h(t,X)i = 1− exp[−exp(c(t) + β1chari + β2regi (3)
+β3foodseclt + β4housinglt + +δd + τt]
where h(t,X)i is the proportional hazard function of refugee i and c(t) represents the
generic baseline probability to return to Syria after a refugee spell t (duration) condi-
tional on not having yet returned. Following Constant and Massey (2002), we assume
that t enters with a quadratic term in the baseline hazard, such that c(t) = α1t+ α2t2.
In addition, we control for refugee i’s social and demographic characteristics chari, such
as her sex, age, marital status, education level, and family relationship, her registration
status regi as well as livelihood opportunities foodseclt and living conditions housinglt
in refugee i’s location l in the country of asylum.15 Lastly, we include fixed effects for
the country of asylum coa, the origin district δd and year τt.
However, since misspecification of the parametric model could lead to inconsistent15The level of disaggregation of location l is determined by the UNHCR vulnerability surveys. For
Jordan the VAF data was aggregated to the Governorate, whereas for Lebanon the VaSyr data is alsoavailable at the district level.
20

estimates, we also estimate the continuous time, semi-parametric Cox proportional
hazard (Cox) model. The main advantage of the Cox model is that it allows us to
estimate the relationship between the hazard rate and the determinants of refugee
returns without having to make any assumptions about the shape of the baseline hazard
function. A continuous time model might also be appropriate in this context, given
that we have a long panel of 75 months. Using the same variable definition as in 3, we
estimate
h(t) = h0(t)exp[β1chari + β2regi + β3foodsect + β4housingt + µl + δd + τt] (4)
We restrict survival analysis to the Syrian refugees based in Jordan and Lebanon
as their host country conditions are proxied by the geographical aggregates computed
from the VAF and VASyr surveys. Despite this restriction, more than 85 percent of
all refugees in our data set is included in the analysis. It is important to note that the
conditions in the country of asylum may be the result of a refugee’s anticipated length
of stay in the host country. As such, we discuss these results, which are reported in
section 4, as correlations and not necessarily causal relationships.
4 Results
4.1 Conditions in Syria
The evolution of the security situation and overall quality of life must be important
factors for refugees to consider returning home. We therefore start this analysis by
looking at how the return decision varies as a function of our composite measure of
security (the CEI) and the luminosity measure using nightlights.
Table 2 shows an overall robust relationship between security and returns. In our
21

preferred specifications, columns (3) and (4), we find that a one standard deviation
decrease in the quarterly ∆ CEI - that is a standard deviation improvement in conflict
conditions relative to the previous quarter - increases returns by 2.3 and 6 percent,
respectively. These effects are small but precisely estimated in both OLS and PQML
specifications. They also exclude Daraa, which carried a special status during the con-
flict, for the sake of a more general representation of the conflict-return relationship.16
Inclusion of Daraa would seem to be qualitatively inconsequential in the OLS (column
1), but weakens the conflict coefficient in PQML (column 2). We keep the exclusion
for the remainder of the paper. Columns (5) and (6) add in month fixed effects to our
preferred specifications for robustness, and the estimated coefficients on the conflict
index are qualitatively unchanged.
Access to electricity, and by extension utilities (measured at the sub-district level),
also encourages returns. In particular, our preferred specifications demonstrate that a
one standard deviation increase in luminosity, relative to the level of luminosity two
quarters ago, increases returns by 4.6 and 3.8 percent (for the OLS and PQML count
models, respectively). These results are robust, as shown in columns (1)-(5). However,
the PQML model with month fixed effects erodes the effect of luminosity in column
(6). Nevertheless, the net takeaway from this analysis is that an omnibus measure of
quality of life, proxied by nightlights, is a factor in refugees’ decisions to return home
even in the presence of ongoing conflict at the country level.
In table 3, we look at how the different types of conflict affect the return decision.
We find that overall casualties (conflict-driven mortality) reduce the return decision.16Daraa was part of a deescalation zone established by the governments of the United States, Jordan
and the Russian Federation. Unlike the other three deescalation zones created as part of the AstanaProcess, Daraa shared a contiguous border between origin and asylum locations for a large groupof Syrian refugees for the duration of our analysis. This made movements between the two regions,including the delivery of international aid, less complicated as crossing government-controlled areas wasnot necessary (Bojicic-Dzelilovic and Turkmani (2018)). The patterns of asylum seeking and returnsare therefore distinct in this area, and less correlated with the time series conflict pattern.
22

The magnitudes are similar as we saw with the overall conflict index. A one standard
deviation decline in quarterly casualties, which is about 90, is associated with a 2%
higher return rate. The use of chemical weapons and incidents of skirmishes and fighting
all have a significant negative effect on returns to Syria. In results not shown, we find
less robust relationships between the number of air strikes and incidents of artillery and
carpet bombing and refugees’ decision to return.
4.1.1 Vignette Analysis
We complement the study of returns that have already happened with data from hy-
pothetical vignettes. There are advantages and disadvantages of both of these data
sources. The returns observed to date are still a very small percentage of the overall
refugee population, and therefore the factors affecting their return decision may not
be representative of the larger Syrian refugee population. The hypothetical vignettes,
while clearly weaker in that they represent hypothetical scenarios, seek to provide in-
sights into the external validity of the earlier results.
The data is analyzed using a straightforward regression specification:
Pr(yi = 1|X) = α + β1V ignetteScenarioi + γJordani + εi (5)
where yi is an indicator variable =1 if the respondent i reported that the family
depicted in the vignette was Very likely or Likely to return to Syria in the next two
months. The variable Jordan=1 if the respondent resides in Jordan and =0 if the
respondent i currently resides in Lebanon. The different scenarios are captured by either
a dummy variable V ignetteScenarioi or a series of dummy variables. β1 captures how
changes in a refugee family’s conditions – either in their country of asylum or back in
Syria – affect the perception that the refugee will return to Syria.
In table 4, we look at whether the condition of the family’s house back in Syria
23

affects the return decision. The reference group in this table is the scenario where the
family hears from their former neighbors that their house is still intact. Column (1)
shows that in this scenario, 38% of respondents say that the hypothetical household is
likely or very likely to return to Syria in the next 2 months. However, finding out that
their home was destroyed has a substantial negative effect, reducing the probability
of expected return by 22 to 23 percentage points. This constitutes a 60% reduction
in respondents’ stated perception of the family’s likelihood to return. The source of
the information, neighbors or extended family still in the village, did not matter. The
results are similar for both refugees who are officially registered with UNHCR (column
2) and those who are not (column 3).
Table 5 looks at another aspect of life in Syria: whether schools are open and
functioning well. In column (1), we see that 43% of respondents who are told about a
scenario in which a refugee whose wife is working in their country of asylum and who
hears that schools in Syria are open say that the depicted family are likely or very likely
to return in the next two months. Whether the wife is working or not in the country of
asylum does not have a significant effect on the reported likelihood of return. However,
the vignette highlights how schools in Syria affect the return decision: respondents are
19 percentage points less likely to expect the hypothetical household to return when
the schools are under-resourced. This is more than a 40% reduction in the likelihood
of expected return.
Overall, these two vignettes signal that conditions back home in Syria have a large
and economically meaningful impact on the return decisions.
4.1.2 Does Conflict Affect Who Returns?
The conflict pattern in Syria may not only affect the total number of individuals who
choose to return, but also the profile of the refugees who return. In this section, we show
24

that different types of refugees, as can be measured using observable characteristics,
return to high versus low conflict areas.
We designated districts that were in the top 10th percentile of the conflict events
index (CEI) averaged over the time period January 2012-2018 as “high conflict”. As was
seen in Figure 4, these districts experienced significantly more conflict over our study
period. Note we do not observe where refugees return to, so we instead use their origin
district as a proxy. We then look at the percentage of refugees from a given district in
Syria in that demographic category who returned. This helps account for the fact that
the profile of refugees from a given origin district may have been altered when there is
high versus low conflict - i.e. there may be more widows among the refugee population
who hail from high conflict districts.
Figure 5 has five panels. The regression results behind these figures are available
in appendix tables A1-A4.17 Note that the standard error bars show differences within
each conflict grouping (e.g. the difference between male and female refugees among
low conflict districts; and analogously the difference between male and female refugees
within high conflict districts). Below the figure legend, we report the difference and
significance of the interaction term of High conflict x Demographic characteristic(s)
explored in the figure.
The upper left panel looks at the gender composition. 2 percent of female refugees
(all ages) from low conflict districts returned to Syria, compared with 1.6% for male
refugees from low conflict districts. Qualitatively, the picture is the same in high conflict
areas, though female refugees from high conflict districts return at a very slightly but
statistically significant lower rate than females from low conflict areas (difference is17The regression specification is
%returned = β0 + β1X + β2HighConflict+ β3XxHighConflict+ ε
where X is the demographic characteristic(s) explored in the panel.
25

-.00086, p value<.01).
The second and third panels in Figure 5 look at the relationship between age and
the return percentages, for males and females, respectively. In all cases, we observe that
older refugees are the most likely to return, and all age groups from high conflict areas
are slightly less likely to return than refugees from low conflict districts. However, in
panel 2 focusing on males, the largest difference in return probability between high and
low conflict areas is among the oldest age group. There is a small - but statistically
significant - decline also for prime-aged males, 15-44. We found it surprising that we
did not observe a large decline in the return probability among men in this age range,
given the fear of being drafted to fight in the conflict. However, this may reflect that the
risk of being drafted exists throughout the country. Overall, the age gradient flattens
among males from high conflict areas. Panel 3 demonstrates that the age gradient for
women is more pronounced, among refugees from both low and high conflict areas.
Female refugees are increasingly likely to return with age, with approximately 11% of
women ages 60 plus who come from low conflict areas returning. This contrasts with
men from low conflict districts in the same age range having a return percentage of
6.5%.
Panel 4 of Figure 5, on the left in the second row, looks at the return rates among
refugees with different levels of education. Return rates are overwhelmingly higher
among refugees with the very lowest level of education. This is true among refugees
coming from low and high conflict areas. While this work is descriptive, it suggests
that changes in conflict intensity in Syria may not alter the distribution of high and
low educated workers among the refugee population in a given country of asylum.
We will return to this finding in section 4.3, where we discuss how conditions in the
country of asylum relate to the return decision. For now, we will also point out that
monthly per capita household income, as measured by our survey in 2018, is increasing
26
with educational level within the household (though not all differences are statistically
significant given the fairly small sample size). This can be seen in Appendix Figure A1.
The final panel of Figure 5 explores who within a case returns. A case is defined
by UNHCR and does not always follow a traditional household definition. Among the
refugee population, 96.5% are close family members to the head of the case - i.e. the
spouse or child of the head of the case. However, there can also be brothers, parents,
etc. of the “household head” all in the same case. We see that individuals who are more
distantly related to the head of the case are very likely to return to Syria. In fact, 22%
of these individuals who originated in low conflict districts return to Syria in our study
timeframe. This is in contrast to 2% for individuals who are nuclear family members.
The figure shows that the difference between nuclear and immediate/extended family
members narrows slightly in high conflict areas but the same pattern overwhelmingly
persists.
These figures highlight some stark patterns of who returns based on demographic
characteristics, which we explore further in the next section. They also provide sug-
gestive evidence that the conditions in Syria impact refugees’ decisions to return. The
return rate among refugees who come from high conflict districts are overall lower, and
the demographic pattern of who returns shifts towards being less elderly.
4.2 Demographic Factors
Next, we analyze how social and demographic characteristics of adult refugees correlate
with return decisions by means of survival analysis. We focus on adult refugees (age 15
years or older), since it is more likely that their characteristics and relationships with
the rest of the case will determine which member(s) of the case return to Syria.
The findings in Table 6 provide interesting insights into the type of refugee that
has a higher hazard rate of returning. Column (1) presents the results for the cloglog
27

model using origin district and country of asylum fixed effects. It clearly shows that the
hazard rate increases with age, with coefficient estimates of 0.58 and 0.78 for individuals
ages 45-59 and 60 and above, respectively. This is equivalent to an increase in their
respective hazard rate of 77% and 118% relative to the omitted category of refugee ages
15-44 years. Both coefficients are precisely estimated. As this section of the paper is
descriptive, we cannot give a reason for this finding. We provide two possibilities to
consider. One possible explanation for this result is that the younger cohort is at a
greater risk of being conscripted by the Syrian army for compulsory or reserve military
service, which applies to men ages 18-42 and has been used in a discretionary manner
throughout the conflict. Table 7, which reports results separately for women and men in
columns (2) and (3), respectively, confirms this result for men, but also shows a similar
pattern for female adults. A second possible explanation that particularly applies to
women is that older age cohorts are more likely to be unemployed, which could increase
their hazard rate of return (World Bank (2020)).
Our results are aligned with the view that refugees make proactive choices about
returning - for example, about which family member to send back to Syria. The hazard
rate is greater for men in the multivariate regression, in contrast to the simple plots we
showed in section 4.1.2.18 The highly significant coefficient estimate of 0.38 suggests that
the hazard rate for men is 45% higher than for women. Moreover, the relationship of
the refugee to the principal applicant of the case matters. That is, adult immediate and
extended family members, such as siblings, aunts and uncles, have considerably higher
hazard rates than the principal applicant’s spouse. The hazard rate is also higher for18We think that both the uni-variate relationship and the multivariate regressions are informative.
As an example of why we see differences based on specification: once we condition on marital statusand whether the refugee is the principal applicant, the relationship between gender and the returnprobability flips. The majority of principal applicants are male, and principal applicants are less likelyto return. Men are typically household heads in this culture. It is therefore not obvious if we wantto average out the role of other characteristics - which are intrinsically correlated with gender - whenlooking at the role of gender in the decision to return. Therefore, we show the results both ways toprovide a more complete picture.
28

singles compared to married refugees (60%), a result that is precisely estimated. In
contrast, widowed refugees have a 24% lower hazard rate (also significant at the 1
percent level). These findings are in line with international experience (World Bank
(2017)), which suggests that return happens in stages, with individual family members
- often single adult males - returning to the country of origin to assess the situation on
the ground, while the rest of the case remains in the country of asylum.
Higher levels of education are also associated with lower hazard rates. For example,
a university degree reduces the hazard rate relative to an uneducated adult by 21%
percent and by 19% percent for a secondary degree (both significant at the 1 percent
level). It is, however, unclear to what extent this is linked to the refugee’s actual
employment opportunities since most are not allowed to formally work in skilled jobs.
Appendix figure A1 suggests that more educated refugees make more income while in
asylum. These differences in return hazard could also be driven by differences in wealth
(e.g., more-skilled people may have more savings as suggested by Appendix Figure A1)
or lower transaction costs (e.g., more-skilled people better communicate/navigate in
host communities). We are, however, not able to disentangle these mechanisms.
The remaining columns in table 6 test the robustness of these results. Column (2)
adds year fixed effects to control for major changes in the conflict dynamics and peace
negotiations that are likely to impact return decisions. The results are very similar,
both in terms of magnitude and level of significance. The remaining columns estimate
continuous time proportional hazard models, assuming an exponential baseline hazard
in columns (3) and (4) and using the semi-parametric Cox model in columns (5) and (6).
The results are very similar across hazard models and distributional assumptions. Given
that the semi-parametric Cox model is robust to arbitrary distributional assumptions,
it is our preferred specification for the remainder of the paper.
Table 7 provides a formal test of the descriptive statistics reported in section 4.1.
29

In particular, we test to what extent conflict intensity, as measured by the high conflict
dummy, impacts who returns. Column (1) reports the results for all adults, while
columns (2) and (3) break out the sample by females and males, respectively.
In line with our results in section 4.1, we find that the hazard rate is significantly
lower for refugees who come from a district with persistently high levels of conflict. The
coefficient estimate of -0.32 is statistically significant at the 5% level and is equivalent to
a reduction in the hazard rate of 27% compared to a home district that has experienced
less conflict. This result is exclusively driven by male refugees, whose hazard rate is 45%
lower compared to male refugees who hail from a more peaceful district. Conversely,
we do not find a similar effect for women.
High conflict intensity in the origin district also seems to influence the case’s deci-
sion on which family member should return, further reinforcing the patterns already
observed above. In particular, immediate and extended family members have substan-
tially higher hazard rates of return if they originate from a high conflict district as
observed in column (1) of Table 7. Their respective hazard rates are 78% and 84%
higher than for comparable family members from low conflict districts. This pattern is
very similar for both female and male refugees, though the impacts on the latter are
larger for immediate family members.
In terms of the age profile of refugees, in column (3) we find no statistically significant
difference by conflict intensity for men ages 45 or older. However we see in column (2)
that women ages 45-59 who hail from a high conflict district have hazard rates that
are 20% lower than women of the same age from low conflict districts. The interaction
term for older women is not significant.
Taken together, these results paint a complex picture of the decision-making pro-
cess underlying the spontaneous return behavior of refugees. Not only the individual
characteristics of a refugee, but also the social structure surrounding her can shape the
30

likelihood of return. Moreover, the sensitivity of this return decision to conditions in
Syria (i.e., conflict intensity) is also markedly different along such characteristics.
4.3 Conditions in Host Countries
A refugee’s livelihood opportunities and housing conditions in the host country may
also be important determinants of her return decision. In fact, this point often appears
in the popular media in different forms like "good conditions make refugees stay" and,
by extension, "bad conditions make refugees return".19 In this section, we show that
our results do not necessarily support this view.
First, we explore how individual return decisions are affected by living conditions
in the host countries by estimating equation 4. These results are reported in Table 8,
where individual controls from ProGres are suppressed for ease of exposition. In column
(1), we find that more food secure households have a higher hazard rate of return, a
result that is highly significant. However, the magnitude of the effect is small: a one
standard deviation increase in the food security PCA index increasing the hazard rate
by 0.27%. Moreover, Column (2) shows that better housing conditions - proxied for by
the housing PCA index - also increase the hazard rate by a similar magnitude.
Second, we analyze how conditions in the host countries affect aggregate returns by
using the district-month panel. Unlike the panel data set used in Tables 2 and 3, we
aggregate returns by their location l in the country of asylum not their home district
in Syria.20 However, because the country of asylum indicators are reported for only 2
years for Jordan and 3 years for Lebanon, the time variation in this panel is severely19See Berry et al. for a review of press coverage about Syrian refugees until 2015.20The regression specification is
E(returnslmt) = δlexp(β1 + β2foodseclt + β3housinglt + τt)
where deltal is the location specific fixed effect and all other variables are defined as in equation 3.Since the VAF and VASyr surveys were only conducted during the 2015-2017 period, we only estimatethe regression for this subset of years.
31

constrained. Nevertheless, we pursue the panel estimates since they remove time invari-
ant characteristics which we do not observe and are correlated with the return decision.
This includes reporting biases, since UNHCR provides assistance to the respondents,
that are constant over time. Results are shown in Table 9. Better livelihood opportu-
nities - proxied for by the food security PCA index - increase the number of returnees.
In particular, a one standard deviation increase in the food security index increases the
number of returns by 24% when using the PQML specification in column (2), a result
that is statistically significant at the 5% level. We view this as strong evidence. How-
ever, the corresponding OLS result in column (1) is insignificant. Housing conditions,
on the other hand, do not seem to affect the aggregate return numbers, as shown in
Columns (3) and (4). This may be because we do not have enough variation in the
data.
These results do not support the view that poor living conditions in host countries
push refugees to spontaneously return to their origin country. In the following section,
we will provide a discussion on the economic interpretation of this result and possible
underlying mechanisms that may generate such an outcome.
5 Discussion
The results have so far shown that the effects of conditions at the origin, such as
security, on returns are as expected. Other things being equal, an increase in risk
adjusted payoffs from return (delivered by better security and living conditions) tends
to increase the probability of return. The opposite is, however, not true for conditions
in countries of asylum, where improvements in payoffs from staying may also increase
returns. This is somewhat unexpected within a standard income/opportunity based
migration framework and entails further discussion.
32

The literature on temporary (economic) migrations can provide important insights
on these findings. An important revelation of this literature, the planned adaptation of
economic actions in anticipation of return or settlement, has been shown to differentiate
various migrant groups. These adaptations can take place in terms of savings (Galor
and Stark (1991)), labor force participation (Borjas and Bratsberg (1996)), or human
capital accumulation (Dustmann et al. (2011)). Thus, a two-way determination between
returns and economic conditions is likely. Our data and empirical setting are not rich
enough to fully identify such mechanisms in the case of Syrian refugees. Nevertheless,
the positive association between the return of refugees and their conditions in host
countries is a curious phenomenon. The vulnerability assessments (VASyr and VAF),
reveal extreme coping strategies among refugees which are resorted to support a bare
bones living standard, with no surplus to be saved or used for additional schooling.
What could be driving such positive association?
In what follows, we develop a simple framework where this outcome can be observed
even in the absence of a strategic location-specific action from refugees. The idea is
that, for refugees with incomes at the low end of the distribution, the costs associated
with return by themselves can generate the result we observed in the data. While it
is not possible to detect or estimate such costs and incomes by using our data set, a
descriptive literature on the rules and regulations governing the return of Syrian refugees
provides ample facts in support of the transportation cost argument. For instance,
about 70 percent of Syrian refugees in Lebanon and Jordan are reported to lack basic
civil documentation, which is required for returns (Norwegian Refugee Council, 2017).
However, access to those could be prohibitively costly: e.g., with a $325 price tag,
the Syrian passport is one of the costliest passports to acquire in the world ($825 if
expedited). To put that into perspective, the average cash transfer received by refugees
is $27 per person per month. This cost can impede returns in a trivial manner: as
33
refugees are credit constrained, they may not be able to afford the return. However,
there is also a non-trivial effect: given the trade-offs they face; refugees may not be
willing to return even when such cost can be afforded.
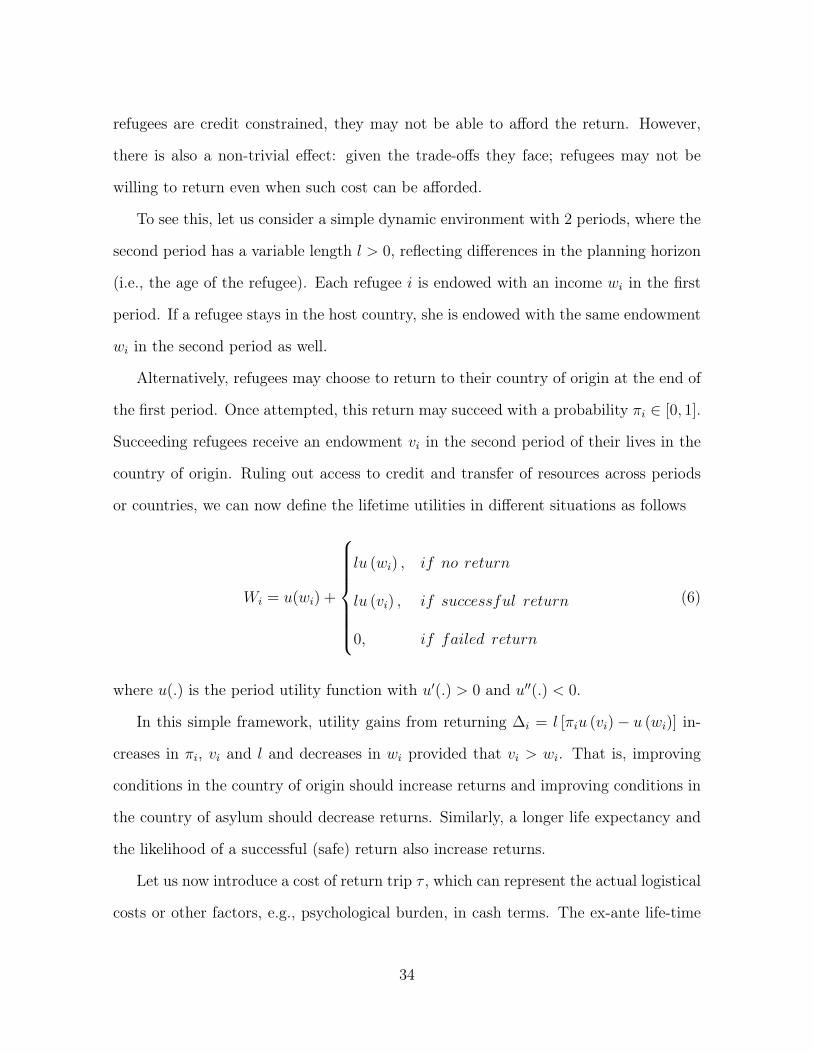
To see this, let us consider a simple dynamic environment with 2 periods, where the
second period has a variable length l > 0, reflecting differences in the planning horizon
(i.e., the age of the refugee). Each refugee i is endowed with an income wi in the first
period. If a refugee stays in the host country, she is endowed with the same endowment
wi in the second period as well.
Alternatively, refugees may choose to return to their country of origin at the end of
the first period. Once attempted, this return may succeed with a probability πi ∈ [0, 1].
Succeeding refugees receive an endowment vi in the second period of their lives in the
country of origin. Ruling out access to credit and transfer of resources across periods
or countries, we can now define the lifetime utilities in different situations as follows
Wi = u(wi) +
lu (wi) , if no return
lu (vi) , if successful return
0, if failed return
(6)
where u(.) is the period utility function with u′(.) > 0 and u′′(.) < 0.
In this simple framework, utility gains from returning ∆i = l [πiu (vi)− u (wi)] in-
creases in πi, vi and l and decreases in wi provided that vi > wi. That is, improving
conditions in the country of origin should increase returns and improving conditions in
the country of asylum should decrease returns. Similarly, a longer life expectancy and
the likelihood of a successful (safe) return also increase returns.
Let us now introduce a cost of return trip τ , which can represent the actual logistical
costs or other factors, e.g., psychological burden, in cash terms. The ex-ante life-time
34

utility of return is then given as:
Wi = u (wi − τ) + πilu (vi) (7)
and the ex-ante gain from return is:
∆i = [u (wi − τ)− u (wi)] + l [πiu (vi)− u (wi)] (8)
where the first term on the right hand side shows the opportunity cost of attempting
the return and the second term shows the expected increase in second period welfare.
Like the case without transportation costs, the expected gain from return increases
monotonically in l and pull factors vi and πi.An increase in transportation cost decreases
∆i; however, wi now has ambiguous effects:
∂∆i
∂wi= [u′ (wi − τ)− u′ (wi)]− lu′ (wi) ≷ 0. (9)
When l is sufficiently small and u(.) satisfies the Inada conditions, the following prop-
erties are observed for a given τ :
limwi→∞
∂∆i
∂wi< 0 (10)
limwi→τ+
∂∆i
∂wi> 0 (11)
Intuitively, a small improvement in the asylum conditions has two effects on the
comparison of expected lifetime utilities across options. First, it reduces the opportunity
cost of the return decision, i.e., decreasing own consumption by a given amount (τ) is
easier when the first-period income is greater. Second, it makes the return option less
35

attractive as the gap between second period utilities in return and no-return scenarios
decreases with a higher wi. When the initial income is high, i.e., wi → ∞, the second
effect dominates following a small increase in wi and return becomes less attractive. In
contrast, starting from an income that is too close to τ , i.e., wi → τ , a small increase
in income relaxes the opportunity cost of returning drastically, which dominates the
second effect.
Figure 7 shows the dramatic effect of explicitly recognizing the mobility cost for low
income levels. The first panel shows the payoffs associated with not returning (W nrNC),
which are identical regardless of mobility costs, and the payoffs for a returning refugee
with (W rC) and without (W r
NC) mobility costs. Inclusion of a mobility cost makes the
return payoff steeper than the staying payoff for low income levels. As a result, as shown
in the second panel, whereas the gain from return is a monotonically decreasing function
of the host country income in the case with no mobility costs (∆rNC), it becomes non-
monotonous in the case with mobility costs (∆rC). As a result, for low income levels,
a small increase in host country income can make return more desirable. In fact, for
some ranges of vi and τ , a double crossing of the stay payoff and return payoff streams
is also possible. In that case, only refugees with an intermediate income range would
return as Bijwaard and Wahba (2014) find for economic migrants.
6 Conclusion
In this paper, we analyzed the factors that influenced the return of Syrian refugees
from Lebanon, Jordan, and Iraq to Syria during an active period of conflict, from
January 2011 to March 2018. Our analysis with novel subdistrict-month panel data
shows that better security and improved access to utilities, as proxied by nightlight
luminosity, at the location of origin increase the likelihood of return. This result is
36

aligned with the risk-adjusted expected payoff-based explanations of standard models
of migration. However, we provide evidence that worse conditions in exile do not always
induce more returns to the origin country. In certain aspects, such as access to food,
poor conditions reduce the likelihood of return. In discussing these results, we propose
a simple framework where an increase in income in exile can trigger return for those
with low income in the presence of mobility costs.
Our results have both analytical and practical implications. From an analytical
point of view, the nature of refugees’ self-selection in return migration could determine
the composition of refugees, and their skill set, who stay in exile. This should be taken
into consideration in assessing how refugee arrivals shape the economic welfare of the
host communities. More practically, a formal consideration of the endogenous return
behavior can help design humanitarian interventions more effectively in countries of
asylum.
The study of refugee returns is a data-demanding process in a data-poor field. This
limits the generation of systematic empirical evidence and, thus, our knowledge. Any
future research that expands the respective data space, especially longitudinally, and
examines the validity of our results in different refugee situations will help improve our
understanding significantly.
37

References
Abramitzky, R., Boustan, L. P., and Eriksson, K. (2014). A nation of immigrants:
Assimilation and economic outcomes in the age of mass migration. Journal of Political
Economy, 122(3):467–506.
Alix-Garcia, J., Walker, S., Bartlett, A., Onder, H., and Sanghi, A. (2018). Do refugee
camps help or hurt hosts? the case of kakuma, kenya. Journal of Development
Economics, 130:66–83.
Bauer, T. K. and Sinning, M. G. (2011). The savings behavior of temporary and
permanent migrants in germany. Journal of Population Economics, 24(2):421–449.
Becker, S. O. and Ferrara, A. (2019). Consequences of forced migration: A survey of
recent findings. Labour Economics, 59:1–16.
Bell, B., Fasani, F., and Machin, S. (2013). Crime and immigration: Evidence from
large immigrant waves. Review of Economics and Statistics, 21(3):1278–1290.
Berry, M., Garcia-Blanco, I., and Moore, K.
Bijwaard, G. E. and Wahba, J. (2014). Do high-income or low-income immigrants leave
faster? Journal of Development Economics, 108:54–68.
Bojicic-Dzelilovic, V. and Turkmani, R. (2018). War economy, governance and security
in syria’s opposition-controlled areas. Stability: International Journal of Security and
Development, 7(1):1–17.
Borjas, G. J. (1987). Self-selection and the earnings of immigrants. American Economic
Review, 77(4):531–53.
Borjas, G. J. and Bratsberg, B. (1996). Who leaves? the outmigration of the foreign-
born. Review of Economics & Statistics, 78(1):165–176.
38

Borjas, G. J. and Monras, J. (2017). The labour market consequences of refugee supply
shocks. Economic Policy, 32(91):361–413.
Braun, S. and Kvasnicka, M. (2014). Immigration and structural change: Evidence
from post-war germany. Journal of International Economics, 93(2):253–269.
Cameron, A. C. and Trivedi, P. K. (2005). Microeconometrics: methods and applica-
tions. Cambridge university press.
Cattaneo, C. and Peri, G. (2016). The migration response to increasing temperatures.
Journal of Development Economics, 122:127–146.
Clemens, M. A. (2017). Violence, development, and migration waves: Evidence from
central american child migrant apprehensions. Center for Global Development Work-
ing Paper, (459).
Constant, A. and Massey, D. S. (2002). Return migration by german guestworkers:
Neoclassical versus new economic theories. International migration, 40(4):5–38.
Cortes, K. E. (2004). Are refugees different from economic immigrants? some empirical
evidence on the heterogeneity of immigrant groups in the united states. Review of
Economics and Statistics, 86(2):465–480.
Dustmann, C. (1997). Differences in the labor market behavior between temporary and
permanent migrant women. Labour Economics, 4(1):29–46.
Dustmann, C., Fadlon, I., and Weiss, Y. (2011). Return migration, human capital
accumulation and the brain drain. Journal of Development Economics, 95(1):58–67.
Dustmann, C. and Görlach, J.-S. (2016). The economics of temporary migrations.
Journal of Economic Literature, 54(1):98–136.
39

Dustmann, C., Vasiljeva, K., and Piil Damm, A. (2019). Refugee migration and electoral
outcomes. The Review of Economic Studies, 86(5):2035–2091.
Galor, O. and Stark, O. (1990). Migrants’ savings, the probability of return migration
and migrants’ performance. International Economic Review, pages 463–467.
Galor, O. and Stark, O. (1991). The probability of return migration, migrants’ work
effort, and migrants’ performance. Journal of Development Economics, 35(2):399–
405.
Gibson, J. and McKenzie, D. (2011). The microeconomic determinants of emigration
and return migration of the best and brightest: Evidence from the pacific. Journal
of Development Economics, 95(1):18–29.
Hangartner, D., Dinas, E., Marbach, M., Matakos, K., and Xefteris, D. (2019). Does
exposure to the refugee crisis make natives more hostile? American Political Science
Review, 113(2):442–455.
Jenkins, S. P. (2005). Survival analysis. Unpublished manuscript, Institute for Social
and Economic Research, University of Essex, Colchester, UK, 42:54–56.
Moser, P., Voena, A., and Waldinger, F. (2014). German jewish émigrés and us inven-
tion. American Economic Review, 104(10):3222–55.
Ruiz, I. and Vargas-Silva, C. (2015). The labor market impacts of forced migration.
American Economic Review, 105(5):581–86.
Sjaastad, L. A. (1962). The costs and returns of human migration. Journal of Political
Economy, 70(5, Part 2):80–93.
Tumen, S. (2016). The economic impact of syrian refugees on host countries: Quasi-
experimental evidence from turkey. American Economic Review, 106(5):456–60.
40

Verme, P. and Schuettler, K. (2019). The impact of forced displacement on host commu-
nities: A review of the empirical literature in economics. World Bank Policy Research
Working Paper, (8727).
Wooldridge, J. M. (1999). Distribution-free estimation of some nonlinear panel data
models. Journal of Econometrics, 90(1):77–97.
World Bank (2017). The Toll of War: The Economic and Social Consequences of the
Conflict in Syria. The World Bank Group.
World Bank (2019). The Mobility of Displaced Syrians: An Economic and Social Anal-
ysis. The World Bank Group.
World Bank (2020). The fallout of war. Technical report.
41

Case Size
Age
Years of Schooling - Adults (15+)
Figure 1: Case Size, Age, and Adult Education: Returnees vs. Non-returnees
Notes: The violin plot shows summary statistics of a given indicator. The thin vertical lines denote the full range of observations, over which the sample distributions are shown symmetrically on left- and right-hand sides. The thick vertical lines show the range of the middle 50 percent of the
observations, and the median values are shown by white dots.

Figure 2: The Evolution of Night Lights, Conflict Driven Casualties, and Conflict Events Index Over Time
0
2
4
6
8
-1.2-0.8-0.40.00.40.81.2
April-12 October-12 April-13 October-13 April-14 October-14 April-15 October-15 April-16 October-16 April-17 October-17
Casu
al�e
s (‘0
00)
Confl
ict (
CEI) CEI Casual�es (RHS)
April 2012 – April 2015 May 2015 – March 2018
Notes: Night-time low light emissions data are from the Visible Infrared Imaging Radiometer Suite (VIIRS) of the Suomi National Polar Partnership (SNPP). All pixels are equal in size, around 380m by 380m (15 arc-seconds by 15 arc-seconds relative to the origin, the mathematical center of the earth). Casualties show total monthly deaths directly attributed to conflict.
The Conflict Events Index (CEI) was computed for each district-month using principal components analysis (PCA) of normalized conflict activity. For this figure, we use the concurrent CEI for that month.

Figure 3: Casualties by District-Year (Jan 2012 – December 2017)
Notes: The casualty data was collected by IPSOS and contains district-level casualties for all districts except Dreikish, Safita and Tartous in Tartous governorate (shaded white in the map).

�
�
�
�
�
�
�
�
�
�
�
�
�
�
�
��
�
��
�
�
�
�
��
�
�
�
�
�
��
�
�
�
�
�
�
��
��
�
�
�
�
�
�
��
�
�
�A'zaz
Abu Kamal
Afrin
Ain Al Arab
Al Bab
Al Fiq
Al Ma'raAl Makhrim
Al Mayadin
Al Qutayfah
Al−Haffa
Al−HasakehAl−Malikeyyeh
Al−Qusayr
Al−Thwarah
An Nabk
Ar−Raqqa
Ar−Rastan
Ariha
As−SafiraAs−Salamiyeh
As−Sanamayn
As−Suqaylabiyah
As−Sweida
At Tall
Az−ZabdaniBanyas
Dar'a
Darayya
Deir−ez−Zor
Duma
Hama
Harim
Homs
Idleb
Izra'
Jablah Jarablus
Jebel Saman
Jisr−Ash−ShugurLattakia
Masyaf
Menbij
Muhradah
Qatana
QuamishliQuneitra
Ras Al Ain
Rural DamascusSheikh Badr
Tadmor
Tall Kalakh
Tell Abiad
Yabroud
0
5
10
15
−1 0 1 2 3Conflict Events Index (CEI)
Ret
urne
e Pe
rcen
tage
s by
Dis
trict
Figure 4: Conflict by Returnee Percentages (Jan 2012 – June 2018)
Notes: For this figure, we use the mean Conflict Events Index (CEI) for the district between Jan 2012 – June 2018. Refer to the footnote in Figure 2 for the definition of CEI. ‘Returnee percentages’ reflect the percentage of total refugees from the origin district that returned back to Syria before March 2018.

Figure 5: Demographic Characteristics of Returnees by Conflict Intensity
Notes: Using the average CEI for the district (see footnote in Figure 4 for details), we defined high-conflict districts as those districts where the average CEI fell in top 10 percentile. These districts are Jebel Saman, Deir-ez-Zor, Homs, Al Ma’ra, and Duma. Returnee percentages are as defined in Figure 4. These figures are a visual representation of Table A1-A4.
Confidence intervals denote whether the difference to the within-group (i.e. within Low conflict or within High conflict) reference category is statistically significant. .

wi
wi
∆ i
Wi
W rNC W r
C
W nrNC
∆ rNC
∆ rC
w̄NCw̄CwC
wC w̄C
w̄NC
0
0
∆ rC,max
∆ rC,max
Figure 6: Gains From Return With and Without Mobility Costs

Refugee Population Returns In camp Out of camp (As of end-2019)Jordan 656,213 124,019 532,194 53,058Lebanon 910,256 - 910,256 53,286Iraq 247,440 98,798 148,642 38,117
Table 1: Statistics for Registered RefugeesSettlement
Source: UNHCR (access date: April 13, 2020). The numbers reported here are only those verified or monitored by UNHCR. They do not reflect the entire number of returns which may be significantly higher.

(1) (2) (3) (4) (5) (6)∆ Conflict Events Index -0.019 *** -0.0087 -0.023 *** -0.060 ** -0.021 *** -0.051 *** (0.0053) (0.026) (0.0056) (0.024) (0.0059) (0.015) ∆ Avg Luminosity Index 0.042 *** 0.044 *** 0.046 *** 0.038 *** 0.028 ** -0.0063 (0.014) (0.0089) (0.015) (0.011) (0.012) (0.0074)
Observations 15448 15448 14292 14292 14292 14292 Daraa Yes Yes No No No No Model OLS PQML OLS PQML OLS PQML Area of Control Yes Yes Yes Yes Yes Yes District FE Yes Yes Yes Yes Yes Yes Year FE Yes Yes Yes Yes Yes Yes Month FE No No No No Yes Yes
Table 2: Conditions in Syria
Standard errors in parentheses, clustered at the district level.* p<.1, ** p<.05, *** p<.01∆ Conflict Events Index and ∆ Avg Luminosity Index reflect changes in their respective levels between the quarter prior the month of return and the quarter preceding it.

(1) (2) (3) (4) (5) (6)∆ Avg Luminosity Index 0.046 *** 0.044 *** 0.046 *** 0.046 *** 0.046 *** 0.044 *** (0.015) (0.011) (0.016) (0.011) (0.016) (0.012) ∆ Casualties -0.00017 *** -0.00044 *** (0.000052) (0.00017) ∆ Chemical Weapon Use -0.083 * -0.35 ** (0.049) (0.18) ∆ Skirmish and Fighting -0.022 * -0.059 *
Observations 14292 14292 14292 14292 14292 14292 Model OLS PQML OLS PQML OLS PQML Area of Control Yes Yes Yes Yes Yes Yes District FE Yes Yes Yes Yes Yes Yes Year FE Yes Yes Yes Yes Yes Yes
Table 3: Conditions in Syria
Standard errors in parentheses, clustered at the district level.* p<.1, ** p<.05, *** p<.01∆ Avg Luminosity Index, ∆ Casualties, ∆ Chemical Weapon Use, and ∆ Skirmish and Fighting reflect changes in their respective levels between the quarter prior the month of return and the quarter preceding it.

(1) (2) (3) Family says house intact 0.020 0.020 0.018 (0.028) (0.036) (0.043) Neighbor house destroyed -0.224 *** -0.219 *** -0.230 *** (0.028) (0.036) (0.045) Family house destroyed -0.229 *** -0.234 *** -0.224 *** (0.028) (0.037) (0.043)
Observations 1900 1100 800 Sample All Registered UnregisteredMean: Neighbor says house is intact 0.381 0.376 0.387 SD 0.486 0.485 0.488
Table 4: Vignette 3, Condition of House in Syria
Standard errors in parentheses.* p<.1, ** p<.05, *** p<.01The omitted category is "Neighbor says house is intact".

(1) (2) (3) Wife not working 0.012 0.029 -0.011 (0.022) (0.028) (0.034) Schools poor resources -0.187 *** -0.175 *** -0.201 *** (0.021) (0.028) (0.033)
Observations 950 1100 800Sample All Registered Un-registeredMean: Wife is working and Schools in Syria Open 0.433 0.401 0.481 SD 0.496 0.491 0.501
Table 5: Vignette 2, Conditions in Syria
Standard errors in parentheses.* p<.1, ** p<.05, *** p<.01The omitted category is "Wife is working and schools in Syria are open and functioning well".

(1) (2) (3) (4) (5) (6) Single 0.47 *** 0.47 *** 0.47 *** 0.48 *** 0.48 *** 0.48 *** (0.075) (0.073) (0.075) (0.073) (0.074) (0.074) Widowed -0.28 ** -0.26 ** -0.27 ** -0.26 ** -0.28 ** -0.28 ** (0.12) (0.10) (0.12) (0.10) (0.11) (0.11) Other 0.0071 0.00053 0.017 0.0097 0.0047 0.0047 (0.048) (0.042) (0.046) (0.040) (0.045) (0.045) 45 - 59 0.58 *** 0.60 *** 0.57 *** 0.59 *** 0.59 *** 0.59 *** (0.075) (0.075) (0.075) (0.076) (0.074) (0.074) 60 or above 0.78 *** 0.81 *** 0.78 *** 0.81 *** 0.81 *** 0.81 *** (0.11) (0.10) (0.11) (0.11) (0.11) (0.11) Male 0.37 *** 0.42 *** 0.38 *** 0.42 *** 0.41 *** 0.41 *** (0.033) (0.033) (0.032) (0.032) (0.032) (0.032) Principal applicant -1.24 *** -1.28 *** -1.23 *** -1.28 *** -1.29 *** -1.29 *** (0.10) (0.11) (0.10) (0.11) (0.099) (0.099) Extended family 1.82 *** 1.81 *** 1.81 *** 1.80 *** 1.84 *** 1.84 *** (0.10) (0.099) (0.10) (0.099) (0.095) (0.095) Immediate family 1.35 *** 1.31 *** 1.34 *** 1.30 *** 1.33 *** 1.33 *** (0.096) (0.093) (0.097) (0.094) (0.091) (0.091) Primary Education -0.18 *** -0.17 *** -0.18 *** -0.16 *** -0.17 *** -0.17 *** (0.039) (0.039) (0.038) (0.037) (0.038) (0.038) Secondary Education/Vocational -0.22 *** -0.23 *** -0.21 *** -0.23 *** -0.21 *** -0.21 *** (0.046) (0.050) (0.045) (0.049) (0.046) (0.046) Post-/University -0.25 *** -0.32 *** -0.24 *** -0.32 *** -0.29 *** -0.29 *** (0.056) (0.070) (0.056) (0.069) (0.059) (0.059) Case has children 1.17 *** 1.22 *** 1.17 *** 1.22 *** 1.23 *** 1.23 *** (0.13) (0.12) (0.13) (0.12) (0.12) (0.12) Current Size -0.95 *** -0.97 *** -0.95 *** -0.96 *** -0.98 *** -0.98 *** (0.062) (0.065) (0.062) (0.064) (0.069) (0.069) Has special needs -0.28 *** -0.33 *** -0.27 *** -0.32 *** -0.31 *** -0.31 *** (0.042) (0.035) (0.043) (0.036) (0.038) (0.038) Case lives in a camp 0.59 *** 0.52 *** 0.58 *** 0.52 *** 0.56 *** 0.56 *** (0.21) (0.17) (0.21) (0.17) (0.18) (0.18)
Observations 48395526 48395526 47446712 47446712 47446712 47446712Sample Adults Adults Adults Adults Adults Adults Model Cloglog Cloglog Exponential Exponential Cox CoxDummies for ethnicity and religion Yes Yes Yes Yes Yes YesRegistration status controls Yes Yes Yes Yes Yes YesDistrict FE Yes Yes Yes Yes Yes YesYear FE No Yes No Yes No YesCountry of Asylum FE Yes Yes Yes Yes Yes Yes
Table 6: Survival Analysis, ProGres Controls
Standard errors in parentheses.* p<.1, ** p<.05, *** p<.01The omitted category for marital status is 'Married'; for age is '15-44'; for family status is 'Close family'; and for education is 'No/Informal education'.Following Constant and Macy (2002), we include a quadratic cloglog specification of the refugee spell in columns (1) and (2).Columns (3) and (4) estimate a continuous time exponential model and include spell year dummies.

(1) (2) (3) 45 - 59 0.63 *** 0.65 *** 0.42 *** (0.083) (0.079) (0.063) 60 or above 0.88 *** 0.86 *** 0.66 *** (0.11) (0.11) (0.094) High Conflict -0.32 ** -0.19 -0.60 *** (0.14) (0.15) (0.15) 45 - 59 * High Conflict -0.13 * -0.22 *** 0.040 (0.067) (0.081) (0.065) 60 or above * High Conflict -0.21 * -0.19 -0.18 (0.12) (0.14) (0.12) Principal applicant -1.26 *** -1.06 *** -1.94 *** (0.097) (0.085) (0.15) Extended family 1.70 *** 1.99 *** 1.07 *** (0.11) (0.11) (0.12) Immediate family 1.21 *** 1.58 *** 0.46 *** (0.096) (0.12) (0.090) Extended family * High Conflict 0.61 *** 0.61 *** 0.60 *** (0.19) (0.21) (0.19) Immediate family * High Conflict 0.58 *** 0.49 ** 0.66 *** (0.18) (0.21) (0.14) Primary Education -0.16 *** -0.21 *** -0.13 *** (0.046) (0.052) (0.040) Secondary Education/Vocational -0.17 *** -0.18 ** -0.11 * (0.057) (0.072) (0.061) Post-/University -0.25 *** -0.19 *** -0.24 ** (0.071) (0.070) (0.094) Primary Education * High Conflict -0.0021 0.022 0.076 (0.097) (0.089) (0.098) Secondary Education/Vocational * High Conflict -0.18 -0.088 -0.27 * (0.13) (0.13) (0.15) Post-/University * High Conflict -0.14 -0.033 -0.19 (0.15) (0.17) (0.16)
Observations 43914492 22892109 21022383Sample Adults Adult women Adult menModel Cox Cox CoxProGres controls Yes Yes YesDistrict FE Yes Yes YesYear FE No No NoCountry of Asylum FE Yes Yes Yes
Table 7: Survival Analysis, ProGres controls interacted with a high-conflict dummy
Standard errors in parentheses.* p<.1, ** p<.05, *** p<.01The omitted category for marital status is 'Married'; for age is '15-44'; for family status is 'Close family'; and for education is 'No/Informal education'. ProGres controls include dummies for ethnicity and religion as well as registration status controls.

(1) (2) Food security PCA index 0.0027 ***
(0.00068) Housing PCA index 0.0023 ***
(0.00042)
Observations 23510685 22720684Sample Adults Adults Model Cox CoxProGres controls Yes YesInteractions with high conflict Yes YesDistrict FE Yes YesYear FE No NoCountry of Asylum FE Yes Yes
Table 8: Survival Analysis, different CoA variables
Standard errors in parentheses.* p<.1, ** p<.05, *** p<.01The Food Security PCA Index was computed using prinicpal components analysis (PCA) of normalized food consumption variables. The components include the average number of meals per day, and the average number of days a week a case did not have to borrow food/restrict consumption. The Housing PCA Index was constructed using normalized dummies for whether the case has an acceptable roof and windows, and access to a (private) latrine.

(1) (2) (3) (4)Food security PCA index 0.067 0.24 ** (0.069) (0.11) Housing PCA index -0.017 0.17 (0.090) (0.19)
Observations 1944 1944 1944 1944 Model OLS PQML OLS PQML Location FE Yes Yes Yes Yes Year FE Yes Yes Yes Yes
Table 9: Panel Analysis, Different CoA Variables
Standard errors in parentheses.* p<.1, ** p<.05, *** p<.01The Food Security Index and the Housing Index have been defined in Table 8.

Figure A1: Monthly Income by Education, 2018 Household Survey
0
20
40
60
80
100
120
140Pe
r cap
ita h
ouse
hold
inco
me
for t
he m
onth
pr
ior t
o R
amad
an (i
n U
SD)
None Prim Sec Post- 95% CI

(1) Male -0.0047 *** (0.00027) High Conflict District -0.00086 *** (0.00031) Male * High Conflict District 0.00094 ** (0.00044) Constant 0.021 *** (0.00018)
Observations 1590620 Sample All
Table A1: Descriptive Statistics, Sex
Standard errors in parentheses.* p<.1, ** p<.05, *** p<.01

(1) (2) 15-44 0.012 *** 0.012 *** (0.00037) (0.00041) 45-49 0.015 *** 0.041 *** (0.00078) (0.00082) 60 or above 0.055 *** 0.10 *** (0.0012) (0.0012) High Conflict District 0.0016 *** 0.00068 (0.00042) (0.00049) 15-44 * High Conflict District -0.0035 *** -0.0019 *** (0.00063) (0.00068) 45-59 * High Conflict District -0.0065 *** -0.014 *** (0.0012) (0.0013) 60 or above * High Conflict District -0.0100 *** -0.025 *** (0.0019) (0.0018) Constant 0.0092 *** 0.0096 *** (0.00025) (0.00029)
Observations 772644 817968 Sample All (Male) All (Female)
Table A2: Descriptive Statistics, Age
Standard errors in parentheses.* p<.1, ** p<.05, *** p<.01The omitted category for age is '0-14'.

(1) Primary Education -0.026 *** (0.00062) Secondary Education/Vocational -0.026 *** (0.00086) Post-/University -0.028 *** (0.0012) High Conflict District -0.0034 *** (0.00096) Primary Education * High Conflict District 0.0020 * (0.0011) Secondary Education/Vocational * High Conflict District -0.0015 (0.0014) Post-/University * High Conflict District 0.0011 (0.0021) Constant 0.049 *** (0.00056)
Observations 823579 Sample Adults
Table A3: Descriptive Statistics, Education
Standard errors in parentheses.* p<.1, ** p<.05, *** p<.01The omitted category for education is 'No/Informal Education'.

(1) Nuclear Family -0.20 *** (0.00097) High Conflict District -0.010 *** (0.0016) Nuclear Family * High Conflict District 0.0089 *** (0.0016) Constant 0.22 *** (0.00094)
Observations 833821 Sample Adults
Table A4: Descriptive Statistics, Relationship status
Standard errors in parentheses.* p<.1, ** p<.05, *** p<.01