Embed Size (px)
Citation preview
Electronic copy available at: http://ssrn.com/abstract=968101
When Do Managers Seek Private Equity Backingin Public-to-Private Transactions?∗
Jana P. Fidrmuc†
Warwick Business School
Peter Roosenboom‡
RSM Erasmus University
Dick van Dijk§
Econometric InstituteErasmus University Rotterdam
June 9, 2009
AbstractOver the last decade, the going private market has experienced a considerableboom in size and also has become more interesting for private equity investorsthat are looking to partner with incumbent management. This offers managersthe choice to take the firm private themselves in a traditional managementbuyout or to seek private equity backing. We propose that managers decidefor a management buyout without any involvement of private equity in casethey are less financially constrained: when their firms are undervalued, havehigh cash levels, are smaller and less financially visible, and the managers owna large toehold. In contrast, managers invite participation of private equityinvestors when they cannot complete the deal themselves: in firms that arelarger, have less cash and managers own a smaller fraction of the firm. Ouranalysis on a sample of UK public-to-private transactions completed over theperiod 1997-2003 provides results that are in line with these predictions.
Keywords: Public-to-Private Transactions, Corporate Governance, PrivateEquityJEL Classification: G32, G34
∗We would like to thank participants of the Conference on Mergers and Acquisitions in Exeter,the ECB Conference on Asset Management, Private Equity Firms and International Capital Flowsin Dublin, the 2007 Northern Finance Association annual meeting in Toronto, the 2008 EuropeanFinance Association annual meetings in Athens, and research seminars at the Warwick BusinessSchool, Manchester Business School, XFi Centre for Finance and Investment, University of Exeter,RSM Erasmus University and University of Antwerp. Also, we are grateful to Douglas Cumming,Ingolf Dittmann, Miguel Ferreira, Ian Garrett, Josh Lerner, Abe de Jong, Ian Tonks and ChendiZhang for useful comments on an earlier draft of the paper and Shanaz Raja, Huiyan Xu and Hansvan der Weijden for valuable research assistance.
†Warwick Business School, University of Warwick, Coventry CV4 7AL, United Kingdom, E-mail: [email protected] (corresponding author)
‡Department of Financial Management, RSM Erasmus University, P.O. Box 1738, NL-3000 DRRotterdam, The Netherlands, e-mail: [email protected]
§Econometric Institute, Erasmus University Rotterdam, P.O. Box 1738, NL-3000 DR Rotter-dam, The Netherlands, e-mail: [email protected]
Electronic copy available at: http://ssrn.com/abstract=968101
1 Introduction
Around the world, the number of firms deciding for a public-to-private transaction
has increased dramatically over the last decade. More and more companies consider
going private because the reality of being a public company has fallen far short of
the anticipated benefits. Another interesting development in the public-to-private
market is that private equity investors have considerably increased their investment
(Wright et al., 2006; Cumming et al., 2007, Bharath and Dittmar, 2009) and at the
same time changed their strategy concerning their targets (Kiechel, 2007). In the
1980s, private equity investors often engaged in highly leveraged transactions many
of which were seen as hostile by incumbent management (Lowenstein, 1985; Lehn
and Poulsen, 1989). Nowadays, private equity investors are looking to partner with
management. Incumbent managers typically remain with the company for some time
after the private equity backed deal and, importantly, profit from their involvement
in the deal through a generous compensation package (Wall Street Journal, 17 May
2007).
The new involvement of private equity investors in the public-to-private (PtP)
market presents managers with the choice to take their firms private themselves or
to obtain the backing of a private equity house. This paper is the first to examine
this decision more closely. We compare MBOs, private equity backed deals and a
control group of firms that remained publicly listed as three independent alternatives
in a multinomial logistic regression. This helps us to explain the managers’ choice
between MBOs versus private equity backed deals in the public-to-private process.
The existing literature provides several reasons for why publicly listed firms may
decide to go private. For example, managers may decide to take their firms private
when they face a takeover threat (Lehn and Poulsen, 1989) or when their firm is
undervalued. However, given that the private equity involvement in PtP deals is a
relatively new phenomenon, the literature mostly does not investigate the decision of
when managers seek private equity backing of the transaction. We put forward five
non-mutually exclusive hypotheses all with a common theme that managers are less
1
likely to rely on private equity backing when they are not financially constrained.
In particular, we propose that managers do an MBO (rather than a private equity
backed deal) when their firm is relatively more undervalued, is smaller, has high
cash levels, managers own a large toehold and the firm is less financially visible. In
contrast, managers invite participation of private equity investors and share control
when they cannot do the deal themselves: in firms that are larger, have less cash at
hand and managers own smaller share of the firm. In what follows, we describe the
individual hypotheses in more detail. We should note here that as the focus of the
paper is on the managers’ choice, we take the interest of private equity investors in
the deals as given. We argue that private equity investors are rational and would
not be involved in a deal without expecting a positive return.
Undervaluation hypothesis : Survey evidence by Maupin et al. (1984) suggests
that perceived undervaluation is one of the primary reasons for PtP transactions as
it potentially limits management’s ability to use benefits available to public compa-
nies as, for example, the accessibility of funds required to finance new investment
projects or acquisitions as outside equity becomes more expensive for undervalued
firms (Allen and Gale, 1999; Pagano et al., 1998). Undervaluation is also one of
the main sources of shareholder wealth gains in PtP transactions (Renneboog et al.,
2007). Moreover, undervalued firms are more likely to attract hostile takeover inter-
est (Lehn and Poulsen, 1989) that may lead to managers losing their jobs (Lowen-
stein, 1985) which further increases managers’ incentives for taking their firm private.
Moreover, undervaluation is closely associated with financing constraints of the man-
agers as the deal becomes cheaper. We therefore predict that managers are more
likely to take their firms private without private equity backing when their firm is
more undervalued.
Firm size hypothesis : An important factor that might drive the decision of
whether to seek private equity backing when going private is firm size. However,
most existing papers investigating the decision to go private have a control group that
is matched based on industry and size (Lehn and Poulsen, 1989; Kieschnick, 1998;
2
Weir et al., 2005) or do not include firm size as an explanatory variable (Halpern
et al., 1999). We argue that as firm size gets larger the ability of managers to take
the firm private themselves declines because of financial constraints. This increases
the need for backing by private equity investors. We use a random control sample
which allows us to test this firm size hypothesis.
Cash availability hypothesis : Most of the empirical evidence concerning going
private transactions so far is based on Jensen’s free cash flow hypothesis. Jensen
(1986) proposes that debt-financed going private transactions may provide a solution
to firms in cash-rich, slow growth and declining industries that are vulnerable to
conflicts of interest between managers and shareholders over payout and investment
policies. The empirical studies testing the free cash flow hypothesis in the context
of going private transactions, however, provide mixed results (Lehn and Poulsen,
1989; Opler and Titman, 1993; Kieschnick, 1998; Renneboog et al., 2007). In this
paper, we focus on a different aspect of cash-rich firms. We do not highlight the
agency issues but rather propose that managers of cash-rich firms are less financially
constrained to execute the transaction. They may see the potential of a leveraged
transaction to gain control over their firms as they have the excess cash available to
fund the transaction (Fox and Marcus, 1992) without the backing of a private equity
investor.
Managerial toehold hypothesis : Halpern et al. (1999) and Elitzur et al. (1998)
argue that managers who own a large stake in the company have more incentives
to initiate a levered buyout. Managers with large stakes need to buy relatively
fewer shares from other shareholders in order to become the sole owners of the firm.
This makes it more financially feasible for them to go private without private equity
investors obtaining an equity stake in the company.
Low visibility hypothesis : Bolton and von Thadden (1998) and Boot et al. (2006)
highlight liquidity and low cost of capital as important benefits of public versus pri-
vate ownership. Furthermore, thinly traded stocks have lower analyst coverage in
general and are at risk of being neglected by investors when taking their investment
3
decisions (Merton, 1987). Thus, firms that are not able to attract an adequate level
of investor recognition have to bear the high cost of stock exchange listing while not
taking enough advantage of the benefits of being a public company (Mehran and
Peristiani, 2009) and are therefore more likely to go private. Moreover, illiquidity
is often associated with high ownership concentration (Rubin, 2007) and therefore
lower takeover probability. Also, illiquid stock is more vulnerable to greater mis-
pricing (Mehran and Peristiani, 2009). Existing shareholders that wish to dispose of
their thinly traded shares at an attractive price may therefore have little alternative
than to agree to sell to management in a going private transaction. We conjecture
that this improves the bargaining position of management and enables them to take
the firm private at a cheaper price without the need for private equity backing.
Our results on a sample of 54 MBOs and 75 private equity backed buyouts in the
UK over the period from 1997 to 2003 are in line with these predictions. Our tests
when modeling the managers’ decision indicate that managers make the decision
to go private and the choice whether or not to partner up with a private equity
investor at the same time. One can interpret this as managers seeing only one way
of performing the going private transaction: they either opt to take their firm private
through an MBO transaction or they seek private equity backing for their deal. The
other option is not viable for them and therefore they make the two decisions (to go
private and whether or not to seek private equity backing in doing so) at the same
time. Moreover, we show that when managers face unwelcome takeover pressure,
they decide to take their firm private to keep their job. In this decision, conditional
on the firm characteristics, they have a choice to remain in full control (opt for an
MBO) or share control with a private equity investor. Managers opt for an MBO
when the deal is relatively cheap because of undervaluation of their firm stock, when
they already own a large equity stake in the company or when their firms are less
financially visible. They are also more likely to take their firm private themselves
when the firm has substantial cash holdings that can be used for deal financing. This
highlights a slightly different aspect of cash-rich firms than reported in prior studies
4
(for example, Lehn and Poulsen, 1989 and Opler and Titman, 1993). Taken together,
our results suggest that managers only invite private equity investors to back them
when they are more financially constrained to complete the deal themselves. This
is the case when firms have less cash and managers own a smaller fraction of the
company. These results show that MBOs are different from private equity backed
deals and so indicate that private equity involvement in the PtP market extends the
possibilities for managers when considering a PtP transaction.
The rest of the paper is organized as follows. The next section describes the data
set and provides the descriptive statistics. It also describes the regression models.
Section 3 shows the results and Section 4 concludes.
2 Data and methodology
2.1 Sample selection and descriptive statistics
Our original sample consists of 221 non-financial firms that have gone private in the
United Kingdom during the years 1997-2003. We identify these PtP transactions
from the database of the Centre for Management Buyout Research (CMBOR). We do
not have data for 9 PtP firms and 32 firms operate in real estate. Therefore, we are
left with 180 firms. Further, for all the PtP firms, we also obtain the offer documents
accompanying the going private transaction from Thomson Research. We use these
documents to determine management involvement and backing by private equity
investors. First, we identify deals backed by a private equity house: we have a group
of 83 private equity backed deals. In case the transaction is not backed by a private
equity house we further examine whether any of the firm’s executive directors are
involved in the deal. This results in a group of 54 (pure) management buyouts. The
remaining 43 transactions are backed by non-executive directors, wealthy families or
institutional investors other than private equity houses. As this latter group is very
heterogeneous and does not fit our research question, we drop it from our sample.
In summary, we have 83 private equity backed deals and 54 MBOs.
In order to model the public-to-private decision, it is essential to establish who
5
the decision maker is. In case of MBOs, it is clear that management is in control. But
is this also the case for private equity backed deals? The offer documents show that
3 private equity backed deals are buy-and-build deals initiated by private equity
investors. The purpose of these deals is to merge the target company within an
existing portfolio company of the private equity investor, so we exclude these 3 firms
from the data set. Further, out of the 80 private equity backed firms, one deal is
hostile and 14 bids are contested. The hostile bid results in ousting of the incumbent
management. However, none of the 14 contested bids results in managerial change.
In total, management is replaced only in 5 deals including the hostile offer. These
are usually cases when firms are offered for sale due to insolvency. In further 3 cases,
the deal results in a partial managerial change with prior board agreement. To be
fully consistent with our model where we assume that the management is in control,
we drop the 5 transactions with managerial change from our sample. We end up
with 54 MBO deals and 75 private equity backed deals.
To run the multinomial logit, we need a group of control firms that remained
publicly listed. We opt for a random sample of control firms. In each year of the
sample period of 1997-2003 we randomly select 200 control firms from a population
of around 1200 companies that continue to be publicly traded in a given year. The
sampling procedure allows for a control firm to be included in the sample more than
once. In total, we collect data on 1400 control firm-years that cover 960 different
control firms. For both the PtP firms and control firms, we get market prices from
Datastream, financial statement data from Worldscope, and hand-collect ownership
structure and board composition information from Price Waterhouse Coopers’ Cor-
porate Register.
In the going private literature it is common to use a matched control sample of
firms that remained public. Firm size and industry classification are the most com-
monly used matching criteria. In general, the sampling method (a random sample
versus a matched sample) does not pose any advantages or disadvantages except
for the case where the characteristics used for the matching process are important
6
determinants of the going private process (Halpern et al., 1999). We prefer random
to matched sampling because we believe that firm size is a relevant factor influenc-
ing the decision to take the firm private with versus without private equity backing.
Moreover, random sampling results in a larger data set. Nevertheless, we employ a
matched sample (based on industry and size) as a robustness check.
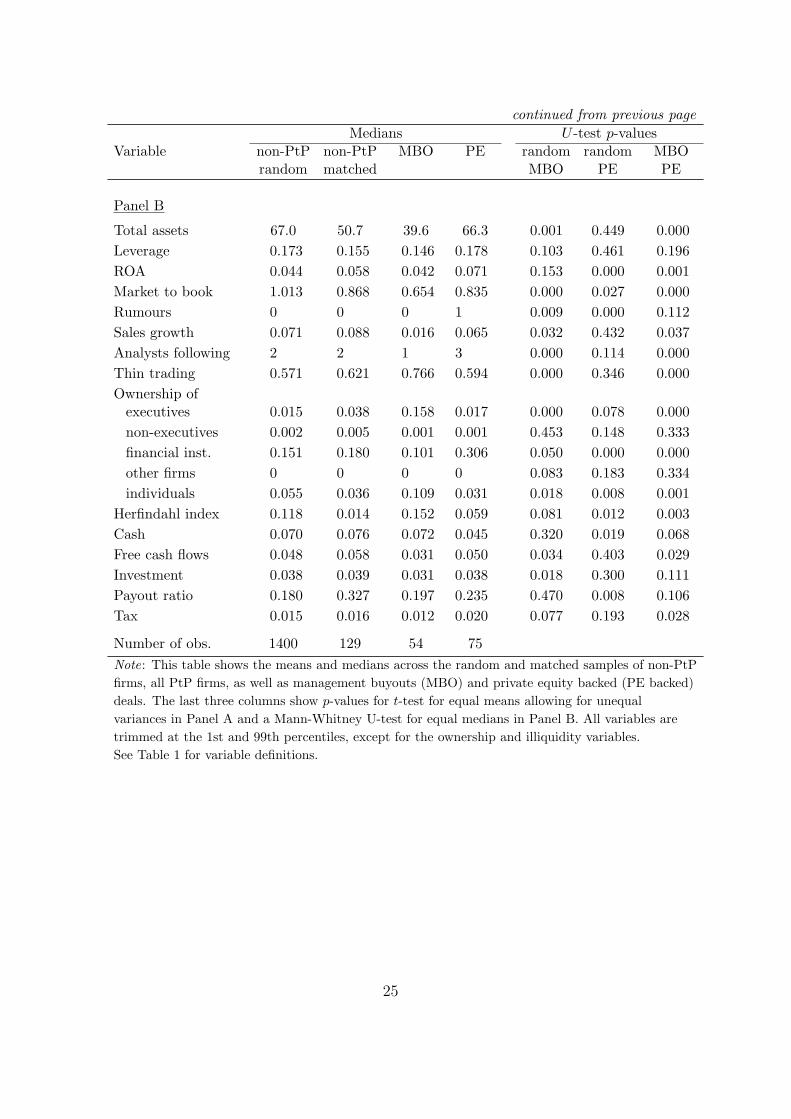
Table 1 shows our variable definitions and Table 2 shows summary statistics for
the random and matched control non-PtP firms, MBOs, and private equity backed
deals, respectively. All variables are trimmed at the 1st and 99th percentiles, except
the ownership and illiquidity variables. We test for differences in means and medians
among our random control group, MBOs and private equity backed deals. We use
a t-test for equal means allowing for unequal variances and a Mann-Whitney U-test
for equal medians. Below we discuss the statistically significant differences in mean
and median first between non-PtP firms versus MBOs and private equity backed
deals. Then we turn to significant differences between the two PtP groups.
- insert Tables 1 and 2 about here -
Columns 5 and 6 in Table 2 report p-values for the differences in means and
medians between control firms (random sample of non-PtP firms) versus MBOs and
private equity backed firms, respectively. PtP firms, both MBOs and private equity
backed, are valued less than control firms as indicated by their lower market to book
ratios and also experience more takeover rumours. MBO firms are smaller, their
shares are traded less actively than the shares of the control firms and are followed by
fewer analysts. Moreover, the MBO firms have higher equity stakes held by executive
directors and smaller financial institution ownership than the control firms. Private
equity backed firms, in contrast, have higher ownership by financial institutions
relative to control firms but their ownership concentration is lower. Private equity
backed firms have less cash but at the same time are more profitable and pay higher
dividends relative to control firms. MBOs pay lower tax.
Turning to the differences between the two groups of PtP firms (Column 7 of
Table 2), we observe that private equity backed deals are larger and more profitable
7
relative to MBO deals. They pay higher dividends and tax. Their market to book
ratio is higher indicating that they are less undervalued than the MBO deals. Private
equity backed deals also enjoy more financial visibility as they are followed by more
analysts and their shares are more actively traded. Ownership structure of the two
groups is also significantly different: private equity backed firms have significantly
lower executive ownership and higher ownership by financial institutions and their
pre-transaction ownership concentration is lower. Finally, private equity backed
firms have less cash on hand but higher cash flows. This seems to be a contradiction.
However, DeAngelo and DeAngelo (2006) argue that the firm’s current cash flow is
not a suitable measure of managerial opportunism as it does not reflect the stock
of resources at manager’s disposal. What matters is managers access to the stock
of liquid assets at all points in time which is better reflected in the firm’s cash and
marketable securities. In fact, free cash flow is highly correlated with the firm’s
profitability which indicates that it is restricted to affect managerial incentives only
at a distribution point (DeAngelo and DeAngelo, 2006) and, thus, it may not be
enough to encompass all resources at managers disposal and therefore is not able
to generate empirically valid predictions. This suggests that the firm’s cash level is
a more suitable proxy for free cash at the disposal and discretion of the managers.
Table 2 reports that private equity backed deals have less cash on their balance sheet
than MBOs.
2.2 Multinomial logistic model
In the empirical analysis we employ multinomial logistic regression (MNLR) models
to examine the differences and similarities between traditional management buyouts
and private equity backed deals. The model includes also a (random or matched)
control group of firms that remained listed, to address the question why the decision
to undertake either of the two types of going-private transaction is made. So, we
divide our sample of UK firms into three different groups: (1) management buyouts,
(2) private equity backed PtP deals, and (3) non-PtPs. We denote the observed
8
group for firm i by the variable yi, which can take the discrete values 1, 2, . . . , M ,
where M = 3 in our case. In the MNLR model the probability that firm i will belong
to group m, conditional on the (k × 1) vector of explanatory variables xi consisting
of a constant and firm characteristics, is given by
P [yi = m|xi] =exp(β′mxi)∑Ml=1 exp(β′lxi)
, for m = 1, . . . , M . (1)
For identification purposes, we set the coefficients for the non-PtP group of firms
equal to 0, that is β3 = 0.
The effects of the firm characteristics xi on the probabilities that a firm engages
in the different types of going-private deals is a nonlinear function of the model
parameters βm, such that interpretation of these parameters is not straightforward.
For interpretation of the model, it is useful to consider the log-odds ratio of group
m versus group l, defined as
log
(P [yi = m|xi]
P [yi = l|xi]
)= x′i(βm − βl). (2)
This shows that firms with a larger value for xi,j more likely belongs to group m
than to group l if (βm,j − βl,j) > 0, where xi,j indicates the j-th element of xi, and
βm,j and βl,j are the corresponding coefficients. Note that this does not necessarily
imply that the probability that firm i belongs to group m increases with xi,j, as the
the odds ratios of group m versus the other categories also change. The net marginal
effect of a change in xi,j on the group probability follows from the partial derivative
of P [yi = m|xi] with respect to xi,j, which is given by
∂P [yi = m|xi]
∂xi,j
= P [yi = m|xi]
(βm,j −
M∑
l=1
βl,jP [yi = l|xi]
). (3)
The sign of this derivative depends on the sign of the term between brackets, which
may be positive or negative depending on the value of xi. Hence, the sign of the
marginal effect of xi,j on P [yi = m|xi] will not always correspond with the sign of
the coefficient βm,j. Also note that the marginal effect depends on the values of the
other explanatory variables in xi, denoted as xi,−j. In order to obtain a clear view on
9
the effect of the variable of interest xi,j one should therefore consider∂P [yi=m|xi,j ]
∂xi,j=
∫xi,−j
∂P [yi=m|xi]∂xi
dxi,−j, integrating out the effects of these other explanatory variables.
In practice this can be done by averaging (3) across all realizations of xi,−j in the
sample for each value of xi,j.
An important assumption underlying the MNLR model in (1) is independence of
irrelevant alternatives (IIA), meaning to say that the odds ratio of remaining public
versus going private through an MBO does not depend on the inclusion of the private
equity backed PtP deals, which can also be seen from (2). In economic terms, this
comes down to the assumption that managers make the decision to go private and the
choice whether or not to partner up with a private equity investor at the same time.
Put differently, taking their firm private through an MBO transaction or by seeking
private equity backing are not considered as competing options for management.
We can examine the validity of this hypothesis by testing the IIA assumption, which
is done by means of the specification test developed by Hausman and McFadden
(1984)).
The MNLR model also provides an easy way to test whether the characteristics of
firms involved in MBOs and private equity backed PtP transactions are significantly
different. Note that such heterogeneity implies that certain firm characteristics such
as analyst coverage and management ownership affect the relative probabilities of
a firm belonging to the different groups. In other words, in the MNLR model the
coefficients βm,j should differ across the MBO and private equity backed groups m =
1 and 2. For an individual variable, xi,j say, the null hypothesis of no heterogeneity
across groups m and l can easily be tested by means of a likelihood ratio test of
the restriction βm,j = βl,j. The same holds for a given sub-set of the explanatory
variables included in the model. Testing whether there is no heterogeneity at all
is slightly more complicated, and effectively boils down to testing whether the two
groups can be combined into one. This is done by means of the likelihood ratio test
developed by Cramer and Ridder (1991).
Finally, we mention an important caveat in the maximum likelihood estimation
10
of the coefficients in the MNLR model in (1). Our overall data set is not a random
sample from the population of all firms. In particular, we include all known MBOs
and private equity backed deals during the period 1997-2003, but only a selected
number of firms is included in the control group. In the case of random sampling,
for each year in our sample period we only include 200 of the firms that remain
listed, which in total equal 1200, on average. For the matched sampling case, the
inclusion of control firms obviously is even more selective. This implies that in both
cases PtP firms are considerably overrepresented in our sample compared to the
underlying population of firms. Not accounting for this selective sampling would lead
to biased estimates of the intercepts and incorrect standard errors for all estimated
coefficients; see Kieschnick (1998) and Fok and Franses (2002) for detailed analysis
of selective sampling in the context of binary and ordered logit models, respectively.
The problem can be remedied by defining modified probabilities as
P̃ [yi = m|xi] =γmP [yi = m|xi]∑Ml=1 γlP [yi = l|xi]
, for m = 1, . . . ,M, (4)
where γm is the fraction of firms in group m that is included in the sample. Hence,
in our case γ1 = γ2 = 1 while in the random sampling case, for example, we have
γ3 = 1/6. The correct likelihood function, which is used for parameter estimation
then makes use of these corrected probabilities.
3 Results
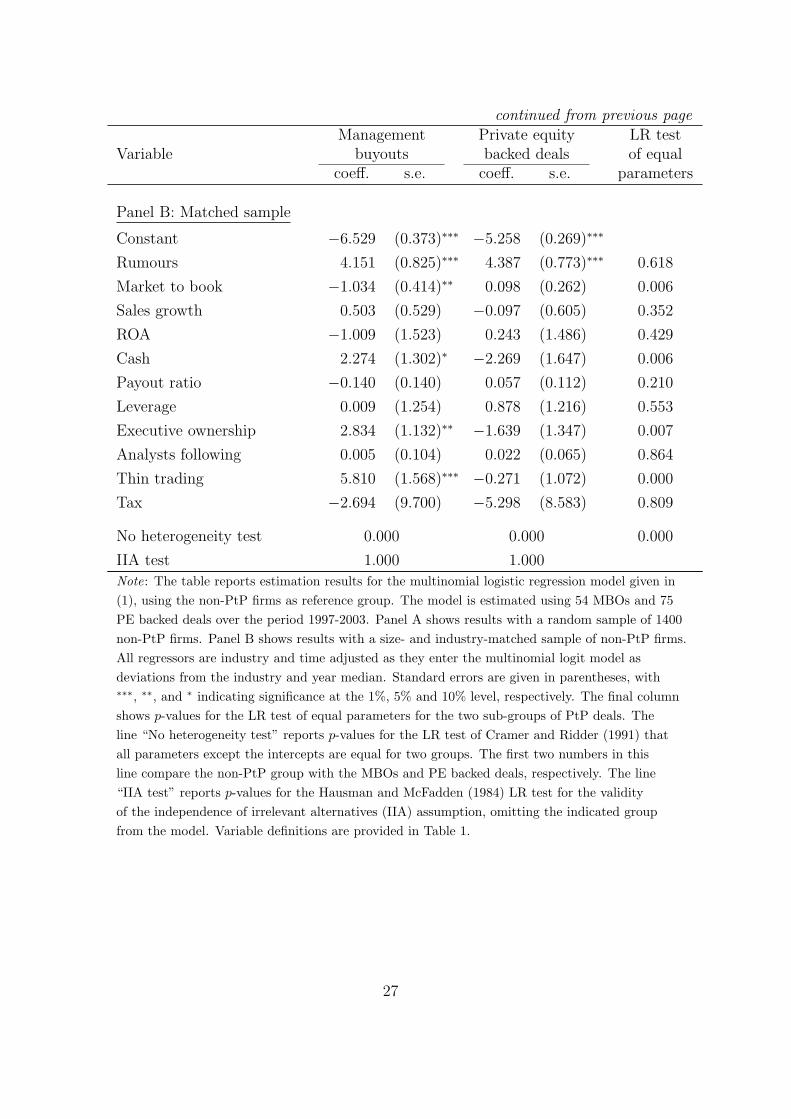
Table 3 reports the multinomial logit estimation results with randomly selected and
matched control group of non-PtP firms in Panel A and Panel B, respectively. To
account for industry and time effects, all regressors are taken in deviation from
industry median and annual median values. Our model treats the non-PtP control
firms as the omitted category. Hence, Table 3 reports two sets of coefficients: for
MBO deals and for private equity backed deals. These coefficients show how the
explanatory variables affect the probability of going private through the particular
type of transaction relative to the probability of remaining public. The last column
11
in both panels shows p-values for a likelihood ratio test of equal parameters between
MBOs and private equity backed deals. Thus, it shows significance of coefficient
differences between the two going private types. Finally, the last two lines of the
two panels show p-values for the likelihood ratio test of Cramer and Ridder (1991)
that all parameters except the intercept are equal for the corresponding two groups
and the independence of irrelevant alternatives test, respectively.
- insert Table 3 about here -
The independence of irrelevant alternatives test reported in the last row (for both
random sample and matched control firms) confirms that a multinomial logit model
fits our data better than a nested logit model. This also shows that the choice of
the particular type of going private deal, whether the deal is indeed supported by a
private equity house or is fully led by the management, is independent. Thus, the
decision to go private is made at the same time as the decision about the type of the
deal. Moreover, the no heterogeneity test of Cramer and Ridder (1991) suggests that
the two going private groups have different deal characteristics from the non-PtP
firms as well as from each other. The remainder of this section shows how the two
groups of PtP firms differ and why they go private.
3.1 Takeover threat and undervaluation
To avoid a credible takeover threat is an important motivation for a manager to
decide to take his firm private. The results in Table 3 strongly confirm this conjec-
ture. The positive and significant (at the one percent level) coefficients for rumours
show that both PtP types experience relatively high takeover interest in the period
before the transaction compared to the control group. The difference in coefficients
between the two groups of PtP firms is insignificant. Further, Table 3, Panel A
suggests that perceived undervaluation plays an important role for PtP firms. The
coefficient for the market to book ratio is significantly negative for both types of
PtP deals showing that both MBOs and private equity backed deals are on average
12
undervalued relative to the firms that remain public. The coefficient for MBOs is
more negative relative to private equity backed deals, but the difference is not sta-
tistically significant. The results in Panel B with matched control firms are slightly
different as only the coefficient for MBOs is negative and significant and the differ-
ence between MBOs and private equity backed firms is statistically different at the
one percent level. We also include sales growth over the last three years and return
on assets as explanatory variables to control for growth prospects. The two variables
are not statistically significant.
We perform two additional sensitivity checks to support our undervaluation hy-
pothesis. First, we use the Rhodes-Kropf et al. (2005) market to book decomposi-
tion into three components: the firm-specific error; sector error and long-run value to
book.1 The results with the three components are reported in Table 4. The first two
components refer to undervaluation: the firm-specific error should reflect deviations
of firm value from short-run industry pricing and therefore measure firm-specific
undervaluation relative to other peers in the industry at that point in time. The
sector error should reflect sector-wide, short-run deviations from long-run pricing of
all firms in the same industry and therefore measures short-run undervaluation of
the whole industry. The third component separates out long-run growth prospects of
the firm. Both coefficients for firm-specific error in Table 4 are significantly negative
at the one percent level and not statistically different from each other. At the same
time, the coefficient for the sector error is negative and statistically significant at the
ten percent level for MBOs whereas it is positive and insignificant for private equity
backed deals. The difference between the two coefficients is significant at the ten
percent level. This indicates that both MBOs and private equity backed firms are
short-run undervalued relative to their industry peers, but MBOs are, on top of this,
in undervalued industries. Moreover, the effect of the third component indicates that
MBOs are low long-run value to book firms whereas private equity backed deals are
1For the decomposition, we use Rhodes-Kropf et al. (2005) Model 3 (on page 577) with industriesmatching our previous specification in Table 3.
13
not. Thus, the market to book decomposition indicates that MBOs versus private
equity backed PtP firms are different both with respect to undervaluation as well
as long-run growth prospects. This is in line with the overall story that managers
seeking private equity backing are more financially constrained.
- insert Table 4 about here -
Second, we use insider trading patterns in our firms to support the view that
our results on the market to book ratio pick up the effect of private information. If
undervaluation is indeed one of the reasons for going private, we could expect that
managers trading in advance of the event may partially reveal the importance of
that information. In fact, Harlow and Howe (1993) document significant increase
in trading by insiders prior to the announcement of US management-led buyouts
over the period from 1980 to 1989. They show, however, that this abnormal pattern
arises not from increases in purchases but from abnormally low levels of stock sales.
Harlow and Howe (1993) argue that this passive insider trading strategy is preferred
by managers as it reduces their liability risk. In line with this existing evidence, our
management sponsored deals should experience abnormally low insider sales relative
to the private equity backed deals and non-PtP firms. In order to show this, Table
4 includes two dummy variables that reflect the insider purchase and sale patterns
of executive directors of firms in our sample. In particular, the executive director
purchase (sale) dummy is set to one in case an executive director purchased (sold)
some shares of his/her own firm in the calendar year prior to the announcement
and set to zero otherwise. Our results confirm that managers of MBOs tend to
sell their shares significantly less often than their counterparts in non-PtP firms
and private equity backed deals. We do not see any significant differences for the
purchase patterns. Thus, our results are in line with Harlow and Howe (1993) and
support our conclusion that firm undervaluation is more important in motivating
MBOs versus private equity backed deals.
14
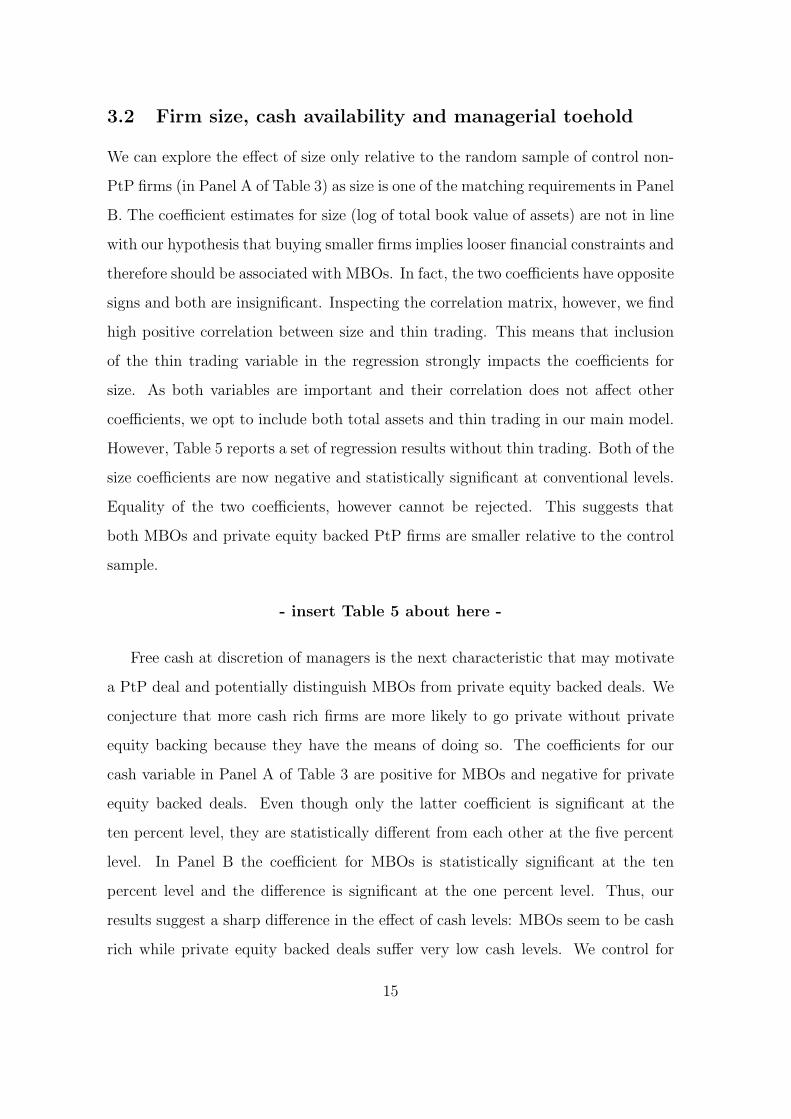
3.2 Firm size, cash availability and managerial toehold
We can explore the effect of size only relative to the random sample of control non-
PtP firms (in Panel A of Table 3) as size is one of the matching requirements in Panel
B. The coefficient estimates for size (log of total book value of assets) are not in line
with our hypothesis that buying smaller firms implies looser financial constraints and
therefore should be associated with MBOs. In fact, the two coefficients have opposite
signs and both are insignificant. Inspecting the correlation matrix, however, we find
high positive correlation between size and thin trading. This means that inclusion
of the thin trading variable in the regression strongly impacts the coefficients for
size. As both variables are important and their correlation does not affect other
coefficients, we opt to include both total assets and thin trading in our main model.
However, Table 5 reports a set of regression results without thin trading. Both of the
size coefficients are now negative and statistically significant at conventional levels.
Equality of the two coefficients, however cannot be rejected. This suggests that
both MBOs and private equity backed PtP firms are smaller relative to the control
sample.
- insert Table 5 about here -
Free cash at discretion of managers is the next characteristic that may motivate
a PtP deal and potentially distinguish MBOs from private equity backed deals. We
conjecture that more cash rich firms are more likely to go private without private
equity backing because they have the means of doing so. The coefficients for our
cash variable in Panel A of Table 3 are positive for MBOs and negative for private
equity backed deals. Even though only the latter coefficient is significant at the
ten percent level, they are statistically different from each other at the five percent
level. In Panel B the coefficient for MBOs is statistically significant at the ten
percent level and the difference is significant at the one percent level. Thus, our
results suggest a sharp difference in the effect of cash levels: MBOs seem to be cash
rich while private equity backed deals suffer very low cash levels. We control for
15
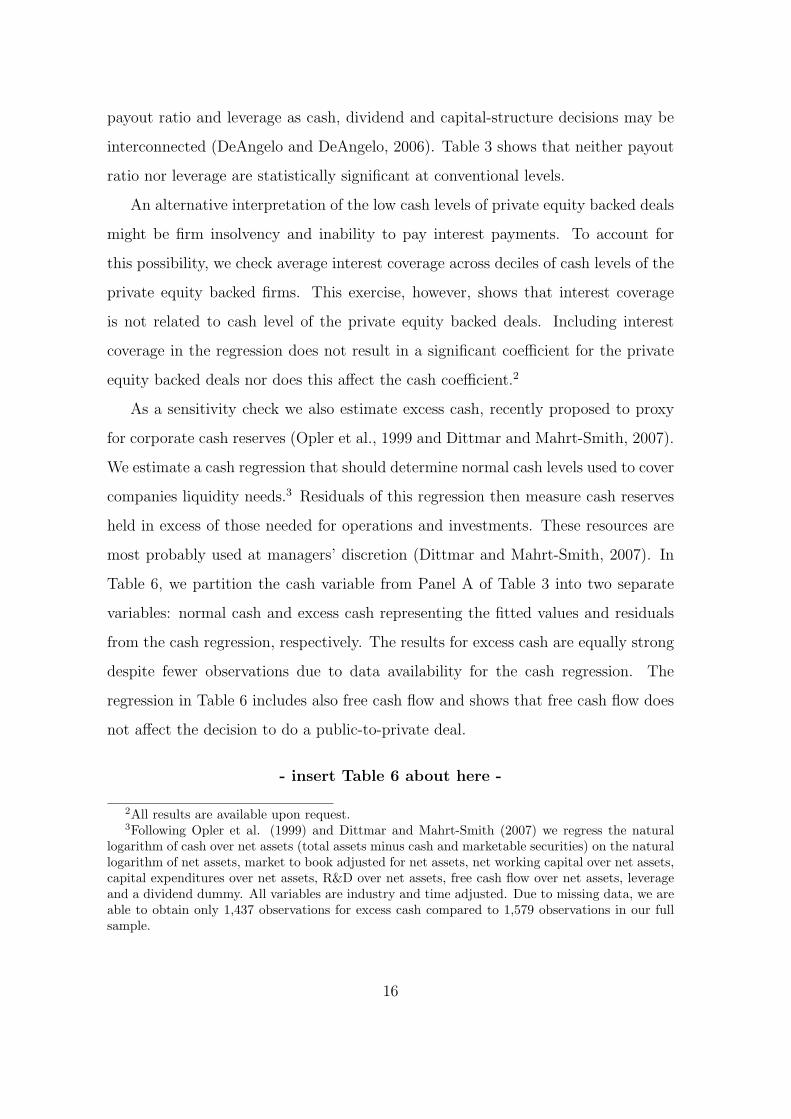
payout ratio and leverage as cash, dividend and capital-structure decisions may be
interconnected (DeAngelo and DeAngelo, 2006). Table 3 shows that neither payout
ratio nor leverage are statistically significant at conventional levels.
An alternative interpretation of the low cash levels of private equity backed deals
might be firm insolvency and inability to pay interest payments. To account for
this possibility, we check average interest coverage across deciles of cash levels of the
private equity backed firms. This exercise, however, shows that interest coverage
is not related to cash level of the private equity backed deals. Including interest
coverage in the regression does not result in a significant coefficient for the private
equity backed deals nor does this affect the cash coefficient.2
As a sensitivity check we also estimate excess cash, recently proposed to proxy
for corporate cash reserves (Opler et al., 1999 and Dittmar and Mahrt-Smith, 2007).
We estimate a cash regression that should determine normal cash levels used to cover
companies liquidity needs.3 Residuals of this regression then measure cash reserves
held in excess of those needed for operations and investments. These resources are
most probably used at managers’ discretion (Dittmar and Mahrt-Smith, 2007). In
Table 6, we partition the cash variable from Panel A of Table 3 into two separate
variables: normal cash and excess cash representing the fitted values and residuals
from the cash regression, respectively. The results for excess cash are equally strong
despite fewer observations due to data availability for the cash regression. The
regression in Table 6 includes also free cash flow and shows that free cash flow does
not affect the decision to do a public-to-private deal.
- insert Table 6 about here -
2All results are available upon request.3Following Opler et al. (1999) and Dittmar and Mahrt-Smith (2007) we regress the natural
logarithm of cash over net assets (total assets minus cash and marketable securities) on the naturallogarithm of net assets, market to book adjusted for net assets, net working capital over net assets,capital expenditures over net assets, R&D over net assets, free cash flow over net assets, leverageand a dividend dummy. All variables are industry and time adjusted. Due to missing data, we areable to obtain only 1,437 observations for excess cash compared to 1,579 observations in our fullsample.
16
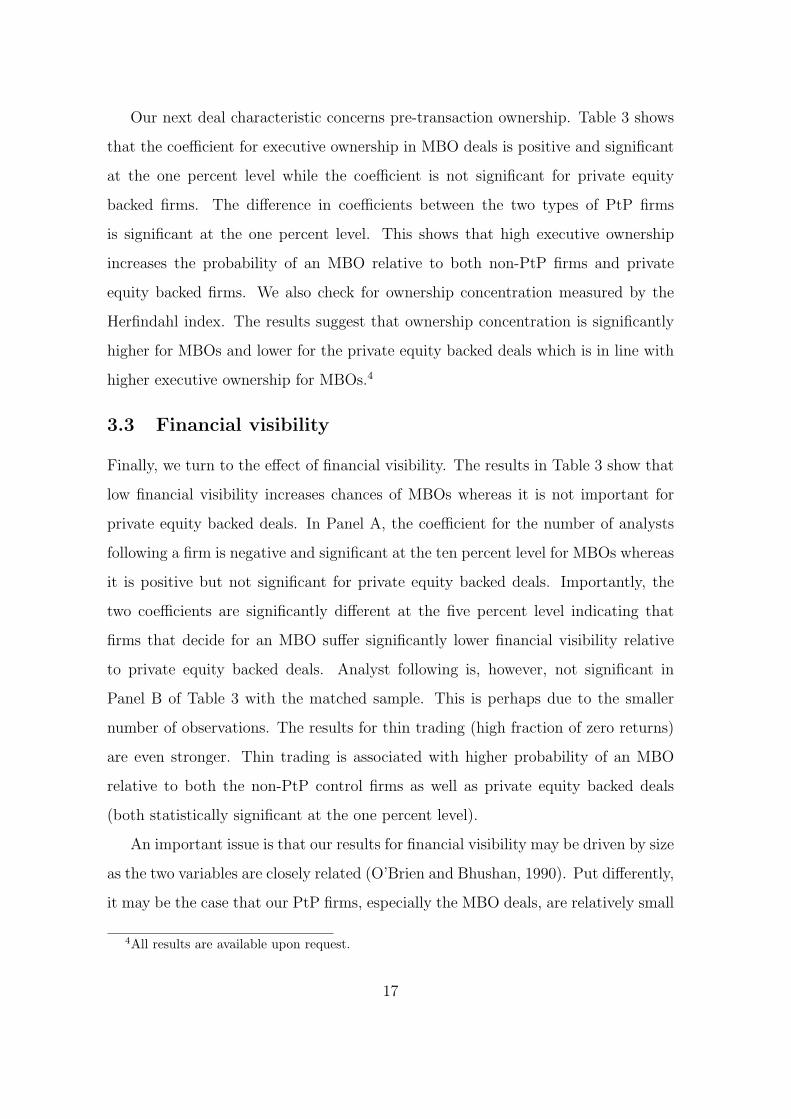
Our next deal characteristic concerns pre-transaction ownership. Table 3 shows
that the coefficient for executive ownership in MBO deals is positive and significant
at the one percent level while the coefficient is not significant for private equity
backed firms. The difference in coefficients between the two types of PtP firms
is significant at the one percent level. This shows that high executive ownership
increases the probability of an MBO relative to both non-PtP firms and private
equity backed firms. We also check for ownership concentration measured by the
Herfindahl index. The results suggest that ownership concentration is significantly
higher for MBOs and lower for the private equity backed deals which is in line with
higher executive ownership for MBOs.4
3.3 Financial visibility
Finally, we turn to the effect of financial visibility. The results in Table 3 show that
low financial visibility increases chances of MBOs whereas it is not important for
private equity backed deals. In Panel A, the coefficient for the number of analysts
following a firm is negative and significant at the ten percent level for MBOs whereas
it is positive but not significant for private equity backed deals. Importantly, the
two coefficients are significantly different at the five percent level indicating that
firms that decide for an MBO suffer significantly lower financial visibility relative
to private equity backed deals. Analyst following is, however, not significant in
Panel B of Table 3 with the matched sample. This is perhaps due to the smaller
number of observations. The results for thin trading (high fraction of zero returns)
are even stronger. Thin trading is associated with higher probability of an MBO
relative to both the non-PtP control firms as well as private equity backed deals
(both statistically significant at the one percent level).
An important issue is that our results for financial visibility may be driven by size
as the two variables are closely related (O’Brien and Bhushan, 1990). Put differently,
it may be the case that our PtP firms, especially the MBO deals, are relatively small
4All results are available upon request.
17
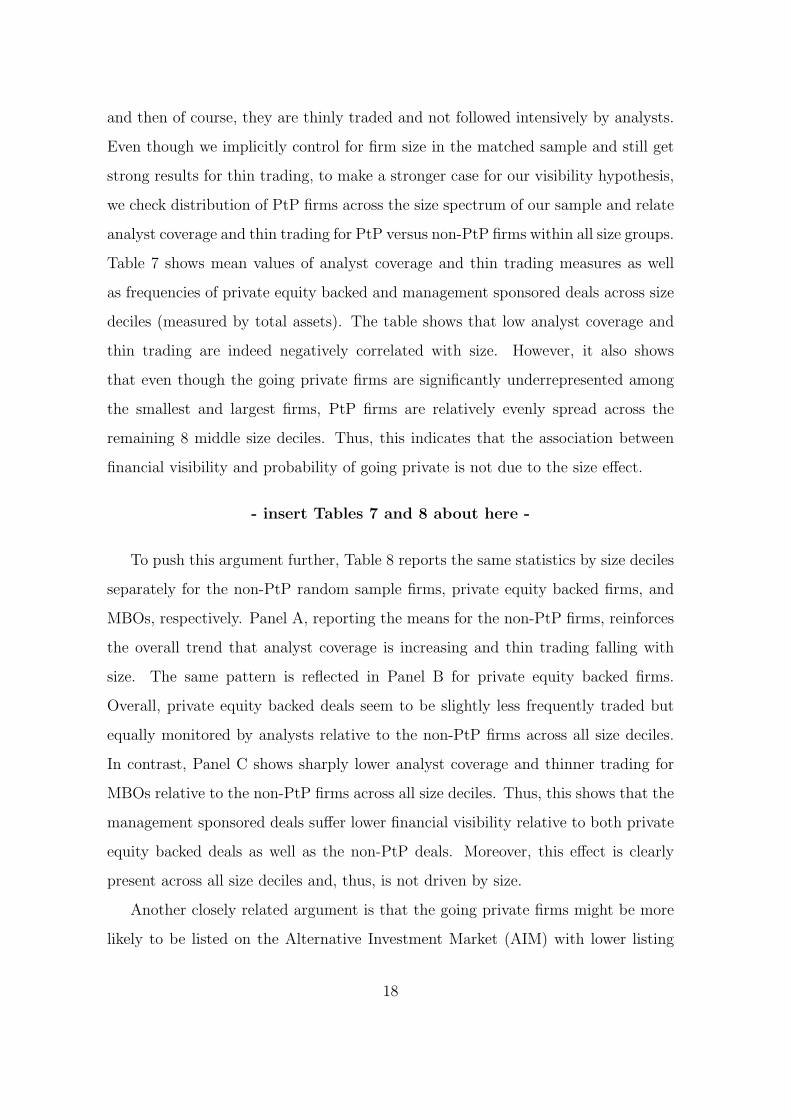
and then of course, they are thinly traded and not followed intensively by analysts.
Even though we implicitly control for firm size in the matched sample and still get
strong results for thin trading, to make a stronger case for our visibility hypothesis,
we check distribution of PtP firms across the size spectrum of our sample and relate
analyst coverage and thin trading for PtP versus non-PtP firms within all size groups.
Table 7 shows mean values of analyst coverage and thin trading measures as well
as frequencies of private equity backed and management sponsored deals across size
deciles (measured by total assets). The table shows that low analyst coverage and
thin trading are indeed negatively correlated with size. However, it also shows
that even though the going private firms are significantly underrepresented among
the smallest and largest firms, PtP firms are relatively evenly spread across the
remaining 8 middle size deciles. Thus, this indicates that the association between
financial visibility and probability of going private is not due to the size effect.
- insert Tables 7 and 8 about here -
To push this argument further, Table 8 reports the same statistics by size deciles
separately for the non-PtP random sample firms, private equity backed firms, and
MBOs, respectively. Panel A, reporting the means for the non-PtP firms, reinforces
the overall trend that analyst coverage is increasing and thin trading falling with
size. The same pattern is reflected in Panel B for private equity backed firms.
Overall, private equity backed deals seem to be slightly less frequently traded but
equally monitored by analysts relative to the non-PtP firms across all size deciles.
In contrast, Panel C shows sharply lower analyst coverage and thinner trading for
MBOs relative to the non-PtP firms across all size deciles. Thus, this shows that the
management sponsored deals suffer lower financial visibility relative to both private
equity backed deals as well as the non-PtP deals. Moreover, this effect is clearly
present across all size deciles and, thus, is not driven by size.
Another closely related argument is that the going private firms might be more
likely to be listed on the Alternative Investment Market (AIM) with lower listing
18
requirements which in turn would drive the visibility result. The last column in
Tables 7 and 8 reports AIM listing frequency among our firms and does not detect
any significant trend. Also, in an unreported regression, we include an AIM dummy
as an additional regressor. As the coefficients are not significant and the other results
remain unaffected we conclude that AIM listing does not drive our results. Overall,
our results show that management sponsored deals suffer both lower analyst coverage
and are less frequently traded and therefore have less reasons to remain publicly
listed whereas this is not the case for the private equity backed deals. Considering
financial visibility, MBOs and private equity backed firms are significantly different.
4 Conclusions
This paper is the first to examine the managerial decision to seek private equity
backing in taking the firm private. Our analysis is conditioned on management
taking the going private decision and keeping their jobs afterwards. Our main find-
ings are threefold. The first important insight is that managers decide about going
private and whether or not to involve private equity investors as part of the deal
simultaneously. This indicates that the alternative way of going private is not vi-
able in their situation. Second, we show that PtP transactions are often triggered
by a takeover threat which highlights the managerial desire to keep their job. We
also find that both types of PtP firms are smaller relative to the control sample
of firms that remained listed on the stock exchange. Finally, our analysis reveals
that managers prefer to take their firms private themselves without the backing of
private equity house if they are less financially constrained. This allows them to
remain in full control instead of sharing control with a private equity investor and
reap the benefits of the deal for themselves. In particular, our analysis shows that
managers decide to take their firm private when it is relatively cheaper because of
undervaluation of their firms stock, when they already own a large equity stake in
the company or when their firms are less financially visible in sense that their stock
is thinly traded and they are followed by fewer analysts. Managers are also more
19

likely to take their firm private when the firm has substantial cash holdings that can
be used for deal financing. Managers tend to invite private equity investors to back
them when they are more financially constrained. This is the case when their firms
have less cash and managers own a smaller fraction of the company. So, our results
show that the two types of PtP firms have significantly different characteristics. We
interpret this result as indicating that private equity involvement in the PtP market
extends the possibilities for managers when considering a PtP transaction.
20
References
Allen, F., and D. Gale, 1999, “Diversity of Opinion and Financing of New Technologies,”Journal of Financial Intermediation, 8, 68–89.
Bharath, S.T. and A.K. Dittmar, 2009, “Why Do Firms Use Private Equity to Opt out ofPublic Markets?”.Review of Financial Studies, forthcoming.
Bolton, P., and E.-L. von Thadden, 1998, “Blocks, Liquidity, and Corporate Control,”Journal of Finance, 53, 1–25.
Boot, A.W.A., R. Gopalan, and A.V. Thakor, 2006, “The Entrepreneurs chose betweenPrivate and Public Ownership,” Journal of Finance, 61, 803–836.
Cramer, J.S. and G. Ridder, 1991, “Pooling States in the Multinomial Logit Model,”Journal of Econometrics, 47, 267–272.
Cumming, D., D.S. Siegel and M. Wright, 2007, ”Private Equity, Leveraged Buyouts andGovernance,” Journal of Corporate Finance, 13, 439-460.
DeAngelo, H. and L. DeAngelo, 2006, “Capital Structure, Payout Policy, and FinancialFlexibility,” USC Marshall School of Business Working Paper #02/06.
Dittmar, A. and J. Mahrt-Smith, 2007, “Corporate Governance and the Value of CashHoldings,” Journal of Financial Economics, 83, 599–634.
Elitzur, R., P. Halpern, R. Kieschnick, and W. Rotenberg, 1998, “Managerial Incentivesand the Structure of Management Buyouts,” Journal of Economic Behavior and Orga-nization, 36, 347–367.
Fok, D., and P.H. Franses, 2002, “Ordered Logit Analysis for Selectively Sampled Data,”Computational Statistics and Data Analysis, 40, 477–497.
Fox, I. and A. Marcus, 1992, “The Causes and Consequences of Leveraged ManagementBuyouts,” Academy of Management Review, 17, 62–85.
Halpern, P., R. Kieschnick, and W. Rotenberg, 1999, “On the Heterogeneity of LeveragedGoing Private Transactions,” Review of Financial Studies, 12, 281–309.
Harlow, W.V. and J.S. Howe, 1993, “Leveraged Buyout and Insider Nontrading,” FinancialManagement, 22, 109–118.
Hausman, J. and D. McFadden, 1984, “Specification Tests for the Multinomial LogitModel,” Econometrica, 52, 1219–1240.
Jensen, M., 1986, “Agency Costs of Free Cash Flows, Corporate Finance and Takeovers,”American Economic Review, 76, 323–329.
Kiechel, W., 2007, “Private Equity’s Long View,” Harvard Business Review 85 (7/8),18-19.
Kieschnick, R., 1998, “Free Cash Flow and Stockholder Gains in Going Private Transac-tions Revisited,” Journal of Business Finance and Accounting, 25, 187–202.
Lehn, K., and A. Poulsen, 1989, “Free cash Flow and Stockholder Gains in Going PrivateTransactions,” Journal of Finance, 44, 771–787.
21
Lowenstein, L., 1985, “Management buyouts,” Columbia Law Review, 85, 730–784.
Maupin, R.J., C.H. Bidwell, and A.K. Ortegren, 1984, “An Empirical Investigation of theCharacteristics of Publicly-Quoted Corporations Which Change to Closely-Held Own-ership Through Management Buyouts,” Journal of Business Finance and Accounting,11, 435–450.
Mehran, H. and S. Peristiani, 2009, “Financial Visibility and the Decision to Go Private,”Review of Financial Studies, forthcoming.
Merton, R.C., 1987, “A Simple Model of Capital Market Equilibrium with IncompleteInformation,” Journal of Finance, 42, 483–510.
O’Brien, P. and R. Bhushan, 1990, “Analyst Following and Institutional Ownership,”Journal of Accounting Research, 28, 55–65.
Opler, T., and S. Titman, 1993, “The Determinants of Leveraged Buyout Activity: FreeCash Flow vs. Financial Distress Costs,” Journal of Finance 48, 1985–1999.
Opler, T., L. Pinkowitz, R. Stulz, and R. Williamson, 1999, “The Determinants andImplications of Cash Holdings,” Journal of Financial Economics, 52, 3–46.
Pagano, M., F. Panetta, and L. Zingales, 1998, “Why Do Companies Go Public? AnEmpirical Analysis,” Journal of Finance, 53, 27–64.
Renneboog, L., T. Simons and M. Wright, 2007, “Why Do Public Firms Go Private in theUK? The Impact of Private Equity Investors, Incentive Realignment and Undervalua-tion, Journal of Corporate Finance, 13, 591–628.
Rhodes-Kropf, M., D.T. Robinson, and S. Viswanathan, 2005, Valuation Waves andMerger Activity: The Empirical evidence, Journal of Financial Economics, 77, 561-603.
Rubin, A., 2007, ”Ownership Level, Ownership Concentration and Liquidity,” Journal ofFinancial Markets, 10, 219-248.
Weir, C., D. Laing, and M. Wright, 2005, “Incentive Effects, Monitoring Mechanisms andthe Market for Corporate Control: An Analysis of Factors Affecting Public to PrivateTransactions in the UK,” Journal of Business Finance and Accounting, 32, 909–943.
Wright, M., L. Renneboog, L. Scholes, and T. Simons, 2006, “Management Buyouts inthe UK and Europe: retrospect and prospect, Journal of Applied Corporate Finance,18 (3), 38-55.
22
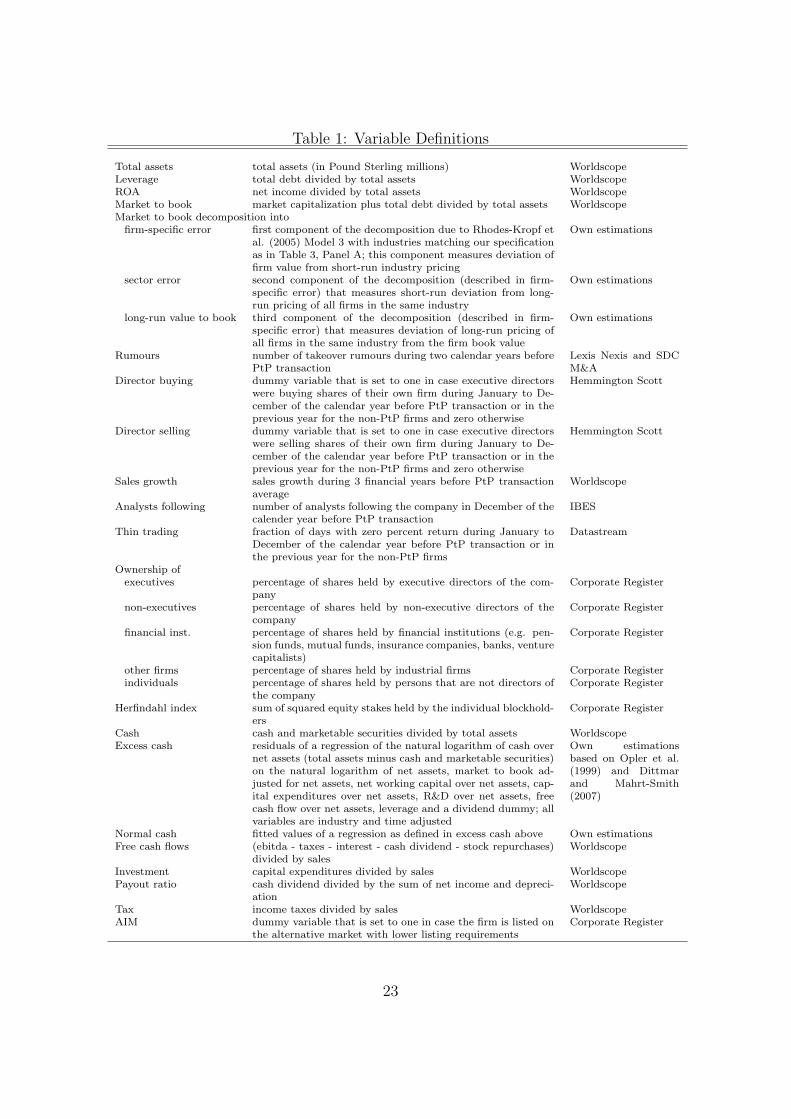
Table 1: Variable Definitions
Total assets total assets (in Pound Sterling millions) WorldscopeLeverage total debt divided by total assets WorldscopeROA net income divided by total assets WorldscopeMarket to book market capitalization plus total debt divided by total assets WorldscopeMarket to book decomposition into
firm-specific error first component of the decomposition due to Rhodes-Kropf etal. (2005) Model 3 with industries matching our specificationas in Table 3, Panel A; this component measures deviation offirm value from short-run industry pricing
Own estimations
sector error second component of the decomposition (described in firm-specific error) that measures short-run deviation from long-run pricing of all firms in the same industry
Own estimations
long-run value to book third component of the decomposition (described in firm-specific error) that measures deviation of long-run pricing ofall firms in the same industry from the firm book value
Own estimations
Rumours number of takeover rumours during two calendar years beforePtP transaction
Lexis Nexis and SDCM&A
Director buying dummy variable that is set to one in case executive directorswere buying shares of their own firm during January to De-cember of the calendar year before PtP transaction or in theprevious year for the non-PtP firms and zero otherwise
Hemmington Scott
Director selling dummy variable that is set to one in case executive directorswere selling shares of their own firm during January to De-cember of the calendar year before PtP transaction or in theprevious year for the non-PtP firms and zero otherwise
Hemmington Scott
Sales growth sales growth during 3 financial years before PtP transactionaverage
Worldscope
Analysts following number of analysts following the company in December of thecalender year before PtP transaction
IBES
Thin trading fraction of days with zero percent return during January toDecember of the calendar year before PtP transaction or inthe previous year for the non-PtP firms
Datastream
Ownership ofexecutives percentage of shares held by executive directors of the com-
panyCorporate Register
non-executives percentage of shares held by non-executive directors of thecompany
Corporate Register
financial inst. percentage of shares held by financial institutions (e.g. pen-sion funds, mutual funds, insurance companies, banks, venturecapitalists)
Corporate Register
other firms percentage of shares held by industrial firms Corporate Registerindividuals percentage of shares held by persons that are not directors of
the companyCorporate Register
Herfindahl index sum of squared equity stakes held by the individual blockhold-ers
Corporate Register
Cash cash and marketable securities divided by total assets WorldscopeExcess cash residuals of a regression of the natural logarithm of cash over
net assets (total assets minus cash and marketable securities)on the natural logarithm of net assets, market to book ad-justed for net assets, net working capital over net assets, cap-ital expenditures over net assets, R&D over net assets, freecash flow over net assets, leverage and a dividend dummy; allvariables are industry and time adjusted
Own estimationsbased on Opler et al.(1999) and Dittmarand Mahrt-Smith(2007)
Normal cash fitted values of a regression as defined in excess cash above Own estimationsFree cash flows (ebitda - taxes - interest - cash dividend - stock repurchases)
divided by salesWorldscope
Investment capital expenditures divided by sales WorldscopePayout ratio cash dividend divided by the sum of net income and depreci-
ationWorldscope
Tax income taxes divided by sales WorldscopeAIM dummy variable that is set to one in case the firm is listed on
the alternative market with lower listing requirementsCorporate Register
23
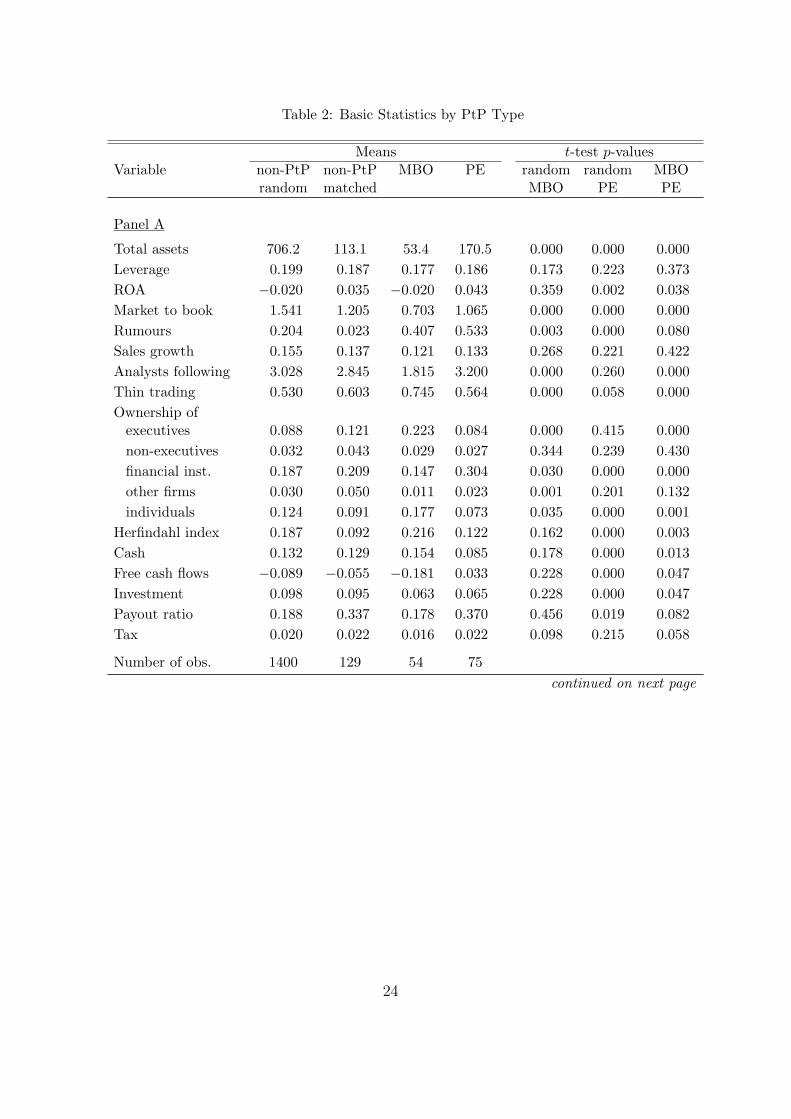
Table 2: Basic Statistics by PtP Type
Means t-test p-valuesVariable non-PtP non-PtP MBO PE random random MBO
random matched MBO PE PE
Panel A
Total assets 706.2 113.1 53.4 170.5 0.000 0.000 0.000Leverage 0.199 0.187 0.177 0.186 0.173 0.223 0.373ROA −0.020 0.035 −0.020 0.043 0.359 0.002 0.038Market to book 1.541 1.205 0.703 1.065 0.000 0.000 0.000Rumours 0.204 0.023 0.407 0.533 0.003 0.000 0.080Sales growth 0.155 0.137 0.121 0.133 0.268 0.221 0.422Analysts following 3.028 2.845 1.815 3.200 0.000 0.260 0.000Thin trading 0.530 0.603 0.745 0.564 0.000 0.058 0.000Ownership of
executives 0.088 0.121 0.223 0.084 0.000 0.415 0.000non-executives 0.032 0.043 0.029 0.027 0.344 0.239 0.430financial inst. 0.187 0.209 0.147 0.304 0.030 0.000 0.000other firms 0.030 0.050 0.011 0.023 0.001 0.201 0.132individuals 0.124 0.091 0.177 0.073 0.035 0.000 0.001
Herfindahl index 0.187 0.092 0.216 0.122 0.162 0.000 0.003Cash 0.132 0.129 0.154 0.085 0.178 0.000 0.013Free cash flows −0.089 −0.055 −0.181 0.033 0.228 0.000 0.047Investment 0.098 0.095 0.063 0.065 0.228 0.000 0.047Payout ratio 0.188 0.337 0.178 0.370 0.456 0.019 0.082Tax 0.020 0.022 0.016 0.022 0.098 0.215 0.058
Number of obs. 1400 129 54 75continued on next page
24
continued from previous pageMedians U -test p-values
Variable non-PtP non-PtP MBO PE random random MBOrandom matched MBO PE PE
Panel B
Total assets 67.0 50.7 39.6 66.3 0.001 0.449 0.000Leverage 0.173 0.155 0.146 0.178 0.103 0.461 0.196ROA 0.044 0.058 0.042 0.071 0.153 0.000 0.001Market to book 1.013 0.868 0.654 0.835 0.000 0.027 0.000Rumours 0 0 0 1 0.009 0.000 0.112Sales growth 0.071 0.088 0.016 0.065 0.032 0.432 0.037Analysts following 2 2 1 3 0.000 0.114 0.000Thin trading 0.571 0.621 0.766 0.594 0.000 0.346 0.000Ownership of
executives 0.015 0.038 0.158 0.017 0.000 0.078 0.000non-executives 0.002 0.005 0.001 0.001 0.453 0.148 0.333financial inst. 0.151 0.180 0.101 0.306 0.050 0.000 0.000other firms 0 0 0 0 0.083 0.183 0.334individuals 0.055 0.036 0.109 0.031 0.018 0.008 0.001
Herfindahl index 0.118 0.014 0.152 0.059 0.081 0.012 0.003Cash 0.070 0.076 0.072 0.045 0.320 0.019 0.068Free cash flows 0.048 0.058 0.031 0.050 0.034 0.403 0.029Investment 0.038 0.039 0.031 0.038 0.018 0.300 0.111Payout ratio 0.180 0.327 0.197 0.235 0.470 0.008 0.106Tax 0.015 0.016 0.012 0.020 0.077 0.193 0.028
Number of obs. 1400 129 54 75Note: This table shows the means and medians across the random and matched samples of non-PtPfirms, all PtP firms, as well as management buyouts (MBO) and private equity backed (PE backed)deals. The last three columns show p-values for t-test for equal means allowing for unequalvariances in Panel A and a Mann-Whitney U-test for equal medians in Panel B. All variables aretrimmed at the 1st and 99th percentiles, except for the ownership and illiquidity variables.See Table 1 for variable definitions.
25
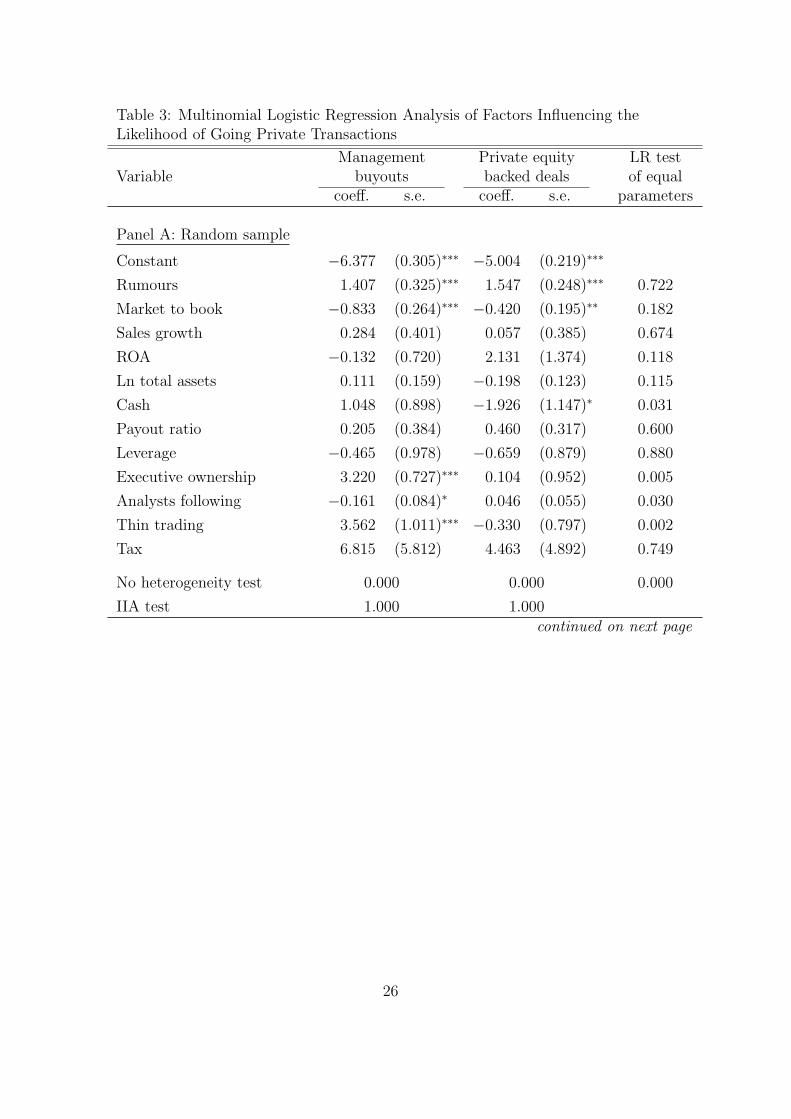
Table 3: Multinomial Logistic Regression Analysis of Factors Influencing theLikelihood of Going Private Transactions
Management Private equity LR testVariable buyouts backed deals of equal
coeff. s.e. coeff. s.e. parameters
Panel A: Random sample
Constant −6.377 (0.305)∗∗∗ −5.004 (0.219)∗∗∗
Rumours 1.407 (0.325)∗∗∗ 1.547 (0.248)∗∗∗ 0.722
Market to book −0.833 (0.264)∗∗∗ −0.420 (0.195)∗∗ 0.182
Sales growth 0.284 (0.401) 0.057 (0.385) 0.674
ROA −0.132 (0.720) 2.131 (1.374) 0.118
Ln total assets 0.111 (0.159) −0.198 (0.123) 0.115
Cash 1.048 (0.898) −1.926 (1.147)∗ 0.031
Payout ratio 0.205 (0.384) 0.460 (0.317) 0.600
Leverage −0.465 (0.978) −0.659 (0.879) 0.880
Executive ownership 3.220 (0.727)∗∗∗ 0.104 (0.952) 0.005
Analysts following −0.161 (0.084)∗ 0.046 (0.055) 0.030
Thin trading 3.562 (1.011)∗∗∗ −0.330 (0.797) 0.002
Tax 6.815 (5.812) 4.463 (4.892) 0.749
No heterogeneity test 0.000 0.000 0.000
IIA test 1.000 1.000continued on next page
26
continued from previous pageManagement Private equity LR test
Variable buyouts backed deals of equalcoeff. s.e. coeff. s.e. parameters
Panel B: Matched sample
Constant −6.529 (0.373)∗∗∗ −5.258 (0.269)∗∗∗
Rumours 4.151 (0.825)∗∗∗ 4.387 (0.773)∗∗∗ 0.618
Market to book −1.034 (0.414)∗∗ 0.098 (0.262) 0.006
Sales growth 0.503 (0.529) −0.097 (0.605) 0.352
ROA −1.009 (1.523) 0.243 (1.486) 0.429
Cash 2.274 (1.302)∗ −2.269 (1.647) 0.006
Payout ratio −0.140 (0.140) 0.057 (0.112) 0.210
Leverage 0.009 (1.254) 0.878 (1.216) 0.553
Executive ownership 2.834 (1.132)∗∗ −1.639 (1.347) 0.007
Analysts following 0.005 (0.104) 0.022 (0.065) 0.864
Thin trading 5.810 (1.568)∗∗∗ −0.271 (1.072) 0.000
Tax −2.694 (9.700) −5.298 (8.583) 0.809
No heterogeneity test 0.000 0.000 0.000
IIA test 1.000 1.000
Note: The table reports estimation results for the multinomial logistic regression model given in(1), using the non-PtP firms as reference group. The model is estimated using 54 MBOs and 75PE backed deals over the period 1997-2003. Panel A shows results with a random sample of 1400non-PtP firms. Panel B shows results with a size- and industry-matched sample of non-PtP firms.All regressors are industry and time adjusted as they enter the multinomial logit model asdeviations from the industry and year median. Standard errors are given in parentheses, with∗∗∗, ∗∗, and ∗ indicating significance at the 1%, 5% and 10% level, respectively. The final columnshows p-values for the LR test of equal parameters for the two sub-groups of PtP deals. Theline “No heterogeneity test” reports p-values for the LR test of Cramer and Ridder (1991) thatall parameters except the intercepts are equal for two groups. The first two numbers in thisline compare the non-PtP group with the MBOs and PE backed deals, respectively. The line“IIA test” reports p-values for the Hausman and McFadden (1984) LR test for the validityof the independence of irrelevant alternatives (IIA) assumption, omitting the indicated groupfrom the model. Variable definitions are provided in Table 1.
27
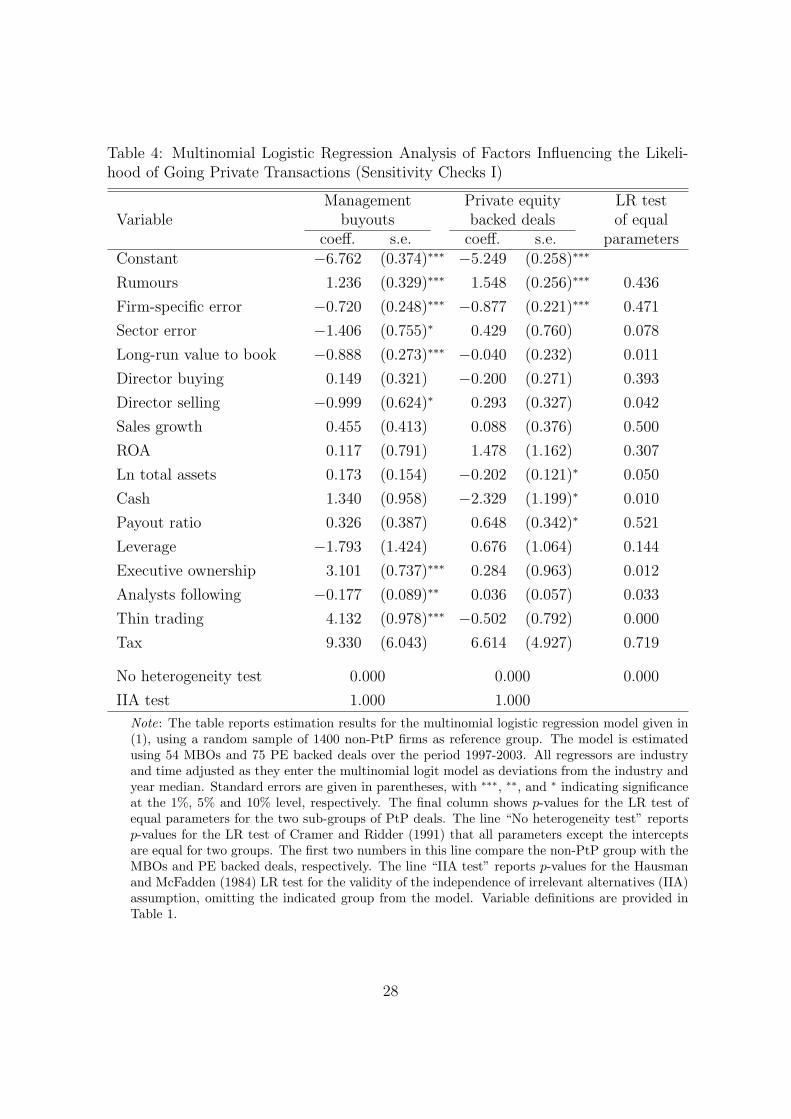
Table 4: Multinomial Logistic Regression Analysis of Factors Influencing the Likeli-hood of Going Private Transactions (Sensitivity Checks I)
Management Private equity LR testVariable buyouts backed deals of equal
coeff. s.e. coeff. s.e. parametersConstant −6.762 (0.374)∗∗∗ −5.249 (0.258)∗∗∗
Rumours 1.236 (0.329)∗∗∗ 1.548 (0.256)∗∗∗ 0.436
Firm-specific error −0.720 (0.248)∗∗∗ −0.877 (0.221)∗∗∗ 0.471
Sector error −1.406 (0.755)∗ 0.429 (0.760) 0.078
Long-run value to book −0.888 (0.273)∗∗∗ −0.040 (0.232) 0.011
Director buying 0.149 (0.321) −0.200 (0.271) 0.393
Director selling −0.999 (0.624)∗ 0.293 (0.327) 0.042
Sales growth 0.455 (0.413) 0.088 (0.376) 0.500
ROA 0.117 (0.791) 1.478 (1.162) 0.307
Ln total assets 0.173 (0.154) −0.202 (0.121)∗ 0.050
Cash 1.340 (0.958) −2.329 (1.199)∗ 0.010
Payout ratio 0.326 (0.387) 0.648 (0.342)∗ 0.521
Leverage −1.793 (1.424) 0.676 (1.064) 0.144
Executive ownership 3.101 (0.737)∗∗∗ 0.284 (0.963) 0.012
Analysts following −0.177 (0.089)∗∗ 0.036 (0.057) 0.033
Thin trading 4.132 (0.978)∗∗∗ −0.502 (0.792) 0.000
Tax 9.330 (6.043) 6.614 (4.927) 0.719
No heterogeneity test 0.000 0.000 0.000
IIA test 1.000 1.000
Note: The table reports estimation results for the multinomial logistic regression model given in(1), using a random sample of 1400 non-PtP firms as reference group. The model is estimatedusing 54 MBOs and 75 PE backed deals over the period 1997-2003. All regressors are industryand time adjusted as they enter the multinomial logit model as deviations from the industry andyear median. Standard errors are given in parentheses, with ∗∗∗, ∗∗, and ∗ indicating significanceat the 1%, 5% and 10% level, respectively. The final column shows p-values for the LR test ofequal parameters for the two sub-groups of PtP deals. The line “No heterogeneity test” reportsp-values for the LR test of Cramer and Ridder (1991) that all parameters except the interceptsare equal for two groups. The first two numbers in this line compare the non-PtP group with theMBOs and PE backed deals, respectively. The line “IIA test” reports p-values for the Hausmanand McFadden (1984) LR test for the validity of the independence of irrelevant alternatives (IIA)assumption, omitting the indicated group from the model. Variable definitions are provided inTable 1.
28
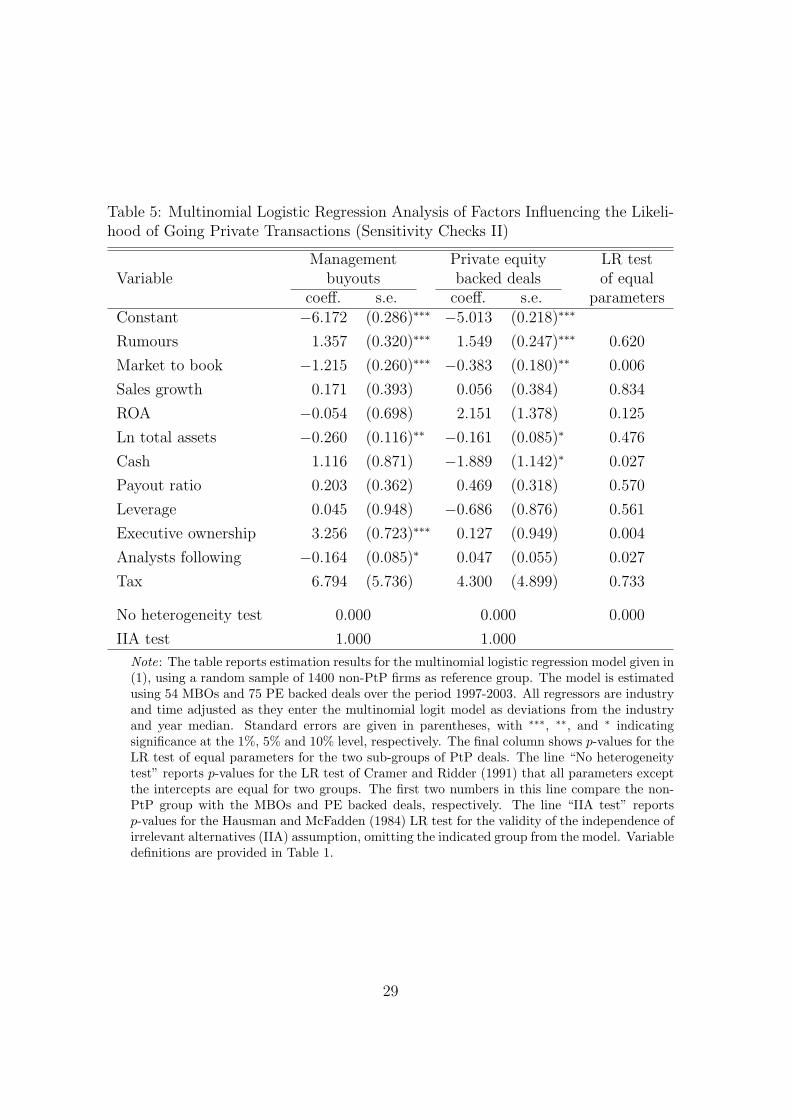
Table 5: Multinomial Logistic Regression Analysis of Factors Influencing the Likeli-hood of Going Private Transactions (Sensitivity Checks II)
Management Private equity LR testVariable buyouts backed deals of equal
coeff. s.e. coeff. s.e. parametersConstant −6.172 (0.286)∗∗∗ −5.013 (0.218)∗∗∗
Rumours 1.357 (0.320)∗∗∗ 1.549 (0.247)∗∗∗ 0.620
Market to book −1.215 (0.260)∗∗∗ −0.383 (0.180)∗∗ 0.006
Sales growth 0.171 (0.393) 0.056 (0.384) 0.834
ROA −0.054 (0.698) 2.151 (1.378) 0.125
Ln total assets −0.260 (0.116)∗∗ −0.161 (0.085)∗ 0.476
Cash 1.116 (0.871) −1.889 (1.142)∗ 0.027
Payout ratio 0.203 (0.362) 0.469 (0.318) 0.570
Leverage 0.045 (0.948) −0.686 (0.876) 0.561
Executive ownership 3.256 (0.723)∗∗∗ 0.127 (0.949) 0.004
Analysts following −0.164 (0.085)∗ 0.047 (0.055) 0.027
Tax 6.794 (5.736) 4.300 (4.899) 0.733
No heterogeneity test 0.000 0.000 0.000
IIA test 1.000 1.000
Note: The table reports estimation results for the multinomial logistic regression model given in(1), using a random sample of 1400 non-PtP firms as reference group. The model is estimatedusing 54 MBOs and 75 PE backed deals over the period 1997-2003. All regressors are industryand time adjusted as they enter the multinomial logit model as deviations from the industryand year median. Standard errors are given in parentheses, with ∗∗∗, ∗∗, and ∗ indicatingsignificance at the 1%, 5% and 10% level, respectively. The final column shows p-values for theLR test of equal parameters for the two sub-groups of PtP deals. The line “No heterogeneitytest” reports p-values for the LR test of Cramer and Ridder (1991) that all parameters exceptthe intercepts are equal for two groups. The first two numbers in this line compare the non-PtP group with the MBOs and PE backed deals, respectively. The line “IIA test” reportsp-values for the Hausman and McFadden (1984) LR test for the validity of the independence ofirrelevant alternatives (IIA) assumption, omitting the indicated group from the model. Variabledefinitions are provided in Table 1.
29
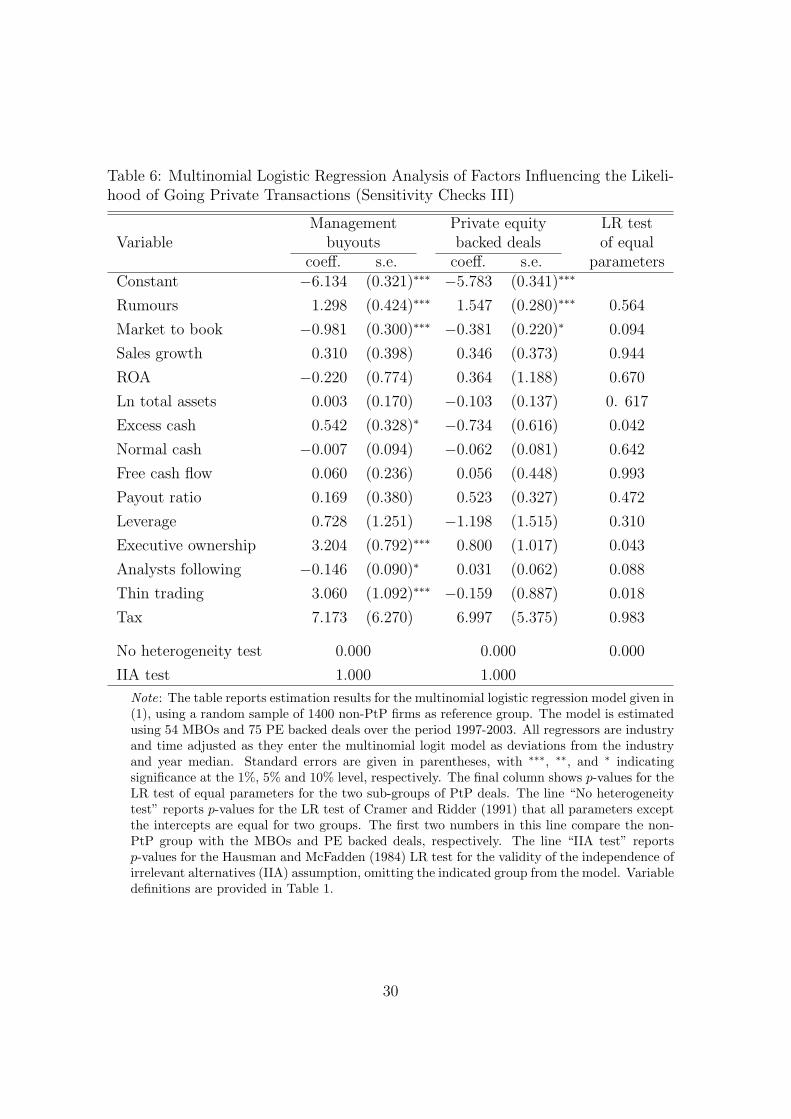
Table 6: Multinomial Logistic Regression Analysis of Factors Influencing the Likeli-hood of Going Private Transactions (Sensitivity Checks III)
Management Private equity LR testVariable buyouts backed deals of equal
coeff. s.e. coeff. s.e. parametersConstant −6.134 (0.321)∗∗∗ −5.783 (0.341)∗∗∗
Rumours 1.298 (0.424)∗∗∗ 1.547 (0.280)∗∗∗ 0.564
Market to book −0.981 (0.300)∗∗∗ −0.381 (0.220)∗ 0.094
Sales growth 0.310 (0.398) 0.346 (0.373) 0.944
ROA −0.220 (0.774) 0.364 (1.188) 0.670
Ln total assets 0.003 (0.170) −0.103 (0.137) 0. 617
Excess cash 0.542 (0.328)∗ −0.734 (0.616) 0.042
Normal cash −0.007 (0.094) −0.062 (0.081) 0.642
Free cash flow 0.060 (0.236) 0.056 (0.448) 0.993
Payout ratio 0.169 (0.380) 0.523 (0.327) 0.472
Leverage 0.728 (1.251) −1.198 (1.515) 0.310
Executive ownership 3.204 (0.792)∗∗∗ 0.800 (1.017) 0.043
Analysts following −0.146 (0.090)∗ 0.031 (0.062) 0.088
Thin trading 3.060 (1.092)∗∗∗ −0.159 (0.887) 0.018
Tax 7.173 (6.270) 6.997 (5.375) 0.983
No heterogeneity test 0.000 0.000 0.000
IIA test 1.000 1.000
Note: The table reports estimation results for the multinomial logistic regression model given in(1), using a random sample of 1400 non-PtP firms as reference group. The model is estimatedusing 54 MBOs and 75 PE backed deals over the period 1997-2003. All regressors are industryand time adjusted as they enter the multinomial logit model as deviations from the industryand year median. Standard errors are given in parentheses, with ∗∗∗, ∗∗, and ∗ indicatingsignificance at the 1%, 5% and 10% level, respectively. The final column shows p-values for theLR test of equal parameters for the two sub-groups of PtP deals. The line “No heterogeneitytest” reports p-values for the LR test of Cramer and Ridder (1991) that all parameters exceptthe intercepts are equal for two groups. The first two numbers in this line compare the non-PtP group with the MBOs and PE backed deals, respectively. The line “IIA test” reportsp-values for the Hausman and McFadden (1984) LR test for the validity of the independence ofirrelevant alternatives (IIA) assumption, omitting the indicated group from the model. Variabledefinitions are provided in Table 1.
30
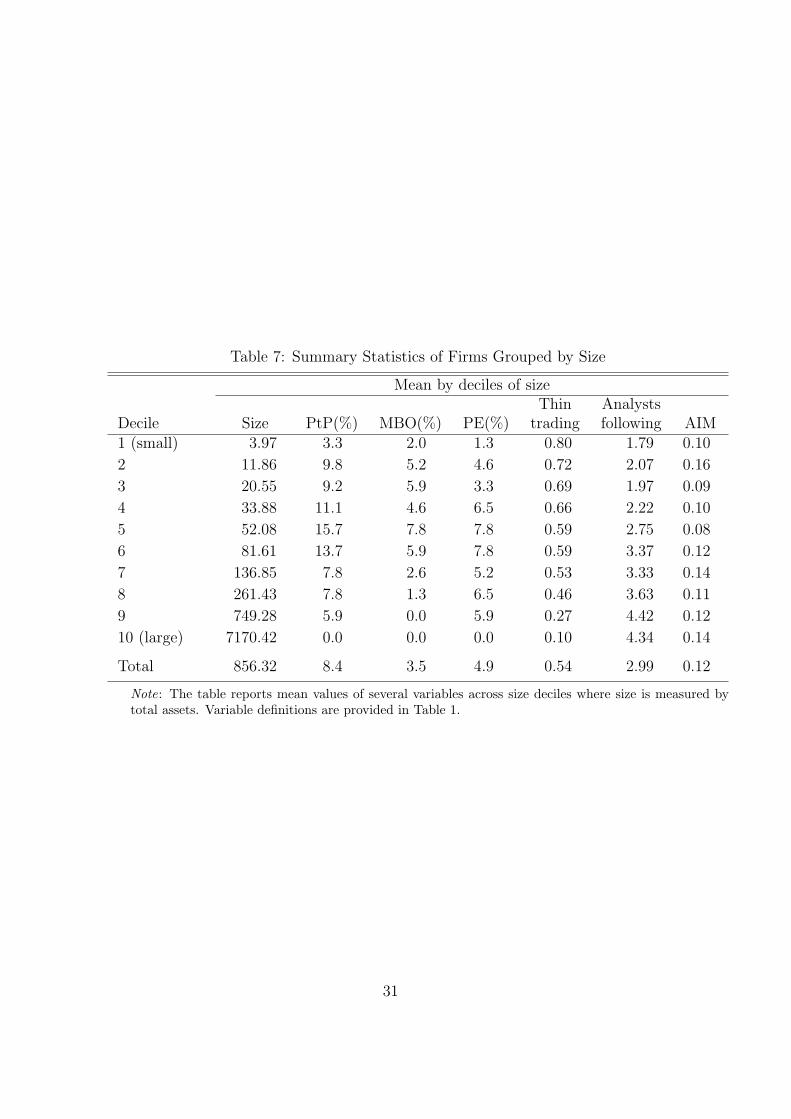
Table 7: Summary Statistics of Firms Grouped by Size
Mean by deciles of sizeThin Analysts
Decile Size PtP(%) MBO(%) PE(%) trading following AIM1 (small) 3.97 3.3 2.0 1.3 0.80 1.79 0.10
2 11.86 9.8 5.2 4.6 0.72 2.07 0.16
3 20.55 9.2 5.9 3.3 0.69 1.97 0.09
4 33.88 11.1 4.6 6.5 0.66 2.22 0.10
5 52.08 15.7 7.8 7.8 0.59 2.75 0.08
6 81.61 13.7 5.9 7.8 0.59 3.37 0.12
7 136.85 7.8 2.6 5.2 0.53 3.33 0.14
8 261.43 7.8 1.3 6.5 0.46 3.63 0.11
9 749.28 5.9 0.0 5.9 0.27 4.42 0.12
10 (large) 7170.42 0.0 0.0 0.0 0.10 4.34 0.14
Total 856.32 8.4 3.5 4.9 0.54 2.99 0.12
Note: The table reports mean values of several variables across size deciles where size is measured bytotal assets. Variable definitions are provided in Table 1.
31
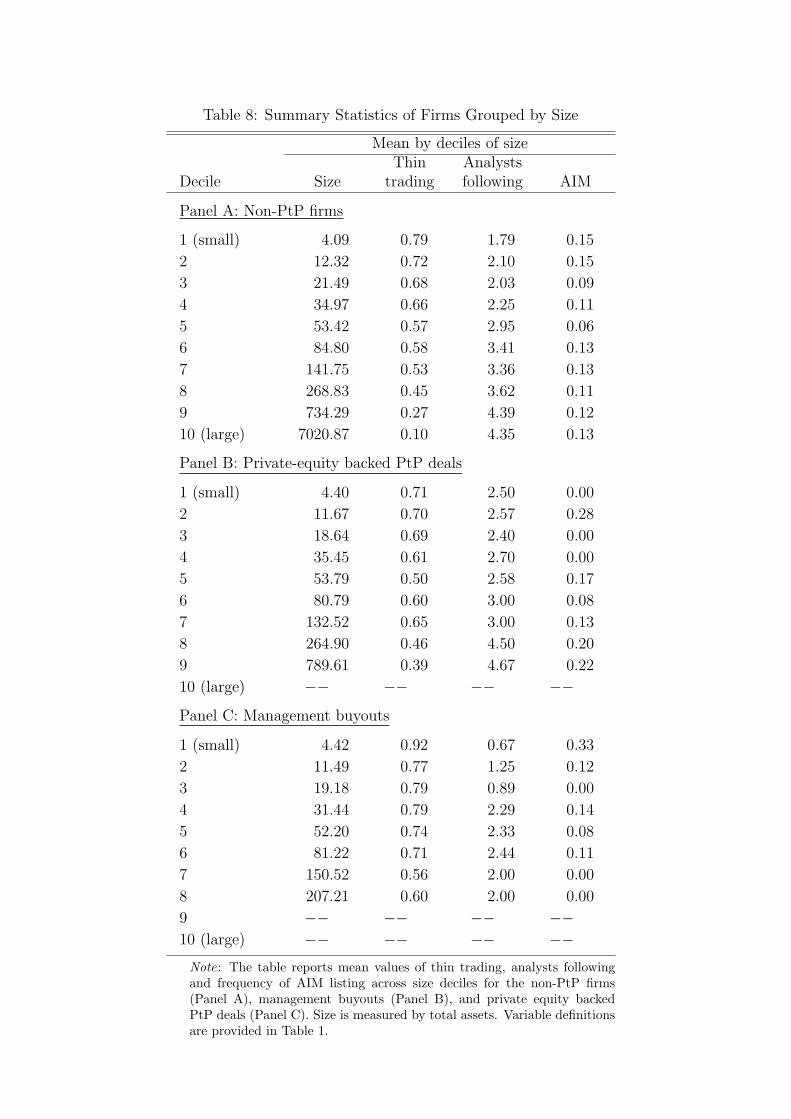
Table 8: Summary Statistics of Firms Grouped by Size
Mean by deciles of sizeThin Analysts
Decile Size trading following AIM
Panel A: Non-PtP firms
1 (small) 4.09 0.79 1.79 0.15
2 12.32 0.72 2.10 0.15
3 21.49 0.68 2.03 0.09
4 34.97 0.66 2.25 0.11
5 53.42 0.57 2.95 0.06
6 84.80 0.58 3.41 0.13
7 141.75 0.53 3.36 0.13
8 268.83 0.45 3.62 0.11
9 734.29 0.27 4.39 0.12
10 (large) 7020.87 0.10 4.35 0.13
Panel B: Private-equity backed PtP deals
1 (small) 4.40 0.71 2.50 0.00
2 11.67 0.70 2.57 0.28
3 18.64 0.69 2.40 0.00
4 35.45 0.61 2.70 0.00
5 53.79 0.50 2.58 0.17
6 80.79 0.60 3.00 0.08
7 132.52 0.65 3.00 0.13
8 264.90 0.46 4.50 0.20
9 789.61 0.39 4.67 0.22
10 (large) −− −− −− −−Panel C: Management buyouts
1 (small) 4.42 0.92 0.67 0.33
2 11.49 0.77 1.25 0.12
3 19.18 0.79 0.89 0.00
4 31.44 0.79 2.29 0.14
5 52.20 0.74 2.33 0.08
6 81.22 0.71 2.44 0.11
7 150.52 0.56 2.00 0.00
8 207.21 0.60 2.00 0.00
9 −− −− −− −−10 (large) −− −− −− −−
Note: The table reports mean values of thin trading, analysts followingand frequency of AIM listing across size deciles for the non-PtP firms(Panel A), management buyouts (Panel B), and private equity backedPtP deals (Panel C). Size is measured by total assets. Variable definitionsare provided in Table 1.