Embed Size (px)
Citation preview

Perception & Psychophysics1999, 61 (3), 445-455
Wheatstone-Panum limiting case:Occlusion, camouflage, and
vergence-induced disparity cues
KOIcm smMONO and WAJAMES TAMCommunications Research Centre, Ottawa, Ontario, Canada
and
sxcnro NAKAMIZOFukuoka University ojEducation, Fukuoka, Japan
We examined effects of binocular occlusion, binocular camouflage, and vergence-induced disparitycues on the perceived depth between two objects when two stimuli are presented to one eye and a single stimulus to the other (Wheatstone-Panum limiting case). The perceived order and magnitude of thedepth were examined in two experimental conditions: (l) The stimulus was presented on the temporal side (occlusion condition) and (2) the nasal side (camouflage condition) of the stimulus pair on oneretina so as to fuse with the single stimulus on the other retina. In both conditions, the separation between the stimulus pair presented to one eye was systematically varied. Experiment 1, with 16 observers, showed that the fused object was seen in front of the nonfused object in the occlusion condition and was seen at the same distance as the nonfused object in the camouflage condition. Theperceived depth between the two objects was constant and did not depend on the separation of thestimulus pair presented to one eye. Experiment 2, with 45 observers, showed that the disparity inducedby vergence mainly determined the perceived depth, and the depth magnitude increased as the separation of the stimulus pair was made wider. The results suggest that (1) occlusion provides depth-orderinformation but not depth-magnitude information, (2) camouflage provides neither depth-order nordepth-magnitude information, and (3) vergence-induced disparity provides both order and magnitudeinformation.
One of the most interesting stimulus configurationsexamined in the field of binocular stereopsis is theWheatstone-Panum limiting case: 1 two images are projected on one retina and a single image on the other retina(Panum, 1858/1940; Wheatstone, 1838). The WheatstonePanum limiting case can give rise to an impression oftwoobjects at different depths and is interesting to researchersbecause, so far, there is no single hypothesis that can adequately account for the percept (Ono, Shimono, & Shibuta,1992). For example, the classical double fusion hypothesis, which states that both images on one retina are fusedwith the single image on the other (Hering, 1865, cited inOno & Mapp, 1995; Ogle, 1962), cannot account for themagnitude and the direction of the perceived depth re-
This research was supported by Grant-in-Aids for Scientific Research (7610068) provided by the Japanese Ministry of Education, Science, and Culture. K. Shimono worked on this study while he was at theCommunications Research Centre, Ottawa, Canada, as a visiting researcher from the Department of Information Engineering and Logistics, Tokyo University of Mercantile Marine. The authors wish to thankAtsuki Higashiyama, two anonymous reviewers, and the editor for theircritical review and helpful comments on an earlier version ofthe manuscript. Correspondence should be addressed to K. Shimono, Department ofinformation Processing Engineering and Logistics, Tokyo University ofMercantile Marine, Ettchujima 2-1-6, Koto-ku, Tokyo, Japan,136 (e-mail: [email protected]).
ported by observers (see, e.g., Gettys & Harker, 1967;Howard & Ohmi, 1992; Ono et al., 1992; Ono & Wade,1985; cf. Gillam, Blackburn, & Cook, 1995).
Aside from the double fusion hypothesis, other hypotheses have been examined in the past, but the resultshave been diverse and inconclusive. For example, Nakayama and Shimojo (1990) examined the hypothesis asserting that the visual system utilizes an occlusion cue in theWheatstone-Panum limiting case and showed that themagnitude and direction ofthe perceived depth were consistent with the occlusion hypothesis. However, Howardand Ohmi (1992), as well as Shimono, Nakamizo, andIda (1994a, 1994b) showed that the occlusion hypothesiscannot account for the magnitude ofperceived depth, although it can account for the direction. Howard and Ohmiprovided results that were consistent with another hypothesis that asserts that the perceived depth in theWheatstone-Panum limiting case is based upon a camouflage cue. Nakayama and Shimojo and Ono et al.(1992), on the other hand, reported data showing that thevisual system does not utilize the camouflage cue. Complicating matters, Howard and Ohmi and Howard andRogers (1995) claimed that misconvergence plays an important role in depth perception in the WheatstonePanum limiting case; however, this vergence-error hypothesis cannot account for the results obtained by Gillam
445 Copyright 1999 Psychonomic Society, Inc.
446 SHIMONO, TAM, AND NAKAMIZO
A. Wide image separation
Far object
B. Narrow image separation
Far object
Depth
Near object
Left Right Left Righteye eye eye eye
0 0 0 o0 0Retinal Single Retinal Singleimage pair retinal image image pair retinal image
Figure 1. Two stimuli along a visual line of the right eye produce a single image in the right eye and twoimages in the left eye. As the magnitude of depth between the two stimuli is increased, the separation ofthe two images in the left eye becomes wider. Ifthe visual system processes information based on this geometrical relationship, according to the occlusion and camouflage hypotheses. the perceived depth wouldbe larger with a wide image separation (A) than with a narrow image separation (B).
et al. (1995). These divergent and sometimes contradictory results suggest that, in the Wheatstone-Parium limiting case, (I) more than one cue is probably responsiblefor sensations of depth and (2) individuals may differ asto which cue they utilize.
In the present study, we used a relatively large numberof observers to examine predictions based on the threehypotheses. Using a large number of observers wouldminimize effects arising from individual differences andwould better delineate the roles ofocclusion, camouflage,and vergence. Thus, in Experiment 1, predictions basedon the binocular occlusion and camouflage hypotheseswere examined using 16 observers. In Experiment 2, aprediction based upon the vergence-error hypothesis wasexamined using 45 observers/
EXPERIMENT 1
The occlusion and camouflage hypotheses are based onthe idea that the Wheatstone-Panum limiting case represents two objects on the visual line of one eye, as depicted in Figure 1. The figure shows how an image pairis formed in one eye (the left, in this case) and how a single image is formed in the other eye (the right). Accordingto both hypotheses, one of the two images in the left eye
fuses with the single image in the right eye; the remainingimage in the left eye has no counterpart in the right eye,and is not fused. Thus, of the two perceived objects, oneis generated from the fusion of-two images, and the otheris generated from an image that is not fused. Furthermore,according to both hypotheses, the perceived depth between the objects should covary with the spatial separation between the images ofthe image pair in the left eye.As illustrated in Figure 1, both hypotheses predict thatthe magnitude of perceived depth will be larger with awide image separation (panel A), than with a narrowimage separation (panel B).
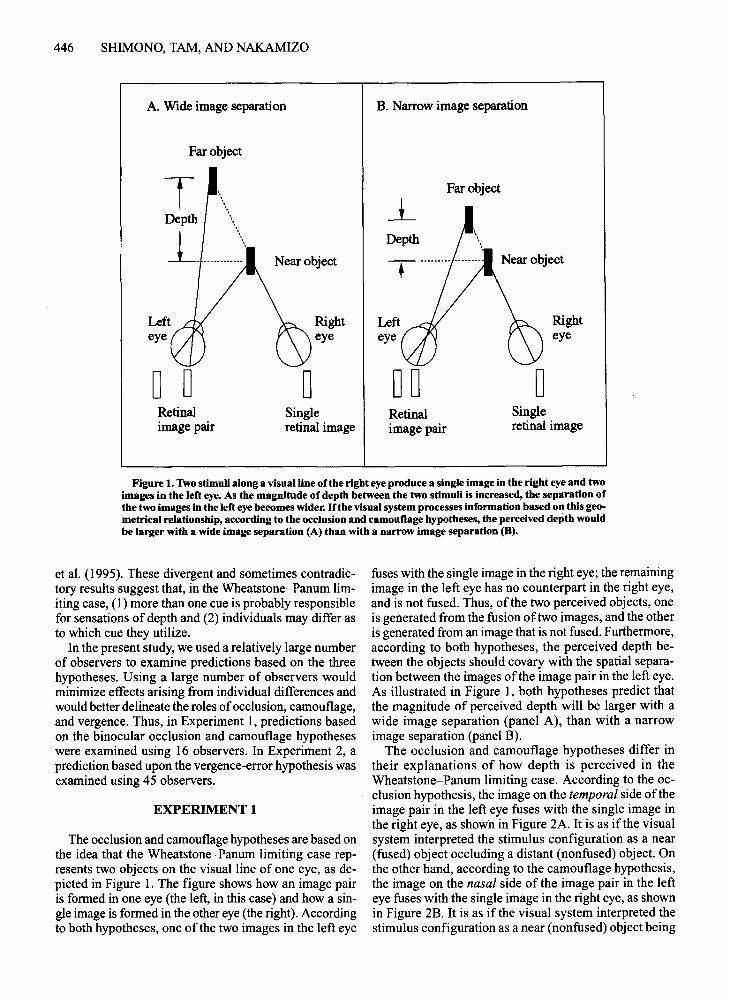
The occlusion and camouflage hypotheses differ intheir explanations of how depth is perceived in theWheatstone-Parium limiting case. According to the occlusion hypothesis, the image on the temporal side oftheimage pair in the left eye fuses with the single image inthe right eye, as shown in Figure 2A. It is as if the visualsystem interpreted the stimulus configuration as a near(fused) object occluding a distant (nonfused) object. Onthe other hand, according to the camouflage hypothesis,the image on the nasal side of the image pair in the lefteye fuses with the single image in the right eye, as shownin Figure 2B. It is as if the visual system interpreted thestimulus configuration as a near (nonfused) object being
OCCLUSION, CAMOUFLAGE., AND VERGENCE-INDUCED DISPARITY 447
A. Occlusion hypothesis B. Camouflage hypothesis
Non-fused object Fused object
~ D, Corresponding images I
Righteye
~ D'- ./Corresponding images
Lefteye
-t
Righteye
Fused object
T
~ _-_...
d
Lefteye
Figure 2. Explanation of how depth is perceived on the basis of the occlusion hypothesis (A) andthe camouflage hypothesis (B). According to the occlusion hypothesis, the image on the temporalside of the two images on one retina is assumed to be fused with the single image on the other retina.According to the camouflage hypothesis, it is the image on the nasal side that is fused. The occlusion hypothesis predicts that the nonfused image will appear behind, whereas the camouflage hypothesis predicts that the nonfused image will appear in front of the fused image. Both hypothesespredict that the magnitude ofthe perceived depth, labeled "d" in the figure, will covary with the separation of the two retinal images, labeled "s" in the figure.
camouflaged by a distant (fused) object. Note that thetwo hypotheses differ in their predictions of whether thefused object will be perceived in front ofor behind the nonfused object; specifically, the occlusion hypothesis predicts that the fused object will appear in front, while thecamouflage hypothesis predicts that the fused object willappear behind.
To examine the two hypotheses and predictions, wemeasured the magnitude and direction ofperceived depthin the Wheatstone-Panum limiting case, while manipulating one ofthe image pair, either on the temporal or thenasal side, so as to fuse with the single image on the otherretina. Position ofthe image pair was manipulated in sucha way that either the temporal or the nasal image wasbrought into binocular correspondence with the singleimage on the other retina. The stimulus configuration withthe temporal image in correspondence will be referred toas the occlusion configuration (Figure 2A), and the stimulus configuration with the nasal image in correspondence will be referred to as the camouflage configuration(Figure 2B).2 It was expected that images on corresponding retinal points would fuse and appear as an object inthe fixation plane. To further increase the likelihood thatthe images on corresponding retinal points would fuse,the images were made larger than the noncorrespondingimage. We expected that by making images on corre-
sponding retinal points larger than that at the noncorresponding point, it would be easier for the visual systemto interpret the corresponding images as coming from anoccluding or camouflaging object (Ono et aI., 1992; Ono& Wade, 1985). Thus, we manipulated both image position and image size to increase the likelihood that occlusion cues would operate in the occlusion configuration andthat camouflage cues would operate in the camouflageconfiguration.
MethodStimuli and Apparatus. Stereoscopic stimuli were generated
by a NEC PC-9801 computer and were displayed on an NEC colormonitor (PC-KD853). The center of the monitor was at eye level,and viewing distance was 100 em. Polarized filters made the lefthalf of the screen visible only to the right eye, and the right halffield visible only to the left eye. Convergence distance was about40 em, with a -1.S-D lens placed in front of each eye to match accommodation to the convergence distance. In addition, a variablediopter prism was positioned in front of the right eye, allowingimage location to be adjusted on the retina.'
The stimuli consisted of 36 test stereograms and 14 referencestereograms. The test stereograms contained the Wheatstone-Panumlimiting case, with half the stereograms in the occlusion configuration, and the other half in the camouflage configuration. The reference stereograms depicted the general case of two objects visibleto both eyes. Estimates of depth obtained with the reference stereograms were used to standardize estimates of perceived depth ob-
448 SHIMONO, TAM, AND NAKAMIZO
I----I~~ 4.4° ......._--
T
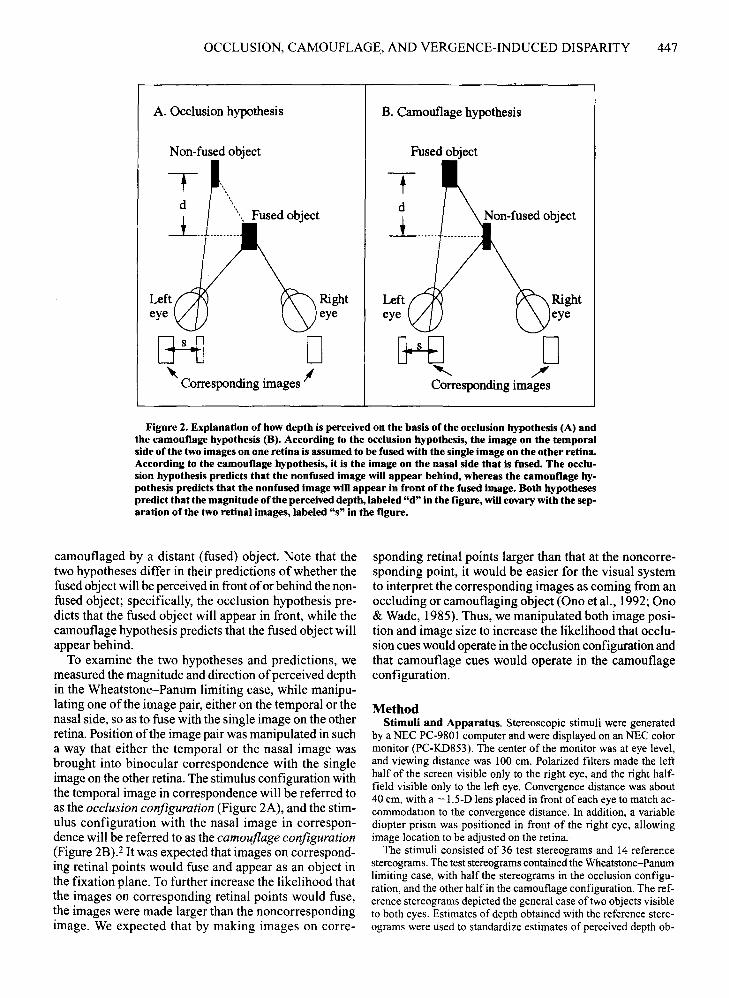
Figure 3. Example of a stereogram used in Experiments 1 and 2 (not drawnto scale).
tained with the test stereograms; a preliminary study showed thatthere can be large individual differences in estimates ofdepth basedon the test stereograms. Details of the test and reference stereograms are provided below.
In the test stereograms, one half-field contained two vertical barsand the other half-field contained one single bar. The height of thebars was fixed at 20.8' of are, and the width ofthe bars was varied.For the single bar in one half-field as well as for its correspondingbar in the other half-field, the width of the bars was 1004',31.2', or52.0' of are, and for the noncorresponding bar in the other halffield, the width ofthe bar was fixed at 5.2' of arc. We will refer tothe stereogram containing the bar width of lOA', 31.2', or 52.0' ofarc as the narrow, intermediate width, or wide bar test stereogram,respectively. In addition to manipulating the width of the bars, thespatial separation between the two bars in a given half-field wasvaried at 1004',20.8', and 31.2' ofarc; these magnitudes ofseparation will be referred to as small, medium, and large, respectively. Ingeneral, there was an equal number of test stereograms for the different combinations of stimulus configuration, bar width, and barseparation, with counterbalancing ofthe pair of bars in the left andright half-fields.
In contrast to the test stereograms, the reference stereogramscontained two vertical bars in both half-fields. The height of thebars was fixed at 20.8' of are, but the width of the bars was varied,depending on the disparity in the stereogram, which could be zero,crossed 20.8' ofare, or uncrossed 20.8' of arc. For a given half-fieldof the stereograms with zero disparity, the width of one of the barswas lOA' of arc and the other bar was 5.2' of arc. Bars in the otherhalf-field were of corresponding widths. For a given half-field ofthe stereograms with nonzero disparity, the width ofone ofthe barswas varied at lOA', 31.2', and 52.0' of are, while the other bar wasfixed at 5.2' of arc. Bars in the other half-field were of corresponding widths. In the stereograms with nonzero disparity, the wider barwas set in the center ofeach half-field, and the narrower bar was positioned left or right ofthe center position. Wewill refer to the stereograms containing bar widths of lOA', 31.2', and 52.0' ofarc as thenarrow, intermediate width, and wide bar reference stereograms, respectively.
Aside from the vertical bars of interest, both half-fields of eachtest and reference stereogram were bounded on the top and bottomby a bandlike pattern, as shown in Figure 3. The bands facilitatedbinocular fusion and helped "lock" convergence. A Nonius line(3.9' X 54.6' ofarc) was placed at the center of the top band in onehalf-field, and at the center of the bottom band in the other halffield. The Nonius lines were used to monitor eye position. Whenthe lines were collinear, it was assumed that convergence was at thedesired position. (For discussions of the Nonius method, see Ogle,Martens, & Dyer, 1967; Shimono, Ono, Saida, & Mapp, 1998.)
Procedure. Observers were asked on each trial (I) to reportwhether or not the two bars appeared in the same frontoparallelplane and, if they did not, which bar appeared closer, and (2) to report the magnitude ofdepth between the two bars in millimeters or
in centimeters.' (Observers sometimes reported seeing double images ofthe wide bar for the reference stereogram. That is, they sawthree bars. These observers were instructed to report the perceiveddepth between the single narrow bar and the two wide bars.) Observers were instructed to respond only when the Nonius lines werealigned. If observers had difficulty adjusting their convergence tomake the Nonius lines collinear, the variable diopter prism in frontof the right eye was adjusted until the lines appeared collinear.
Observers were given two or three blocks of trials as practice.Each block consisted of 14 reference stereograms presented in arandom order. During practice, observers were given feedback as tothe correct direction of depth. Observers who responded correctly,for all 14 stereograms in the last block of trials, were allowed toproceed in the study.
The experiment consisted of two sessions---one with 14 reference stereograms and the other with 36 test stereograms. The presentation order of the reference and test sessions was pseudorandomized. Within each session, the stereograms were presented in arandom order, with one repetition ofeach stereogram. During thesesessions, feedback as to the correct direction ofdepth was not givento observers. For each trial, the stereograms were presented for aslong as observers needed to align the Nonius lines and respond withconfidence. The observers were allowed to take a rest any time duringthe two sessions. The experiment took about an hour to complete.
Observers. Twenty-two university students enrolled in a generalpsychology class volunteered for the experiment. After screeningfor correct responses as to the direction of depth in the referencestereograms, 16 students were allowed to continue in this experiment. The 4 females and 12 males ranged in age from 18 to23 years, and they reported having normal or corrected-to-normalvisual acuity and normal binocular stereopsis.
Results and DiscussionThe basic unit for analysis was the average of the nor
malized depth values, for each experimental conditionand observer. Normalization proceeded as follows. Reported depth values obtained with the test stereogramswere assigned a positive or a negative sign, depending onwhether the nonfused bar was perceived to be behind orin front ofthe fused bar, respectively.Then, the signed values were divided by the reported depth values obtainedwith the reference stereograms. Specifically, positivelysigned values were divided by the reported depth valuesfor reference stereograms with uncrossed disparities,and negatively signed values were divided by the reporteddepth values for reference stereograms with crossed disparities.
We performed a three-way analysis of variance(ANOVA), with repeated measures on the stimulus con-
OCCLUSION, CAMOUFLAGE, AND VERGENCE-INDUCED DISPARITY 449
-pLJ- •• • -~---'--'-j~ .-- ----11.-------·
t=F ....... .... ....~. ..............~ ......-
_ _ _____ •• _. __.~_~ _____• __ ~. ~~ _____ ~ _____• __ ~ _ ~w _~_ ~ ________ ~ __.~__ w w, ________ ~ __• __ ww ~. ______ ~ ___•Occlusion configuration
D Camouflage configuration
Narrow Bar Intermediate Width Bar
j
1
nodepth
nonfused barbebind
nonfused barin front
3020
Wide Bar
10o302010o302010
1.0
0.0
0.5
"8 -0.5>'Q)
~
Bar separation (min of arc)
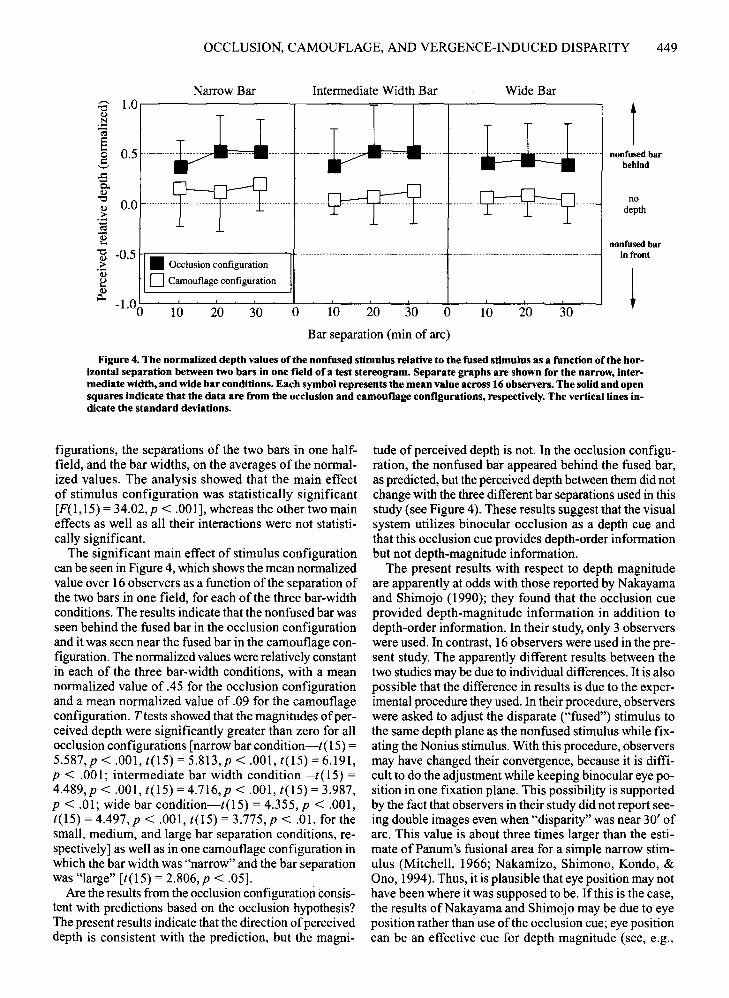
Figure 4. The normalized depth values ofthe nonfused stimulus relative to the fused stimulus as a function ofthe horizontal separation between two ban in one field of a test stereogram. Separate graphs are shown for the narrow, intermediate width, and wide bar conditions. Each symbol represents the mean value across 16 observers, The solid and opensquares indicate that the data are from the occlusion and camouflage configurations, respectively. The vertical lines indicate the standard deviations.
figurations, the separations of the two bars in one halffield, and the bar widths, on the averages ofthe normalized values. The analysis showed that the main effectof stimulus configuration was statistically significant[F(1,15) = 34.02,p < .001], whereas the other two maineffects as well as all their interactions were not statistically significant.
The significant main effect of stimulus configurationcan be seen in Figure 4, which shows the mean normalizedvalue over 16 observers as a function ofthe separation ofthe two bars in one field, for each of the three bar-widthconditions. The results indicate that the nonfused bar wasseen behind the fused bar in the occlusion configurationand it was seen near the fused bar in the camouflage configuration. The normalized values were relatively constantin each of the three bar-width conditions, with a meannormalized value of .45 for the occlusion configurationand a mean normalized value of .09 for the camouflageconfiguration. Ttests showed that the magnitudes ofperceived depth were significantly greater than zero for allocclusion configurations [narrow bar condition-t(15) =
5.587,p < .001, t(15) = 5.813,p < .001, t(15) = 6.191,p < .001; intermediate bar width condition-t( 15) =
4.489,p < .001, t(15) = 4.716,p < .001, t(15) = 3.987,p < .01; wide bar condition-t(15) = 4.355, p < .001,t(15) = 4.497, p < .001, t(15) = 3.775, p < .01, for thesmall, medium, and large bar separation conditions, respectively] as well as in one camouflage configuration inwhich the bar width was "narrow" and the bar separationwas "large" [t(15) = 2.806, p < .05].
Are the results from the occlusion configuration consistent with predictions based on the occlusion hypothesis?The present results indicate that the direction ofperceiveddepth is consistent with the prediction, but the magni-
tude ofperceived depth is not. In the occlusion configuration, the nonfused bar appeared behind the fused bar,as predicted, but the perceived depth between them did notchange with the three different bar separations used in thisstudy (see Figure 4). These results suggest that the visualsystem utilizes binocular occlusion as a depth cue andthat this occlusion cue provides depth-order informationbut not depth-magnitude information.
The present results with respect to depth magnitudeare apparently at odds with those reported by Nakayamaand Shimojo (1990); they found that the occlusion cueprovided depth-magnitude information in addition todepth-order information. In their study, only 3 observerswere used. In contrast, 16 observers were used in the present study. The apparently different results between thetwo studies may be due to individual differences. It is alsopossible that the difference in results is due to the experimental procedure they used. In their procedure, observerswere asked to adjust the disparate ("fused") stimulus tothe same depth plane as the nonfused stimulus while fixating the Nonius stimulus. With this procedure, observersmay have changed their convergence, because it is difficult to do the adjustment while keeping binocular eye position in one fixation plane. This possibility is supportedby the fact that observers in their study did not report seeing double images even when "disparity" was near 30' ofarc. This value is about three times larger than the estimate ofPanum's fusional area for a simple narrow stimulus (Mitchell, 1966; Nakamizo, Shimono, Kondo, &Ono, 1994). Thus, it is plausible that eye position may nothave been where it was supposed to be. If this is the case,the results of Nakayama and Shimojo may be due to eyeposition rather than use of the occlusion cue; eye positioncan be an effective cue for depth magnitude (see, e.g.,

450 SHIMONO, TAM, AND NAKAMIZO
Nonfused stimulus
-:I~~ \
DD~ D~ Retinal images »:"
Figure 5. Explanation of how depth is perceived on the basis ofthe vergence-error hypothesis. The hypothesis asserts that (1) oneof the two images on one retina fuses with the single image on theother retina, with the remaining image having no counterpart tofuse, and (2) the fused stimulus is located in the stimulus planeand the nonfused stimulus is located in the fixation plane. According to the hypothesis, the visual system utilizes the disparitybetween the fused stimulus and the actual fixation point in sucha way that the depth, labeled "d" in the figure, between the twoperceived stimuli wiDcovary with the magnitude ofthe vergenceinduced disparity.
Howard & Rogers, 1995; Kaufman, 1976; Shimono,1993).Weexamined the effect ofeye position on perceiveddepth in the Wheatstone-Panum limiting case in Experiment 2.
Are the results from the camouflage configurationconsistent with predictions based on the camouflage hypothesis? The results indicate that the nonfused bar appeared near the frontoparallel plane in which the fusedbar was located, and that the depth between the two barsdid not change with the three different bar separationsthat were used in this study (see Figure 4). The results arenot consistent with predictions based on the camouflagehypothesis and fail to confirm the results ofHoward andOhmi (1992), who found that binocular camouflage cuesprovide depth-order information. One interpretation ofthepresent results is that manipulation ofthe size ofthe corresponding images was not effective in making the camouflage cue explicit. However, our results are consistentwith those of Nakayama and Shimojo (1990), Ono et al.(1992), and Shimono et al. (1994a, 1994b). Consideredtogether, the results lead us to conclude that binocular camouflage, if at all, is a very weak cue in the WheatstonePanum limiting case.
EXPERIMENT 2
In this experiment, we examined the vergence-errorhypothesis, which states that depth perceived in the
Wheatstone-Panurn limiting case is a result of misconvergence. According to this hypothesis, (I) one ofthe twoimages on one retina fuses with the single image on theother retina, and the remaining image, without a counterpart, is not fused; (2) there is misconvergence of thefused stimulus; (3) the nonfused stimulus appears in thefrontoparallel plane where the eyes are converged; and(4) the fused stimulus appears in depth relative to the fixation plane, as a result of the disparity produced by misconvergence. Figure 5 depicts the case in which there isoverconvergence and the fused stimulus appears in frontof the nonfused stimulus. Not depicted in the figure isthe case of underconvergence, in which the fused stimulus appears behind the nonfused stimulus. The magnitudeof the perceived depth between the fused stimulus andthe nonfused stimulus would be determined by the extentof the vergence error-that is, by the vergence-induceddisparity between the fused stimulus and the "actual" fixation point. (For a more detailed explanation of the hypothesis, see Howard & Rogers, 1995, pp. 519-520; Kauf-man, 1976). .
In the present experiment, we manipulated the magnitude ofthe vergence-induced disparity and measured theperceived depth in the Wbeatstone-Panum limiting case.Vergence-induced disparity was manipulated by systematically varying the location of the fixation plane. Furthermore, we made either the temporal or the nasal imageofthe image pair on one retina the same size as the singleimage on the other retina, expecting that images of thesame size would fuse more readily. (We will refer to thestimulus configurations as the occlusion and the camouflage configurations, respectively.)
MethodStimuli and Apparatus. The apparatus was the same as that
used in-Experiment I. The stimuli consisted of252 test stereogramsand 42 reference stereograms. The test stereograms contained theWheatstone-Panum limiting case with half the stereograms in theocclusion configuration and the other half in the camouflage configuration. As in Experiment I, estimates of depth obtained withthe reference stereograms were used to standardize reports of perceived depth obtained with the test stereograms.
The test stereograms were the same as those in Experiment 1 except that the two wider bars, which are assumed to be fused by observers, had horizontal disparity with respect tothe Nonius lines.When the Nonius lines were aligned, it was assumed that disparitywas induced between the actual fixation point and the "fused" bar.There were seven vergence-induced disparities and three barwidths: narrow, intermediate width, and wide, corresponding to10.4', 31.2', and 52.0' of arc, respectively. The vergence-induceddisparities for the narrow bar test stereograms were 0', 5.2', 7.8',and 10.4' of arc crossed and 5.2', 7.8', and 10.4' of arc uncrossed.Disparities for the intermediate and wide bar test stereograms were0',5.2', 10.4', and 15.6' ofarc crossed and 5.2', 10.4', and 15.6' ofarcuncrossed. (The disparity range used in the narrow bar test stereograms was made smaller than those in the other two test stereograms because in a preliminary study, observers reported doublevision when the disparity was 15.6' of arc.) For each test stereogram, there were also three bar separations: small, medium, andlarge, corresponding to 10.4', 20.8', and 31.2' of arc, respectively.Thus, there was an equal number of test stereograms for the differ-
OCCLUSION, CAMOUFLAGE, AND VERGENCE-INDUCED DISPARITY 451
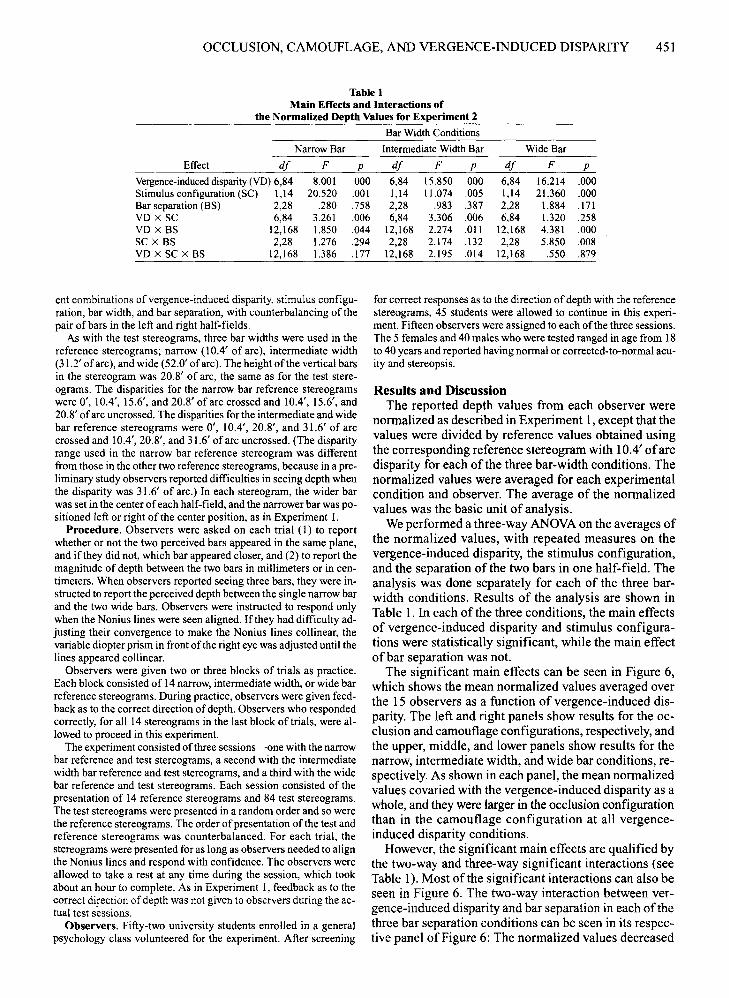
Table 1Main Effects and Interactions of
the Normalized Depth Values for Experiment 2
Bar Width Conditions
Narrow Bar Intermediate Width Bar Wide Bar
Effect df F p df F p df F p
Vergence-induced disparity (VO) 6,84 8.001 .000 6,84 15.850 .000 6,84 16.214 .000Stimulus configuration (SC) 1,14 20.520 .001 1,14 11.074 .005 1,14 21.360 .000Bar separation (BS) 2,28 .280 .758 2,28 .983 .387 2,28 1.884 .171VO x SC 6,84 3.261 .006 6,84 3.306 .006 6,84 1.320 .258VO x BS 12,168 1.850 .044 12,168 2.274 .011 12,168 4.381 .000SC x BS 2,28 1.276 .294 2,28 2.174 .132 2,28 5.850 .008VO X SC x BS 12,168 1.386 .177 12,168 2.195 .014 12,168 .550 .879
ent combinations of vergence-induced disparity, stimulus configuration, bar width, and bar separation, with counterbalancing of thepair of bars in the left and right half-fields.
As with the test stereograms, three bar widths were used in thereference stereograms; narrow (10 A' of arc), intermediate width(31.2' ofarc), and wide (52.0' ofarc). The height ofthe vertical barsin the stereogram was 20.8' of are, the same as for the test stereograms. The disparities for the narrow bar reference stereogramswere 0', lOA', 15.6', and 20.8' of arc crossed and lOA', 15.6', and20.8' of arc uncrossed. The disparities for the intermediate and widebar reference stereograms were 0', lOA', 20.8', and 31.6' of arccrossed and lOA', 20.8', and 31.6' of arc uncrossed. (The disparityrange used in the narrow bar reference stereogram was differentfrom those in the other two reference stereograms, because in a preliminary study observers reported difficulties in seeing depth whenthe disparity was 31.6' of arc.) In each stereogram, the wider barwas set in the center ofeach half-field, and the narrower bar was positioned left or right of the center position, as in Experiment 1.
Procedure. Observers were asked on each trial (1) to reportwhether or not the two perceived bars appeared in the same plane,and ifthey did not, which bar appeared closer, and (2) to report themagnitude of depth between the two bars in millimeters or in centimeters. When observers reported seeing three bars, they were instructed to report the perceived depth between the single narrow barand the two wide bars. Observers were instructed to respond onlywhen the Nonius lines were seen aligned. If they had difficulty adjusting their convergence to make the Nonius lines collinear, thevariable diopter prism in front of the right eye was adjusted until thelines appeared collinear.
Observers were given two or three blocks of trials as practice.Each block consisted of 14 narrow, intermediate width, or wide barreference stereograms. During practice, observers were given feedback as to the correct direction ofdepth. Observers who respondedcorrectly, for all 14 stereograms in the last block of trials, were allowed to proceed in this experiment.
The experiment consisted ofthree sessions-s-ene with the narrowbar reference and test stereograms, a second with the intermediatewidth bar reference and test stereograms, and a third with the widebar reference and test stereograms. Each session consisted of thepresentation of 14 reference stereograms and 84 test stereograms.The test stereograms were presented in a random order and so werethe reference stereograms. The order ofpresentation of the test andreference stereograms was counterbalanced. For each trial, thestereograms were presented for as long as observers needed to alignthe Nonius lines and respond with confidence. The observers wereallowed to take a rest at any time during the session, which tookabout an hour to complete. As in Experiment 1, feedback as to thecorrect direction ofdepth was not given to observers during the actual test sessions.
Observers. Fifty-two university students enrolled in a generalpsychology class volunteered for the experiment. After screening
for correct responses as to the direction ofdepth with the referencestereograms, 45 students were allowed to continue in this experiment. Fifteen observers were assigned to each ofthe three sessions.The 5 females and 40 males who were tested ranged in age from 18to 40 years and reported having normal or corrected-to-normal acuity and stereopsis.
Results and DiscussionThe reported depth values from each observer were
normalized as described in Experiment 1, except that thevalues were divided by reference values obtained usingthe corresponding reference stereogram with 10.4' ofarcdisparity for each of the three bar-width conditions. Thenormalized values were averaged for each experimentalcondition and observer. The average of the normalizedvalues was the basic unit of analysis.
We performed a three-way ANOVA on the averages ofthe normalized values, with repeated measures on thevergence-induced disparity, the stimulus configuration,and the separation ofthe two bars in one half-field. Theanalysis was done separately for each of the three barwidth conditions. Results of the analysis are shown inTable 1. In each of the three conditions, the main effectsof vergence-induced disparity and stimulus configurations were statistically significant, while the main effectof bar separation was not.
The significant main effects can be seen in Figure 6,which shows the mean normalized values averaged overthe 15 observers as a function of vergence-induced disparity. The left and right panels show results for the occlusion and camouflage configurations, respectively, andthe upper, middle, and lower panels show results for thenarrow, intermediate width, and wide bar conditions, respectively. As shown in each panel, the mean normalizedvalues covaried with the vergence-induced disparity as awhole, and they were larger in the occlusion configurationthan in the camouflage configuration at all vergenceinduced disparity conditions.
However, the significant main effects are qualified bythe two-way and three-way significant interactions (seeTable 1). Most of the significant interactions can also beseen in Figure 6. The two-way interaction between vergence-induced disparity and bar separation in each of thethree bar separation conditions can be seen in its respective panel of Figure 6: The normalized values decreased

452 SHIMONO, TAM, AND NAKAMIZO
Narrow Bar
3
2
1
o-1
-2
Occlusion configuration Camouflage configuration_ ••••••• ____ ••••••• ____ ••• v#. _ _ _ _ _ _ ••••••••••• _ •• ---- ........._......... ---_ ........-~.._........ _--
..........~ ......... .........__ ....... _---_ ....... __.__................
......~...., .... '.......... ........ ..... ........ ............. .... -.'.....
0 Smallseparation ........,.. ...... 0 Small separation ............... ,....0 Mediumseparation 0 Mediumseparation
•Large separation •Large separation
tnonfused bar
behind
nodepth
nonfused barin front,
-1 .
o .
nonfused barbehind
nodepth
nonfused barin front,t
tnonfused bar
behind
nodepth
nonfused barin front,
Wide Bar
Intermediate Width Bar
1
_2L..-................................................~................~..........................~................-'-'...............-15-10 -5 0 5 10 15 -15-10 -5 0 5 10 15
Vergence-induced disparity (min of arc)
,--.,"'0~i 3§c:: 2'-'
t 1(l)"'0(l)~ 0 ......... " ...... , ... ' ........~-~ -1 .....................-.'..."'0(l)~
-2'Q:)~
tf3
Figure 6. The normalized depth values ofthe nonfused stimulus relative to the fused stimulus asa function ofthe vergence-induced disparity for the narrow, intermediate width, and wide bar conditions. The left and right panels show the results for the occlusion and camouflage configurations,respectively. Each symbol represents the mean value across 15 observers. The open squares, opencircles, and solid squares indicate the means for small (10.4' of arc), medium (20.8' of arc), and large(31.2' of arc) bar separation conditions, respectively. In the figure, the standard deviations of eachpoint are not shown. The means of the 21 SDs for data in the upper, middle, and lower left panelsare 0.66, 0.95, and 0.94, respectively, and those for data in the upper, middle, and lower right panels are 0.61, 1.57, and 1.31, respectively.
differently among the three bar separation conditionsand this is most evident in the lower panels. The two-wayinteraction between vergence-induced disparity and stimulus configuration in the narrow bar condition can beseen in the top panels: The normalized values decreasedmore rapidly in the camouflage configuration than in theocclusion configuration as a function of the vergence-
induced disparity. The three-way interaction in the intermediate width bar condition can be seen in the middle panels: The normalized values remained relatively constantacross vergence-induced disparities only when the barseparation was "small" in the occlusion configuration. Although the two-way interaction between stimulus configuration and bar separation in the wide bar condition
OCCLUSION, CAMOUFLAGE, AND VERGENCE-INDUCED DISPARITY 453
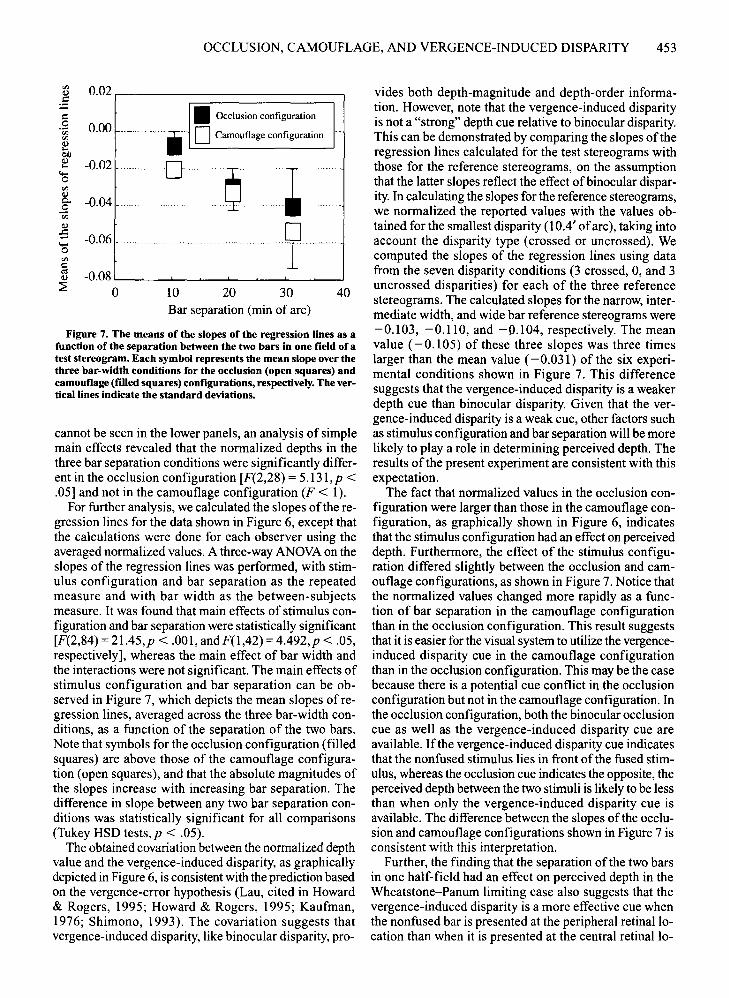
Figure 7. The means of the slopes of the regression lines as afunction of the separation between the two bars in one field of atest stereogram. Each symbol represents the mean slope over thethree bar-width conditions for the occlusion (open squares) andcamouflage (filled squares) configurations, respectively. The vertical lines indicate the standard deviations.
cannot be seen in the lower panels, an analysis of simplemain effects revealed that the normalized depths in thethree bar separation conditions were significantly different in the occlusion configuration [F(2,28) = 5.131, P <.05] and not in the camouflage configuration (F < 1).
For further analysis, we calculated the slopes ofthe regression lines for the data shown in Figure 6, except thatthe calculations were done for each observer using theaveraged normalized values. A three-way ANOVA on theslopes of the regression lines was performed, with stimulus configuration and bar separation as the repeatedmeasure and with bar width as the between-subjectsmeasure. It was found that main effects of stimulus configuration and bar separation were statistically significant[F(2,84)= 21.45,p < .001, andF(l,42) = 4.492,p < .05,respectively], whereas the main effect of bar width andthe interactions were not significant. The main effects ofstimulus configuration and bar separation can be observed in Figure 7, which depicts the mean slopes of regression lines, averaged across the three bar-width conditions, as a function of the separation of the two bars.Note that symbols for the occlusion configuration (filledsquares) are above those of the camouflage configuration (open squares), and that the absolute magnitudes ofthe slopes increase with increasing bar separation. Thedifference in slope between any two bar separation conditions was statistically significant for all comparisons(Tukey HSD tests, p < .05).
The obtained covariation between the normalized depthvalue and the vergence-induced disparity, as graphicallydepicted in Figure 6, is consistent with the prediction basedon the vergence-error hypothesis (Lau, cited in Howard& Rogers, 1995; Howard & Rogers, 1995; Kaufman,1976; Shimono, 1993). The covariation suggests thatvergence-induced disparity, like binocular disparity, pro-
vides both depth-magnitude and depth-order information. However, note that the vergence-induced disparityis not a "strong" depth cue relative to binocular disparity.This can be demonstrated by comparing the slopes of theregression lines calculated for the test stereograms withthose for the reference stereograms, on the assumptionthat the latter slopes reflect the effect ofbinocular disparity. In calculating the slopes for the reference stereograms,we normalized the reported values with the values obtained for the smallest disparity (10.4' ofarc), taking intoaccount the disparity type (crossed or uncrossed). Wecomputed the slopes of the regression lines using datafrom the seven disparity conditions (3 crossed, 0, and 3uncrossed disparities) for each of the three referencestereograms. The calculated slopes for the narrow, intermediate width, and wide bar reference stereograms were-0.103, -0.110, and -0.104, respectively. The meanvalue (-0.105) of these three slopes was three timeslarger than the mean value (-0.031) of the six experimental conditions shown in Figure 7. This differencesuggests that the vergence-induced disparity is a weakerdepth cue than binocular disparity. Given that the vergence-induced disparity is a weak cue, other factors suchas stimulus configuration and bar separation will be morelikely to playa role in determining perceived depth. Theresults of the present experiment are consistent with thisexpectation.
The fact that normalized values in the occlusion configuration were larger than those in the camouflage configuration, as graphically shown in Figure 6, indicatesthat the stimulus configuration had an effect on perceiveddepth. Furthermore, the effect of the stimulus configuration differed slightly between the occlusion and camouflage configurations, as shown in Figure 7. Notice thatthe normalized values changed more rapidly as a function of bar separation in the camouflage configurationthan in the occlusion configuration. This result suggeststhat it is easier for the visual system to utilize the vergenceinduced disparity cue in the camouflage configurationthan in the occlusion configuration. This may be the casebecause there is a potential cue conflict in the occlusionconfiguration but not in the camouflage configuration. Inthe occlusion configuration, both the binocular occlusioncue as well as the vergence-induced disparity cue areavailable. Ifthe vergence-induced disparity cue indicatesthat the non fused stimulus lies in front of the fused stimulus, whereas the occlusion cue indicates the opposite, theperceived depth between the two stimuli is likely to be lessthan when only the vergence-induced disparity cue isavailable. The difference between the slopes of the occlusion and camouflage configurations shown in Figure 7 isconsistent with this interpretation.
Further, the finding that the separation of the two barsin one half-field had an effect on perceived depth in theWheatstone-Panum limiting case also suggests that thevergence-induced disparity is a more effective cue whenthe nonfused bar is presented at the peripheral retinal 10cation than when it is presented at the central retinal 10-
4010 20 30Bar separation (min of arc)
•Occlusion configuration
--_··------·--i" DCamouflage configuration 1"-
·' __h_"
~O--Q-l--""-
- ......... -.........-.......-.... .....- .... ...~ .. .........
0.02
0.00
-0.02
-0.06
-0.08o
ell
~I::.9ellell
~~
'0ell
} -0.04ell
.s.....o

454 SHIMONO, TAM, AND NAKAMIZO
cation. In this study, the nonfused bar was presented at amore peripheral retinal location as the separation of thetwo bars in one field ofa test stereogram was increased.For a given magnitude ofvergence-induced disparity, themagnitude of the perceived depth between the fused andthe nonfused stimuli increased as the separation of thetwo bars was increased. However, when the vergenceinduced disparity was zero, the retinal location had noeffect on perceived depth. A one-way ANOVA showedthat the normalized depths were not statistically significantly different among the three bar separations in all experimental conditions in which the vergence-induceddisparity was zero. Thus, the results suggest that perceiveddepth in the Wheatstone-Parium limiting case dependson the retinal location of the nonfused stimulus whenvergence-induced disparity is present.
GENERAL DISCUSSION
The results of the present study show that stimulusconfiguration, vergence-induced disparity, and the magnitude of separation between two images on one retinaare factors that can contribute to perceived depth in theWheatstone-Panum limiting case. Experiments 1 and 2showed that perceived depth depends on whether thetemporal or nasal side of the two images is presented soas to fuse with the single image on the other retina. Experiment 2 showed that perceived depth covaries with thevergence-induced disparity. Furthermore, Experiment 2showed that the separation between the two images can influence perceived depth when vergence-induced disparityis present. The fact that perceived depth in WheatstonePanum limiting case can be influenced by more than onefactor suggests that the visual system may be utilizingseveral depth cues to "see" depth in the WheatstonePanum limiting case.
Although the present results demonstrate that vergence error can playa role in the depth perceived in theWheatstone-Panum limiting case, the results were obtained using a fixation stimulus to induce the error.When such a fixation stimulus is not present, how mightan error in vergence be induced? One possible explanation of how vergence error might be induced in theWheatstone-Panum limiting case was proposed byKaufman (cited in Arditi, 1986). Kaufman suggestedthat "the presence of an adjacent element will tend tocause slight over- or underconvergence due to the eyes'attempt to bring both elements into foveal registration"(Arditi, 1986, pp. 23.21-23.22). Because ofthis tendency,the eye presented with the two elements will turn andfixation will be directed to an intermediate position between the two elements, leading to misconvergence. According to the vergence-error hypothesis, the misconvergence will produce relative depth between the twoperceived elements. This explanation is consistent withreports in the literature that the perceived depth covaries
with the separation of the two elements in one eye wheneye position is not controlled (e.g., Gettys & Harker, 1967).
Another interesting finding in this study is that thebinocular occlusion cue provides depth-order information but not depth-magnitude information. This findingis interesting because it suggests that the localization ofthe nonfused area "occurs after stereopsis" for a randomdot stereogram (Julesz, 1971, p. 260). Typically, oftwoperceived planes in a random-dot stereogram, the nonfusedarea appears in the depth plane that is farther away (see,e.g., Julesz, 1971). In other words, the nonfused area appears to be localized in the plane with the greater depthas if it has been "captured" by that plane. If it is the casethat the nonfused area provides only depth-order information, as our results suggest, this area might be expectedto be localized in a fixed depth plane irrespective of thedisparity of the depth planes depicted in the stereogram.However, this is not the case; the nonfused area alwaysappears at the depth plane that is farther away, irrespective of its distance from the observer. To explain this localization, we may have to assume a process that locatesthe nonfused area in the same plane as the farther one.This process must occur after the visual system has processed the disparity of the stereogram and "calculated"the depth between the two perceived depth planes (seeShimojo & Nakayama, 1990).
Finally, the present results may have theoretical implications. It is usually assumed that small changes invergence eye position do not playa role in perceived depthbetween two stimuli with relative disparity, because vergence does not change the magnitude of the relative disparity (Collewijn & Erkelens, 1990; Howard & Rogers,1995). This assumption may be valid in the case of smallrelative disparity. However, it is not known whether thisassumption still holds when the relative disparity is largeand double images are perceived. If the double imagesare treated by the visual system as though they were nonfused stimuli in the Wheatstone-Panum limiting case,the perceived depth between the fused stimulus and thetwo nonfused stimuli may. depend on the magnitude ofthe vergence-induced disparity (Lau, cited in Howard &Rogers, 1995; Kaufman, 1976). Ifthis is the case, "stereopsis" with large relative disparity may arise fromvergence-induced disparity. This view is consistent withseveral findings (Krol & van de Grind, 1986; O'Shea &Blake, 1987; Tam & Ono, 1987). O'Shea and Blakefound that the direction of the perceived depth observedin random-dot stereograms with large disparities depends on the direction of misconvergence. In addition,Krol and van de Grind (1986) and Tam and Ono (1987)reported that when there is no misconvergence, there iszero perceived depth with line stereograms containinglarge disparities or "binocular depth mixture" stimuli(Foley, 1976). These studies suggest that the misconvergence plays an important role in stereopsis with largedisparity.

OCCLUSION, CAMOUFLAGE, AND VERGENCE-INDUCED DISPARITY 455
REFERENCES
ARDITI, A. (1986). Binocular vision. In K. R. Boff, L. Kaufman, & J. P.Thomas (Eds.), Handbook ofperception and human performance:Vol. i. Sensory processes and perception (pp. 23.1-23.41). New York:Wiley.
COLLEWlJN, H., & ERKELENS, C. (1990). Binocular eye movements andthe perception of depth. In E. Kowler (Ed.), Reviews ofoculomotorresearch: Vol. 4. Eye movements and their role in visual and cognitive processes (pp. 213-261). Amsterdam: Elsevier.
FOLEY, J. M. (1976). Binocular depth mixture. Vision Research, 16,1263-1267.
FOLEY, J. M., & RICHARDS, W. (1972). Effects of voluntary eye movement and convergence on the binocular appreciation of depth. Perception & Psychophysics, 11,423-427.
GETTYS, C. E, & HARKER, G. S. (1967). Some observations and measurements ofthe Panum phenomenon. Perception & Psychophysics,2,387-395.
GILLAM, B., BLACKBURN, S., & COOK, M. (1995). Panum's limitingcase: Double fusion, convergence error, or "da Vinci stereopsis." Perception, 24, 333-346.
HOWARD, I. P., & OHMI, M. (1992). A new interpretation of the role ofdichoptic occlusion in stereopsis [Arvo Abstracts]. investigativeOphthalmology & Visual Science, 33, 1370.
HOWARD, I. P., & ROGERS, B. (1995). Binocular vision and stereopsis.New York: Oxford University Press.
JULESZ, B. (1971). Foundations ofcyclopean perception. Chicago: University of Chicago Press.
KAUFMAN, L. (1976). On stereopsis with double images. Psychologia,19,224-233.
KROL, J. D. (1982). Perceptual ghost in stereopsis: A ghostly problemin binocular vision. Amsterdam: Rodopi.
KRoL,1. D., & VAN DE GRIND, W. A. (1986). Binocular depth mixture:An artefact of eye vergence? Vision Research, 26, 1289-1298.
MITCHELL, D. E. (1966). A review ofthe concept of"Panurn's fusionalareas." American Journal ofOptometry & Archives ofthe AmericanAcademy ofOptometry, 43, 387-401.
NAKAMIZO, S., SHIMONO, K., KONDO. M., & ONO,H. (1994). Visual directions of two stimuli in Panum's limiting case. Perception, 23,1037-1048.
NAKAYAMA, K., & SHIMOJO, S. (1990). Da Vinci stereopsis: Depth andsubjective occluding contours from unpaired image points. VisionResearch, 30, 1811-1825.
OGLE, K. N. (1962). The optical space sense. In H. Davson (Ed.), Theeye (Vo!. 4, pp. 374-375). New York: Academic Press.
OGLE, K. N., MARTENS, T. G., & DYER, J. A. (1967). Oculomotor imbalance in binocular vision and fixation disparity. Philadelphia: Lea& Febiger.
ONO, H., & MAPP, A. P. (1995). A restatement and modification ofWells-Hering's law of visual direction. Perception, 24, 237-252.
ONO,H., SHIMONO, K., & SHIBUTA, K. (1992). Occlusion as a depth cuein the Wheatstone-Parium limiting case. Perception & Psychophysics,51,3-13.
ONO, H., & WADE, N. (1985). Resolving discrepant results of theWheatstone experiment. Psychological Research, 47,135-142.
O'SHEA,R. P., & BLAKE, R. (1987). Depth without disparity in randomdot stereograms. Perception & Psychophysics, 42, 205-214.
PANUM, P. L. (1940). Physiological investigations concerning vision
with two eyes (C. Hubscher, Trans.). Hanover, NH: Dartmouth EyeInstitute. (Original work published 1858)
RICHARDS, W. (1971). Anomalous stereoscopic depth perception. Journal ofthe Optical Society ofAmerica, 61, 410-414.
SHIMOJO, S., & NAKAYAMA, K. (1990). Real world occlusion constraintsand binocular rivalry. Vision Research, 30, 69-80.
SHiMONO, K. (1993). Fukuso-undo to ryogansutereopusisu [Effects ofvergence movements on binocular stereopsis). Japanese Journal ofOptics, 23, 17-22.
SHIMONO, K., NAKAMIZO, S., & IDA, T. (1994a). Occlusion providesdepth-order information but camouflage does not in the WheatstonePanum limiting case. Perception, 23 (Supp!.), 39.
SHIMONO, K., NAKAMIZO, S., & IDA, T. (1994b). Wheatstone-Panumlimiting case niokeru okuyukihoukou to ryou no chikaku [The magnitude and direction of perceived depth in the Wheatstone-Panumlimiting case]. Vision, 6, 107-110.
SHIMONO, K., ONO,H., SAIDA, S., & MAPP, A. (1998). Methodologicalcaveats for monitoring binocular eye position with Nonius stimuli.Vision Research, 38,591-600.
TAM, W. J., & ONO, H. (1987). Zero horizontal disparity in binoculardepth mixture stimuli. Vision Research, 27, 1207-1210.
WHEATSTONE, C. (1838). Contributions to the physiology of vision:Part the first. On some remarkable, and hitherto unobserved, phenomena ofbinocular vision. Philosophical Transactions ofthe RoyalSociety, 128, 371-394.
NOTES
I. We use this term to refer to the stimulus arrangement used byWheatstone (1838) and by Panum (1858/1940). In Wheatstone's stereogram (1838, his Figure 23), different-sized images were used; a thinvertical line intersecting a thick inclined line were presented on oneretina and a thick vertical line on the other. On the other hand, inPanum's stereogram (1858/1940, his Figure 53), equal-sized imageswere used; two vertical lines were presented on one retina and a singlevertical line on the other. The important elements of the configurationare that two stimuli are projected onto one retina and a single stimulusis projected onto the other. Our use of the term is consistent with its useby others (e.g., Arditi, 1986; Howard & Ohmi, 1992; Howard & Rogers,1995; Krol, 1982). For a more detailed discussion of what constitutesthe Wheatstone-Panum limiting case, refer to Ono, Shimono, andShibuta (1992).
2. Note that stimulus arrangements of the stimuli in the occlusion andcamouflage configurations here are the same as those labeled as locationdefined and location-not-defined conditions, respectively, in Experiment I of Ono et al, (1992).
3. Pilot studies indicated that the present method provides a usefuland robust index ofperceived depth. Results from the pilot studies confirmed that, although there were large individual differences in terms ofthe absolute values, magnitude of depth estimated by each individualcovaried linearly with the range of binocular disparities that were usedin our experiments. The observed linear function ofperceived depth isconsistent with that seen in the results obtained with the matchingmethod (e.g., Richards, 1971) and with the ratio judgment method (e.g.,Foley & Richards, 1972).
(Manuscript received October 13,1997;revision accepted for publication February 24, 1998.)