Embed Size (px)
Citation preview
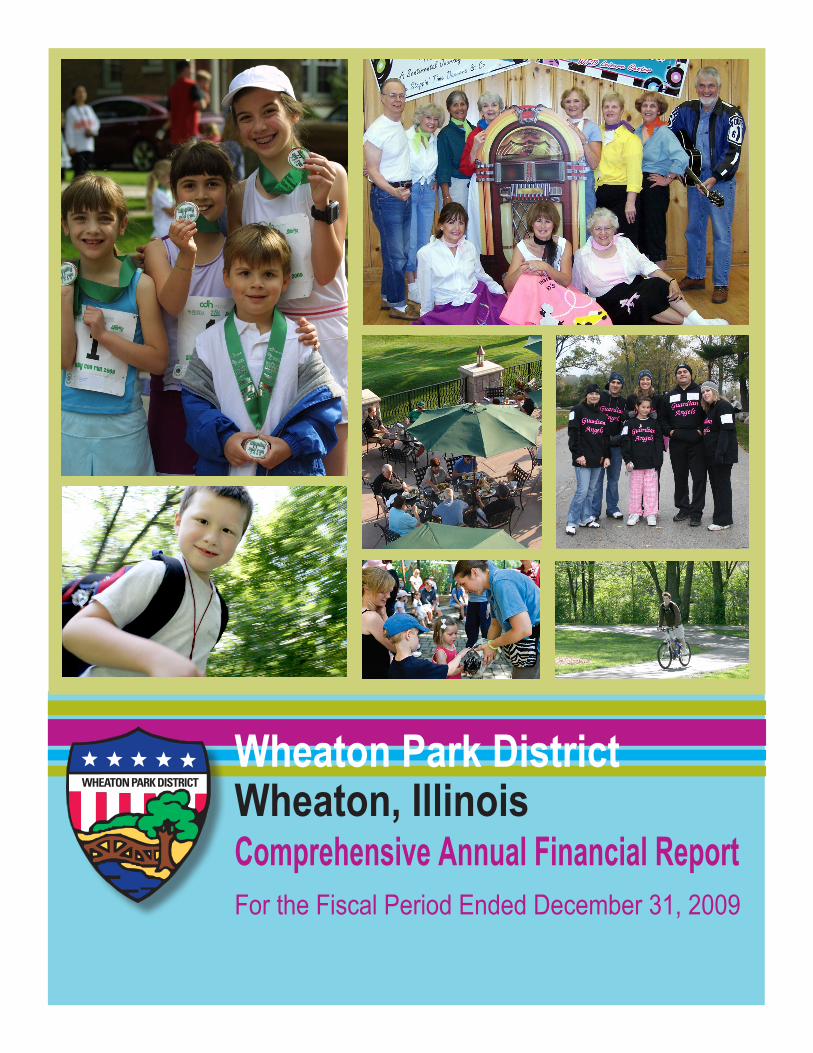
Wheaton Park District Wheaton, IllinoisComprehensive Annual Financial ReportFor the Fiscal Period Ended December 31, 2009
WHEATON PARK DISTRICTWHEATON, ILLINOIS
COMPREHENSIVE ANNUALFINANCIAL REPORT
For the Year EndedDecember 31, 2009
Prepared by
Rita A. TrainorFinance Director
Tricia DubielAssistant Finance Director
WHEATON PARK DISTRICTWHEATON, ILLINOISTABLE OF CONTENTS
Page(s)
INTRODUCTORY SECTION
Principal Officials................................................................................................................ i
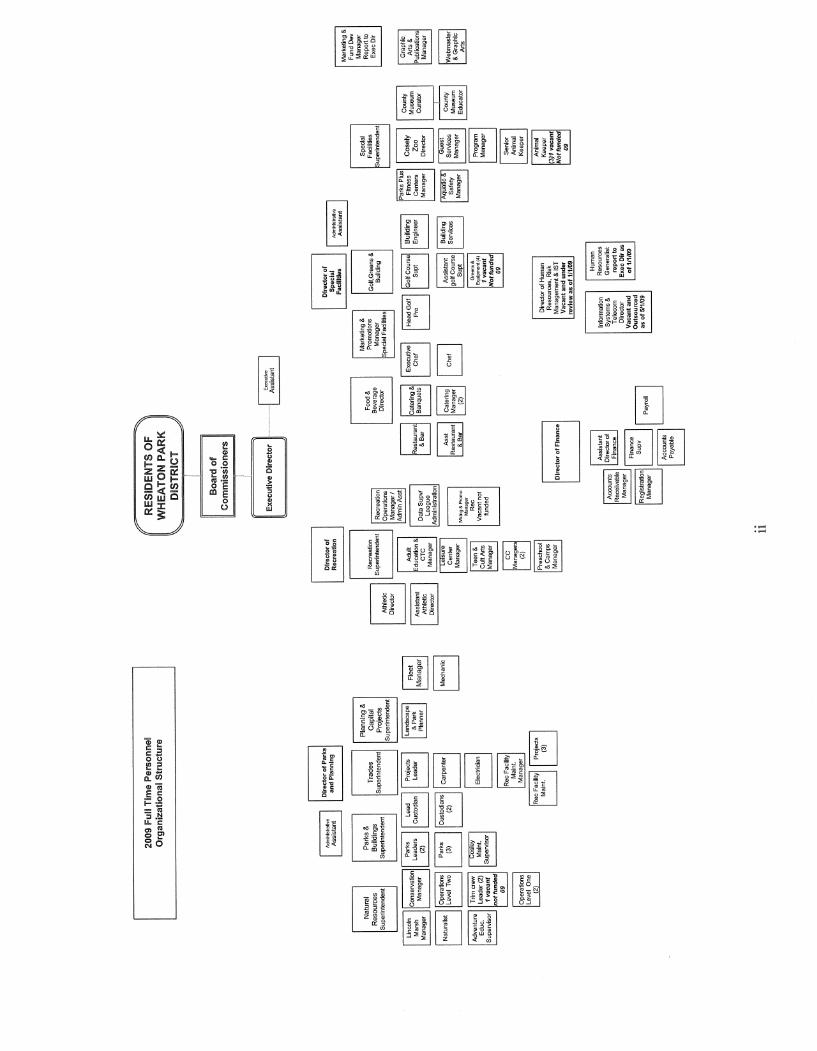
Organization Chart ............................................................................................................. ii
Certificate of Achievement for Excellence in Financial Reporting...................................... iii
Letter of Transmittal........................................................................................................... iv-viii
FINANCIAL SECTION
INDEPENDENT AUDITOR’S REPORT ........................................................................ 1-2
GENERAL PURPOSE EXTERNAL FINANCIAL STATEMENTS
Management’s Discussion and Analysis ........................................................................ MD&A 1-9
Basic Financial Statements
Government-Wide Financial Statements
Statement of Net Assets ...................................................................................... 3
Statement of Activities ........................................................................................ 4-5
Fund Financial Statements
Governmental Funds
Balance Sheet ................................................................................................. 6-7
Reconciliation of Fund Balances of Governmental Funds to the Governmental Activities in the Statement of Net Assets .............................. 8
Statement of Revenues, Expenditures and Changes in Fund Balances ........... 9-10
Reconciliation of the Governmental Funds Statement of Revenues, Expenditures and Changes in Fund Balances to the Governmental Activities in the Statement of Activities........................................................ 11
WHEATON PARK DISTRICTWHEATON, ILLINOISTABLE OF CONTENTS (Continued)
Page(s)
FINANCIAL SECTION (Continued)
GENERAL PURPOSE EXTERNAL FINANCIAL STATEMENTS (Continued)
Basic Financial Statements (Continued)
Fund Financial Statements (Continued)
Proprietary Funds
Statement of Net Assets ................................................................................. 12Statement of Revenues, Expenses and Changes in Net Assets....................... 13Statement of Cash Flows................................................................................ 14-15
Notes to Financial Statements .................................................................................. 16-40
Required Supplementary Information
Schedule of Revenues, Expenditures and Changes in Fund Balance - Budget and Actual
General (Corporate) Fund ................................................................................... 41Recreation Fund .................................................................................................. 42Cosley Zoo Fund................................................................................................. 43
Schedule of Funding ProgressIllinois Municipal Retirement Fund...................................................................... 44
Schedule of Employer ContributionsIllinois Municipal Retirement Fund...................................................................... 45
Notes to Required Supplementary Information................................................ 46
COMBINING AND INDIVIDUAL FUND FINANCIAL STATEMENTS AND SCHEDULES
MAJOR GOVERNMENTAL FUNDS
Schedule of Detailed Expenditures - Budget and ActualGeneral (Corporate) Fund ................................................................................... 47-49
Detailed Schedule of Revenues, Expenditures and Changes in Fund Balance - Budget and Actual
Recreation Fund .................................................................................................. 50-53Cosley Zoo Fund................................................................................................. 54-56
Schedule of Revenues, Expenditures and Changes in Fund Balance - Budget and Actual
Debt Service Fund............................................................................................... 57Capital Projects Fund .......................................................................................... 58-59
WHEATON PARK DISTRICTWHEATON, ILLINOISTABLE OF CONTENTS (Continued)
Page(s)
FINANCIAL SECTION (Continued)
COMBINING AND INDIVIDUAL FUND FINANCIAL STATEMENTS AND SCHEDULES (Continued)
NONMAJOR GOVERNMENTAL FUNDS
Combining Balance Sheet......................................................................................... 60Combining Statement of Revenues, Expenditures and Changes in Fund Balances............................................................................. 61
Schedule of Revenues, Expenditures and Changes in Fund Balance - Budget and Actual
Liability Insurance Fund ...................................................................................... 62Retirement Fund.................................................................................................. 63Audit Fund .......................................................................................................... 64Special Recreation Fund...................................................................................... 65Paving and Lighting Fund.................................................................................... 66
MAJOR ENTERPRISE FUND
Golf Course FundSchedule of Revenues, Expenses and Changes inNet Assets - Budget and Actual ........................................................................ 67-68
Schedule of Detailed Expenses - Budget and Actual........................................... 69-72
INTERNAL SERVICE FUNDS
Combining Statement of Net Assets......................................................................... 73Combining Statement of Revenues, Expenses and Changes in Net Assets .............................................................................................................. 74Combining Statement of Cash Flows ....................................................................... 75Schedule of Revenues, Expenses and Changes in Net Assets - Budget and Actual
Information Systems and Telecommunications Fund .......................................... 76Health Insurance Fund......................................................................................... 77
OTHER SUPPLEMENTARY INFORMATION
Schedule of General Obligation Refunding Park Bonds and Interest Payable - Series 2005 ..................................................................................... 78Schedule of General Obligation Park Bonds and Interest Payable - Series 2005A............................................................................................................... 79
WHEATON PARK DISTRICTWHEATON, ILLINOISTABLE OF CONTENTS (Continued)
Page(s)
FINANCIAL SECTION (Continued)
OTHER SUPPLEMENTARY INFORMATION (Continued)
Schedule of General Obligation Refunding Park Bonds and Interest Payable - Series 2005B................................................................................... 80Schedule of General Obligation Refunding Park Bonds and Interest Payable - Series 2005C................................................................................... 81Schedule of General Obligation Limited Park Bonds and Interest Payable - Series 2009 ..................................................................................... 82
STATISTICAL SECTION
Financial TrendsNet Assets by Component................................................................................................. 83-84Change in Net Assets ........................................................................................................ 85-88Fund Balances of Governmental Funds............................................................................. 89-90Changes in Fund Balances of Governmental Funds .......................................................... 91-92
Revenue CapacityAssessed Value and Actual Value of Taxable Property..................................................... 93Property Tax Rates - Direct and Overlapping Governments............................................. 94Principal Property Taxpayers ............................................................................................ 95Property Tax Levies and Collections................................................................................. 96
Debt CapacityRatios of Outstanding Debt by Type................................................................................. 97Direct and Overlapping Governmental Activities Debt ..................................................... 98Computation of Legal Debt Margin.................................................................................. 99
Demographic and Economic InformationDemographic and Economic Information - Last Ten Fiscal Years.................................... 100Principal Employers - Current Year and Nine Years Ago................................................. 101
Operating InformationFull-Time Equivalent Employees ...................................................................................... 102Operating Indicators.......................................................................................................... 103Capital Asset Statistics ...................................................................................................... 104
INTRODUCTORY SECTION
i
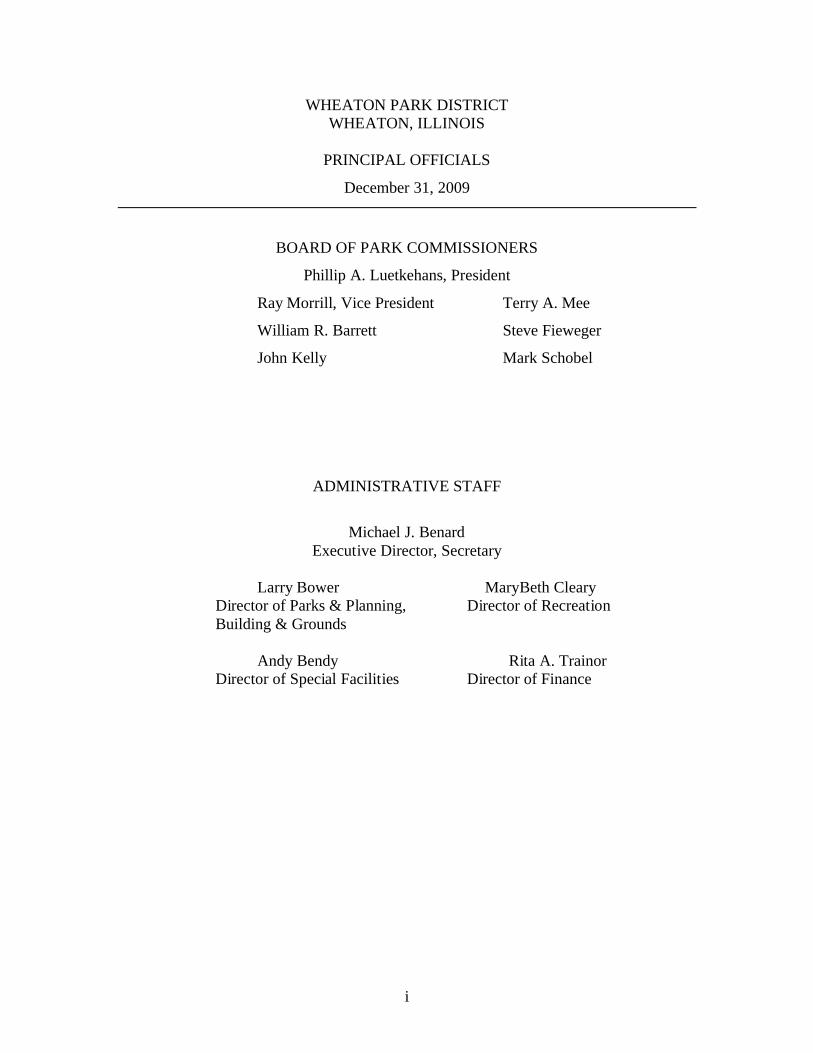
WHEATON PARK DISTRICTWHEATON, ILLINOIS
PRINCIPAL OFFICIALS
December 31, 2009
BOARD OF PARK COMMISSIONERS
Phillip A. Luetkehans, President
Ray Morrill, Vice President Terry A. Mee
William R. Barrett Steve Fieweger
John Kelly Mark Schobel
ADMINISTRATIVE STAFF
Michael J. BenardExecutive Director, Secretary
Larry Bower MaryBeth ClearyDirector of Parks & Planning, Director of RecreationBuilding & Grounds
Andy Bendy Rita A. TrainorDirector of Special Facilities Director of Finance
v
The Reporting Entity and its Services The Park District, incorporated in 1921, operates under a Board-Director form of government and provides recreational services and opportunities to the residents of the District. Services which are provided include recreation programs, recreation facilities, park management, capital development, and general administration. Active and passive parks owned or leased by the District include fifty-four (54) sites totaling nearly 900 acres. Recreational facilities owned and operated by the District include Rice Pool and Water Park, Community Center, Parks Plus Fitness Center, Northside Park Family Aquatic Center, Arrowhead Golf Club, Lincoln Marsh Natural Area and Teams Course, Memorial Park Leisure Center, Clock-tower Commons Mini Golf Course and Skate Park, Cosley Zoo, the DuPage County Historical Museum and numerous softball/baseball diamonds, football / soccer / lacrosse fields, tennis courts, playgrounds and picnic areas. The District includes all agencies, departments and organizations of its governmental operations that are controlled by or dependent upon the District as determined on a basis of financial accountability. There are no other organizations for which we have financial accountability. The District, however, participates as a member in the Illinois Municipal Retirement Fund (IMRF), the Western DuPage Special Recreation Association (WDSRA), and the Park District Risk Management Agency (PDRMA). These organizations are considered separate governmental units because they are organized entities, have governmental character and are substantially autonomous. Audited financial statements for these organizations are not included in this report. However, such statements are available upon request from their respective business offices. Also, the District is closely affiliated with the Cosley Foundation, a 501C-3 Illinois not for profit organization which exists to raise funds to support capital development and operations of the Cosley Zoo. This organization is a discretely presented component unit in this report. Economic Condition and Outlook The Wheaton Park District is located in DuPage County and is approximately 30 miles west of downtown Chicago. The District serves most of the City of Wheaton, and small portions of Glen Ellyn, Carol Stream, Winfield, and Lisle. The population of the District is estimated to be approximately 55,000. In nearly nine decades of service, the Wheaton Park District continues to grow in facilities, programs, and importance to the lives of its residents. The District continues to experience slowed growth in both residential and commercial development. Assessed valuations of $2.487 billion represent an increase of 0.2% over last year. There continues to be an interest in residential and commercial development within the southern portion of the Park District boundary and also in residential areas willing to annex. The Wheaton Park District continues to strive to monitor social, economic, and population changes and to alter programs and services to meet the needs of its residents.
vi
Significant Events and Accomplishments Cooperative efforts with local service organizations, the private sector, the City of Wheaton, School District 200, the County of DuPage and the DuPage County Forest Preserve District have continued to be a top priority for the Wheaton Park District. This commitment to local and regional partnership has made the Wheaton Park District a recognized industry leader. Previous Agency accomplishments have included the National Gold Medal Award for Excellence in Park and Recreation Management (2005, 1996, 1990 and 1984), the National Recreation and Park Association Excellence in Aquatics Award (1992) for Rice Pool and Water Park, and the U.S. Department of Interior Innovation Award (1993) for the Lincoln Marsh Wetlands Project. In 2008, the District was honored to receive State-wide recognition from the Illinois Park and Recreation Association (IPRA) with the Outstanding Program Award for Cosley Zoo’s “A Day at the Races.” The following year (2009), the IPRA recognized two DuPage County Historical Museum Docents as “Volunteers of the Year.” Local recognition was also earned in 2009 when The Wheaton Chamber of Commerce recognized the Arrowhead Golf Club with the “Restaurant of the Year” Award, and the Wheaton Park District Marketing Department with the “Outstanding Printed Piece” Award. The Chamber of Commerce also recognized Park Board Vice President, Ray Morrill as the Citizen of the Year and five staff members as outstanding young professionals. Financial Management and Control The management of the District is responsible for establishing and maintaining internal controls designed to ensure that the assets of the District are protected from loss, theft, or misuse and to ensure that adequate accounting data is properly recorded to allow for the preparation of financial statements in conformity with accounting principles generally accepted in the United States of America. The internal control structure is designed to provide reasonable, but not absolute, assurance that these objectives are met. The concept of reasonable assurance recognizes that: (1) the cost of a control should not exceed the benefits likely to be derived; and (2) the valuation of costs and benefits requires estimates and judgments by management. All internal control evaluations occur within this framework. Internal control practices are also integrated into the budgetary management of the District's funds. A budget is prepared for each fund; control is provided by verification of appropriation amounts prior to expenditures, as well as a monthly review of actual account totals compared to budget. Additional control is established through published policies and procedures for all aspects of accounting practices of the Park District which includes the recording of receipts and disbursements of funds entrusted to the District. To ensure sound financial management, proper accounting practices, internal controls, and budgetary planning are affirmed by the continual review of the Board of Commissioners.

vii
The basis of accounting and the funds utilized by the District are fully described in Note 1 of the financial statements. Additional information on the District’s budgetary accounting can also be found in the Notes to Required Supplementary Information. As part of this model, management is responsible for preparing a Management’s Discussion and Analysis of the District. This discussion is located in the basic financial statements, providing an assessment of District finances for fiscal year 2009, with comparisons to fiscal period 2008. Effective April 1, 2008, the District changed its fiscal year from April 1 to January 1. This change will cause the fiscal periods presented in this year to be somewhat misleading as it will result in the prior nine month period ending December 31, 2008 being compared with the current twelve month period ending December 31, 2009. Management has made every attempt to explain the impact of this variable fiscal period on the figures presented. Future Initiatives With funding available from bond issuances and support from the City of Wheaton, the District will continue to renovate Northside Park and Lagoon though 2010 and 2011. This project will result in an improved watershed, improved recreational opportunities and significant ecological restoration. The District anticipates continuing its program of maintaining, and as financially feasible, updating facilities, structures, athletic fields, courts, playgrounds, and its general infrastructure under a schedule of improvements and replacements. In December of 2009, the Wheaton Park District Board of Commissioners adopted a five-year Park and Facility Master Plan and Agency Strategic Plan. This comprehensive plan was completed over an 18 month period by a Leadership Team of highly engaged agency employees from across departments and all levels of the hierarchy. The agency team is working towards alignment and a high level of accountability for achieving financial sustainability, improving agency systems, improving people, and ensuring stakeholder satisfaction. In 2010, the Wheaton Park District will work towards re-accreditation for the Cosley Zoo by the American Zoological Association as well as comprehensive agency accreditation by the Illinois Association of Park Districts and Illinois Park and Recreation Association. Independent Audit The Illinois Compiled Statutes require that park districts secure a licensed public accountant designated by the Board of Commissioners to perform an annual audit of all accounts. The firm of Sikich LLP, a firm of licensed certified public accountants, has performed the audit for the fiscal year ended December 31, 2009. The goal of the independent audit was to provide reasonable assurance that the financial statements are free of material misstatement. The independent audit involved examining, on a test basis, evidence supporting the amounts and disclosures in the financial statements; assessing the accounting principles used and significant estimates made by management; and evaluating the overall financial statement presentation.

FINANCIAL STATEMENTS
GENERAL PURPOSE EXTERNALFINANCIAL STATEMENTS
WHEATON PARK DISTRICT MANAGEMENT’S DISCUSSION AND ANALYSIS
FOR THE FISCAL PERIOD ENDED DECEMBER 31, 2009
MD&A 1
This discussion and analysis is intended to be an easily readable overview of the Wheaton Park District’s financial activities for the fiscal period ended December 31, 2009, based on currently known facts, decisions and conditions. This analysis focuses on current year activities and operations and should be read in combination with the transmittal letter that begins on page one and the basic financial statements that follow. The Management’s Discussion and Analysis (MD&A) is an element of the reporting model adopted by the Governmental Accounting Standards Board (GASB) in their Statement No. 34 Basic Financial Statements – and Management’s Discussion and Analysis – for State and Local Governments. FINANCIAL HIGHLIGHTS The District changed its fiscal year end from March 31 to December 31, effective April 1, 2008. The fiscal period ended December 31, 2008 was a shortened year and included only nine months of activity. For the year ended December 31, 2009, total governmental funds reported an end of the year fund balance of $8.4 million, which represents an overall increase of $0.3 million from the previous year’s balance of $8.1 million. This is primarily the result of bond proceeds of $1.2 million offset by $.9 million of capital projects. USING THE ANNUAL REPORT/REPORT LAYOUT This discussion and analysis is intended to serve as an introduction to the Park District’s basic financial statements. The basic financial statements are comprised of three components:
• Government-wide financial statements,
• Fund financial statements, and
• Notes to the financial statements The government-wide statements are highly condensed and present information about the Park District’s finances and operations as a whole, with a longer-term view. Within this view, all District operations are categorized and reported as either governmental or business-type activities. The fund financial statements tell how we financed our governmental activities in the short-term, as well as what remains for future spending. The fund financial statements also report the Park District’s operations in more detail than the government-wide financial statements by providing information about the Park District’s most significant funds.
WHEATON PARK DISTRICT MANAGEMENT’S DISCUSSION AND ANALYSIS
FOR THE FISCAL PERIOD ENDED DECEMBER 31, 2009
MD&A 2
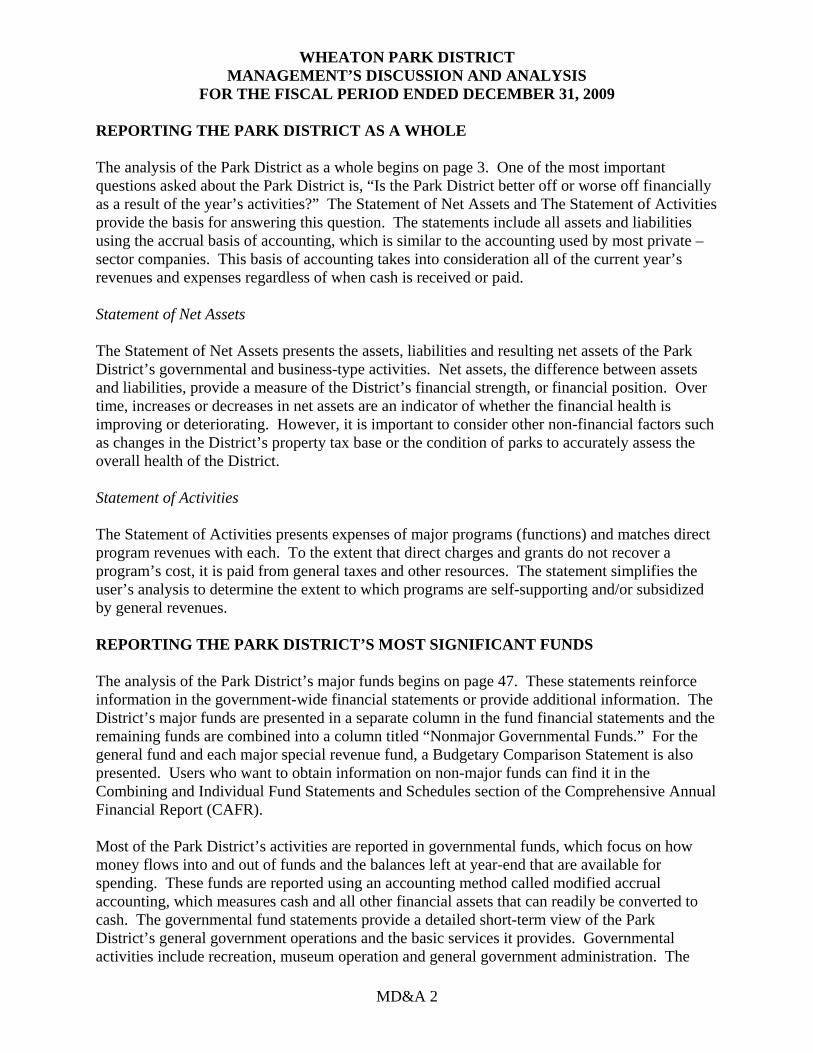
REPORTING THE PARK DISTRICT AS A WHOLE The analysis of the Park District as a whole begins on page 3. One of the most important questions asked about the Park District is, “Is the Park District better off or worse off financially as a result of the year’s activities?” The Statement of Net Assets and The Statement of Activities provide the basis for answering this question. The statements include all assets and liabilities using the accrual basis of accounting, which is similar to the accounting used by most private – sector companies. This basis of accounting takes into consideration all of the current year’s revenues and expenses regardless of when cash is received or paid. Statement of Net Assets The Statement of Net Assets presents the assets, liabilities and resulting net assets of the Park District’s governmental and business-type activities. Net assets, the difference between assets and liabilities, provide a measure of the District’s financial strength, or financial position. Over time, increases or decreases in net assets are an indicator of whether the financial health is improving or deteriorating. However, it is important to consider other non-financial factors such as changes in the District’s property tax base or the condition of parks to accurately assess the overall health of the District. Statement of Activities The Statement of Activities presents expenses of major programs (functions) and matches direct program revenues with each. To the extent that direct charges and grants do not recover a program’s cost, it is paid from general taxes and other resources. The statement simplifies the user’s analysis to determine the extent to which programs are self-supporting and/or subsidized by general revenues. REPORTING THE PARK DISTRICT’S MOST SIGNIFICANT FUNDS The analysis of the Park District’s major funds begins on page 47. These statements reinforce information in the government-wide financial statements or provide additional information. The District’s major funds are presented in a separate column in the fund financial statements and the remaining funds are combined into a column titled “Nonmajor Governmental Funds.” For the general fund and each major special revenue fund, a Budgetary Comparison Statement is also presented. Users who want to obtain information on non-major funds can find it in the Combining and Individual Fund Statements and Schedules section of the Comprehensive Annual Financial Report (CAFR). Most of the Park District’s activities are reported in governmental funds, which focus on how money flows into and out of funds and the balances left at year-end that are available for spending. These funds are reported using an accounting method called modified accrual accounting, which measures cash and all other financial assets that can readily be converted to cash. The governmental fund statements provide a detailed short-term view of the Park District’s general government operations and the basic services it provides. Governmental activities include recreation, museum operation and general government administration. The
WHEATON PARK DISTRICT MANAGEMENT’S DISCUSSION AND ANALYSIS
FOR THE FISCAL PERIOD ENDED DECEMBER 31, 2009
MD&A 3
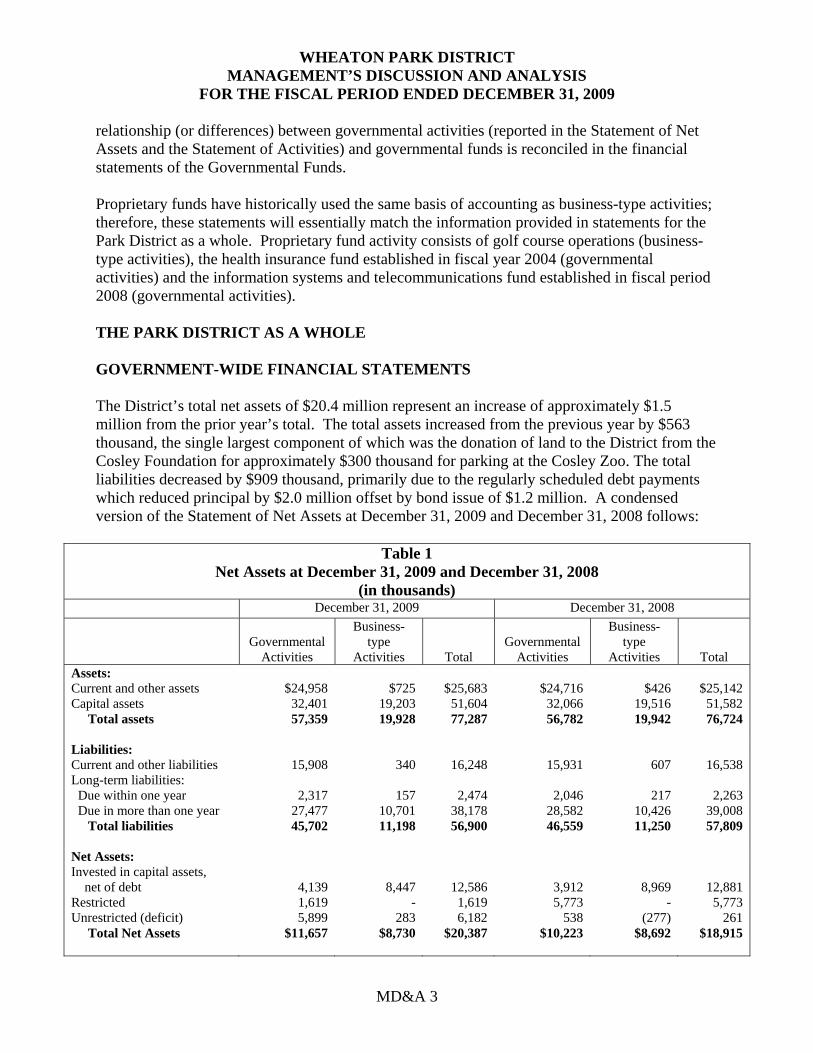
relationship (or differences) between governmental activities (reported in the Statement of Net Assets and the Statement of Activities) and governmental funds is reconciled in the financial statements of the Governmental Funds. Proprietary funds have historically used the same basis of accounting as business-type activities; therefore, these statements will essentially match the information provided in statements for the Park District as a whole. Proprietary fund activity consists of golf course operations (business-type activities), the health insurance fund established in fiscal year 2004 (governmental activities) and the information systems and telecommunications fund established in fiscal period 2008 (governmental activities). THE PARK DISTRICT AS A WHOLE GOVERNMENT-WIDE FINANCIAL STATEMENTS The District’s total net assets of $20.4 million represent an increase of approximately $1.5 million from the prior year’s total. The total assets increased from the previous year by $563 thousand, the single largest component of which was the donation of land to the District from the Cosley Foundation for approximately $300 thousand for parking at the Cosley Zoo. The total liabilities decreased by $909 thousand, primarily due to the regularly scheduled debt payments which reduced principal by $2.0 million offset by bond issue of $1.2 million. A condensed version of the Statement of Net Assets at December 31, 2009 and December 31, 2008 follows:
Table 1 Net Assets at December 31, 2009 and December 31, 2008
(in thousands) December 31, 2009 December 31, 2008
Governmental Activities
Business-type
Activities
Total
Governmental
Activities
Business-type
Activities
Total Assets: Current and other assets $24,958 $725 $25,683 $24,716 $426 $25,142 Capital assets 32,401 19,203 51,604 32,066 19,516 51,582 Total assets 57,359 19,928 77,287 56,782 19,942 76,724 Liabilities: Current and other liabilities 15,908 340 16,248 15,931 607 16,538 Long-term liabilities: Due within one year 2,317 157 2,474 2,046 217 2,263 Due in more than one year 27,477 10,701 38,178 28,582 10,426 39,008 Total liabilities 45,702 11,198 56,900 46,559 11,250 57,809 Net Assets: Invested in capital assets, net of debt 4,139 8,447 12,586 3,912 8,969 12,881 Restricted 1,619 - 1,619 5,773 - 5,773 Unrestricted (deficit) 5,899 283 6,182 538 (277) 261 Total Net Assets $11,657 $8,730 $20,387 $10,223 $8,692 $18,915
WHEATON PARK DISTRICT MANAGEMENT’S DISCUSSION AND ANALYSIS
FOR THE FISCAL PERIOD ENDED DECEMBER 31, 2009
MD&A 4
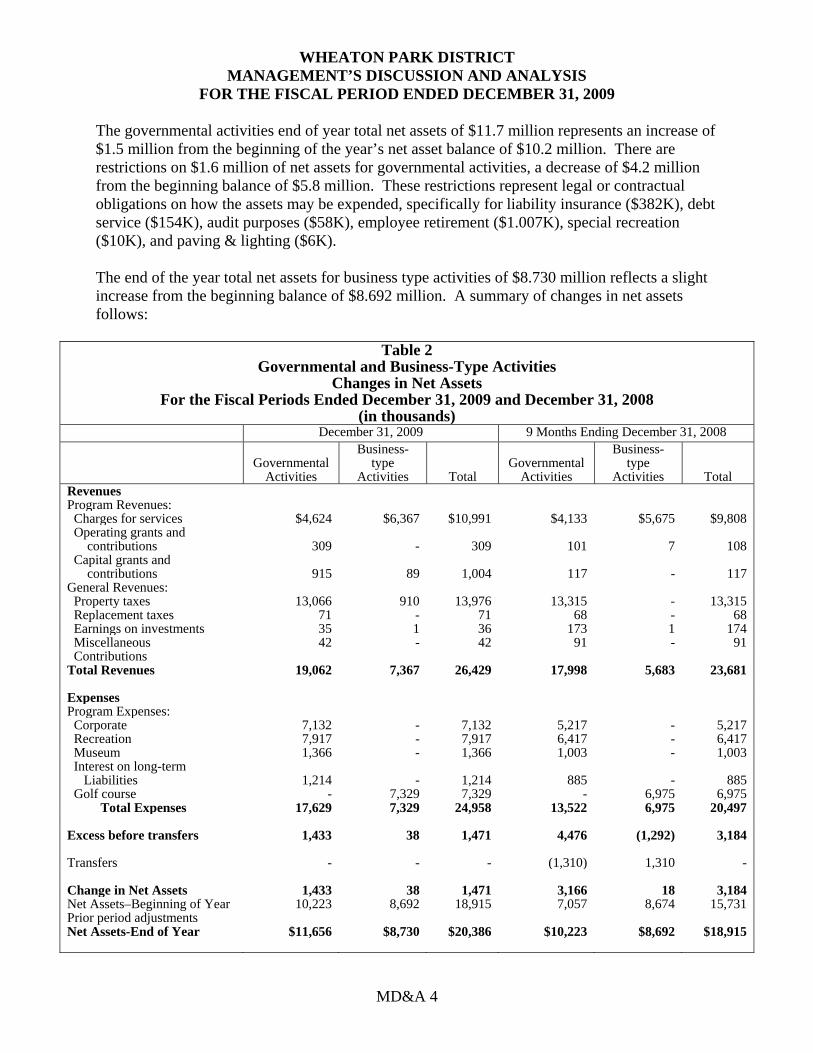
The governmental activities end of year total net assets of $11.7 million represents an increase of $1.5 million from the beginning of the year’s net asset balance of $10.2 million. There are restrictions on $1.6 million of net assets for governmental activities, a decrease of $4.2 million from the beginning balance of $5.8 million. These restrictions represent legal or contractual obligations on how the assets may be expended, specifically for liability insurance ($382K), debt service ($154K), audit purposes ($58K), employee retirement ($1.007K), special recreation ($10K), and paving & lighting ($6K). The end of the year total net assets for business type activities of $8.730 million reflects a slight increase from the beginning balance of $8.692 million. A summary of changes in net assets follows:
Table 2Governmental and Business-Type Activities
Changes in Net Assets For the Fiscal Periods Ended December 31, 2009 and December 31, 2008
(in thousands) December 31, 2009 9 Months Ending December 31, 2008
Governmental Activities
Business-type
Activities
TotalGovernmental
Activities
Business-type
Activities
TotalRevenues Program Revenues: Charges for services $4,624 $6,367 $10,991 $4,133 $5,675 $9,808 Operating grants and contributions 309 - 309 101 7 108 Capital grants and contributions 915 89 1,004 117 - 117General Revenues: Property taxes 13,066 910 13,976 13,315 - 13,315 Replacement taxes 71 - 71 68 - 68 Earnings on investments 35 1 36 173 1 174 Miscellaneous 42 - 42 91 - 91 Contributions Total Revenues 19,062 7,367 26,429 17,998 5,683 23,681 Expenses Program Expenses: Corporate 7,132 - 7,132 5,217 - 5,217 Recreation 7,917 - 7,917 6,417 - 6,417 Museum 1,366 - 1,366 1,003 - 1,003 Interest on long-term Liabilities 1,214 - 1,214 885 - 885 Golf course - 7,329 7,329 - 6,975 6,975 Total Expenses 17,629 7,329 24,958 13,522 6,975 20,497 Excess before transfers 1,433 38 1,471 4,476 (1,292) 3,184 Transfers - - - (1,310) 1,310 - Change in Net Assets 1,433 38 1,471 3,166 18 3,184Net Assets–Beginning of Year 10,223 8,692 18,915 7,057 8,674 15,731Prior period adjustments Net Assets-End of Year $11,656 $8,730 $20,386 $10,223 $8,692 $18,915
WHEATON PARK DISTRICT MANAGEMENT’S DISCUSSION AND ANALYSIS
FOR THE FISCAL PERIOD ENDED DECEMBER 31, 2009
MD&A 5
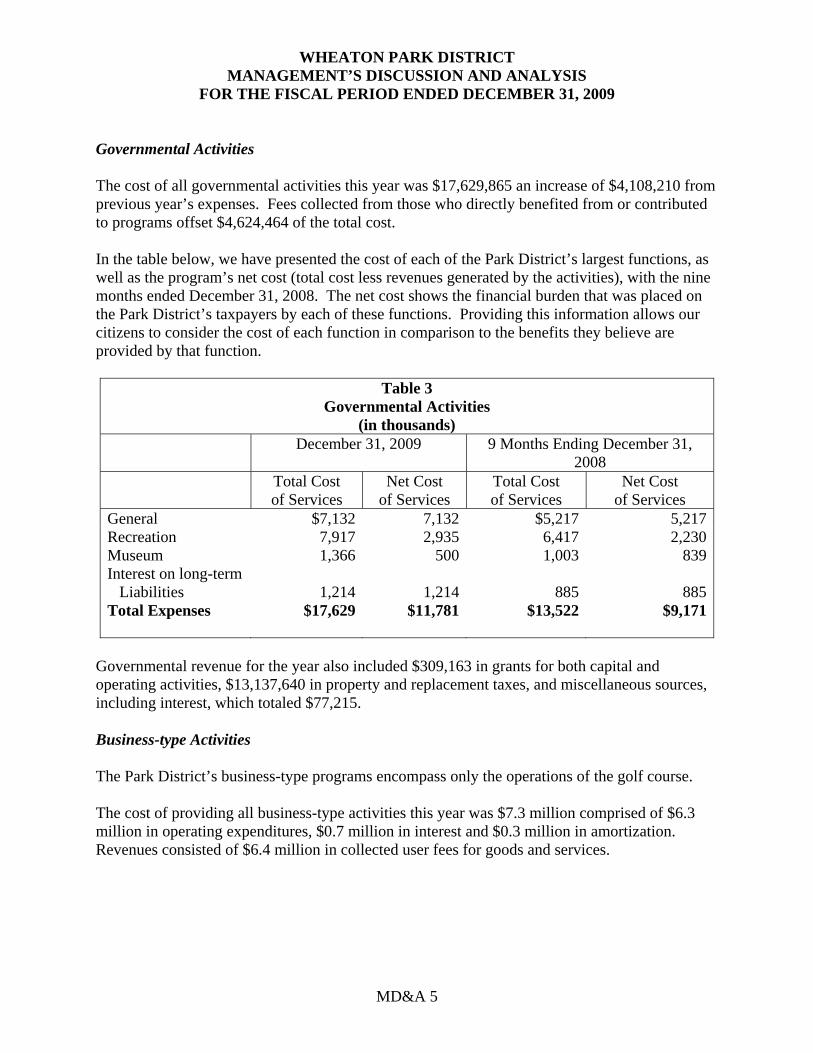
Governmental Activities The cost of all governmental activities this year was $17,629,865 an increase of $4,108,210 from previous year’s expenses. Fees collected from those who directly benefited from or contributed to programs offset $4,624,464 of the total cost. In the table below, we have presented the cost of each of the Park District’s largest functions, as well as the program’s net cost (total cost less revenues generated by the activities), with the nine months ended December 31, 2008. The net cost shows the financial burden that was placed on the Park District’s taxpayers by each of these functions. Providing this information allows our citizens to consider the cost of each function in comparison to the benefits they believe are provided by that function.
Table 3 Governmental Activities
(in thousands) December 31, 2009 9 Months Ending December 31,
2008 Total Cost
of Services Net Cost
of Services Total Cost of Services
Net Cost of Services
General $7,132 7,132 $5,217 5,217Recreation 7,917 2,935 6,417 2,230Museum 1,366 500 1,003 839Interest on long-term Liabilities 1,214 1,214 885 885Total Expenses $17,629 $11,781 $13,522 $9,171
Governmental revenue for the year also included $309,163 in grants for both capital and operating activities, $13,137,640 in property and replacement taxes, and miscellaneous sources, including interest, which totaled $77,215. Business-type Activities The Park District’s business-type programs encompass only the operations of the golf course. The cost of providing all business-type activities this year was $7.3 million comprised of $6.3 million in operating expenditures, $0.7 million in interest and $0.3 million in amortization. Revenues consisted of $6.4 million in collected user fees for goods and services.
WHEATON PARK DISTRICT MANAGEMENT’S DISCUSSION AND ANALYSIS
FOR THE FISCAL PERIOD ENDED DECEMBER 31, 2009
MD&A 6
THE PARK DISTRICT’S FUNDS As indicated earlier, the Park District’s governmental funds are accounted for on the modified accrual basis of accounting. Governmental funds reported a combined total of $18,477,708 of revenues and $19,429,266 in expenditures. After offsetting transfers and the addition of $6,800 in gain on the sale of capital assets, the resulting combined increase in the fund balance of all governmental funds at December 31, 2009 was $278,432. The combined fund balance of all governmental funds at December 31, 2009 was $8,381,449 compared to the combined fund balance for all governmental funds of $8,103,017 at December 31, 2008. General Fund revenues and expenditures totaled $2,561,993 and $2,851,210, respectively. After transfers in of $731,000, the fund balance increased by $441,783, which was better than the $13,970 budgeted increase in fund balance. The fund balance at December 31, 2009 was $1,252,465. Revenues for the Recreation Fund totaled $8,007,779; expenditures totaled $7,363,579, and transfers out totaled $731,000. The ending fund balance at December 31, 2009 of $1,386,233 was a decrease of $86,800 from the beginning fund balance of $1,473,033. Revenues for the Cosley Zoo totaled $1,041,166 and expenditures totaled $1,157,493 resulting in a fund balance decrease of $116,327. The beginning of the year fund balance of $39,820 was eliminated and the ending fund deficit at December 31, 2009 was $76,507. The Debt Service Fund showed revenues of $3,166,293 for the year and expenditures of $3,193,830. After bond issuances of $511,685, the fund balance decreased by $484,148 to an ending fund balance of $665,993 at December 31, 2009. Revenues for the Capital Projects Fund totaled $388,113; expenditures totaled $1,388,667, and bond proceeds totaled $708,940. The ending fund balance at December 31, 2009 of $3,689,271 was a decrease of $282,249 from the beginning fund balance of $3,971,520. RECREATION FUND BUDGETING HIGHLIGHTS On the revenue side, actual revenues in the Recreation Fund were less than budgeted revenues by $805,850, which is a variance of 10%. Recreation Fund expenditures came in under budget by $703,237, which is a variance of 10%. While the decline in revenues is across all revenue sources, the more significant declines are in the charges for services, our programs, pools, community center rentals, and fitness center, which are attributable to the impact of the economic recession. The commensurate decline in expenditures is a reflection of the District’s ability to respond to declines in demand for services by reducing expenditures, such as hiring less seasonal staff, reducing supplies and contractual services.
WHEATON PARK DISTRICT MANAGEMENT’S DISCUSSION AND ANALYSIS
FOR THE FISCAL PERIOD ENDED DECEMBER 31, 2009
MD&A 7
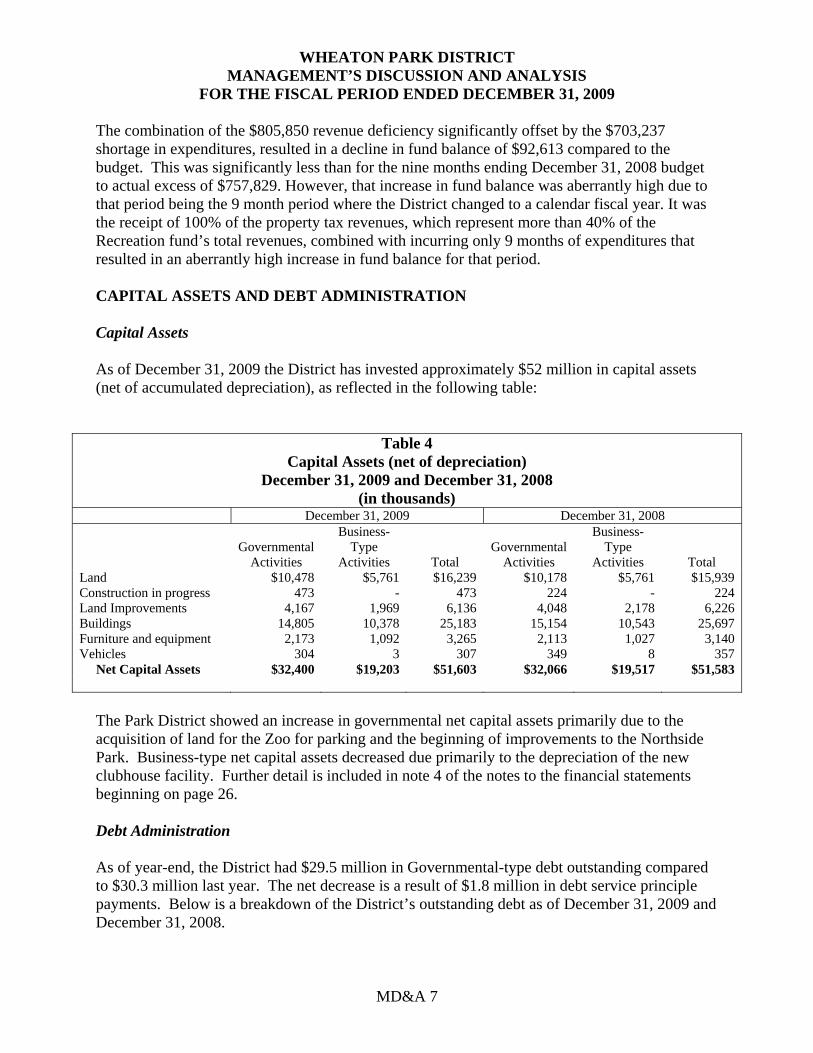
The combination of the $805,850 revenue deficiency significantly offset by the $703,237 shortage in expenditures, resulted in a decline in fund balance of $92,613 compared to the budget. This was significantly less than for the nine months ending December 31, 2008 budget to actual excess of $757,829. However, that increase in fund balance was aberrantly high due to that period being the 9 month period where the District changed to a calendar fiscal year. It was the receipt of 100% of the property tax revenues, which represent more than 40% of the Recreation fund’s total revenues, combined with incurring only 9 months of expenditures that resulted in an aberrantly high increase in fund balance for that period. CAPITAL ASSETS AND DEBT ADMINISTRATION Capital Assets As of December 31, 2009 the District has invested approximately $52 million in capital assets (net of accumulated depreciation), as reflected in the following table:
Table 4 Capital Assets (net of depreciation)
December 31, 2009 and December 31, 2008 (in thousands)
December 31, 2009 December 31, 2008
Governmental Activities
Business- Type
Activities
Total
Governmental
Activities
Business- Type
Activities
Total Land $10,478 $5,761 $16,239 $10,178 $5,761 $15,939 Construction in progress 473 - 473 224 - 224 Land Improvements Buildings
4,167 14,805
1,969 10,378
6,136 25,183
4,048 15,154
2,178 10,543
6,226 25,697
Furniture and equipment 2,173 1,092 3,265 2,113 1,027 3,140 Vehicles 304 3 307 349 8 357 Net Capital Assets $32,400 $19,203 $51,603 $32,066 $19,517 $51,583
The Park District showed an increase in governmental net capital assets primarily due to the acquisition of land for the Zoo for parking and the beginning of improvements to the Northside Park. Business-type net capital assets decreased due primarily to the depreciation of the new clubhouse facility. Further detail is included in note 4 of the notes to the financial statements beginning on page 26. Debt Administration As of year-end, the District had $29.5 million in Governmental-type debt outstanding compared to $30.3 million last year. The net decrease is a result of $1.8 million in debt service principle payments. Below is a breakdown of the District’s outstanding debt as of December 31, 2009 and December 31, 2008.
WHEATON PARK DISTRICT MANAGEMENT’S DISCUSSION AND ANALYSIS
FOR THE FISCAL PERIOD ENDED DECEMBER 31, 2009
MD&A 8
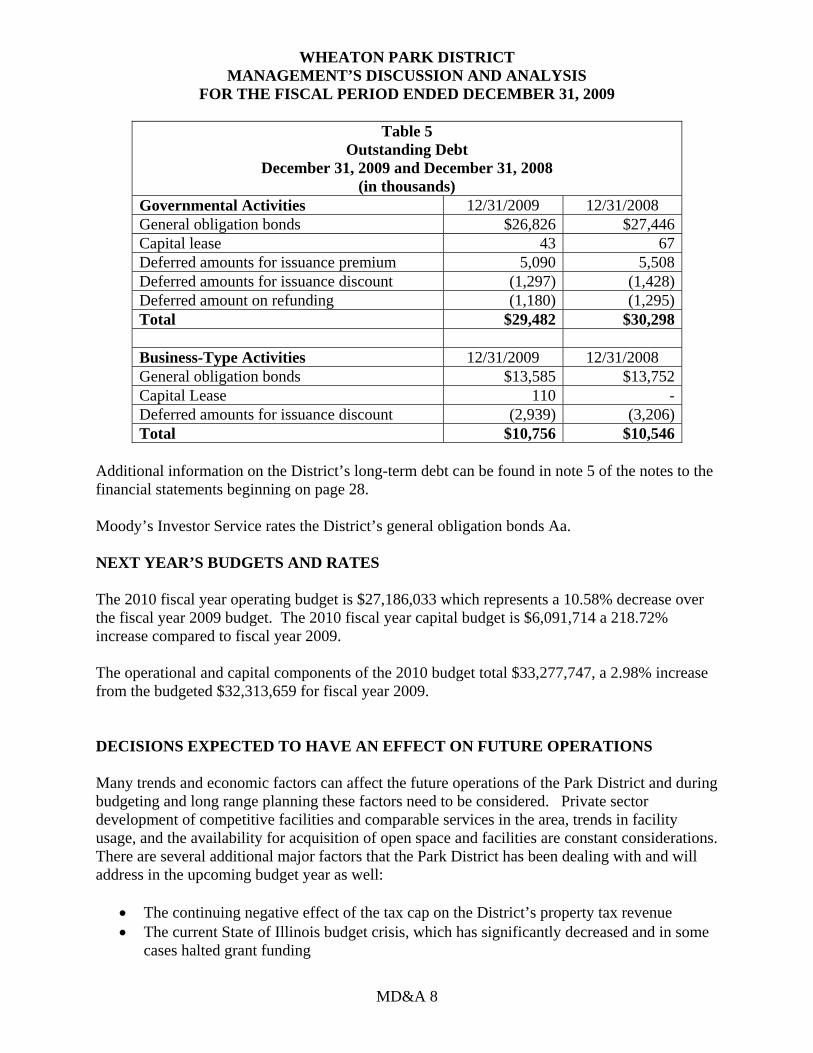
Table 5 Outstanding Debt
December 31, 2009 and December 31, 2008 (in thousands)
Governmental Activities 12/31/2009 12/31/2008 General obligation bonds $26,826 $27,446Capital lease 43 67Deferred amounts for issuance premium 5,090 5,508Deferred amounts for issuance discount (1,297) (1,428)Deferred amount on refunding (1,180) (1,295)Total $29,482 $30,298 Business-Type Activities 12/31/2009 12/31/2008 General obligation bonds $13,585 $13,752 Capital Lease 110 -Deferred amounts for issuance discount (2,939) (3,206)Total $10,756 $10,546
Additional information on the District’s long-term debt can be found in note 5 of the notes to the financial statements beginning on page 28. Moody’s Investor Service rates the District’s general obligation bonds Aa. NEXT YEAR’S BUDGETS AND RATES The 2010 fiscal year operating budget is $27,186,033 which represents a 10.58% decrease over the fiscal year 2009 budget. The 2010 fiscal year capital budget is $6,091,714 a 218.72% increase compared to fiscal year 2009.
The operational and capital components of the 2010 budget total $33,277,747, a 2.98% increase from the budgeted $32,313,659 for fiscal year 2009. DECISIONS EXPECTED TO HAVE AN EFFECT ON FUTURE OPERATIONS Many trends and economic factors can affect the future operations of the Park District and during budgeting and long range planning these factors need to be considered. Private sector development of competitive facilities and comparable services in the area, trends in facility usage, and the availability for acquisition of open space and facilities are constant considerations. There are several additional major factors that the Park District has been dealing with and will address in the upcoming budget year as well:
• The continuing negative effect of the tax cap on the District’s property tax revenue • The current State of Illinois budget crisis, which has significantly decreased and in some
cases halted grant funding
WHEATON PARK DISTRICT MANAGEMENT’S DISCUSSION AND ANALYSIS
FOR THE FISCAL PERIOD ENDED DECEMBER 31, 2009
MD&A 9
• Rising group health insurance costs • Rising mandated employer contributions for the Illinois Municipal Retirement Fund • Low interest earnings rates • Increased competition from private industry for participants and users
FINANCIAL CONTACT The District’s financial statements are designed to present users (citizens, taxpayers, investors, customers and creditors) with a general overview of the District’s finances and to demonstrate the District’s accountability. If you have questions about the report or need additional financial information, please contact the Park District’s Finance Director, Rita A. Trainor, 102 E. Wesley Street, Wheaton, IL 60187.
ComponentUnit
Governmental Business-Type CosleyActivities Activities Total Foundation
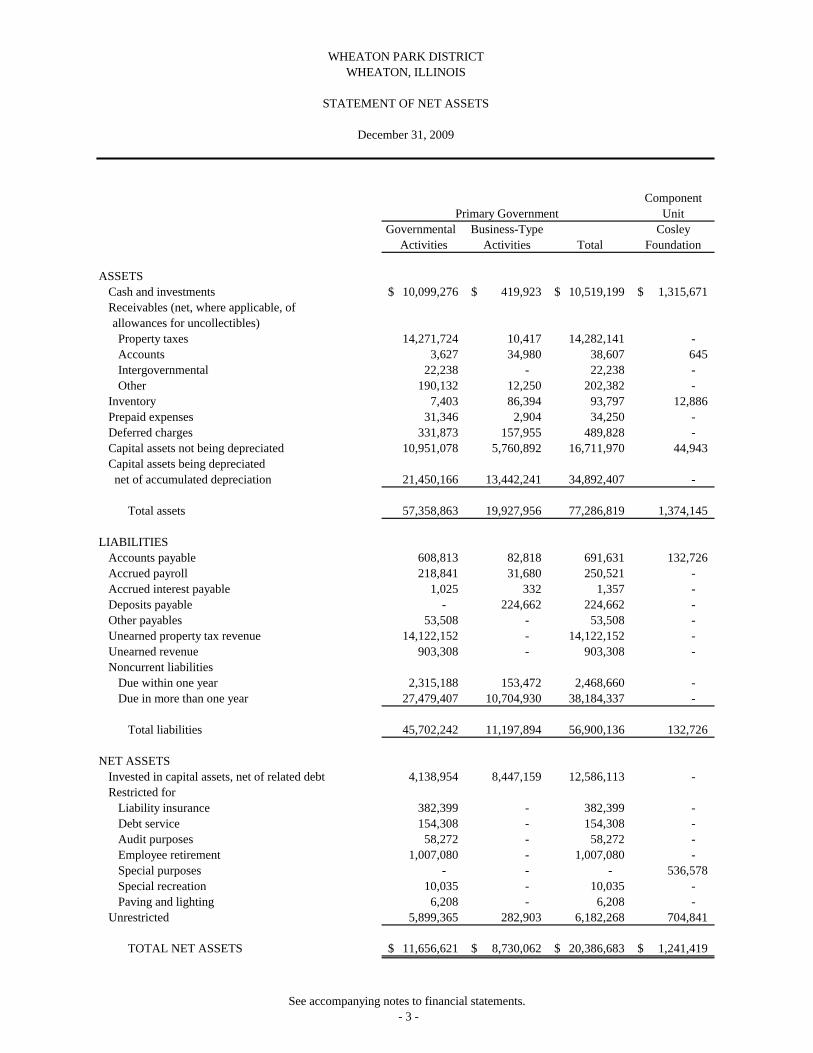
ASSETSCash and investments 10,099,276$ 419,923$ 10,519,199$ 1,315,671$ Receivables (net, where applicable, ofallowances for uncollectibles)Property taxes 14,271,724 10,417 14,282,141 - Accounts 3,627 34,980 38,607 645 Intergovernmental 22,238 - 22,238 - Other 190,132 12,250 202,382 -
Inventory 7,403 86,394 93,797 12,886 Prepaid expenses 31,346 2,904 34,250 - Deferred charges 331,873 157,955 489,828 - Capital assets not being depreciated 10,951,078 5,760,892 16,711,970 44,943 Capital assets being depreciatednet of accumulated depreciation 21,450,166 13,442,241 34,892,407 -
Total assets 57,358,863 19,927,956 77,286,819 1,374,145
LIABILITIESAccounts payable 608,813 82,818 691,631 132,726 Accrued payroll 218,841 31,680 250,521 - Accrued interest payable 1,025 332 1,357 - Deposits payable - 224,662 224,662 - Other payables 53,508 - 53,508 - Unearned property tax revenue 14,122,152 - 14,122,152 - Unearned revenue 903,308 - 903,308 - Noncurrent liabilities
Due within one year 2,315,188 153,472 2,468,660 - Due in more than one year 27,479,407 10,704,930 38,184,337 -
Total liabilities 45,702,242 11,197,894 56,900,136 132,726
NET ASSETSInvested in capital assets, net of related debt 4,138,954 8,447,159 12,586,113 - Restricted for
Liability insurance 382,399 - 382,399 - Debt service 154,308 - 154,308 - Audit purposes 58,272 - 58,272 - Employee retirement 1,007,080 - 1,007,080 - Special purposes - - - 536,578 Special recreation 10,035 - 10,035 - Paving and lighting 6,208 - 6,208 -
Unrestricted 5,899,365 282,903 6,182,268 704,841
TOTAL NET ASSETS 11,656,621$ 8,730,062$ 20,386,683$ 1,241,419$
Primary Government
WHEATON PARK DISTRICTWHEATON, ILLINOIS
STATEMENT OF NET ASSETS
December 31, 2009
See accompanying notes to financial statements.- 3 -
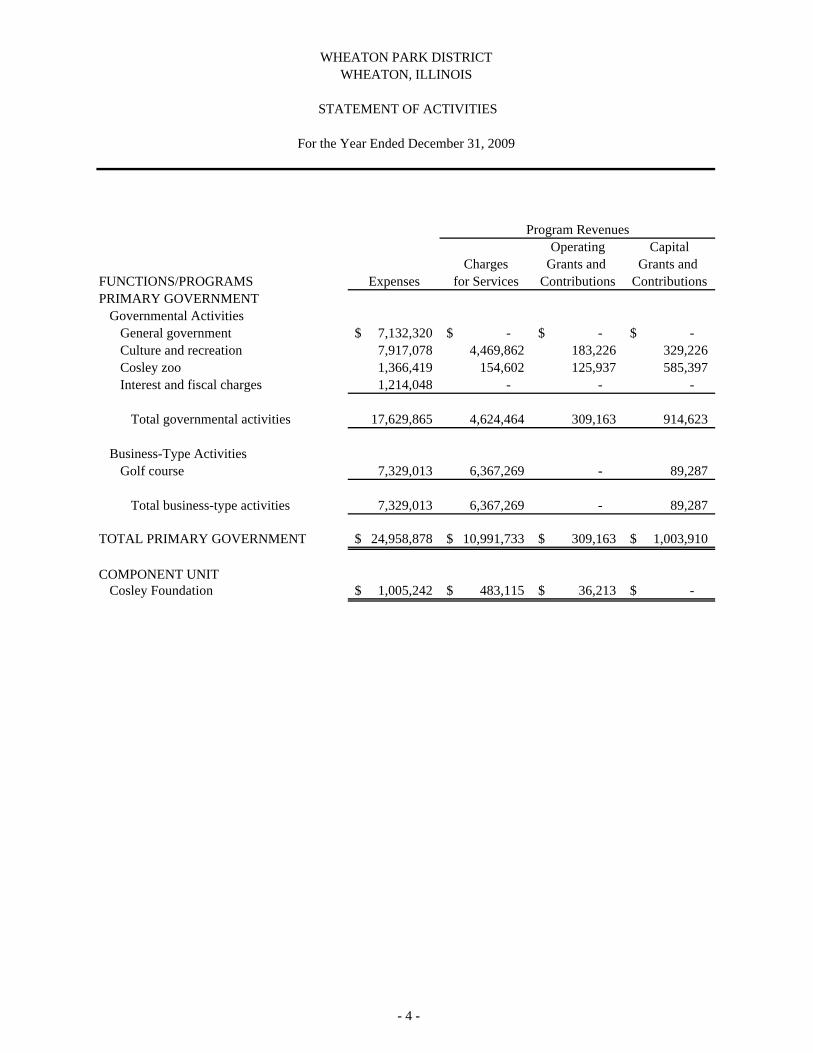
Operating CapitalCharges Grants and Grants and
FUNCTIONS/PROGRAMS Expenses for Services Contributions ContributionsPRIMARY GOVERNMENT
Governmental ActivitiesGeneral government 7,132,320$ -$ -$ -$ Culture and recreation 7,917,078 4,469,862 183,226 329,226 Cosley zoo 1,366,419 154,602 125,937 585,397 Interest and fiscal charges 1,214,048 - - -
Total governmental activities 17,629,865 4,624,464 309,163 914,623
Business-Type ActivitiesGolf course 7,329,013 6,367,269 - 89,287
Total business-type activities 7,329,013 6,367,269 - 89,287
TOTAL PRIMARY GOVERNMENT 24,958,878$ 10,991,733$ 309,163$ 1,003,910$
COMPONENT UNITCosley Foundation 1,005,242$ 483,115$ 36,213$ -$
Program Revenues
WHEATON PARK DISTRICTWHEATON, ILLINOIS
STATEMENT OF ACTIVITIES
For the Year Ended December 31, 2009
- 4 -
ComponentUnit
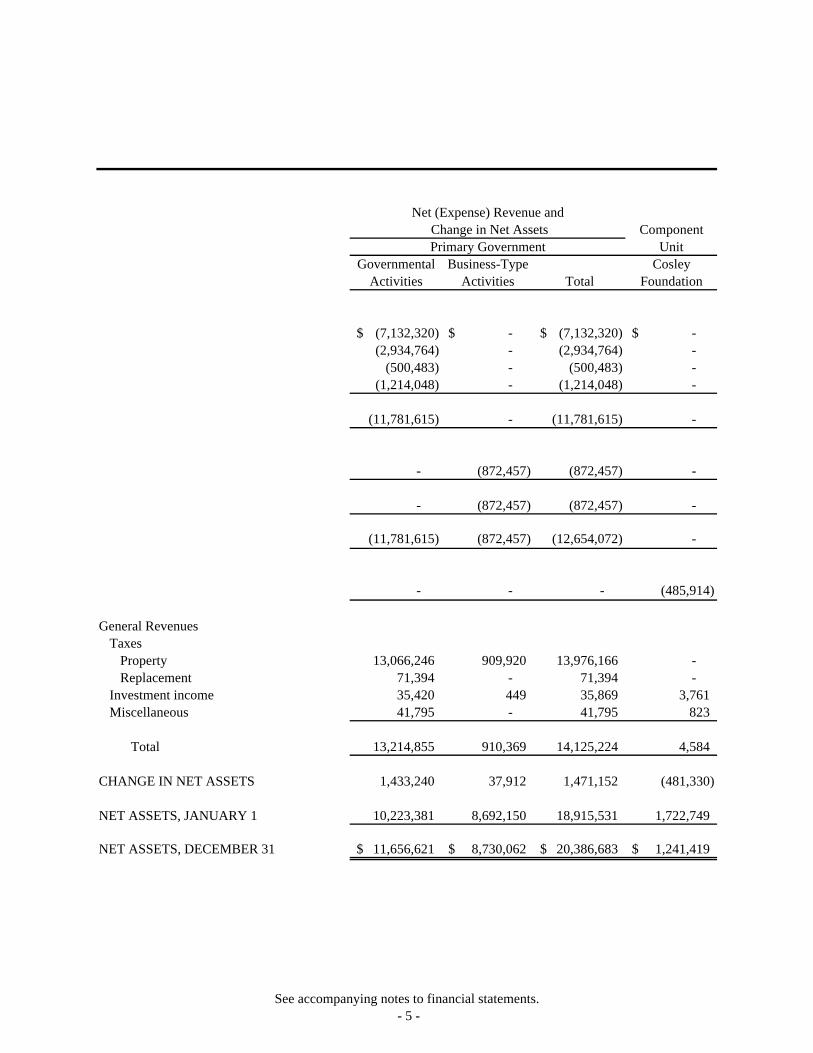
Governmental Business-Type CosleyActivities Activities Total Foundation
(7,132,320)$ -$ (7,132,320)$ -$ (2,934,764) - (2,934,764) -
(500,483) - (500,483) - (1,214,048) - (1,214,048) -
(11,781,615) - (11,781,615) -
- (872,457) (872,457) -
- (872,457) (872,457) -
(11,781,615) (872,457) (12,654,072) -
- - - (485,914)
General RevenuesTaxes
Property 13,066,246 909,920 13,976,166 - Replacement 71,394 - 71,394 -
Investment income 35,420 449 35,869 3,761 Miscellaneous 41,795 - 41,795 823
Total 13,214,855 910,369 14,125,224 4,584
CHANGE IN NET ASSETS 1,433,240 37,912 1,471,152 (481,330)
NET ASSETS, JANUARY 1 10,223,381 8,692,150 18,915,531 1,722,749
NET ASSETS, DECEMBER 31 11,656,621$ 8,730,062$ 20,386,683$ 1,241,419$
Change in Net AssetsPrimary Government
Net (Expense) Revenue and
See accompanying notes to financial statements.- 5 -
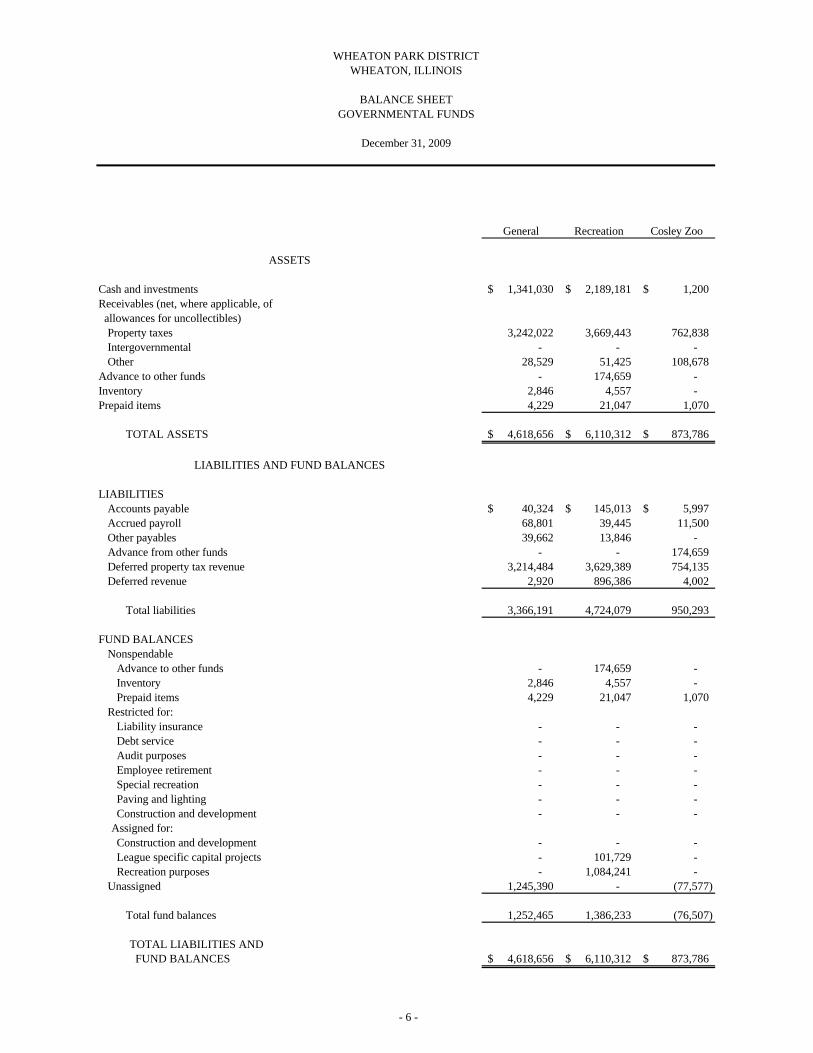
General Recreation Cosley Zoo
ASSETS
Cash and investments 1,341,030$ 2,189,181$ 1,200$ Receivables (net, where applicable, ofallowances for uncollectibles)Property taxes 3,242,022 3,669,443 762,838 Intergovernmental - - - Other 28,529 51,425 108,678
Advance to other funds - 174,659 - Inventory 2,846 4,557 - Prepaid items 4,229 21,047 1,070
TOTAL ASSETS 4,618,656$ 6,110,312$ 873,786$
LIABILITIES AND FUND BALANCES
LIABILITIESAccounts payable 40,324$ 145,013$ 5,997$ Accrued payroll 68,801 39,445 11,500 Other payables 39,662 13,846 - Advance from other funds - - 174,659 Deferred property tax revenue 3,214,484 3,629,389 754,135 Deferred revenue 2,920 896,386 4,002
Total liabilities 3,366,191 4,724,079 950,293
FUND BALANCESNonspendable
Advance to other funds - 174,659 - Inventory 2,846 4,557 - Prepaid items 4,229 21,047 1,070
Restricted for:Liability insurance - - - Debt service - - - Audit purposes - - - Employee retirement - - - Special recreation - - - Paving and lighting - - - Construction and development - - -
Assigned for:Construction and development - - - League specific capital projects - 101,729 - Recreation purposes - 1,084,241 -
Unassigned 1,245,390 - (77,577)
Total fund balances 1,252,465 1,386,233 (76,507)
TOTAL LIABILITIES ANDFUND BALANCES 4,618,656$ 6,110,312$ 873,786$
WHEATON PARK DISTRICTWHEATON, ILLINOIS
BALANCE SHEETGOVERNMENTAL FUNDS
December 31, 2009
- 6 -
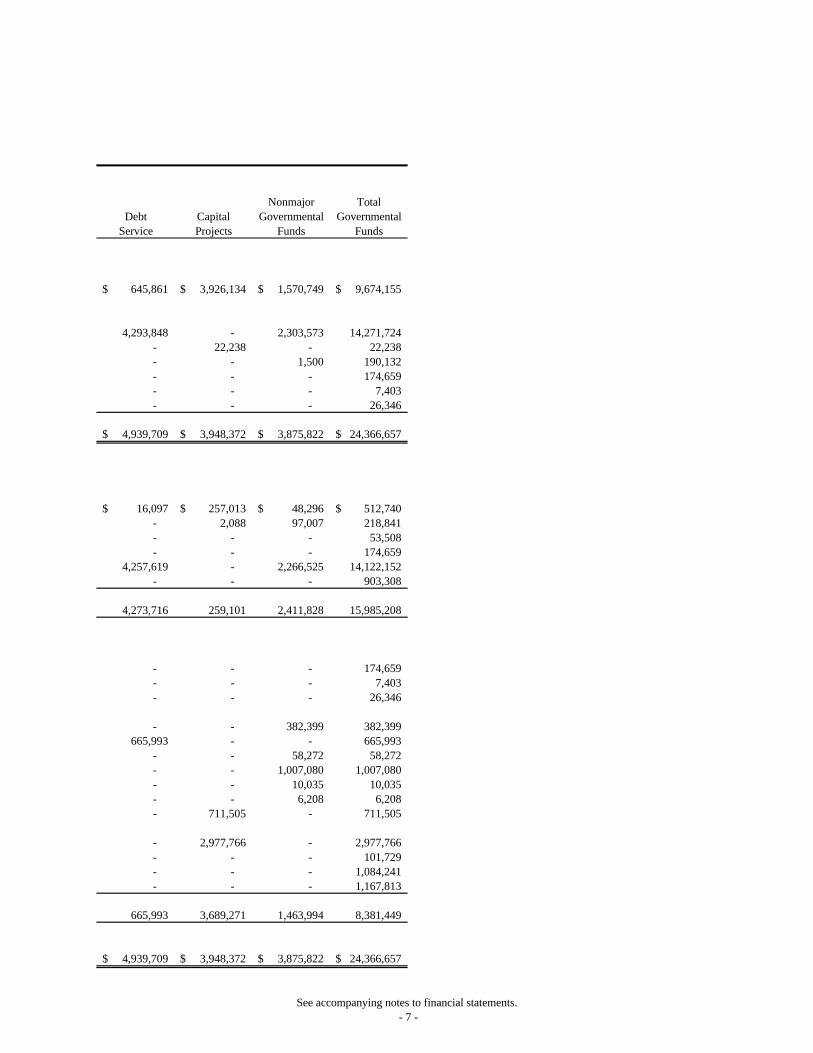
Nonmajor TotalDebt Capital Governmental Governmental
Service Projects Funds Funds
645,861$ 3,926,134$ 1,570,749$ 9,674,155$
4,293,848 - 2,303,573 14,271,724 - 22,238 - 22,238 - - 1,500 190,132 - - - 174,659 - - - 7,403 - - - 26,346
4,939,709$ 3,948,372$ 3,875,822$ 24,366,657$
16,097$ 257,013$ 48,296$ 512,740$ - 2,088 97,007 218,841 - - - 53,508 - - - 174,659
4,257,619 - 2,266,525 14,122,152 - - - 903,308
4,273,716 259,101 2,411,828 15,985,208
- - - 174,659 - - - 7,403 - - - 26,346
- - 382,399 382,399 665,993 - - 665,993
- - 58,272 58,272 - - 1,007,080 1,007,080 - - 10,035 10,035 - - 6,208 6,208 - 711,505 - 711,505
- 2,977,766 - 2,977,766 - - - 101,729 - - - 1,084,241 - - - 1,167,813
665,993 3,689,271 1,463,994 8,381,449
4,939,709$ 3,948,372$ 3,875,822$ 24,366,657$
See accompanying notes to financial statements.- 7 -
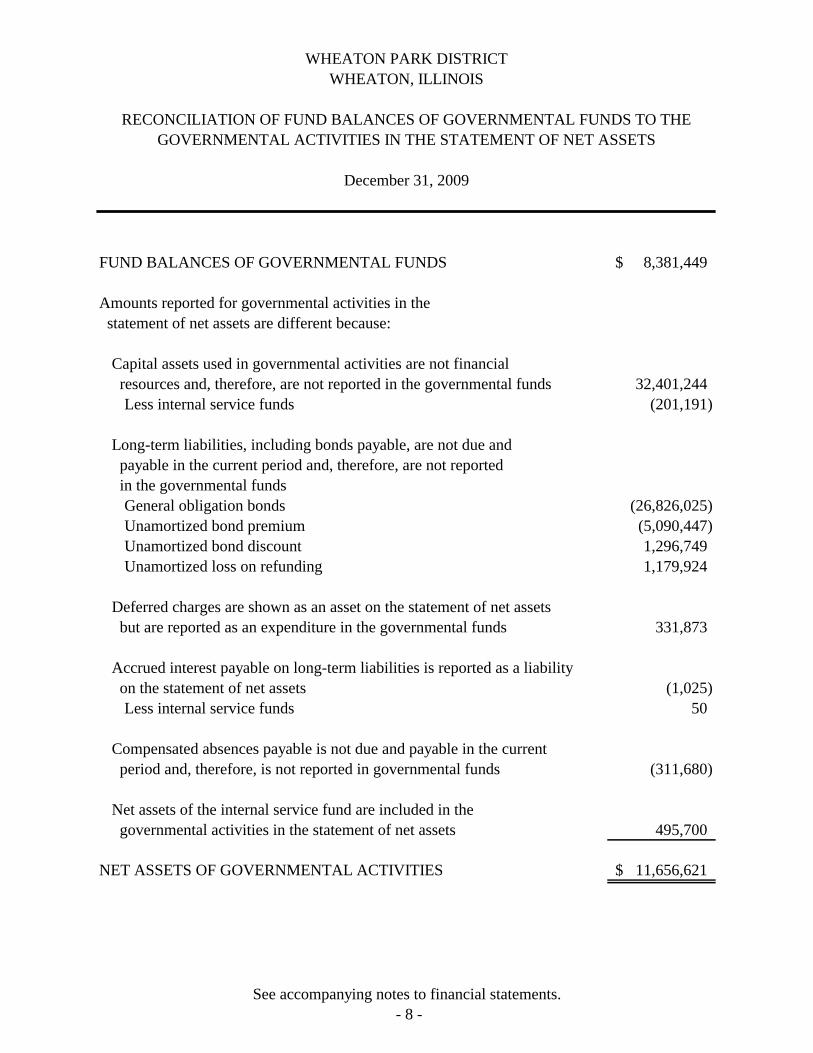
FUND BALANCES OF GOVERNMENTAL FUNDS 8,381,449$
Amounts reported for governmental activities in thestatement of net assets are different because:
Capital assets used in governmental activities are not financialresources and, therefore, are not reported in the governmental funds 32,401,244 Less internal service funds (201,191)
Long-term liabilities, including bonds payable, are not due and payable in the current period and, therefore, are not reported in the governmental fundsGeneral obligation bonds (26,826,025) Unamortized bond premium (5,090,447)Unamortized bond discount 1,296,749Unamortized loss on refunding 1,179,924
Deferred charges are shown as an asset on the statement of net assetsbut are reported as an expenditure in the governmental funds 331,873
Accrued interest payable on long-term liabilities is reported as a liability on the statement of net assets (1,025) Less internal service funds 50
Compensated absences payable is not due and payable in the currentperiod and, therefore, is not reported in governmental funds (311,680)
Net assets of the internal service fund are included in thegovernmental activities in the statement of net assets 495,700
NET ASSETS OF GOVERNMENTAL ACTIVITIES 11,656,621$
WHEATON PARK DISTRICT
RECONCILIATION OF FUND BALANCES OF GOVERNMENTAL FUNDS TO THEGOVERNMENTAL ACTIVITIES IN THE STATEMENT OF NET ASSETS
December 31, 2009
WHEATON, ILLINOIS
See accompanying notes to financial statements.- 8 -
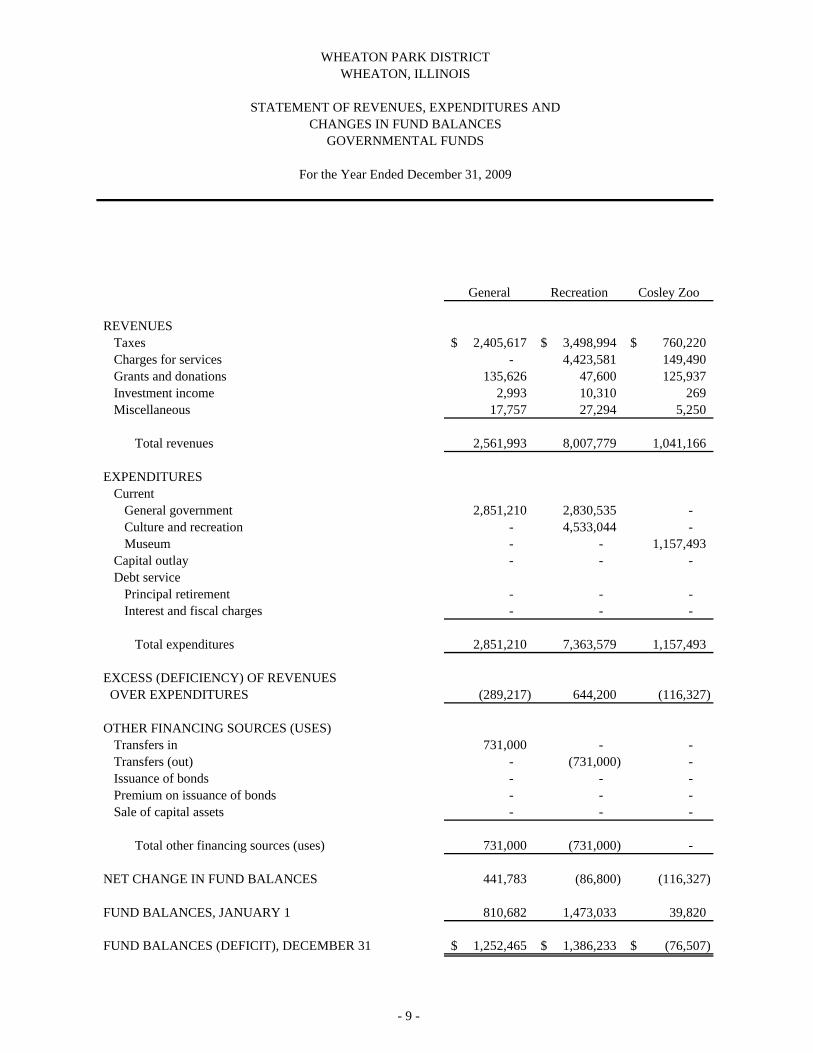
General Recreation Cosley Zoo
REVENUESTaxes 2,405,617$ 3,498,994$ 760,220$ Charges for services - 4,423,581 149,490 Grants and donations 135,626 47,600 125,937 Investment income 2,993 10,310 269 Miscellaneous 17,757 27,294 5,250
Total revenues 2,561,993 8,007,779 1,041,166
EXPENDITURES
CurrentGeneral government 2,851,210 2,830,535 - Culture and recreation - 4,533,044 - Museum - - 1,157,493
Capital outlay - - - Debt service
Principal retirement - - - Interest and fiscal charges - - -
Total expenditures 2,851,210 7,363,579 1,157,493
EXCESS (DEFICIENCY) OF REVENUES
OVER EXPENDITURES (289,217) 644,200 (116,327)
OTHER FINANCING SOURCES (USES)Transfers in 731,000 - - Transfers (out) - (731,000) - Issuance of bonds - - - Premium on issuance of bonds - - - Sale of capital assets - - -
Total other financing sources (uses) 731,000 (731,000) -
NET CHANGE IN FUND BALANCES 441,783 (86,800) (116,327)
FUND BALANCES, JANUARY 1 810,682 1,473,033 39,820
FUND BALANCES (DEFICIT), DECEMBER 31 1,252,465$ 1,386,233$ (76,507)$
For the Year Ended December 31, 2009
WHEATON PARK DISTRICTWHEATON, ILLINOIS
STATEMENT OF REVENUES, EXPENDITURES ANDCHANGES IN FUND BALANCES
GOVERNMENTAL FUNDS
- 9 -

Nonmajor TotalDebt Capital Governmental Governmental
Service Projects Funds Funds
3,164,906$ -$ 3,307,903$ 13,137,640$ - 41,387 - 4,614,458 - 329,226 - 638,389
1,387 17,500 2,961 35,420 - - 1,500 51,801
3,166,293 388,113 3,312,364 18,477,708
- - 1,185,518 6,867,263 - 534,240 2,145,477 7,212,761 - - 143,492 1,300,985 - 854,427 - 854,427
1,841,295 - - 1,841,295 1,352,535 - - 1,352,535
3,193,830 1,388,667 3,474,487 19,429,266
(27,537) (1,000,554) (162,123) (951,558)
- - - 731,000 - - - (731,000)
511,685 708,940 - 1,220,625 - 2,565 - 2,565 - 6,800 - 6,800
511,685 718,305 - 1,229,990
484,148 (282,249) (162,123) 278,432
181,845 3,971,520 1,626,117 8,103,017
665,993$ 3,689,271$ 1,463,994$ 8,381,449$
See accompanying notes to financial statements.- 10 -
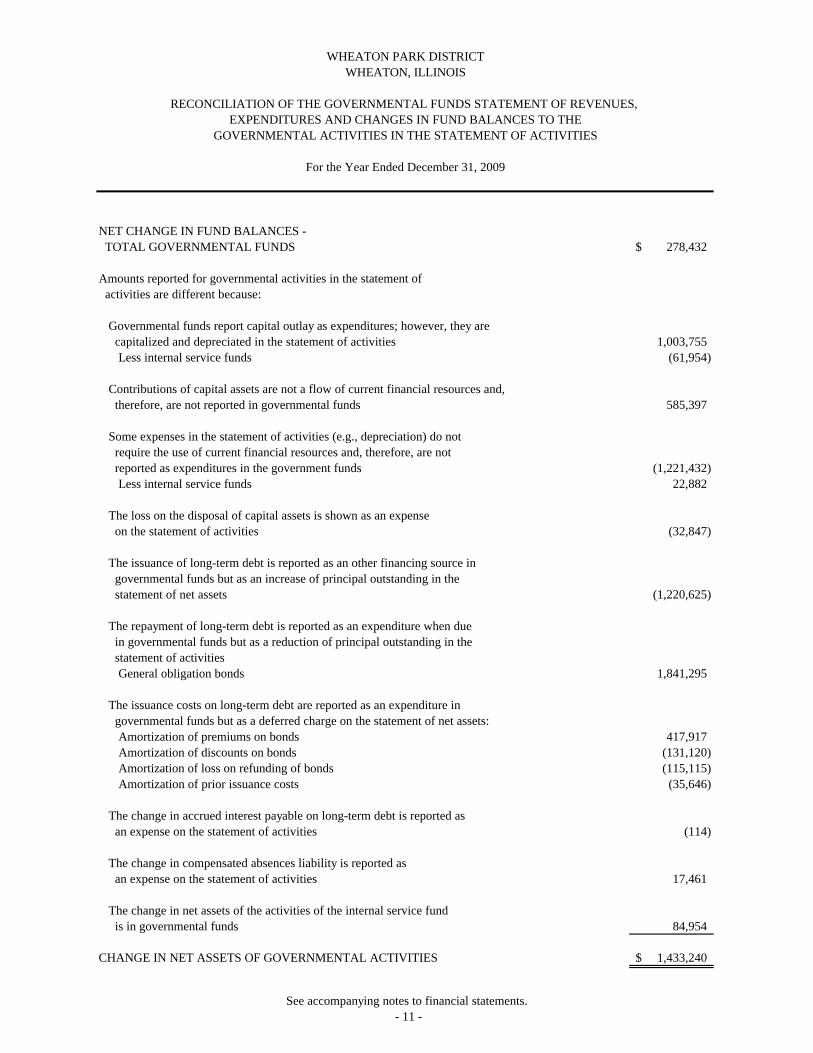
NET CHANGE IN FUND BALANCES -TOTAL GOVERNMENTAL FUNDS 278,432$
Amounts reported for governmental activities in the statement ofactivities are different because:
Governmental funds report capital outlay as expenditures; however, they arecapitalized and depreciated in the statement of activities 1,003,755 Less internal service funds (61,954)
Contributions of capital assets are not a flow of current financial resources and,therefore, are not reported in governmental funds 585,397
Some expenses in the statement of activities (e.g., depreciation) do not require the use of current financial resources and, therefore, are not reported as expenditures in the government funds (1,221,432) Less internal service funds 22,882
The loss on the disposal of capital assets is shown as an expenseon the statement of activities (32,847)
The issuance of long-term debt is reported as an other financing source in governmental funds but as an increase of principal outstanding in thestatement of net assets (1,220,625)
The repayment of long-term debt is reported as an expenditure when duein governmental funds but as a reduction of principal outstanding in the statement of activitiesGeneral obligation bonds 1,841,295
The issuance costs on long-term debt are reported as an expenditure ingovernmental funds but as a deferred charge on the statement of net assets:Amortization of premiums on bonds 417,917 Amortization of discounts on bonds (131,120) Amortization of loss on refunding of bonds (115,115) Amortization of prior issuance costs (35,646)
The change in accrued interest payable on long-term debt is reported as an expense on the statement of activities (114)
The change in compensated absences liability is reported as an expense on the statement of activities 17,461
The change in net assets of the activities of the internal service fundis in governmental funds 84,954
CHANGE IN NET ASSETS OF GOVERNMENTAL ACTIVITIES 1,433,240$
GOVERNMENTAL ACTIVITIES IN THE STATEMENT OF ACTIVITIES
For the Year Ended December 31, 2009
WHEATON PARK DISTRICTWHEATON, ILLINOIS
RECONCILIATION OF THE GOVERNMENTAL FUNDS STATEMENT OF REVENUES, EXPENDITURES AND CHANGES IN FUND BALANCES TO THE
See accompanying notes to financial statements.- 11 -
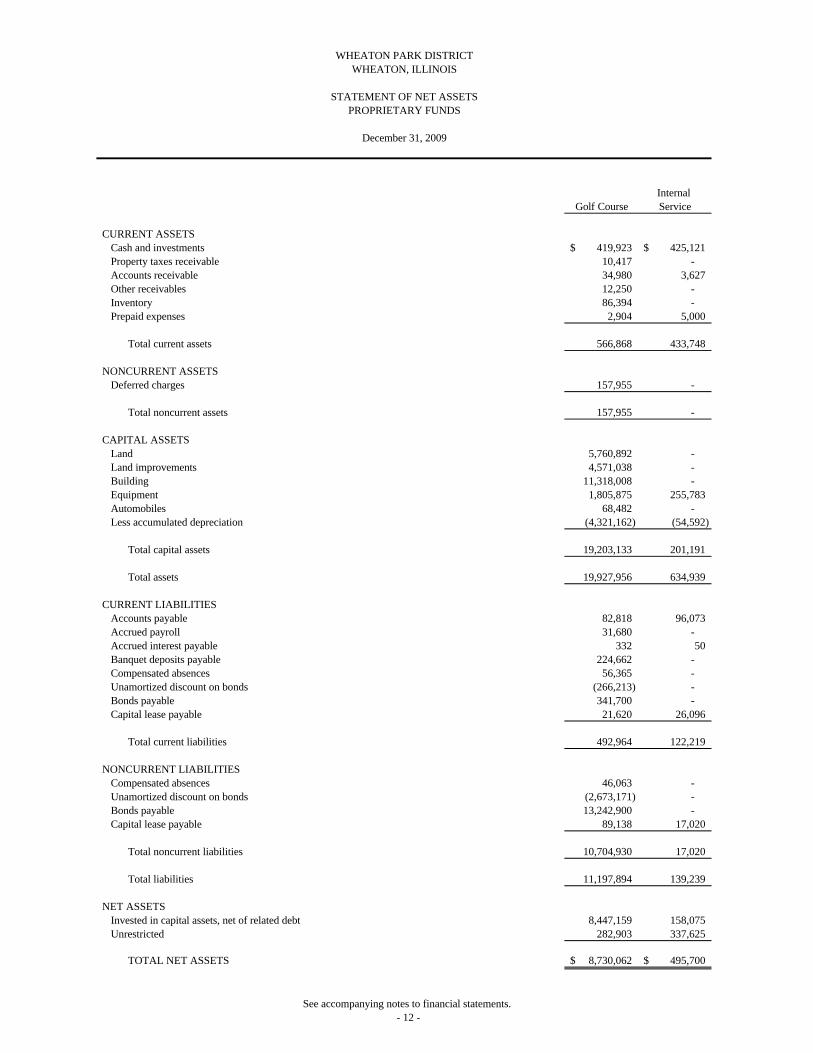
Internal Golf Course Service
CURRENT ASSETSCash and investments 419,923$ 425,121$ Property taxes receivable 10,417 - Accounts receivable 34,980 3,627 Other receivables 12,250 - Inventory 86,394 - Prepaid expenses 2,904 5,000
Total current assets 566,868 433,748
NONCURRENT ASSETSDeferred charges 157,955 -
Total noncurrent assets 157,955 -
CAPITAL ASSETSLand 5,760,892 - Land improvements 4,571,038 - Building 11,318,008 - Equipment 1,805,875 255,783 Automobiles 68,482 - Less accumulated depreciation (4,321,162) (54,592)
Total capital assets 19,203,133 201,191
Total assets 19,927,956 634,939
CURRENT LIABILITIESAccounts payable 82,818 96,073 Accrued payroll 31,680 - Accrued interest payable 332 50 Banquet deposits payable 224,662 - Compensated absences 56,365 - Unamortized discount on bonds (266,213) - Bonds payable 341,700 - Capital lease payable 21,620 26,096
Total current liabilities 492,964 122,219
NONCURRENT LIABILITIESCompensated absences 46,063 - Unamortized discount on bonds (2,673,171) - Bonds payable 13,242,900 - Capital lease payable 89,138 17,020
Total noncurrent liabilities 10,704,930 17,020
Total liabilities 11,197,894 139,239
NET ASSETSInvested in capital assets, net of related debt 8,447,159 158,075 Unrestricted 282,903 337,625
TOTAL NET ASSETS 8,730,062$ 495,700$
December 31, 2009
WHEATON PARK DISTRICTWHEATON, ILLINOIS
STATEMENT OF NET ASSETSPROPRIETARY FUNDS
See accompanying notes to financial statements.- 12 -
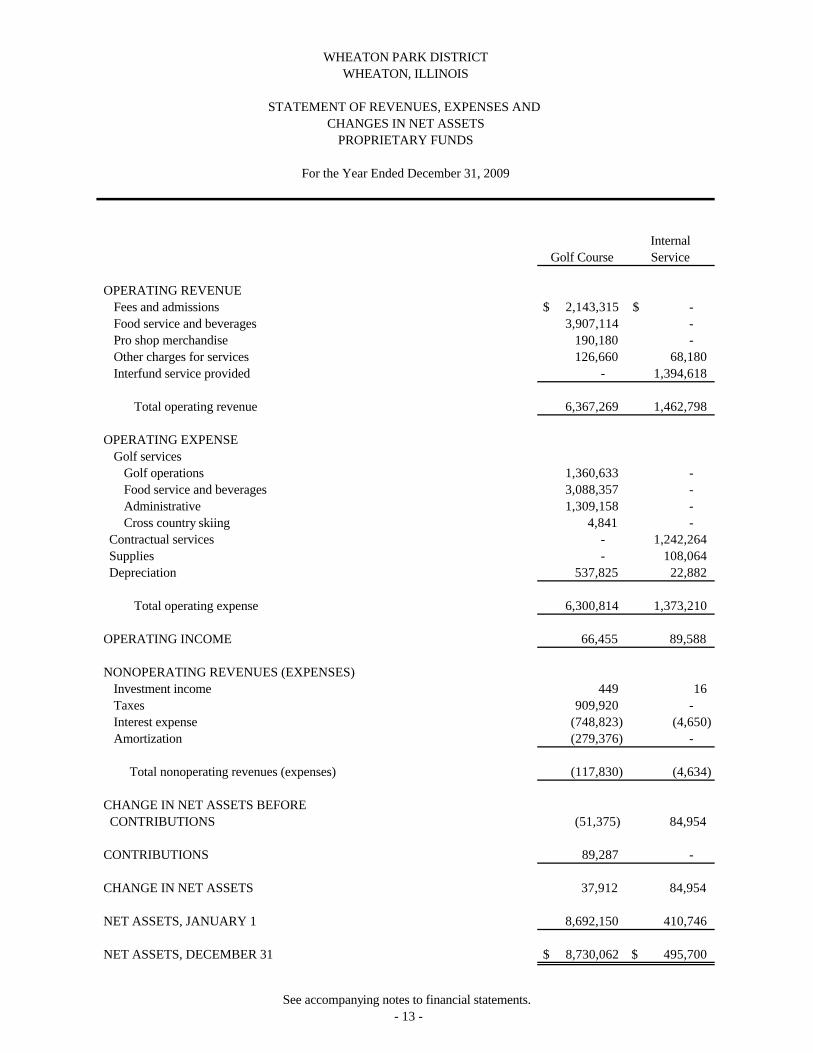
InternalGolf Course Service
OPERATING REVENUE Fees and admissions $ 2,143,315 -$ Food service and beverages 3,907,114 - Pro shop merchandise 190,180 - Other charges for services 126,660 68,180 Interfund service provided - 1,394,618
Total operating revenue 6,367,269 1,462,798
OPERATING EXPENSEGolf services
Golf operations 1,360,633 - Food service and beverages 3,088,357 - Administrative 1,309,158 - Cross country skiing 4,841 -
Contractual services - 1,242,264 Supplies - 108,064 Depreciation 537,825 22,882
Total operating expense 6,300,814 1,373,210
OPERATING INCOME 66,455 89,588
NONOPERATING REVENUES (EXPENSES)Investment income 449 16 Taxes 909,920 - Interest expense (748,823) (4,650) Amortization (279,376) -
Total nonoperating revenues (expenses) (117,830) (4,634)
CHANGE IN NET ASSETS BEFORECONTRIBUTIONS (51,375) 84,954
CONTRIBUTIONS 89,287 -
CHANGE IN NET ASSETS 37,912 84,954
NET ASSETS, JANUARY 1 8,692,150 410,746
NET ASSETS, DECEMBER 31 $ 8,730,062 $ 495,700
PROPRIETARY FUNDS
For the Year Ended December 31, 2009
WHEATON PARK DISTRICTWHEATON, ILLINOIS
STATEMENT OF REVENUES, EXPENSES AND CHANGES IN NET ASSETS
See accompanying notes to financial statements.- 13 -
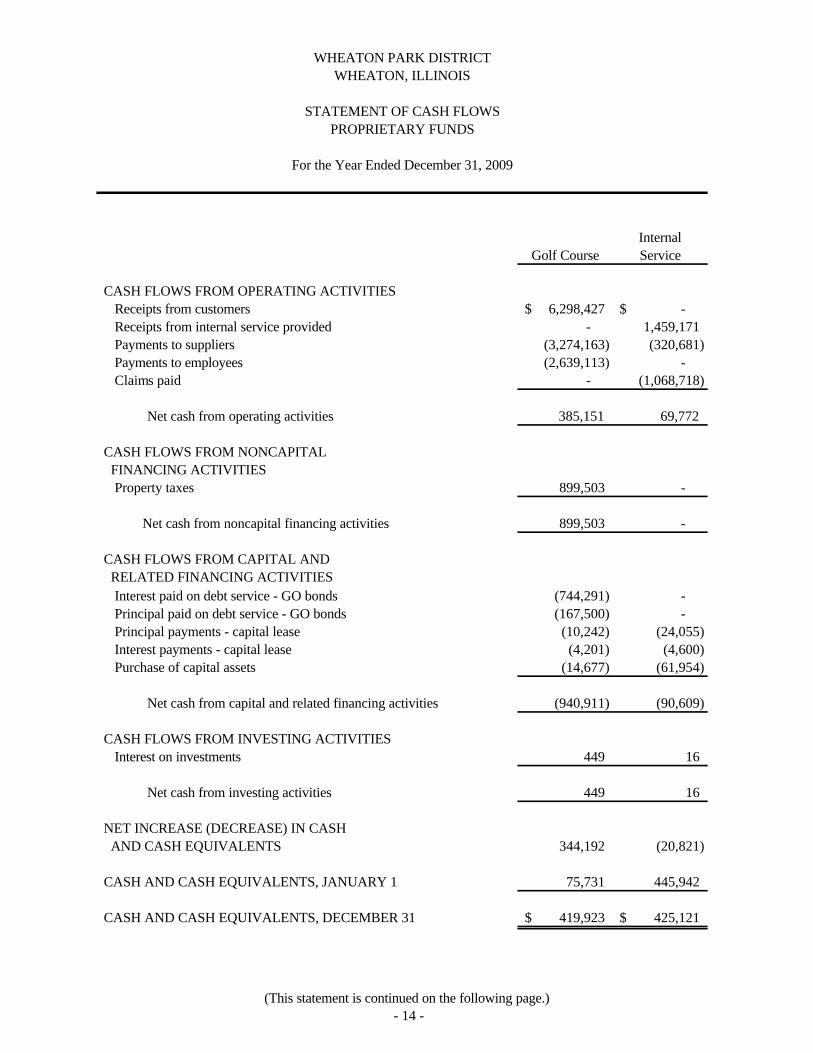
InternalGolf Course Service
CASH FLOWS FROM OPERATING ACTIVITIES
Receipts from customers 6,298,427$ -$ Receipts from internal service provided - 1,459,171 Payments to suppliers (3,274,163) (320,681) Payments to employees (2,639,113) - Claims paid - (1,068,718)
Net cash from operating activities 385,151 69,772
CASH FLOWS FROM NONCAPITAL FINANCING ACTIVITIESProperty taxes 899,503 -
Net cash from noncapital financing activities 899,503 -
CASH FLOWS FROM CAPITAL AND RELATED FINANCING ACTIVITIESInterest paid on debt service - GO bonds (744,291) - Principal paid on debt service - GO bonds (167,500) - Principal payments - capital lease (10,242) (24,055) Interest payments - capital lease (4,201) (4,600) Purchase of capital assets (14,677) (61,954)
Net cash from capital and related financing activities (940,911) (90,609)
CASH FLOWS FROM INVESTING ACTIVITIESInterest on investments 449 16
Net cash from investing activities 449 16
NET INCREASE (DECREASE) IN CASHAND CASH EQUIVALENTS 344,192 (20,821)
CASH AND CASH EQUIVALENTS, JANUARY 1 75,731 445,942
CASH AND CASH EQUIVALENTS, DECEMBER 31 419,923$ 425,121$
For the Year Ended December 31, 2009
WHEATON PARK DISTRICTWHEATON, ILLINOIS
STATEMENT OF CASH FLOWSPROPRIETARY FUNDS
(This statement is continued on the following page.)- 14 -
InternalGolf Course Service
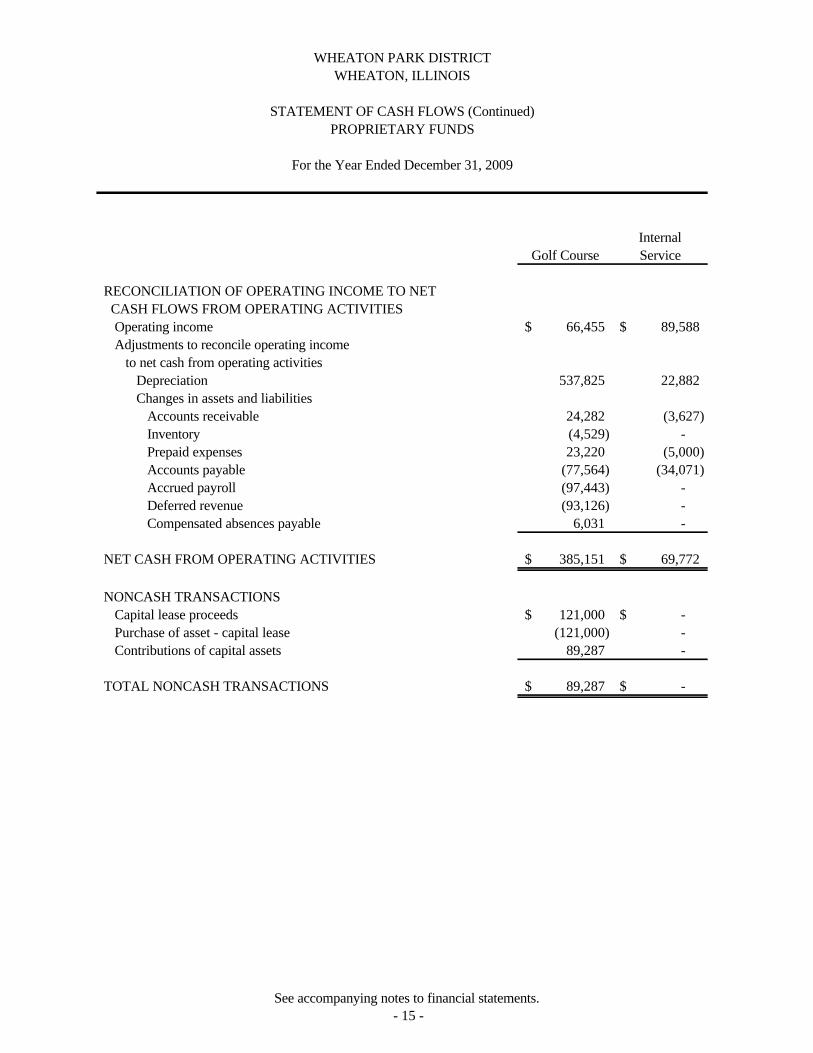
RECONCILIATION OF OPERATING INCOME TO NETCASH FLOWS FROM OPERATING ACTIVITIESOperating income 66,455$ 89,588$ Adjustments to reconcile operating income
to net cash from operating activitiesDepreciation 537,825 22,882 Changes in assets and liabilities
Accounts receivable 24,282 (3,627) Inventory (4,529) - Prepaid expenses 23,220 (5,000) Accounts payable (77,564) (34,071) Accrued payroll (97,443) - Deferred revenue (93,126) - Compensated absences payable 6,031 -
NET CASH FROM OPERATING ACTIVITIES 385,151$ 69,772$
NONCASH TRANSACTIONSCapital lease proceeds 121,000$ -$ Purchase of asset - capital lease (121,000) - Contributions of capital assets 89,287 -
TOTAL NONCASH TRANSACTIONS 89,287$ -$
WHEATON, ILLINOIS
STATEMENT OF CASH FLOWS (Continued)PROPRIETARY FUNDS
For the Year Ended December 31, 2009
WHEATON PARK DISTRICT
See accompanying notes to financial statements.- 15 -
- 16 -
WHEATON PARK DISTRICTWHEATON, ILLINOIS
NOTES TO FINANCIAL STATEMENTS
December 31, 2009
1. SUMMARY OF SIGNIFICANT ACCOUNTING POLICIES
The financial statements of the Wheaton Park District (the District) have been prepared in conformity with accounting principles generally accepted in the United States of America, as applied to government units (hereinafter referred to as generally accepted accounting principles (GAAP)). The Governmental Accounting Standards Board (GASB) is the accepted standard-setting body for establishing governmental accounting and financial reporting principles. The more significant of the District’s accounting policies are described below.
a. Reporting Entity
The District is a body corporate and politic established under Illinois Compiled Statutes (ILCS). The District is considered to be a primary government as defined by GASB Statement No. 14, since it is legally separate and fiscally independent.
The District participates with other park districts in the organization known as West DuPage Special Recreation Association (WDSRA). WDSRA is governed by a board appointed equally by the member districts. The District levies property taxes in the Special Recreation Fund to provide for its share of the cost of the operations of WDSRA. WDSRA is considered to be a jointly governed organization of the memberdistricts. During the year ended December 31, 2009, the District contributed $1,685,635 to WDSRA.
Discretely Presented Component Unit
The District has determined that the Cosley Foundation, Inc. meets the requirements of GASB Statement No. 39, Determining Whether Certain Organizations Are Component Units, an amendment of GASB Statement 14, which has resulted in the Cosley Foundation, Inc. (the Foundation) being reported as a discretely presented component unit of the District as it is legally separate from the District. Separate financial statements of the Foundation are available by contacting the Administrative Office of the Wheaton Park District, 102 E. Wesley Street, Wheaton, Illinois 60187.
WHEATON PARK DISTRICT WHEATON, ILLINOISNOTES TO FINANCIAL STATEMENTS (Continued)
- 17 -
1. SUMMARY OF SIGNIFICANT ACCOUNTING POLICIES (Continued)
b. Fund Accounting
The District uses funds to report on its financial position and the changes in its financial position. Fund accounting is designed to demonstrate legal compliance and to aid financial management by segregating transactions related to certain governmental functions or activities. A fund is a separate accounting entity with a self-balancing set of accounts.
Funds are classified into the following categories: governmental, proprietary and fiduciary.
Governmental funds are used to account for all or most of a government’s general activities, including the collection and disbursement of earmarked monies (special revenue funds), the acquisition or construction of capital assets (capital projects funds) and the servicing of governmental long-term debt (debt service funds). The general (corporate) fund is used to account for all activities of the government not accounted for in some other fund.
Proprietary funds are used to account for activities similar to those found in the private sector, where the determination of net income is necessary or useful to sound financial administration. Goods or services from such activities can be provided eitherto outside parties (enterprise funds) or to other departments or agencies primarily within the District (internal service funds). Pursuant to GASB Statement No. 20, Accounting and Financial Reporting for Proprietary Funds, the District has chosen to apply all GASB pronouncements as well as those FASB pronouncements issued on or before November 30, 1989 to account for its enterprise funds. The District has no fiduciary funds.
c. Government-Wide and Fund Financial Statements
The government-wide financial statements (i.e., the statement of net assets and the statement of activities) report information on all of the nonfiduciary activities of the District. The effect of material interfund activity has been eliminated from these statements. Governmental activities, which normally are supported by taxes and intergovernmental revenues, are reported separately from business-type activities, which rely to a significant extent on user fees and charges for support.
WHEATON PARK DISTRICT WHEATON, ILLINOISNOTES TO FINANCIAL STATEMENTS (Continued)
- 18 -
1. SUMMARY OF SIGNIFICANT ACCOUNTING POLICIES (Continued)
c. Government-Wide and Fund Financial Statements (Continued)
The statement of activities demonstrates the degree to which the direct expenses of a given function, segment or program are offset by program revenues. Direct expenses are those that are clearly identifiable with a specific function or segment. Program revenues include 1) charges to customers or applicants who purchase, use or directly benefit from goods, services or privileges provided by a given function or segment and 2) grants and contributions that are restricted to meeting the operational or capital requirements of a particular function or segment. Taxes and other items not properly included among program revenues are reported instead as general revenues. Contributions of land by developers under land/cash ordinances, if any, are reported as general revenues - contributions on the statement of activities.
Separate financial statements are provided for governmental funds, proprietary funds and, if applicable, fiduciary funds, even though the latter are excluded from the government-wide financial statements. Major individual governmental funds are reported as separate columns in the fund financial statements.
The District reports the following major governmental funds:
The General Fund is the general operating fund of the District. It is used to account for all financial resources not accounted for and reported in another fund.
The Recreation Fund is used to account for revenue and expenditures related to recreation programs funded by a tax levy and user fees.
The Cosley Zoo Fund is used to account for the activities of the Cosley Zoo. The District has elected to report this fund as a major fund.
The Debt Service Fund is used to account for the accumulation of resources for and the payment of principal and interest on governmental activities long-term debt.
The Capital Projects Fund is used to account for the cost of park land acquisition and development including transfers to the Debt Service Fund for principal and interest payments for capital projects funded by bond issues. Financing is provided by the sale of various general obligation bonds issues and internal and grant funding.
WHEATON PARK DISTRICT WHEATON, ILLINOISNOTES TO FINANCIAL STATEMENTS (Continued)
- 19 -
1. SUMMARY OF SIGNIFICANT ACCOUNTING POLICIES (Continued)
c. Government-Wide and Fund Financial Statements (Continued)
The District reports the following major proprietary fund:
The Golf Course Fund accounts for the operation of the Arrowhead Golf Course and Clubhouse. Operations include greens fees, driving range, lessons, banquets, rentals and food and beverage sales. The cost of operations is recovered through user charges.
The District reports the following internal service funds:
The Information Systems and Telecommunications Fund accounts for the costs related to the maintenance and capital expenditures for the District’s information systems and related telecommunications.
The Insurance Fund accounts for the health insurance costs of the employees of the District.
d. Measurement Focus, Basis of Accounting and Financial Statement Presentation
The government-wide financial statements are reported using the economic resources measurement focus and the accrual basis of accounting, as are the proprietary fund financial statements. With this measurement focus, all assets and all liabilities associated with the operation of these activities/funds are included on the statement of net assets. Revenues are recorded when earned and expenses are recorded when a liability is incurred. Property taxes are recognized as revenues in the year for which they are levied (i.e., intended to finance). Grants and similar items are recognized as revenue as soon as all eligibility requirements imposed by the provider have been met. Operating revenues and expenses are directly attributable to the operation of the proprietary funds. Nonoperating revenue/expenses are incidental to the operations of these funds.
Governmental fund financial statements are reported using the current financial resources measurement focus and the modified accrual basis of accounting. With this measurement focus, only current assets and current liabilities generally are included on the balance sheet. Operating statements of these funds present increases (i.e., revenues and other financing sources) and decreases (i.e., expenditures and other financing uses) in net current assets.
WHEATON PARK DISTRICT WHEATON, ILLINOISNOTES TO FINANCIAL STATEMENTS (Continued)
- 20 -
1. SUMMARY OF SIGNIFICANT ACCOUNTING POLICIES (Continued)
d. Measurement Focus, Basis of Accounting and Financial Statement Presentation (Continued)
Under the modified accrual basis of accounting, revenues are recognized when susceptible to accrual (i.e., when they become both measurable and available). Measurable means the amount of the transaction can be determined and available means collectible within the current period or soon enough thereafter to be used to pay liabilities of the current period (60 days). The District recognizes property taxes when they become both measurable and available in the year intended to finance. Expenditures are recorded when the related liability is incurred. Principal and interest on general long-term debt are recorded as expenditures when they become due.
Those revenues susceptible to accrual are property taxes, interest revenue, grants and charges for services.
The District reports unearned/deferred revenue on its financial statements. Unearned/deferred revenues arise when potential revenue does not meet both the measurable and available criteria for recognition in the current period for governmental funds or earned at the government-wide level. Unearned/deferred revenues also arise when resources are received by the District before it has legal claim to them as when grant monies are received prior to the incurrence of qualifying expenditures. In subsequent periods, when revenue recognition criteria are met, or when the District has a legal claim to the resources by meeting all eligibility requirements, the liability for unearned/deferred revenue is removed from the financial statements and revenue is recognized.
e. Cash Equivalents
For purposes of the statement of cash flows, the Enterprise Fund considers all highly liquid investments with a maturity of three months or less when purchased to be cash equivalents.
f. Investments
The District’s investments are recorded at fair value, except for nonnegotiable certificates of deposits, if any, which are reported at cost. Fair value is based on published market prices as of December 31, 2009.
g. Inventories
Inventories consist of amounts available for resale and are accounted for using the consumption method. Inventories are valued at cost on the average cost method.
WHEATON PARK DISTRICT WHEATON, ILLINOISNOTES TO FINANCIAL STATEMENTS (Continued)
- 21 -
1. SUMMARY OF SIGNIFICANT ACCOUNTING POLICIES (Continued)
h. Prepaid Expenses/Items
Certain payments to vendors reflect costs applicable to future accounting periods, and are recorded as prepaid expenses/items. Such amounts are offset by fund balance reserved for prepaid items in the fund financial statements.
i. Capital Assets
Capital assets, which include property, plant, equipment and infrastructure assets (e.g., bike trails, paths and similar items) are reported in the applicable governmental activities column in the government-wide financial statements. Capital assets are defined by the District as assets with an initial, individual cost of more than $5,000 and an estimated useful life in excess of one year. Such assets are reported at historical cost or estimated historical cost if purchased or constructed. Donated capital assets are recorded at estimated fair market value at the date of donation.
The costs of normal maintenance and repairs that do not add to the value of the asset or materially extend asset lives are not capitalized.
Major outlays for capital assets and improvements are capitalized as projects are constructed. Interest incurred during the construction phase of capital assets is not included as part of the capitalized value of the assets constructed. Property, plant and equipment is depreciated using the straight-line method over the following estimated useful lives:
Assets Years
Land improvements 10-20Buildings 10-30Automobiles 3-10Equipment 3-10
j. Long-Term Obligations
In the government-wide financial statements and the proprietary fund in the fund financial statements, long-term debt and other long-term obligations are reported as liabilities in the applicable governmental activities or proprietary fund financial statements. Bond premiums and discounts, as well as issuance costs and loss on refundings, are deferred and amortized over the life of the bonds. Bonds payable are reported net of the applicable bond premium or discount and loss on refundings. Bond issuance costs are reported as deferred charges and amortized over the term of the related debt.
WHEATON PARK DISTRICT WHEATON, ILLINOISNOTES TO FINANCIAL STATEMENTS (Continued)
- 22 -
1. SUMMARY OF SIGNIFICANT ACCOUNTING POLICIES (Continued)
j. Long-Term Obligations (Continued)
In the fund financial statements, governmental funds recognize bond premiums and discounts, as well as bond issuance costs and loss on refundings, during the current period. The face amount of debt issued is reported as other financing sources. Premiums received on debt issuances are reported as other financing sources while discounts and loss on refundings on debt issuances are reported as other financing uses. Issuance costs, whether or not withheld from the actual debt proceeds received, are reported as expenditures.
k. Accrued Compensated Absences
Accumulated unpaid vacation pay is accrued by the District on the statement of net assets and the proprietary fund financial statements. Employees who work a 12-month year are entitled to compensated vacation time. Vacations are usually taken within the anniversary year of each employee. The liability for accumulated unpaid vacation pay is based upon accumulated days at December 31, 2009, times the currentpay rate (including certain benefits) for each employee.
All full-time employees receive one sick day per month. Unused sick leave days accumulate to a maximum of 30 days for full-time personnel. The District does not reimburse employees for unused sick days remaining upon termination of employment. Employees can receive an annual payout for unused sick days up to a maximum of six days per year. Therefore, no accrual has been made for sick leave as sick leave does not vest or accumulate.
l. Net Assets/Fund Balance
In the fund financial statements, governmental funds report nonspendable fund balance for amounts that are either not in spendable form or legally or contractually required to be maintained intact. Restrictions of fund balance are reported for amounts constrained by legal restrictions from outside parties for use for a specific purpose, or externally imposed by outside entities. None of the restricted fund balance result from enabling legislation adopted by the District. Committed fund balance is constrained by formal actions of the District’s Board of Commissioners, which is considered the District’s highest level of decision making authority. Formal actions include resolutions and ordinances approved by the Board. Assigned fund balance represents amounts constrained by the District’s intent to use them for a specific purpose. The authority to assign fund balance has been delegated to the District’s executive director through the approved fund balance policy of the District. Any residual fund balance is reported as unassigned.
WHEATON PARK DISTRICT WHEATON, ILLINOISNOTES TO FINANCIAL STATEMENTS (Continued)
- 23 -
1. SUMMARY OF SIGNIFICANT ACCOUNTING POLICIES (Continued)
l. Net Assets/Fund Balance (Continued)
The District’s flow of funds assumption prescribes that the funds with the highest level of constraint are expended first. If restricted or unrestricted funds are available for spending, the restricted funds are spent first. Additionally, if different levels of unrestricted funds are available for spending the District considers committed funds to be expended first followed by assigned and then unassigned funds.
The District has established fund balance reserve policies for their governmental funds. The General Fund targets three to four months of operating expenditures as unassigned fund balance. The Recreation Fund targets a minimum of two months of operating expenditures as unrestricted fund balance. The Cosley Zoo, Retirement, Liability Insurance and Audit Funds target a range of three to six months of operating expenditures in fund balance. The Debt Service, Capital Projects, Special Recreation and Paving and Lighting funds do not have established fund balance limits due to the nature of the transactions accounted for in these funds.
In the government-wide financial statements, restricted net assets are legally restricted by outside parties for a specific purpose. Invested in capital assets, net of related debt, represents the District’s investment in the book value of capital assets, less anyoutstanding debt that was issued to construct or acquire the capital asset.
m. Interfund Transactions
Internal services transactions are accounted for as revenues, expenditures or expenses. Transactions that constitute reimbursements to a fund for expenditures/expenses initially made from it that are properly applicable to another fund, are recorded as expenditures/expenses in the reimbursing fund and as reductions of expenditures/expenses in the fund that is reimbursed.
All other interfund transactions, except internal services transactions and reimbursements, are reported as transfers.
n. Interfund Receivables/Payables
Activity between funds that are representative of lending/borrowing arrangements outstanding at the end of the fiscal year are referred to as either “due to/from other funds” (i.e., the current portion of interfund loans) or “advances to/from other funds” (i.e., the noncurrent portion of interfund loans). All other outstanding balances between funds are reported as “due to/from other funds.”
WHEATON PARK DISTRICT WHEATON, ILLINOISNOTES TO FINANCIAL STATEMENTS (Continued)
- 24 -
2. DEPOSITS AND INVESTMENTS
The District’s investment policy authorizes the District to make deposits/invest in insured commercial banks, savings and loan institutions, obligations of the U.S. Treasury and U.S. agencies, interest-bearing certificates of deposit, institution money market funds, interest-bearing savings and money market accounts, included Illinois Funds, time deposits, commercial paper, corporate debt obligations, repurchase agreements, asset-backed securities and mortgage-backed securities and Illinois Funds.
Illinois Funds is an investment pool managed by the State of Illinois, Office of the Treasurer, which allows governments within the state to pool their funds for investment purposes. Illinois Funds is not registered with the SEC as an investment company, but does operate in a manner consistent with Rule 2a7 of the Investment Company Act of 1940. Investments in Illinois Funds are valued at Illinois Funds’ share price, which is the price for which the investment could be sold.
It is the policy of the District to invest its funds in a manner which will provide the highest investment return with the maximum security while meeting the daily cash flow demands of the District and conforming to all state and local statutes governing the investment of public funds, using the “prudent person” standard for managing the overall portfolio. The primary objective of the policy is safety (protection of investment principal), liquidity and yield.
Deposits
Custodial credit risk for deposits with financial institutions is the risk that in the event of a bank’s failure, the District’s deposits may not be returned to it. The District’s investment policy requires pledging of collateral with a fair value of 110% of all bank balances in excess of federal depository insurance with the collateral held by the District or an agent of the District witnessed by a safekeeping receipt.
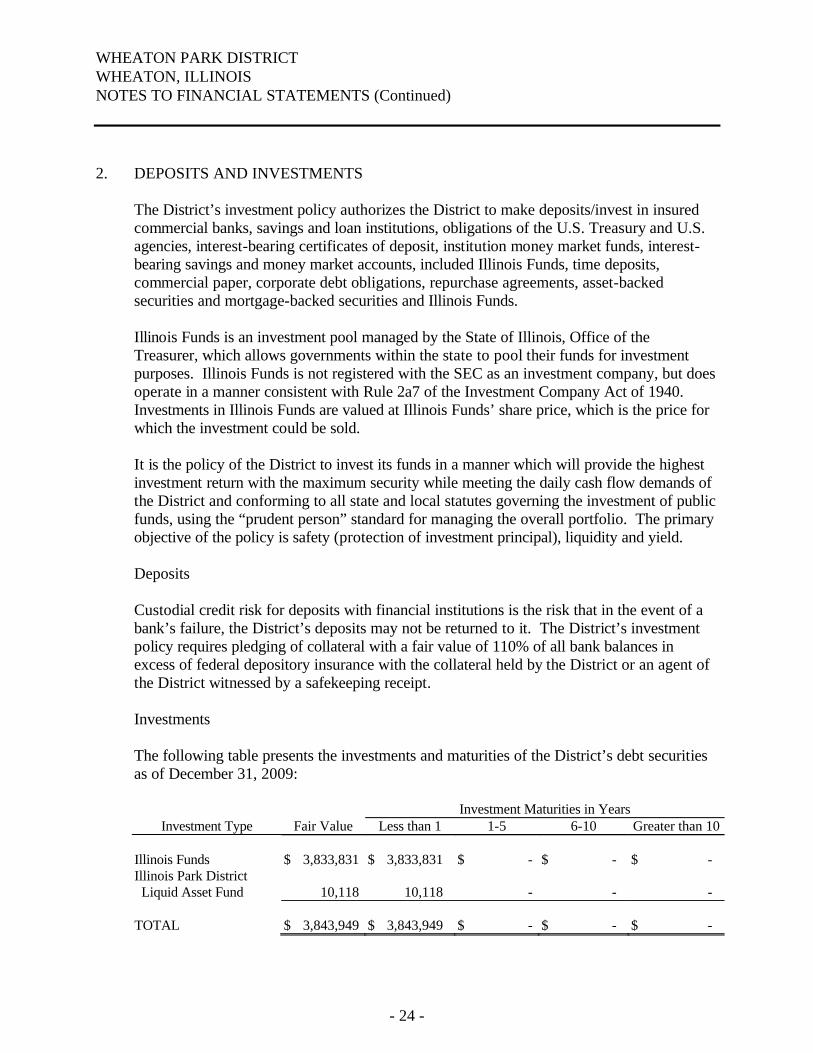
Investments
The following table presents the investments and maturities of the District’s debt securities as of December 31, 2009:
Investment Maturities in YearsInvestment Type Fair Value Less than 1 1-5 6-10 Greater than 10
Illinois Funds $ 3,833,831 $ 3,833,831 $ - $ - $ -Illinois Park District Liquid Asset Fund 10,118 10,118 - - -
TOTAL $ 3,843,949 $ 3,843,949 $ - $ - $ -
WHEATON PARK DISTRICT WHEATON, ILLINOISNOTES TO FINANCIAL STATEMENTS (Continued)
- 25 -
2. DEPOSITS AND INVESTMENTS (Continued)
In accordance with its investment policy, the District limits its exposure to interest rate risk by structuring the portfolio to provide liquidity for operating funds and maximizing yields for funds not needed within a three-year period. The investment policy limits the maximum maturity length of investments for nonasset-backed securities to three years from date of purchase. Asset-backed securities must have a weighted average maturity of less than three years. The maximum weighted average maturity for all of the District’s investments may not exceed 18 months.
The District limits its exposure to credit risk, the risk that the issuer of a debt security will not pay its par value upon maturity by requiring investments with short-term ratings to be rated at least P01, A-1 or F1 by one of the three major rating agencies. All issues with long-term ratings must have at least one rating that is at least A2 or the equivalent. The minimum average credit quality of the portfolio must not be below AA- or the equivalent. Illinois Funds and Illinois Park District Liquid Asset Fund are rated AAA.
Custodial credit risk for investments is the risk that, in the event of the failure of the counterparty to the investment, the District will not be able to recover the value of its investments that are in possession of an outside party. The District’s investment policy does not address custodial credit risk.
Concentration of credit risk - The District’s investment policy requires diversification to avoid unreasonable risk and provides the following requirements. Single issuers are limited to 5% of the total market value of the portfolio, with the exception of US Treasury and agency securities, tri-party repurchase agreements and money market mutual funds which are exempted from this limit. Corporate debt obligations may not exceed 50% of the total market value and asset-backed securities shall not exceed 40% of the total market value of the portfolio.
3. PROPERTY TAX CALENDAR
The following information gives significant dates on the property tax calendar of the District.
• The property tax lien date is January 1;
• The annual tax levy ordinance for 2008 was passed December 17, 2008;
• Property taxes are due to the County Collector in two installments, June 1 and September 1;
• Property taxes for 2008 are normally received semi-annually in June and September of 2009 and monthly in July, August, October, November and December of 2009.
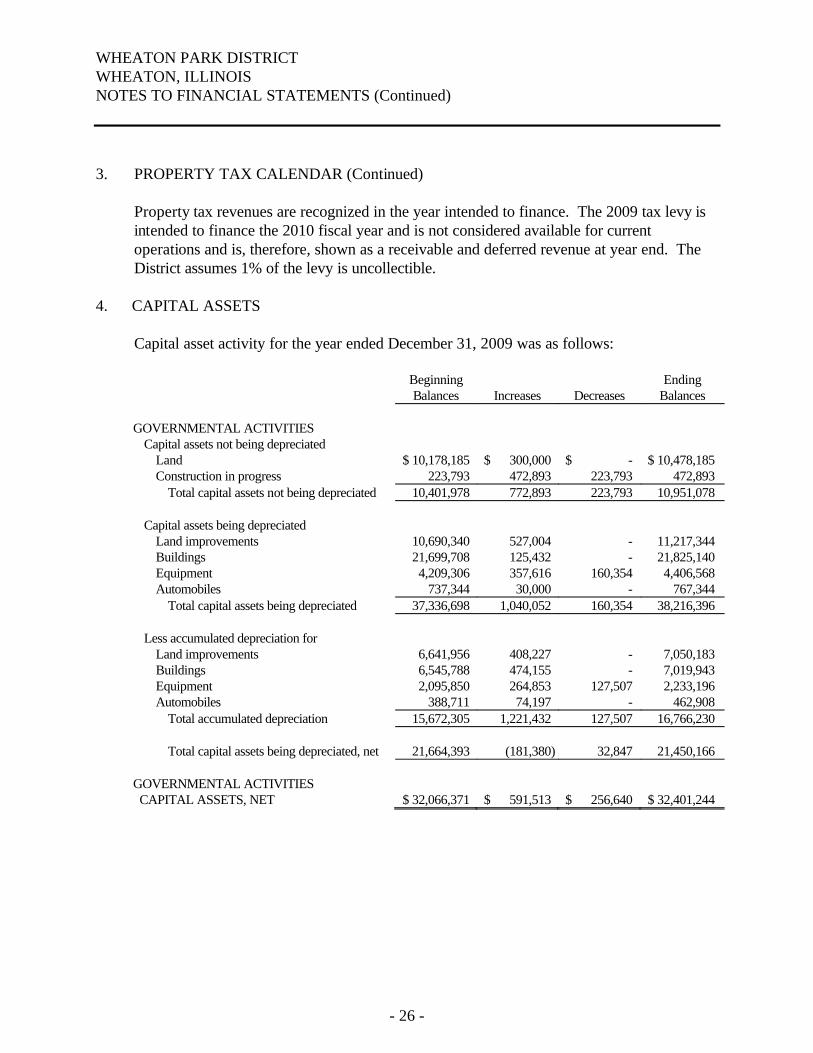
WHEATON PARK DISTRICT WHEATON, ILLINOISNOTES TO FINANCIAL STATEMENTS (Continued)
- 26 -
3. PROPERTY TAX CALENDAR (Continued)
Property tax revenues are recognized in the year intended to finance. The 2009 tax levy is intended to finance the 2010 fiscal year and is not considered available for current operations and is, therefore, shown as a receivable and deferred revenue at year end. The District assumes 1% of the levy is uncollectible.
4. CAPITAL ASSETS
Capital asset activity for the year ended December 31, 2009 was as follows:
Beginning EndingBalances Increases Decreases Balances
GOVERNMENTAL ACTIVITIESCapital assets not being depreciated
Land $ 10,178,185 $ 300,000 $ - $ 10,478,185Construction in progress 223,793 472,893 223,793 472,893
Total capital assets not being depreciated 10,401,978 772,893 223,793 10,951,078
Capital assets being depreciatedLand improvements 10,690,340 527,004 - 11,217,344Buildings 21,699,708 125,432 - 21,825,140Equipment 4,209,306 357,616 160,354 4,406,568Automobiles 737,344 30,000 - 767,344
Total capital assets being depreciated 37,336,698 1,040,052 160,354 38,216,396
Less accumulated depreciation forLand improvements 6,641,956 408,227 - 7,050,183Buildings 6,545,788 474,155 - 7,019,943Equipment 2,095,850 264,853 127,507 2,233,196Automobiles 388,711 74,197 - 462,908
Total accumulated depreciation 15,672,305 1,221,432 127,507 16,766,230
Total capital assets being depreciated, net 21,664,393 (181,380) 32,847 21,450,166
GOVERNMENTAL ACTIVITIES CAPITAL ASSETS, NET $ 32,066,371 $ 591,513 $ 256,640 $ 32,401,244
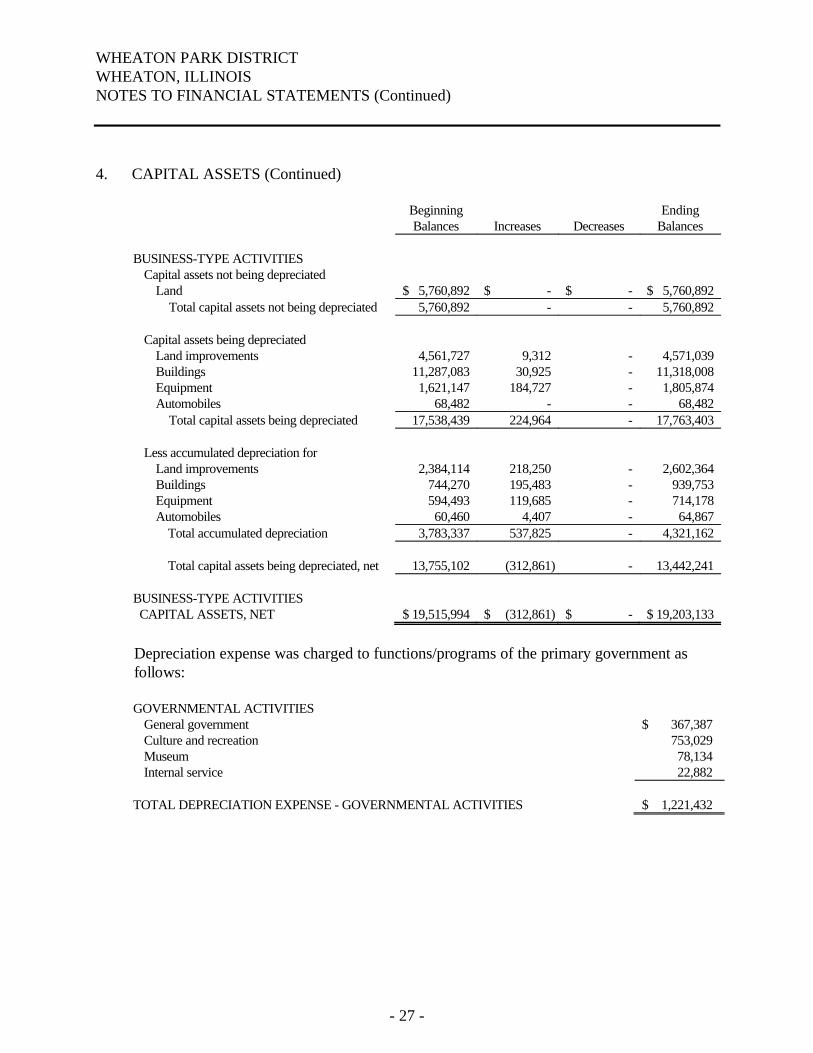
WHEATON PARK DISTRICT WHEATON, ILLINOISNOTES TO FINANCIAL STATEMENTS (Continued)
- 27 -
4. CAPITAL ASSETS (Continued)
Beginning EndingBalances Increases Decreases Balances
BUSINESS-TYPE ACTIVITIESCapital assets not being depreciated
Land $ 5,760,892 $ - $ - $ 5,760,892Total capital assets not being depreciated 5,760,892 - - 5,760,892
Capital assets being depreciatedLand improvements 4,561,727 9,312 - 4,571,039Buildings 11,287,083 30,925 - 11,318,008Equipment 1,621,147 184,727 - 1,805,874Automobiles 68,482 - - 68,482
Total capital assets being depreciated 17,538,439 224,964 - 17,763,403
Less accumulated depreciation forLand improvements 2,384,114 218,250 - 2,602,364Buildings 744,270 195,483 - 939,753Equipment 594,493 119,685 - 714,178Automobiles 60,460 4,407 - 64,867
Total accumulated depreciation 3,783,337 537,825 - 4,321,162
Total capital assets being depreciated, net 13,755,102 (312,861) - 13,442,241
BUSINESS-TYPE ACTIVITIES CAPITAL ASSETS, NET $ 19,515,994 $ (312,861) $ - $ 19,203,133
Depreciation expense was charged to functions/programs of the primary government as follows:
GOVERNMENTAL ACTIVITIESGeneral government $ 367,387Culture and recreation 753,029Museum 78,134Internal service 22,882
TOTAL DEPRECIATION EXPENSE - GOVERNMENTAL ACTIVITIES $ 1,221,432
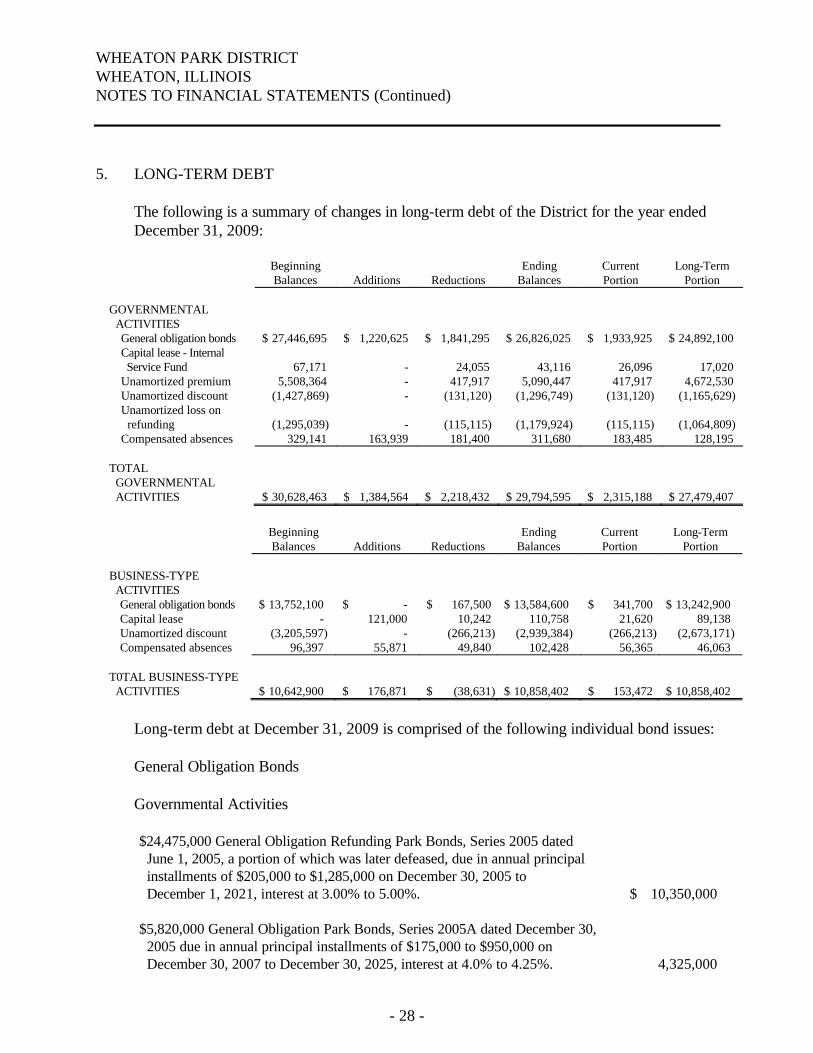
WHEATON PARK DISTRICT WHEATON, ILLINOISNOTES TO FINANCIAL STATEMENTS (Continued)
- 28 -
5. LONG-TERM DEBT
The following is a summary of changes in long-term debt of the District for the year endedDecember 31, 2009:
BeginningBalances Additions Reductions
EndingBalances
CurrentPortion
Long-TermPortion
GOVERNMENTAL ACTIVITIES
General obligation bonds $ 27,446,695 $ 1,220,625 $ 1,841,295 $ 26,826,025 $ 1,933,925 $ 24,892,100Capital lease - Internal Service Fund 67,171 - 24,055 43,116 26,096 17,020
Unamortized premium 5,508,364 - 417,917 5,090,447 417,917 4,672,530Unamortized discount (1,427,869) - (131,120) (1,296,749) (131,120) (1,165,629)Unamortized loss on
refunding (1,295,039) - (115,115) (1,179,924) (115,115) (1,064,809)Compensated absences 329,141 163,939 181,400 311,680 183,485 128,195
TOTAL GOVERNMENTAL ACTIVITIES $ 30,628,463 $ 1,384,564 $ 2,218,432 $ 29,794,595 $ 2,315,188 $ 27,479,407
BeginningBalances Additions Reductions
EndingBalances
CurrentPortion
Long-TermPortion
BUSINESS-TYPE ACTIVITIES
General obligation bonds $ 13,752,100 $ - $ 167,500 $ 13,584,600 $ 341,700 $ 13,242,900Capital lease - 121,000 10,242 110,758 21,620 89,138Unamortized discount (3,205,597) - (266,213) (2,939,384) (266,213) (2,673,171)Compensated absences 96,397 55,871 49,840 102,428 56,365 46,063
T0TAL BUSINESS-TYPE ACTIVITIES $ 10,642,900 $ 176,871 $ (38,631) $ 10,858,402 $ 153,472 $ 10,858,402
Long-term debt at December 31, 2009 is comprised of the following individual bond issues:
General Obligation Bonds
Governmental Activities
$24,475,000 General Obligation Refunding Park Bonds, Series 2005 dated June 1, 2005, a portion of which was later defeased, due in annual principal installments of $205,000 to $1,285,000 on December 30, 2005 to December 1, 2021, interest at 3.00% to 5.00%. $ 10,350,000
$5,820,000 General Obligation Park Bonds, Series 2005A dated December 30, 2005 due in annual principal installments of $175,000 to $950,000 on December 30, 2007 to December 30, 2025, interest at 4.0% to 4.25%. 4,325,000
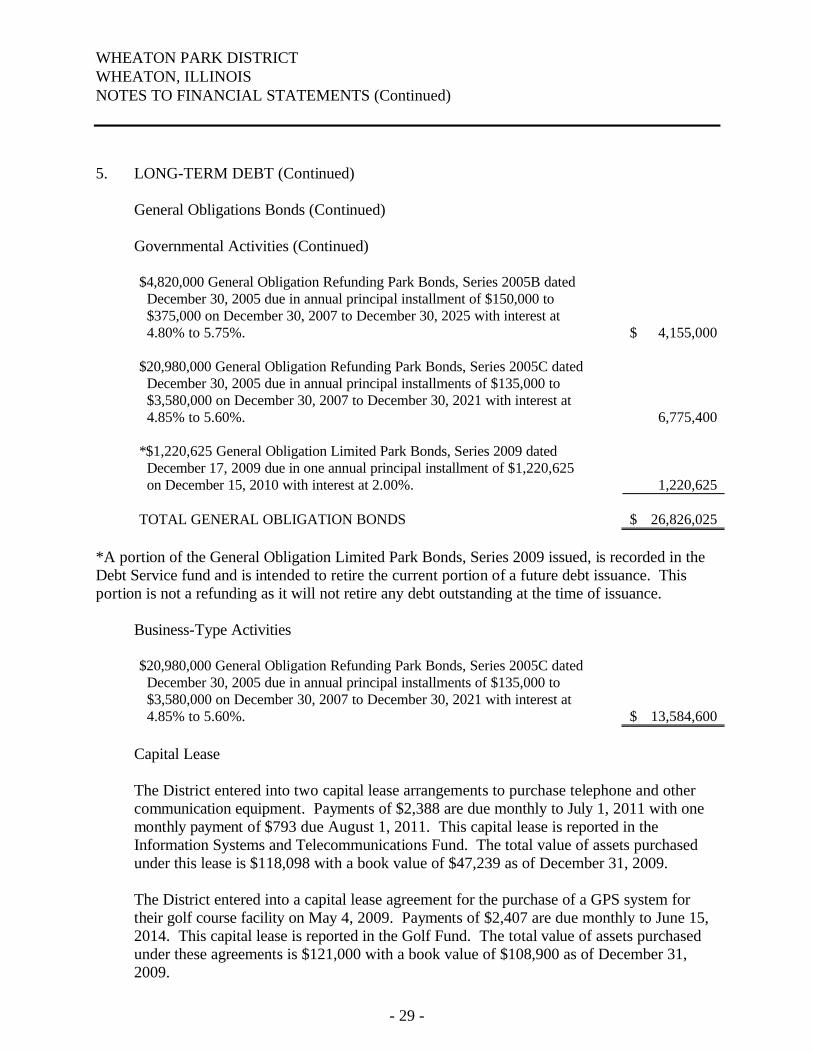
WHEATON PARK DISTRICT WHEATON, ILLINOISNOTES TO FINANCIAL STATEMENTS (Continued)
- 29 -
5. LONG-TERM DEBT (Continued)
General Obligations Bonds (Continued)
Governmental Activities (Continued)
$4,820,000 General Obligation Refunding Park Bonds, Series 2005B dated December 30, 2005 due in annual principal installment of $150,000 to $375,000 on December 30, 2007 to December 30, 2025 with interest at4.80% to 5.75%. $ 4,155,000
$20,980,000 General Obligation Refunding Park Bonds, Series 2005C dated December 30, 2005 due in annual principal installments of $135,000 to $3,580,000 on December 30, 2007 to December 30, 2021 with interest at 4.85% to 5.60%. 6,775,400
*$1,220,625 General Obligation Limited Park Bonds, Series 2009 dated December 17, 2009 due in one annual principal installment of $1,220,625on December 15, 2010 with interest at 2.00%. 1,220,625
TOTAL GENERAL OBLIGATION BONDS $ 26,826,025
*A portion of the General Obligation Limited Park Bonds, Series 2009 issued, is recorded in the Debt Service fund and is intended to retire the current portion of a future debt issuance. This portion is not a refunding as it will not retire any debt outstanding at the time of issuance.
Business-Type Activities
$20,980,000 General Obligation Refunding Park Bonds, Series 2005C dated December 30, 2005 due in annual principal installments of $135,000 to $3,580,000 on December 30, 2007 to December 30, 2021 with interest at 4.85% to 5.60%. $ 13,584,600
Capital Lease
The District entered into two capital lease arrangements to purchase telephone and other communication equipment. Payments of $2,388 are due monthly to July 1, 2011 with one monthly payment of $793 due August 1, 2011. This capital lease is reported in the Information Systems and Telecommunications Fund. The total value of assets purchased under this lease is $118,098 with a book value of $47,239 as of December 31, 2009.
The District entered into a capital lease agreement for the purchase of a GPS system for their golf course facility on May 4, 2009. Payments of $2,407 are due monthly to June 15, 2014. This capital lease is reported in the Golf Fund. The total value of assets purchased under these agreements is $121,000 with a book value of $108,900 as of December 31, 2009.
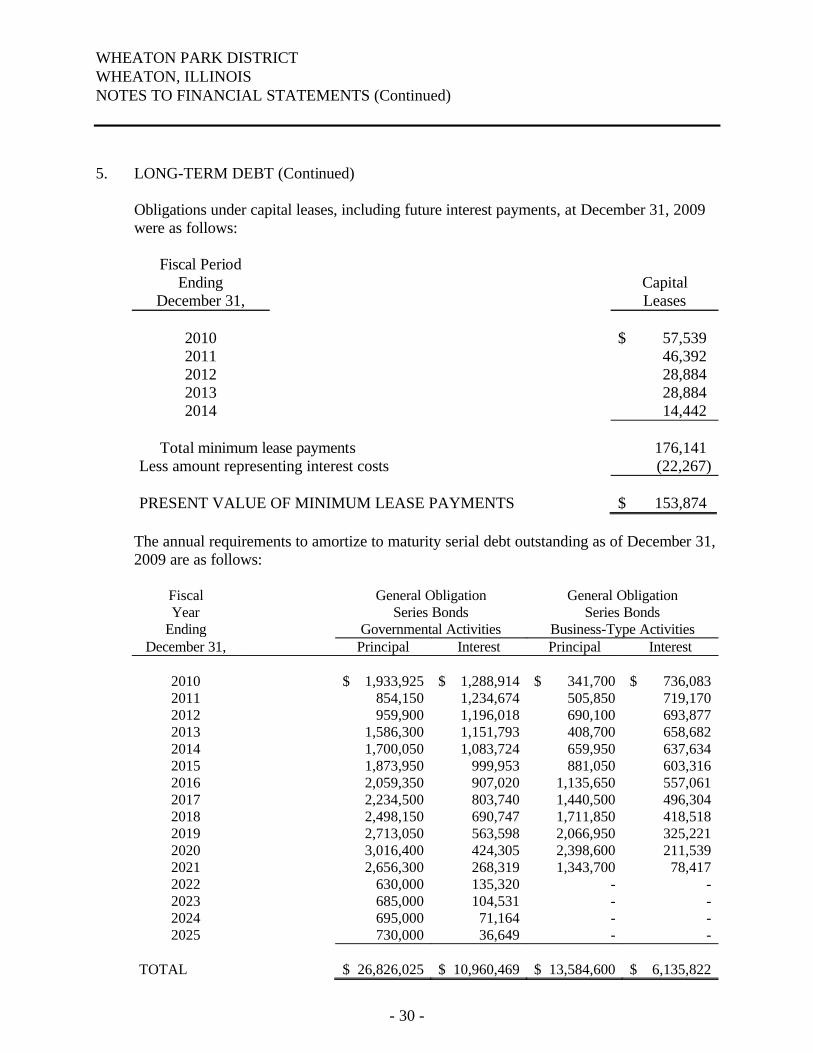
WHEATON PARK DISTRICT WHEATON, ILLINOISNOTES TO FINANCIAL STATEMENTS (Continued)
- 30 -
5. LONG-TERM DEBT (Continued)
Obligations under capital leases, including future interest payments, at December 31, 2009were as follows:
Fiscal PeriodEnding Capital
December 31, Leases
2010 $ 57,5392011 46,3922012 28,8842013 28,8842014 14,442
Total minimum lease payments 176,141Less amount representing interest costs (22,267)
PRESENT VALUE OF MINIMUM LEASE PAYMENTS $ 153,874
The annual requirements to amortize to maturity serial debt outstanding as of December 31, 2009 are as follows:
FiscalYear
Ending
General ObligationSeries Bonds
Governmental Activities
General ObligationSeries Bonds
Business-Type ActivitiesDecember 31, Principal Interest Principal Interest
2010 $ 1,933,925 $ 1,288,914 $ 341,700 $ 736,0832011 854,150 1,234,674 505,850 719,1702012 959,900 1,196,018 690,100 693,8772013 1,586,300 1,151,793 408,700 658,6822014 1,700,050 1,083,724 659,950 637,6342015 1,873,950 999,953 881,050 603,3162016 2,059,350 907,020 1,135,650 557,0612017 2,234,500 803,740 1,440,500 496,3042018 2,498,150 690,747 1,711,850 418,5182019 2,713,050 563,598 2,066,950 325,2212020 3,016,400 424,305 2,398,600 211,5392021 2,656,300 268,319 1,343,700 78,4172022 630,000 135,320 - -2023 685,000 104,531 - -2024 695,000 71,164 - -2025 730,000 36,649 - -
TOTAL $ 26,826,025 $ 10,960,469 $ 13,584,600 $ 6,135,822
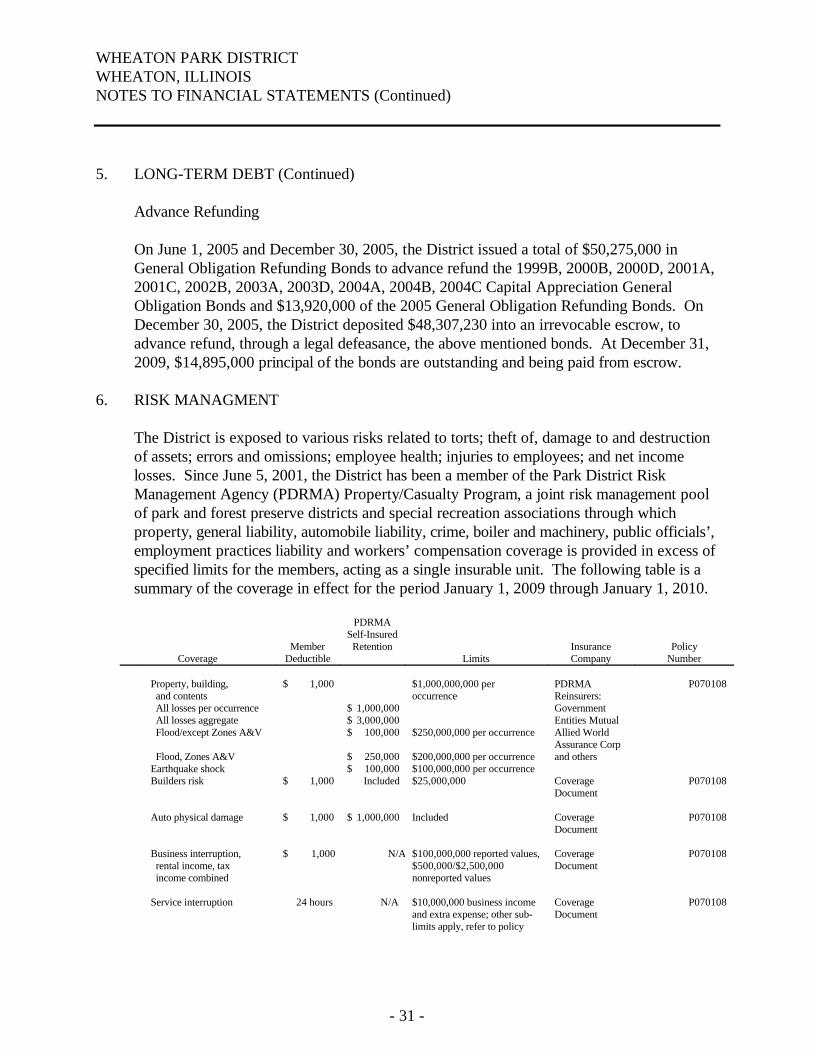
WHEATON PARK DISTRICT WHEATON, ILLINOISNOTES TO FINANCIAL STATEMENTS (Continued)
- 31 -
5. LONG-TERM DEBT (Continued)
Advance Refunding
On June 1, 2005 and December 30, 2005, the District issued a total of $50,275,000 in General Obligation Refunding Bonds to advance refund the 1999B, 2000B, 2000D, 2001A, 2001C, 2002B, 2003A, 2003D, 2004A, 2004B, 2004C Capital Appreciation General Obligation Bonds and $13,920,000 of the 2005 General Obligation Refunding Bonds. On December 30, 2005, the District deposited $48,307,230 into an irrevocable escrow, to advance refund, through a legal defeasance, the above mentioned bonds. At December 31, 2009, $14,895,000 principal of the bonds are outstanding and being paid from escrow.
6. RISK MANAGMENT
The District is exposed to various risks related to torts; theft of, damage to and destruction of assets; errors and omissions; employee health; injuries to employees; and net income losses. Since June 5, 2001, the District has been a member of the Park District Risk Management Agency (PDRMA) Property/Casualty Program, a joint risk management pool of park and forest preserve districts and special recreation associations through which property, general liability, automobile liability, crime, boiler and machinery, public officials’, employment practices liability and workers’ compensation coverage is provided in excess of specified limits for the members, acting as a single insurable unit. The following table is a summary of the coverage in effect for the period January 1, 2009 through January 1, 2010.
CoverageMember
Deductible
PDRMASelf-Insured
RetentionLimits
InsuranceCompany
PolicyNumber
Property, building, and contents
$ 1,000 $1,000,000,000 per occurrence
PDRMA Reinsurers:
P070108
All losses per occurrence $ 1,000,000 Government All losses aggregate $ 3,000,000 Entities Mutual Flood/except Zones A&V $ 100,000 $250,000,000 per occurrence Allied World
Assurance Corp Flood, Zones A&V $ 250,000 $200,000,000 per occurrence and othersEarthquake shock $ 100,000 $100,000,000 per occurrenceBuilders risk $ 1,000 Included $25,000,000 Coverage
DocumentP070108
Auto physical damage $ 1,000 $ 1,000,000 Included Coverage Document
P070108
Business interruption, rental income, tax income combined
$ 1,000 N/A $100,000,000 reported values, $500,000/$2,500,000 nonreported values
Coverage Document
P070108
Service interruption 24 hours N/A $10,000,000 business income and extra expense; other sub-limits apply, refer to policy
Coverage Document
P070108
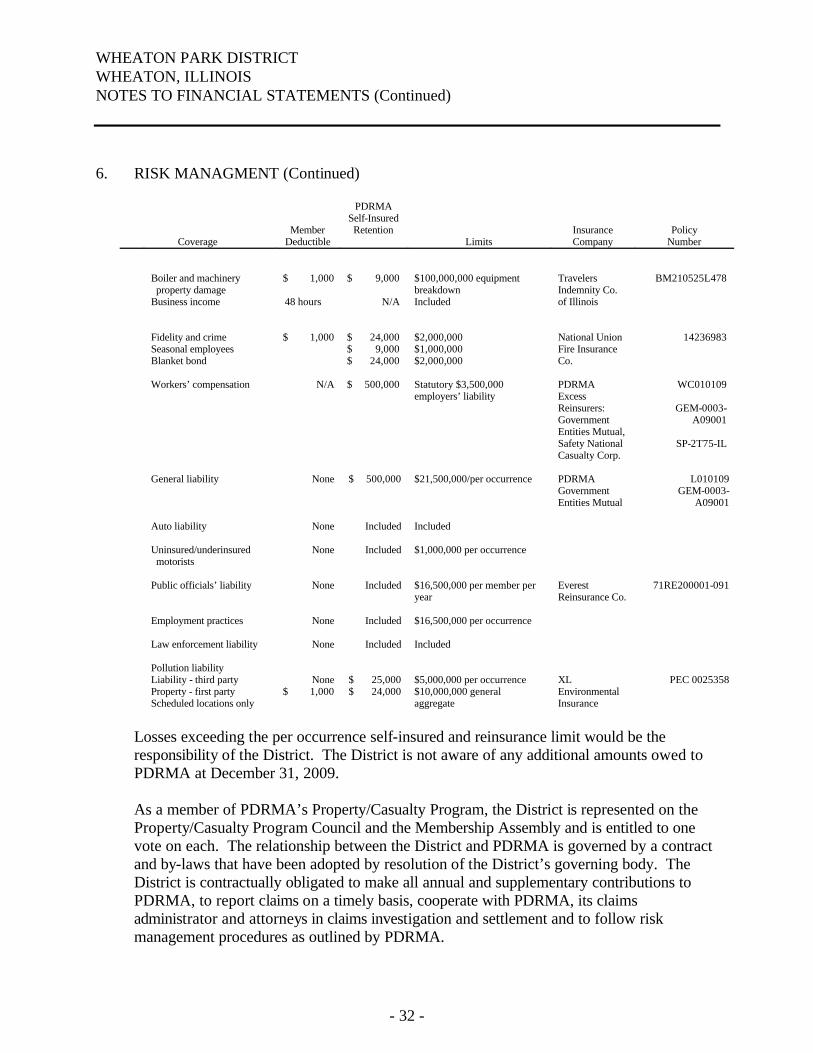
WHEATON PARK DISTRICT WHEATON, ILLINOISNOTES TO FINANCIAL STATEMENTS (Continued)
- 32 -
6. RISK MANAGMENT (Continued)
CoverageMember
Deductible
PDRMASelf-InsuredRetention
LimitsInsuranceCompany
PolicyNumber
Boiler and machinery property damageBusiness income
$ 1,000
48 hours
$ 9,000
N/A
$100,000,000 equipment breakdownIncluded
Travelers Indemnity Co. of Illinois
BM210525L478
Fidelity and crimeSeasonal employeesBlanket bond
$ 1,000 $ 24,000$ 9,000$ 24,000
$2,000,000$1,000,000$2,000,000
National Union Fire Insurance Co.
14236983
Workers’ compensation N/A $ 500,000 Statutory $3,500,000 PDRMA WC010109employers’ liability Excess
Reinsurers:Government Entities Mutual, Safety National Casualty Corp.
GEM-0003-A09001
SP-2T75-IL
General liability None $ 500,000 $21,500,000/per occurrence PDRMAGovernment Entities Mutual
L010109GEM-0003-
A09001
Auto liability None Included Included
Uninsured/underinsured motorists
None Included $1,000,000 per occurrence
Public officials’ liability None Included $16,500,000 per member per year
Everest Reinsurance Co.
71RE200001-091
Employment practices None Included $16,500,000 per occurrence
Law enforcement liability None Included Included
Pollution liability Liability - third partyProperty - first partyScheduled locations only
None$ 1,000
$ 25,000$ 24,000
$5,000,000 per occurrence$10,000,000 general aggregate
XL Environmental Insurance
PEC 0025358
Losses exceeding the per occurrence self-insured and reinsurance limit would be the responsibility of the District. The District is not aware of any additional amounts owed to PDRMA at December 31, 2009.
As a member of PDRMA’s Property/Casualty Program, the District is represented on the Property/Casualty Program Council and the Membership Assembly and is entitled to one vote on each. The relationship between the District and PDRMA is governed by a contract and by-laws that have been adopted by resolution of the District’s governing body. The District is contractually obligated to make all annual and supplementary contributions to PDRMA, to report claims on a timely basis, cooperate with PDRMA, its claims administrator and attorneys in claims investigation and settlement and to follow risk management procedures as outlined by PDRMA.
WHEATON PARK DISTRICT WHEATON, ILLINOISNOTES TO FINANCIAL STATEMENTS (Continued)
- 33 -
6. RISK MANAGMENT (Continued)
Members have a contractual obligation to fund any deficit of PDRMA attributable to a membership year during which they were a member. PDRMA is responsible for administering the self-insurance program and purchasing excess insurance according to the direction of the Property/Casualty Program Council. PDRMA also provides its members with risk management services, including the defense of and settlement of claims, and establishes reasonable and necessary loss reduction and prevention procedures to be followed by the members.
PDRMA Health Program
Since 1984, the District has participated in the PDRMA Health Program, a health insurance pool of park districts, special recreation associations and public service organizations through which medical, vision, dental, life and prescription drug card coverage are provided in excess of specified limits for the members, acting as a single insurable unit. The pool purchases excess insurance covering single claims over $200,000. The District’s payments to the PDRMA Health Program are displayed on the financial statements as expenditures in the governmental funds.
As a member of the PDRMA Health Program, the District is represented on the Health Program Council as well as the Membership Assembly and is entitled to one vote on each.The relationship between the District and PDRMA is governed by a contract and by-laws that have been adopted by resolution of the each member’s governing body. Members are contractually obligated to make all monthly payments to the PDRMA Health Program and to fund any deficit of the PDRMA Health Program upon dissolution of the pool. They will share in any surplus of the pool based on a decision by the Health Program Council.
The District does not have any control over the activities of the PDRMA Health Program beyond its representation on the Board of Directors. The District is not aware of any supplemental contributions owed to the PDRMA Health Program at December 31, 2009.
At December 31, 2008, the most recent information available, the total equity of the PDRMA Health Program was $6,395,698. For the period ended December 31, 2009, the net loss of the PDRMA Health Program was $1,432,808. The District made payments of $1,059,081 to the PDRMA Health Program during the period ended December 31, 2009.
A large percentage of the PDRMA Health Program’s liabilities are reserved for losses and loss adjustment expenses, which are based on an actuarial estimate of the ultimate losses incurred.
PDRMA’s rates for its members’ employees are age based.
WHEATON PARK DISTRICT WHEATON, ILLINOISNOTES TO FINANCIAL STATEMENTS (Continued)
- 34 -
6. RISK MANAGEMENT (Continued)
Complete financial statements for the PDRMA Health Program can be obtained from the PDRMA’s administration offices at 2033 Burlington Avenue, Lisle, Illinois.
7. RETIREMENT FUND COMMITMENTS
Illinois Municipal Retirement Fund
The District’s defined benefit pension plan, Illinois Municipal Retirement Fund (IMRF), provides retirement, disability, annual cost of living adjustments and death benefits to plan members and beneficiaries. IMRF is an agent multiple-employer pension plan that acts as acommon investment and administrative agent for local governments and school districts in Illinois. The Illinois Pension Code establishes the benefit provisions of the plan that can only be amended by the Illinois General Assembly. IMRF issues a publicly available financial report that includes financial statements and required supplementary information for the plan as a whole but not by individual employer. That report may be obtained by writing to the Illinois Municipal Retirement Fund, 2211 York Road, Suite 500, Oak Brook, Illinois 60523.
All employees hired in positions that meet or exceed the prescribed annual hourly standard must be enrolled in IMRF as participating members. Pension benefits vest after eight years of service. Participating members who retire at or after age 60 with eight years of credited service are entitled to an annual retirement benefit, payable monthly for life, in an amount equal to 1 2/3% of their final rate of earnings, for each year of credited service up to 15 years, and 2% for each year thereafter. IMRF also provides death and disability benefits. These benefit provisions and all other requirements are established by state statute.
Employees participating in IMRF are required to contribute 4.5% of their annual covered salary. The member rate is established by state statute. The District is required to contribute at an actuarially determined rate. The employer rate for calendar year 2009 was 11.14% of covered payroll. The employer contribution requirements are established and may be amended by the IMRF Board of Trustees.
For December 31, 2009, the District’s annual pension cost of $741,984 was equal to the District’s required and actual contributions. The required contribution was determined as part of the December 31, 2006 actuarial valuation using the entry-age actuarial cost method. The actuarial assumptions included (a) 7.50% investment rate of return (net of administrative expenses), (b) projected salary increases ranging from 0.4% to 10.0% per year, (c) 3.00% per year cost-of-living adjustments and (d) postretirement benefit increases of 3% annually. Both (a) and (b) included an inflation component of 4.00%. The actuarial value of IMRF assets was determined using techniques that smooth the effects of short-term volatility in the market value of investments over a five-year period. IMRF’s unfunded actuarial accrued liability is being amortized as a level percentage of projected payroll on a closed basis. The remaining amortization period at December 31, 2009 was 23 years.
WHEATON PARK DISTRICT WHEATON, ILLINOISNOTES TO FINANCIAL STATEMENTS (Continued)
- 35 -
7. RETIREMENT FUND COMMITMENTS (Continued)
Illinois Municipal Retirement Fund (Continued)
Employer annual pension cost (APC), actual contributions and the net pension obligation (NPO) are as follows. The NPO is the cumulative difference between the APC and the contributions actually made.
ForCalendar
Year
AnnualPension
Cost(APC)
Percentageof APC
Contributed
NetPension
Obligation
2007 $ 598,600 100.00% $ -2008 717,600 100.00% -2009 741,984 100.00% -
The funded status of the plan as of December 31, 2009 is based on actuarial valuations performed as of December 31, 2007 for IMRF and is as follows. The actuarial assumptions used to determine the funded status of the plan are the same actuarial assumptions used to determine the employer APC of the plan as disclosed above.
Actuarial accrued liability (AAL) $ 11,816,924Actuarial value of plan assets 8,208,099Unfunded actuarial accrued liability (UAAL) 3,608,825Funded ratio (actuarial value of plan assets/AAL) 69.46%Covered payroll (active plan members) $ 7,066,515UAAL as a percentage of covered payroll 51.07%
See the schedule of funding progress in the required supplementary information immediately following the notes to financial statements for additional information related to the funded status of the plan.
8. OTHER POSTEMPLOYMENT BENEFITS
The District’s health insurance provider utilizes age based rates. Former employees who choose to retain their rights to health insurance through the District are required to pay 100% of the current premium. Therefore, there is no implicit subsidy to calculate in accordance with GASB Statement No. 45, Accounting and Financial Reporting by Employers for Postemployment Benefits Other Than Pensions. Additionally, the District had no former employees for which the District was providing an explicit subsidy as of December 31, 2009. For the year ended December 31, 2009, the District has two former employees purchasing health insurance through the District. The retirees pay 100% of their premiums.
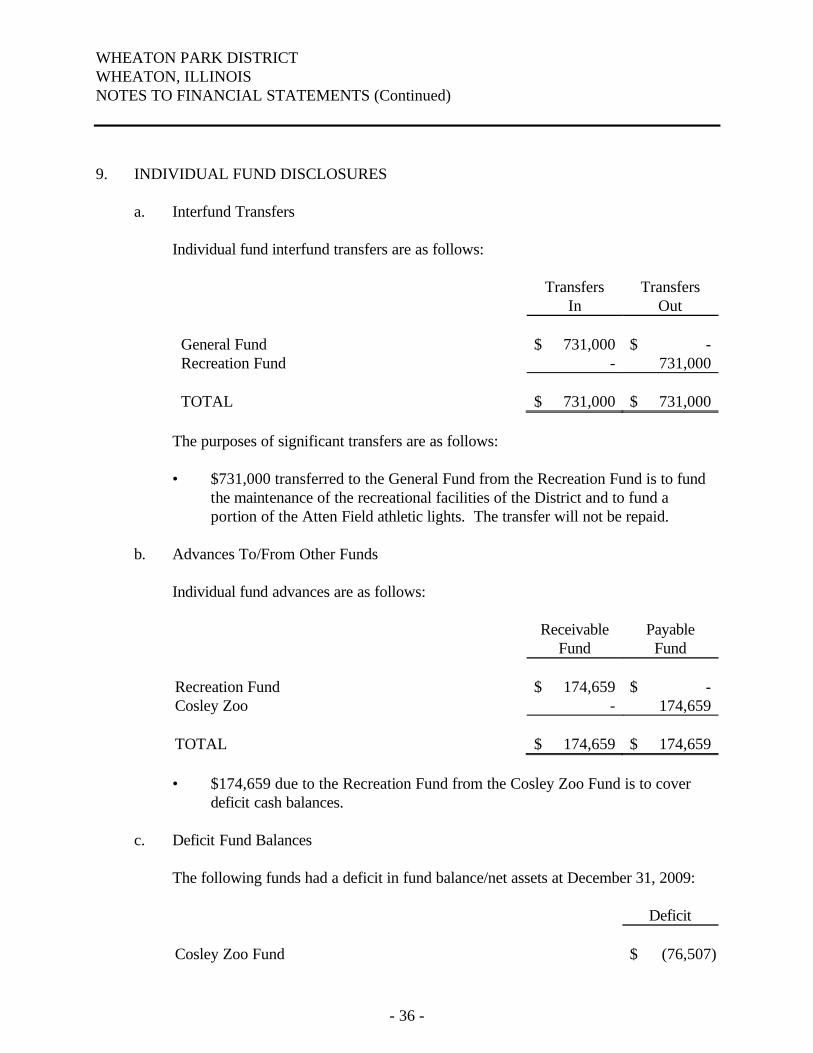
WHEATON PARK DISTRICT WHEATON, ILLINOISNOTES TO FINANCIAL STATEMENTS (Continued)
- 36 -
9. INDIVIDUAL FUND DISCLOSURES
a. Interfund Transfers
Individual fund interfund transfers are as follows:
TransfersIn
TransfersOut
General Fund $ 731,000 $ -Recreation Fund - 731,000
TOTAL $ 731,000 $ 731,000
The purposes of significant transfers are as follows:
• $731,000 transferred to the General Fund from the Recreation Fund is to fund the maintenance of the recreational facilities of the District and to fund a portion of the Atten Field athletic lights. The transfer will not be repaid.
b. Advances To/From Other Funds
Individual fund advances are as follows:
ReceivableFund
PayableFund
Recreation Fund $ 174,659 $ -Cosley Zoo - 174,659
TOTAL $ 174,659 $ 174,659
• $174,659 due to the Recreation Fund from the Cosley Zoo Fund is to cover deficit cash balances.
c. Deficit Fund Balances
The following funds had a deficit in fund balance/net assets at December 31, 2009:
Deficit
Cosley Zoo Fund $ (76,507)
WHEATON PARK DISTRICT WHEATON, ILLINOISNOTES TO FINANCIAL STATEMENTS (Continued)
- 37 -
10. COMMITMENTS AND CONTINGENCIES
a. Litigation
The District is a defendant in various lawsuits. Although the outcome of these lawsuits is not presently determinable, in the opinion of the District’s attorney, the resolution of these matters will not have a material adverse effect on the financial condition of the District.
b. Grants
Amounts received or receivable from grantor agencies are subject to audit and adjustment by grantor agencies, principally the federal government. Any disallowed claims, including amounts already collected, may constitute a liability of the applicable funds. The amount, if any, of expenditures that may be disallowed by the grantor cannot be determined at this time although the District expects such amounts, if any, to be immaterial.
c. Cost Sharing Agreement with the City of Wheaton
On June 15, 2009 the District entered into a cost sharing agreement with the City of Wheaton (the City) for certain improvements to portions of one of the District’s park and the adjacent City infrastructure. The agreement provided for a total contribution from the City to the District of $1,000,000. The City has elected to contribute this entire amount in one payment due to the District by December 31, 2010. No receivable has been accrued for any portion of this amount as the underlying expenditures have not been made and the amount due is not a current financial resource of the District.
11. SUBSEQUENT EVENT
On February 17, 2010, the District sold $9,000,000 general obligation park bonds (alternate revenue source), Series 2010, Build America Bonds. Interest is payable semiannually on June 15 and December 15 commencing June 15, 2010. The 2010 bonds mature serially beginning December 15, 2010 through December 15, 2029, due in annual installments of $280,000 to $1,005,000.
WHEATON PARK DISTRICT WHEATON, ILLINOISNOTES TO FINANCIAL STATEMENTS (Continued)
- 38 -
12. COSLEY FOUNDATION
a. Summary of Significant Accounting Policies
1) Foundation Purpose
The Cosley Foundation, Inc. (the Foundation), incorporated under the Not-For-Profit Corporation Act of the State of Illinois, is engaged in fund raising activities solely to benefit the Cosley Zoo (the Zoo). The Zoo is a historical zoo, farm, museum, nature center and outdoor educational facility, owned and operated by the District. The activities of the Zoo include the maintaining of a historic railroad station, barn, aviaries, other buildings and grounds, feeding and veterinary care of animals and sponsoring of educational programs. The aim of the Foundation is to provide the Zoo with a stable, ascertainable funding base.
2) Basis of Accounting
The Foundation utilizes the accrual method of accounting, which recognizes revenues when earned and expenses when incurred. These financial statements have been prepared to focus on the Foundation as a whole. Balances and transactions are presented according to the existence or absence of donor imposed restrictions. This is accomplished by classifying fund balances and transactions into three classes of net assets: permanently restricted, temporarily restricted and unrestricted.
3) Pervasiveness of Estimates
The preparation of financial statements in conformity with GAAP requires management to make estimates and assumptions that affect the reported amounts of assets and liabilities and disclosure of contingent assets and liabilities, at the date of the financial statements, and reported amounts of revenues and expenses during the accounting period.
4) Cash and Cash Equivalents
Cash equivalents include money market accounts and certificates of deposit with original maturities of three months or less.
5) Unearned Revenue
The Foundation receives advance registration fees for fund raising events throughout the year. These fees are recorded as unearned revenue until they are earned, at which time they are recorded as revenue and support.
WHEATON PARK DISTRICT WHEATON, ILLINOISNOTES TO FINANCIAL STATEMENTS (Continued)
- 39 -
12. COSLEY FOUNDATION (Continued)
a. Summary of Significant Accounting Policies (Continued)
6) Contributions
All contributions are considered to be available for unrestricted use, unless specifically restricted by the donor. Amounts received that are designated for future periods, or restricted by the donor for specific purposes, are reported as temporarily restricted or permanently restricted support that increases those net asset classes. However, if a restriction is fulfilled in the same time period in which the contribution is received, the Foundation reports the support as unrestricted.
Gifts of property and equipment are reported as unrestricted support, unless explicit donor stipulations specify how the donated asset must be used. Gifts of long-lived assets with explicit restrictions that specify how the assets are to be used, and gifts of cash or other assets that must be used to acquire long-lived assets, are reported as restricted support. Absent explicit donor stipulations about how these long-lived assets must be maintained, the Foundation reports expirations of donor restrictions when the donated or acquired long-lived assets are placed in service.
b. Net Assets
1) Permanently Restricted Net Assets
The Foundation currently has no permanently restricted net assets.
2) Temporarily Restricted Net Assets
Temporarily restricted net assets available in 2009 were $126,529 for Lincoln Marsh renovation and development and $410,049 for the Wildlife Exhibit Phase III construction.
c. Income Taxes
The Foundation is incorporated as a not-for-profit corporation as described in Section 501(c)(3) of the Internal Revenue Code, and is exempt from income taxes, except to the extent of any unrelated business income. There was no unrelated business incomefor the year ended December 31, 2009. Accordingly, no provision for income tax is included in the financial statements.
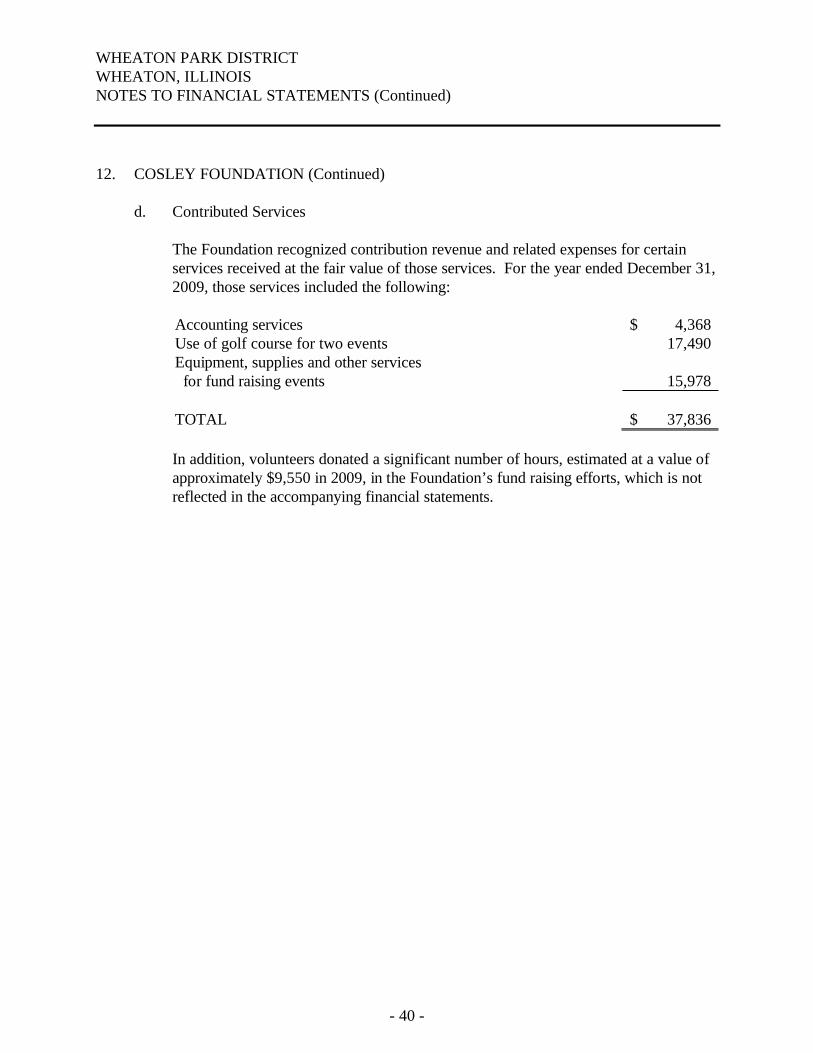
WHEATON PARK DISTRICT WHEATON, ILLINOISNOTES TO FINANCIAL STATEMENTS (Continued)
- 40 -
12. COSLEY FOUNDATION (Continued)
d. Contributed Services
The Foundation recognized contribution revenue and related expenses for certain services received at the fair value of those services. For the year ended December 31, 2009, those services included the following:
Accounting services $ 4,368Use of golf course for two events 17,490Equipment, supplies and other services for fund raising events 15,978
TOTAL $ 37,836
In addition, volunteers donated a significant number of hours, estimated at a value of approximately $9,550 in 2009, in the Foundation’s fund raising efforts, which is not reflected in the accompanying financial statements.
REQUIRED SUPPLEMENTARY INFORMATION
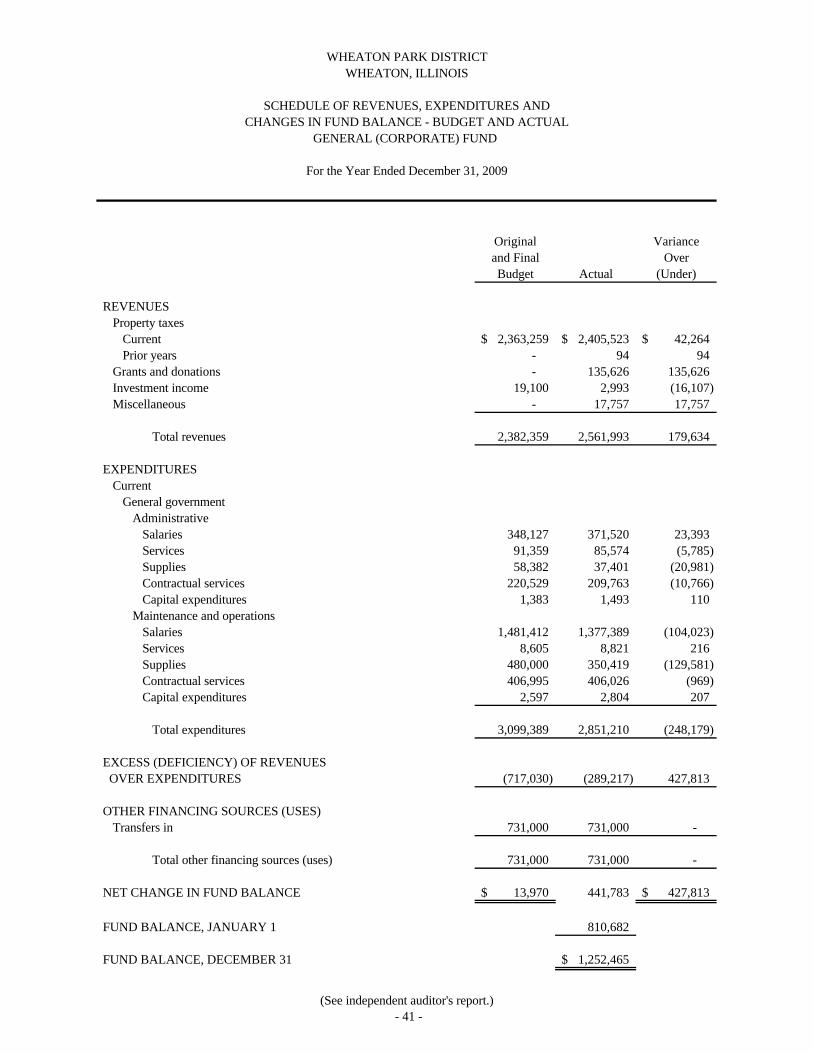
Original Varianceand Final OverBudget Actual (Under)
REVENUESProperty taxes
Current 2,363,259$ 2,405,523$ 42,264$ Prior years - 94 94
Grants and donations - 135,626 135,626 Investment income 19,100 2,993 (16,107) Miscellaneous - 17,757 17,757
Total revenues 2,382,359 2,561,993 179,634
EXPENDITURESCurrent
General governmentAdministrative
Salaries 348,127 371,520 23,393 Services 91,359 85,574 (5,785) Supplies 58,382 37,401 (20,981) Contractual services 220,529 209,763 (10,766) Capital expenditures 1,383 1,493 110
Maintenance and operationsSalaries 1,481,412 1,377,389 (104,023) Services 8,605 8,821 216 Supplies 480,000 350,419 (129,581) Contractual services 406,995 406,026 (969) Capital expenditures 2,597 2,804 207
Total expenditures 3,099,389 2,851,210 (248,179)
EXCESS (DEFICIENCY) OF REVENUESOVER EXPENDITURES (717,030) (289,217) 427,813
OTHER FINANCING SOURCES (USES)Transfers in 731,000 731,000 -
Total other financing sources (uses) 731,000 731,000 -
NET CHANGE IN FUND BALANCE 13,970$ 441,783 427,813$
FUND BALANCE, JANUARY 1 810,682
FUND BALANCE, DECEMBER 31 1,252,465$
GENERAL (CORPORATE) FUND
For the Year Ended December 31, 2009
WHEATON PARK DISTRICTWHEATON, ILLINOIS
SCHEDULE OF REVENUES, EXPENDITURES ANDCHANGES IN FUND BALANCE - BUDGET AND ACTUAL
(See independent auditor's report.)- 41 -
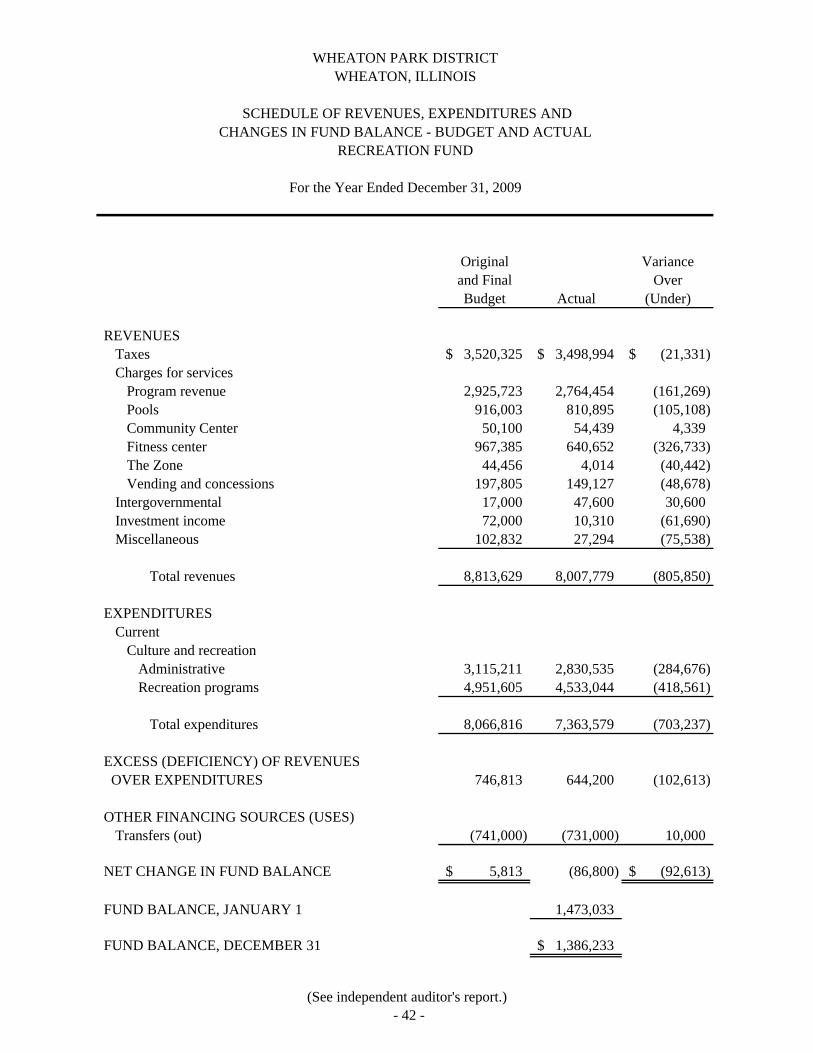
Original Varianceand Final OverBudget Actual (Under)
REVENUESTaxes 3,520,325$ 3,498,994$ (21,331)$ Charges for services
Program revenue 2,925,723 2,764,454 (161,269) Pools 916,003 810,895 (105,108) Community Center 50,100 54,439 4,339 Fitness center 967,385 640,652 (326,733) The Zone 44,456 4,014 (40,442) Vending and concessions 197,805 149,127 (48,678)
Intergovernmental 17,000 47,600 30,600 Investment income 72,000 10,310 (61,690) Miscellaneous 102,832 27,294 (75,538)
Total revenues 8,813,629 8,007,779 (805,850)
EXPENDITURESCurrent
Culture and recreationAdministrative 3,115,211 2,830,535 (284,676) Recreation programs 4,951,605 4,533,044 (418,561)
Total expenditures 8,066,816 7,363,579 (703,237)
EXCESS (DEFICIENCY) OF REVENUESOVER EXPENDITURES 746,813 644,200 (102,613)
OTHER FINANCING SOURCES (USES)Transfers (out) (741,000) (731,000) 10,000
NET CHANGE IN FUND BALANCE 5,813$ (86,800) (92,613)$
FUND BALANCE, JANUARY 1 1,473,033
FUND BALANCE, DECEMBER 31 1,386,233$
WHEATON PARK DISTRICTWHEATON, ILLINOIS
SCHEDULE OF REVENUES, EXPENDITURES ANDCHANGES IN FUND BALANCE - BUDGET AND ACTUAL
RECREATION FUND
For the Year Ended December 31, 2009
(See independent auditor's report.)- 42 -
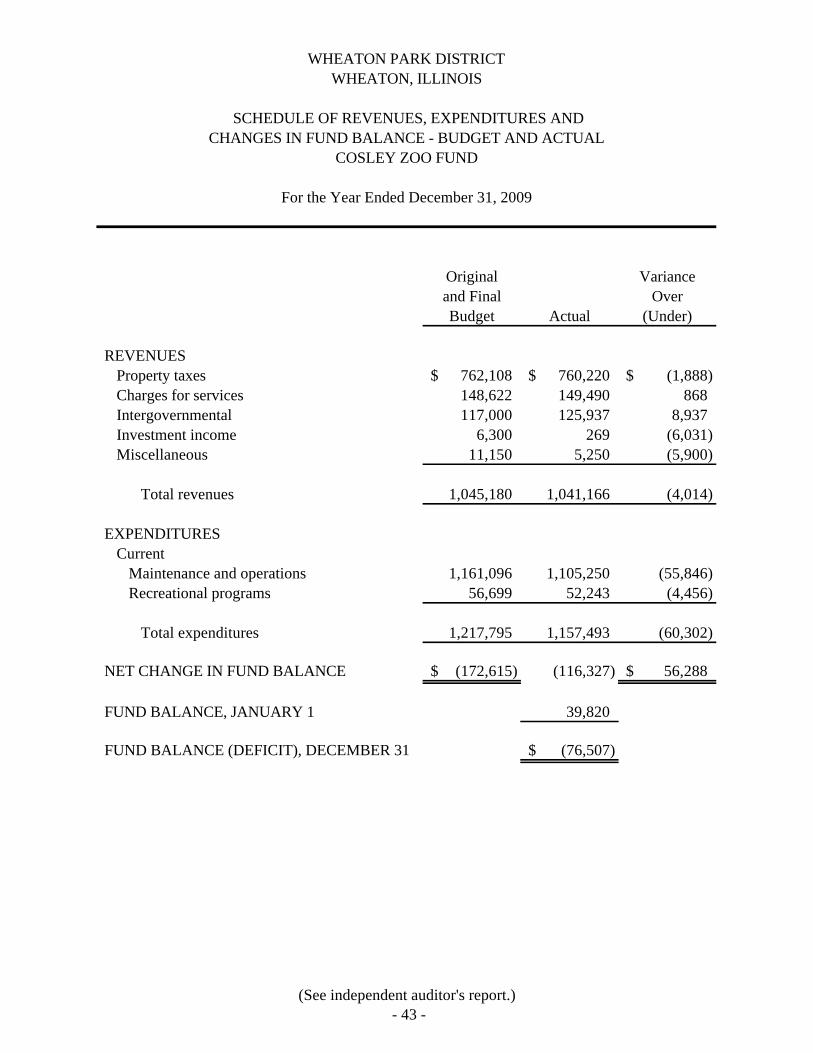
Original Varianceand Final OverBudget Actual (Under)
REVENUESProperty taxes 762,108$ 760,220$ (1,888)$ Charges for services 148,622 149,490 868 Intergovernmental 117,000 125,937 8,937 Investment income 6,300 269 (6,031) Miscellaneous 11,150 5,250 (5,900)
Total revenues 1,045,180 1,041,166 (4,014)
EXPENDITURESCurrent
Maintenance and operations 1,161,096 1,105,250 (55,846) Recreational programs 56,699 52,243 (4,456)
Total expenditures 1,217,795 1,157,493 (60,302)
NET CHANGE IN FUND BALANCE (172,615)$ (116,327) 56,288$
FUND BALANCE, JANUARY 1 39,820
FUND BALANCE (DEFICIT), DECEMBER 31 (76,507)$
WHEATON PARK DISTRICTWHEATON, ILLINOIS
SCHEDULE OF REVENUES, EXPENDITURES ANDCHANGES IN FUND BALANCE - BUDGET AND ACTUAL
COSLEY ZOO FUND
For the Year Ended December 31, 2009
(See independent auditor's report.)- 43 -
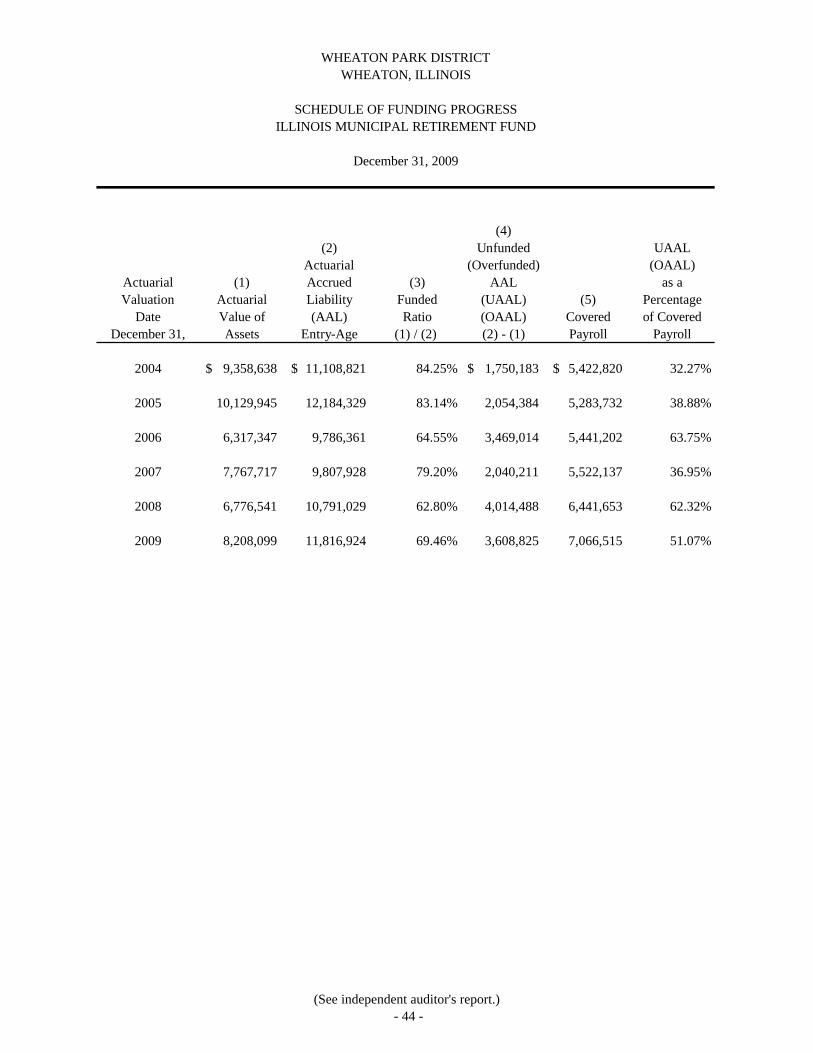
WHEATON PARK DISTRICTWHEATON, ILLINOIS
(4)(2) Unfunded UAAL
Actuarial (Overfunded) (OAAL)Actuarial (1) Accrued (3) AAL as aValuation Actuarial Liability Funded (UAAL) (5) Percentage
Date Value of (AAL) Ratio (OAAL) Covered of CoveredDecember 31, Assets Entry-Age (1) / (2) (2) - (1) Payroll Payroll
2004 9,358,638$ 11,108,821$ 84.25% 1,750,183$ 5,422,820$ 32.27%
2005 10,129,945 12,184,329 83.14% 2,054,384 5,283,732 38.88%
2006 6,317,347 9,786,361 64.55% 3,469,014 5,441,202 63.75%
2007 7,767,717 9,807,928 79.20% 2,040,211 5,522,137 36.95%
2008 6,776,541 10,791,029 62.80% 4,014,488 6,441,653 62.32%
2009 8,208,099 11,816,924 69.46% 3,608,825 7,066,515 51.07%
December 31, 2009
SCHEDULE OF FUNDING PROGRESSILLINOIS MUNICIPAL RETIREMENT FUND
(See independent auditor's report.)- 44 -
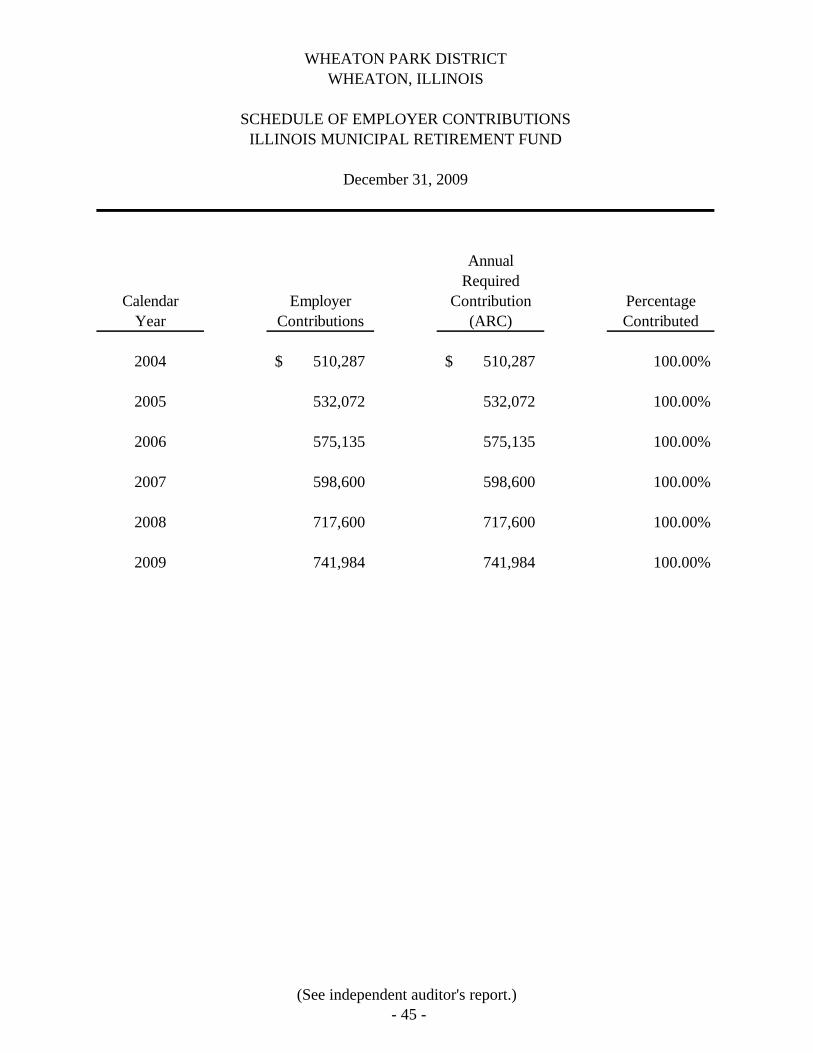
WHEATON PARK DISTRICTWHEATON, ILLINOIS
AnnualRequired
Calendar Employer Contribution PercentageYear Contributions (ARC) Contributed
2004 510,287$ 510,287$ 100.00%
2005 532,072 532,072 100.00%
2006 575,135 575,135 100.00%
2007 598,600 598,600 100.00%
2008 717,600 717,600 100.00%
2009 741,984 741,984 100.00%
December 31, 2009
SCHEDULE OF EMPLOYER CONTRIBUTIONSILLINOIS MUNICIPAL RETIREMENT FUND
(See independent auditor's report.)- 45 -
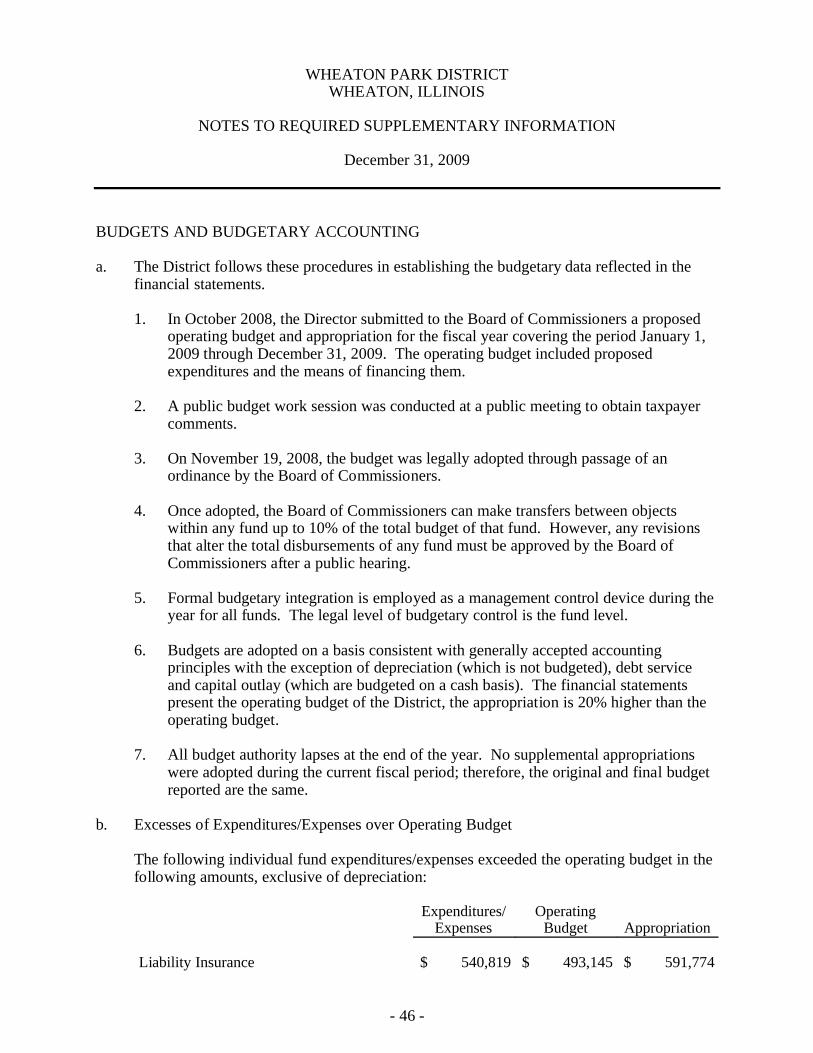
- 46 -
WHEATON PARK DISTRICT WHEATON, ILLINOIS
NOTES TO REQUIRED SUPPLEMENTARY INFORMATION
December 31, 2009
BUDGETS AND BUDGETARY ACCOUNTING
a. The District follows these procedures in establishing the budgetary data reflected in the financial statements.
1. In October 2008, the Director submitted to the Board of Commissioners a proposed operating budget and appropriation for the fiscal year covering the period January 1, 2009 through December 31, 2009. The operating budget included proposed expenditures and the means of financing them.
2. A public budget work session was conducted at a public meeting to obtain taxpayer comments.
3. On November 19, 2008, the budget was legally adopted through passage of an ordinance by the Board of Commissioners.
4. Once adopted, the Board of Commissioners can make transfers between objects within any fund up to 10% of the total budget of that fund. However, any revisions that alter the total disbursements of any fund must be approved by the Board of Commissioners after a public hearing.
5. Formal budgetary integration is employed as a management control device during the year for all funds. The legal level of budgetary control is the fund level.
6. Budgets are adopted on a basis consistent with generally accepted accounting principles with the exception of depreciation (which is not budgeted), debt service and capital outlay (which are budgeted on a cash basis). The financial statements present the operating budget of the District, the appropriation is 20% higher than the operating budget.
7. All budget authority lapses at the end of the year. No supplemental appropriations were adopted during the current fiscal period; therefore, the original and final budget reported are the same.
b. Excesses of Expenditures/Expenses over Operating Budget
The following individual fund expenditures/expenses exceeded the operating budget in the following amounts, exclusive of depreciation:
Expenditures/Expenses
OperatingBudget Appropriation
Liability Insurance $ 540,819 $ 493,145 $ 591,774

COMBINING AND INDIVIDUAL FUNDFINANCIAL STATEMENTS AND SCHEDULES
MAJOR GOVERNMENTAL FUNDS
The General Fund is the general operating fund of the District. It is used to account for all financial resources not accounted for and reported in another fund.
The Recreation Fund is used to account for revenue and expenditures related to recreation programs funded by a tax levy and user fees.
The Cosley Zoo Fund is used to account for the activities of the Cosley Zoo.
The Debt Service Fund is used to account for the accumulation of resources for and the payment of principal and interest on governmental activities’ long-term debt.
The Capital Projects Fund is used to account for the cost of park land acquisition and development including transfers to the Debt Service Fund for principal and interest payments for land purchased by bond issues. Financing is provided by the sale of various general obligation bonds issues and internal and grant funding.
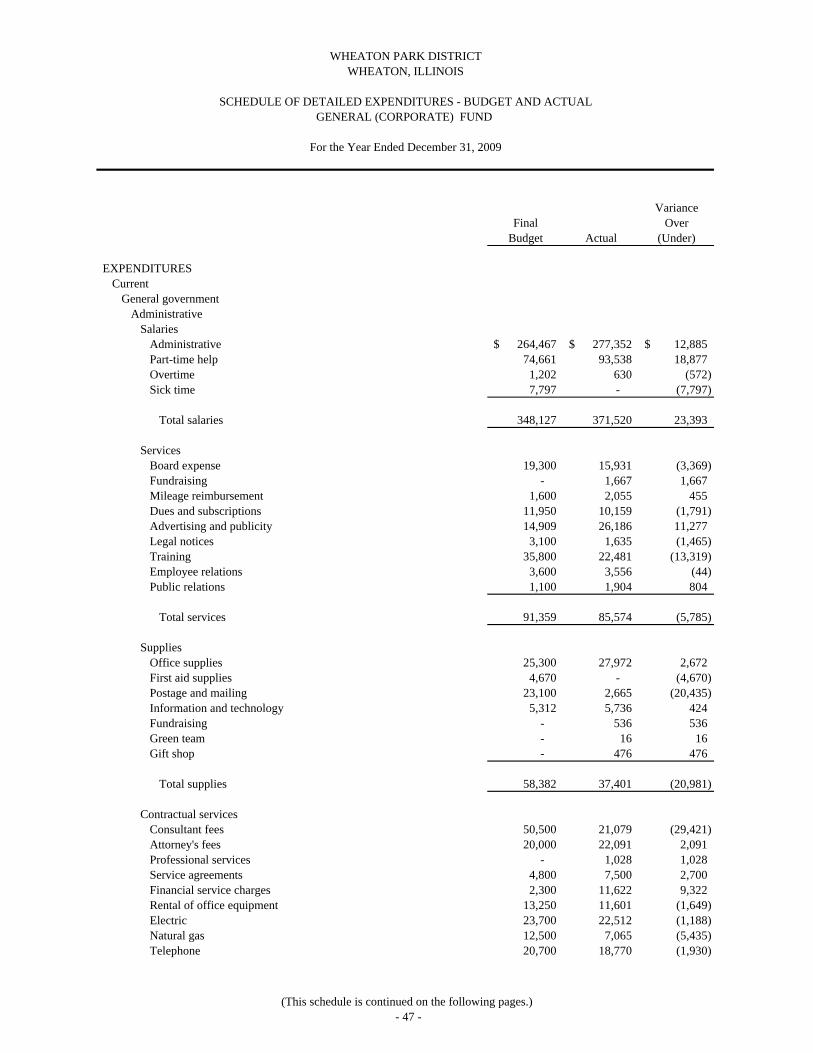
VarianceFinal Over
Budget Actual (Under)
EXPENDITURESCurrent
General governmentAdministrative
SalariesAdministrative 264,467$ 277,352$ 12,885$ Part-time help 74,661 93,538 18,877 Overtime 1,202 630 (572) Sick time 7,797 - (7,797)
Total salaries 348,127 371,520 23,393
ServicesBoard expense 19,300 15,931 (3,369) Fundraising - 1,667 1,667 Mileage reimbursement 1,600 2,055 455 Dues and subscriptions 11,950 10,159 (1,791) Advertising and publicity 14,909 26,186 11,277 Legal notices 3,100 1,635 (1,465) Training 35,800 22,481 (13,319) Employee relations 3,600 3,556 (44) Public relations 1,100 1,904 804
Total services 91,359 85,574 (5,785)
SuppliesOffice supplies 25,300 27,972 2,672 First aid supplies 4,670 - (4,670) Postage and mailing 23,100 2,665 (20,435) Information and technology 5,312 5,736 424 Fundraising - 536 536 Green team - 16 16 Gift shop - 476 476
Total supplies 58,382 37,401 (20,981)
Contractual servicesConsultant fees 50,500 21,079 (29,421) Attorney's fees 20,000 22,091 2,091 Professional services - 1,028 1,028 Service agreements 4,800 7,500 2,700 Financial service charges 2,300 11,622 9,322 Rental of office equipment 13,250 11,601 (1,649) Electric 23,700 22,512 (1,188) Natural gas 12,500 7,065 (5,435) Telephone 20,700 18,770 (1,930)
WHEATON PARK DISTRICTWHEATON, ILLINOIS
SCHEDULE OF DETAILED EXPENDITURES - BUDGET AND ACTUALGENERAL (CORPORATE) FUND
For the Year Ended December 31, 2009
(This schedule is continued on the following pages.)- 47 -
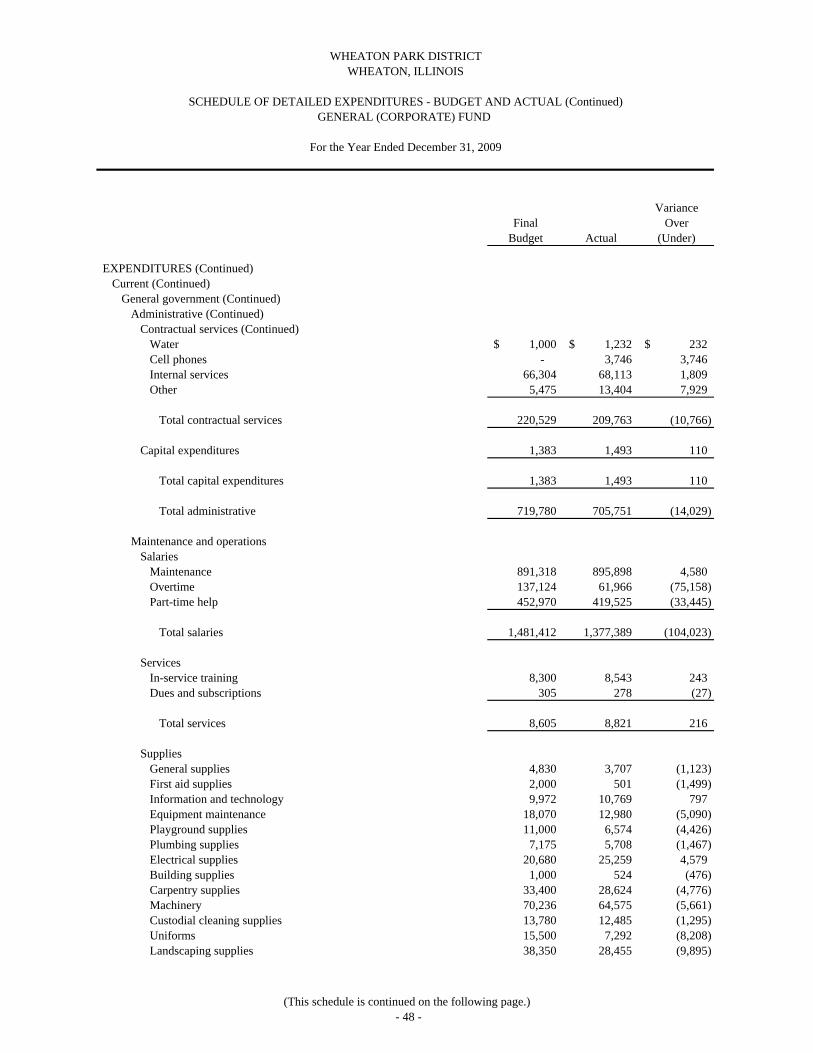
VarianceFinal Over
Budget Actual (Under)
EXPENDITURES (Continued)Current (Continued)
General government (Continued)Administrative (Continued)
Contractual services (Continued)Water 1,000$ 1,232$ 232$ Cell phones - 3,746 3,746 Internal services 66,304 68,113 1,809 Other 5,475 13,404 7,929
Total contractual services 220,529 209,763 (10,766)
Capital expenditures 1,383 1,493 110
Total capital expenditures 1,383 1,493 110
Total administrative 719,780 705,751 (14,029)
Maintenance and operationsSalaries
Maintenance 891,318 895,898 4,580 Overtime 137,124 61,966 (75,158) Part-time help 452,970 419,525 (33,445)
Total salaries 1,481,412 1,377,389 (104,023)
ServicesIn-service training 8,300 8,543 243 Dues and subscriptions 305 278 (27)
Total services 8,605 8,821 216
SuppliesGeneral supplies 4,830 3,707 (1,123) First aid supplies 2,000 501 (1,499) Information and technology 9,972 10,769 797 Equipment maintenance 18,070 12,980 (5,090) Playground supplies 11,000 6,574 (4,426) Plumbing supplies 7,175 5,708 (1,467) Electrical supplies 20,680 25,259 4,579 Building supplies 1,000 524 (476) Carpentry supplies 33,400 28,624 (4,776) Machinery 70,236 64,575 (5,661) Custodial cleaning supplies 13,780 12,485 (1,295) Uniforms 15,500 7,292 (8,208) Landscaping supplies 38,350 28,455 (9,895)
WHEATON PARK DISTRICTWHEATON, ILLINOIS
SCHEDULE OF DETAILED EXPENDITURES - BUDGET AND ACTUAL (Continued)GENERAL (CORPORATE) FUND
For the Year Ended December 31, 2009
(This schedule is continued on the following page.)- 48 -
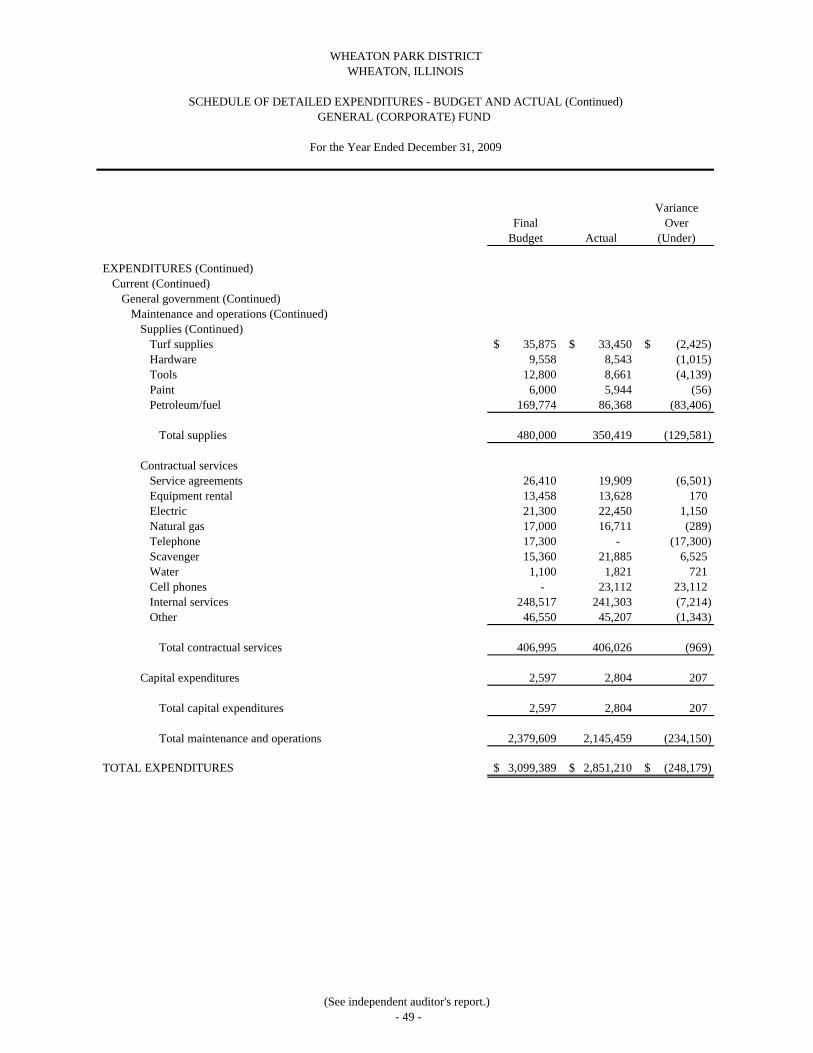
VarianceFinal Over
Budget Actual (Under)
WHEATON PARK DISTRICTWHEATON, ILLINOIS
SCHEDULE OF DETAILED EXPENDITURES - BUDGET AND ACTUAL (Continued)GENERAL (CORPORATE) FUND
For the Year Ended December 31, 2009
EXPENDITURES (Continued)Current (Continued)
General government (Continued)Maintenance and operations (Continued)
Supplies (Continued)Turf supplies 35,875$ 33,450$ (2,425)$ Hardware 9,558 8,543 (1,015) Tools 12,800 8,661 (4,139) Paint 6,000 5,944 (56) Petroleum/fuel 169,774 86,368 (83,406)
Total supplies 480,000 350,419 (129,581)
Contractual servicesService agreements 26,410 19,909 (6,501) Equipment rental 13,458 13,628 170 Electric 21,300 22,450 1,150 Natural gas 17,000 16,711 (289) Telephone 17,300 - (17,300) Scavenger 15,360 21,885 6,525 Water 1,100 1,821 721 Cell phones - 23,112 23,112 Internal services 248,517 241,303 (7,214) Other 46,550 45,207 (1,343)
Total contractual services 406,995 406,026 (969)
Capital expenditures 2,597 2,804 207
Total capital expenditures 2,597 2,804 207
Total maintenance and operations 2,379,609 2,145,459 (234,150)
TOTAL EXPENDITURES 3,099,389$ 2,851,210$ (248,179)$
(See independent auditor's report.)- 49 -
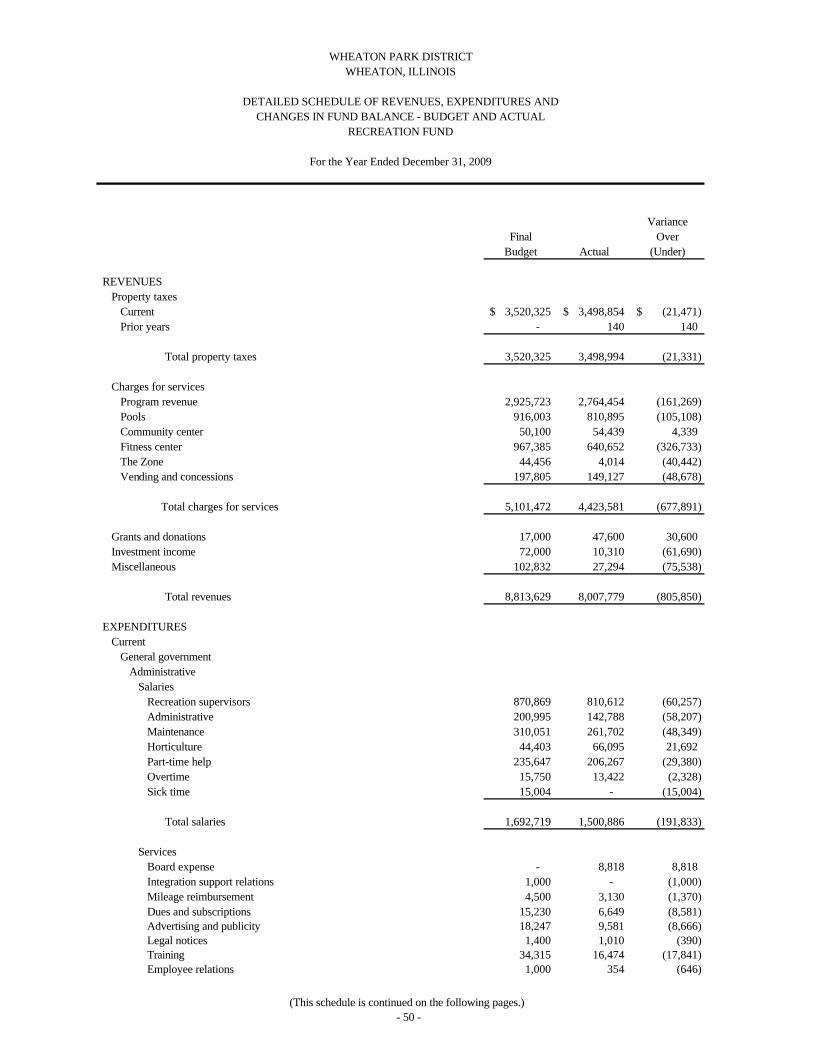
VarianceFinal Over
Budget Actual (Under)
REVENUESProperty taxes
Current 3,520,325$ 3,498,854$ (21,471)$ Prior years - 140 140
Total property taxes 3,520,325 3,498,994 (21,331)
Charges for servicesProgram revenue 2,925,723 2,764,454 (161,269) Pools 916,003 810,895 (105,108) Community center 50,100 54,439 4,339 Fitness center 967,385 640,652 (326,733) The Zone 44,456 4,014 (40,442) Vending and concessions 197,805 149,127 (48,678)
Total charges for services 5,101,472 4,423,581 (677,891)
Grants and donations 17,000 47,600 30,600 Investment income 72,000 10,310 (61,690) Miscellaneous 102,832 27,294 (75,538)
Total revenues 8,813,629 8,007,779 (805,850)
EXPENDITURESCurrent
General governmentAdministrative
SalariesRecreation supervisors 870,869 810,612 (60,257) Administrative 200,995 142,788 (58,207) Maintenance 310,051 261,702 (48,349) Horticulture 44,403 66,095 21,692 Part-time help 235,647 206,267 (29,380) Overtime 15,750 13,422 (2,328) Sick time 15,004 - (15,004)
Total salaries 1,692,719 1,500,886 (191,833)
ServicesBoard expense - 8,818 8,818 Integration support relations 1,000 - (1,000) Mileage reimbursement 4,500 3,130 (1,370) Dues and subscriptions 15,230 6,649 (8,581) Advertising and publicity 18,247 9,581 (8,666) Legal notices 1,400 1,010 (390) Training 34,315 16,474 (17,841) Employee relations 1,000 354 (646)
RECREATION FUND
For the Year Ended December 31, 2009
WHEATON PARK DISTRICTWHEATON, ILLINOIS
DETAILED SCHEDULE OF REVENUES, EXPENDITURES ANDCHANGES IN FUND BALANCE - BUDGET AND ACTUAL
(This schedule is continued on the following pages.)- 50 -
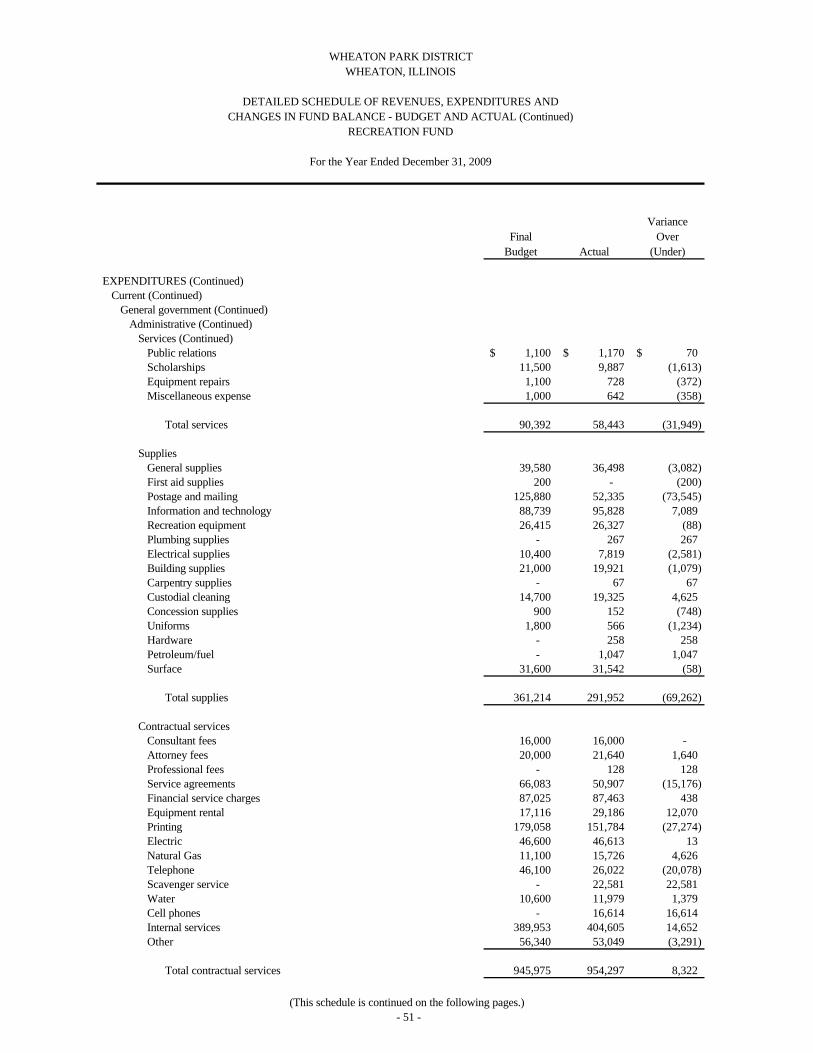
VarianceFinal Over
Budget Actual (Under)
EXPENDITURES (Continued)Current (Continued)
General government (Continued)Administrative (Continued)
Services (Continued)Public relations 1,100$ 1,170$ 70$ Scholarships 11,500 9,887 (1,613) Equipment repairs 1,100 728 (372) Miscellaneous expense 1,000 642 (358)
Total services 90,392 58,443 (31,949)
SuppliesGeneral supplies 39,580 36,498 (3,082) First aid supplies 200 - (200) Postage and mailing 125,880 52,335 (73,545) Information and technology 88,739 95,828 7,089 Recreation equipment 26,415 26,327 (88) Plumbing supplies - 267 267 Electrical supplies 10,400 7,819 (2,581) Building supplies 21,000 19,921 (1,079) Carpentry supplies - 67 67 Custodial cleaning 14,700 19,325 4,625 Concession supplies 900 152 (748) Uniforms 1,800 566 (1,234) Hardware - 258 258 Petroleum/fuel - 1,047 1,047 Surface 31,600 31,542 (58)
Total supplies 361,214 291,952 (69,262)
Contractual servicesConsultant fees 16,000 16,000 - Attorney fees 20,000 21,640 1,640 Professional fees - 128 128 Service agreements 66,083 50,907 (15,176) Financial service charges 87,025 87,463 438 Equipment rental 17,116 29,186 12,070 Printing 179,058 151,784 (27,274) Electric 46,600 46,613 13 Natural Gas 11,100 15,726 4,626 Telephone 46,100 26,022 (20,078) Scavenger service - 22,581 22,581 Water 10,600 11,979 1,379 Cell phones - 16,614 16,614 Internal services 389,953 404,605 14,652 Other 56,340 53,049 (3,291)
Total contractual services 945,975 954,297 8,322
CHANGES IN FUND BALANCE - BUDGET AND ACTUAL (Continued)RECREATION FUND
For the Year Ended December 31, 2009
WHEATON PARK DISTRICTWHEATON, ILLINOIS
DETAILED SCHEDULE OF REVENUES, EXPENDITURES AND
(This schedule is continued on the following pages.)- 51 -
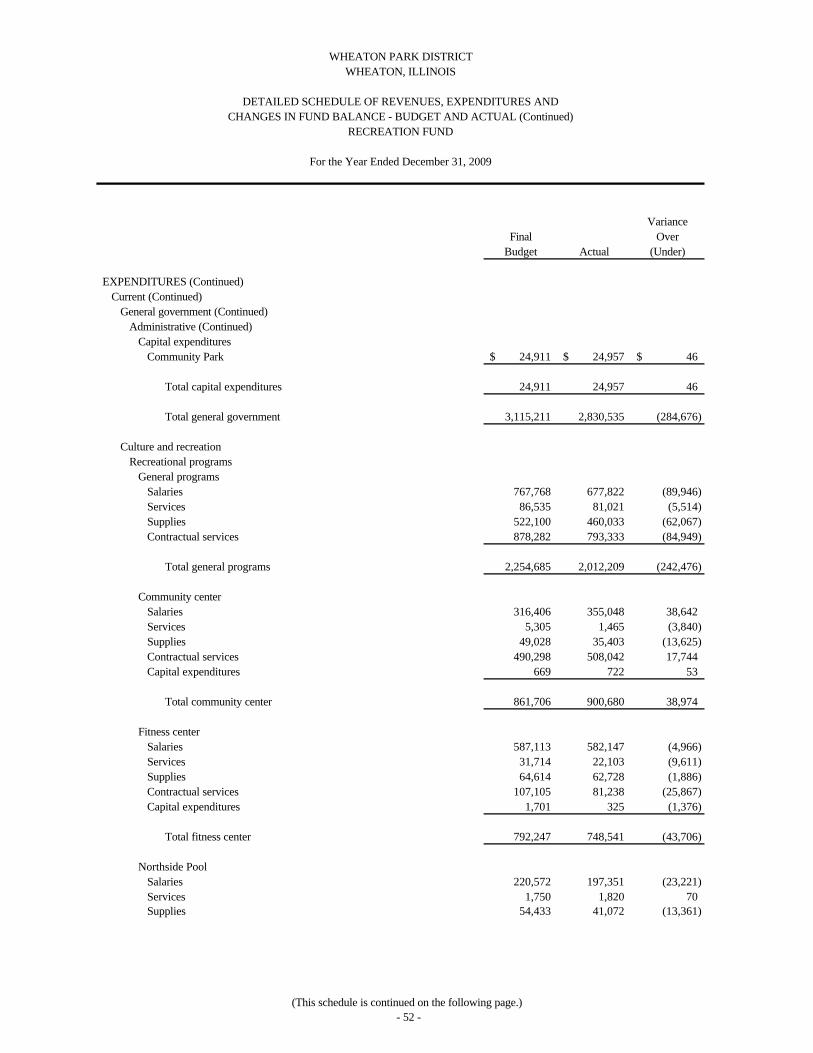
VarianceFinal Over
Budget Actual (Under)
CHANGES IN FUND BALANCE - BUDGET AND ACTUAL (Continued)RECREATION FUND
For the Year Ended December 31, 2009
WHEATON PARK DISTRICTWHEATON, ILLINOIS
DETAILED SCHEDULE OF REVENUES, EXPENDITURES AND
EXPENDITURES (Continued)Current (Continued)
General government (Continued)Administrative (Continued)
Capital expendituresCommunity Park 24,911$ 24,957$ 46$
Total capital expenditures 24,911 24,957 46
Total general government 3,115,211 2,830,535 (284,676)
Culture and recreationRecreational programs
General programsSalaries 767,768 677,822 (89,946) Services 86,535 81,021 (5,514) Supplies 522,100 460,033 (62,067) Contractual services 878,282 793,333 (84,949)
Total general programs 2,254,685 2,012,209 (242,476)
Community centerSalaries 316,406 355,048 38,642 Services 5,305 1,465 (3,840) Supplies 49,028 35,403 (13,625) Contractual services 490,298 508,042 17,744 Capital expenditures 669 722 53
Total community center 861,706 900,680 38,974
Fitness centerSalaries 587,113 582,147 (4,966) Services 31,714 22,103 (9,611) Supplies 64,614 62,728 (1,886) Contractual services 107,105 81,238 (25,867) Capital expenditures 1,701 325 (1,376)
Total fitness center 792,247 748,541 (43,706)
Northside PoolSalaries 220,572 197,351 (23,221) Services 1,750 1,820 70 Supplies 54,433 41,072 (13,361)
(This schedule is continued on the following page.)- 52 -
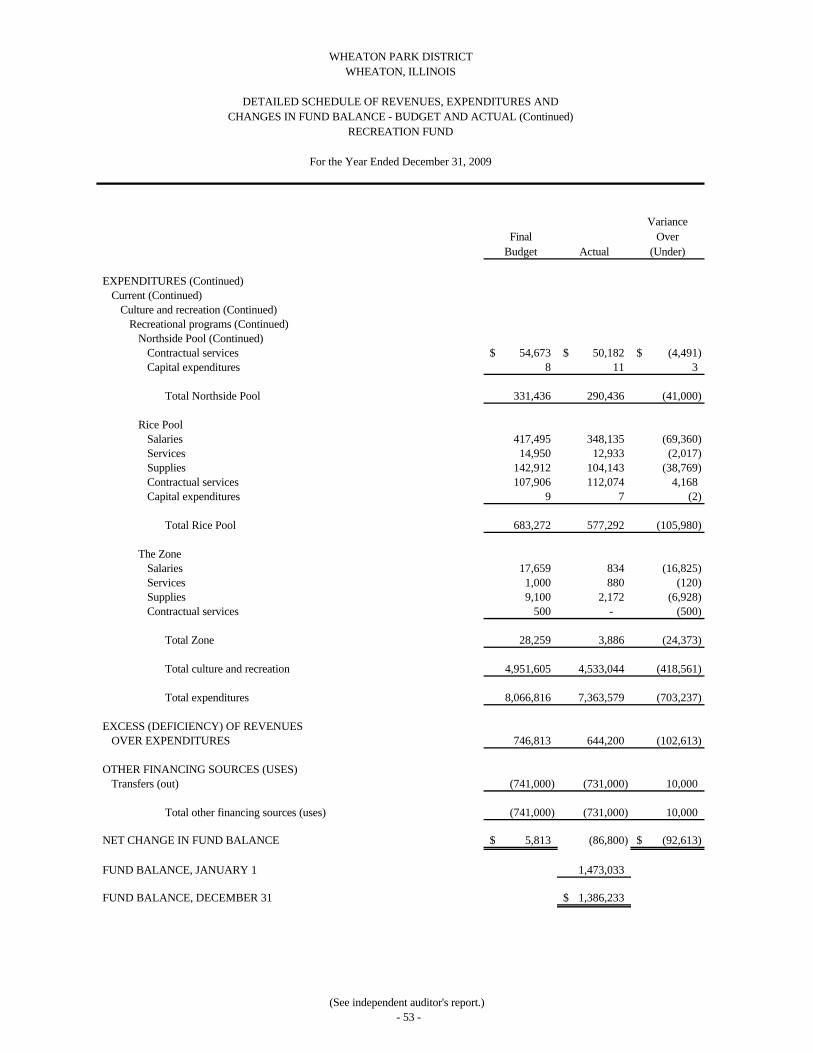
VarianceFinal Over
Budget Actual (Under)
CHANGES IN FUND BALANCE - BUDGET AND ACTUAL (Continued)RECREATION FUND
For the Year Ended December 31, 2009
WHEATON PARK DISTRICTWHEATON, ILLINOIS
DETAILED SCHEDULE OF REVENUES, EXPENDITURES AND
EXPENDITURES (Continued)Current (Continued)
Culture and recreation (Continued)Recreational programs (Continued)
Northside Pool (Continued)Contractual services 54,673$ 50,182$ (4,491)$ Capital expenditures 8 11 3
Total Northside Pool 331,436 290,436 (41,000)
Rice PoolSalaries 417,495 348,135 (69,360) Services 14,950 12,933 (2,017) Supplies 142,912 104,143 (38,769) Contractual services 107,906 112,074 4,168 Capital expenditures 9 7 (2)
Total Rice Pool 683,272 577,292 (105,980)
The ZoneSalaries 17,659 834 (16,825) Services 1,000 880 (120) Supplies 9,100 2,172 (6,928) Contractual services 500 - (500)
Total Zone 28,259 3,886 (24,373)
Total culture and recreation 4,951,605 4,533,044 (418,561)
Total expenditures 8,066,816 7,363,579 (703,237)
EXCESS (DEFICIENCY) OF REVENUESOVER EXPENDITURES 746,813 644,200 (102,613)
OTHER FINANCING SOURCES (USES)Transfers (out) (741,000) (731,000) 10,000
Total other financing sources (uses) (741,000) (731,000) 10,000
NET CHANGE IN FUND BALANCE 5,813$ (86,800) (92,613)$
FUND BALANCE, JANUARY 1 1,473,033
FUND BALANCE, DECEMBER 31 1,386,233$
(See independent auditor's report.)- 53 -
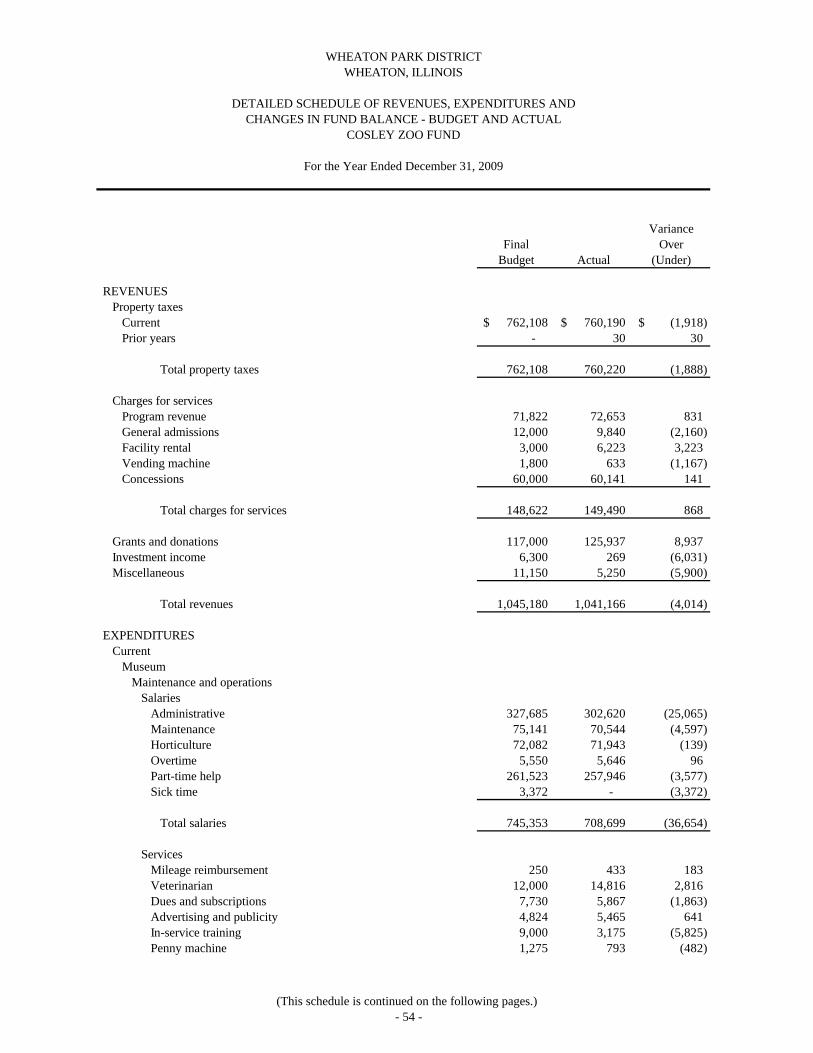
VarianceFinal Over
Budget Actual (Under)
REVENUESProperty taxes
Current 762,108$ 760,190$ (1,918)$ Prior years - 30 30
Total property taxes 762,108 760,220 (1,888)
Charges for servicesProgram revenue 71,822 72,653 831 General admissions 12,000 9,840 (2,160) Facility rental 3,000 6,223 3,223 Vending machine 1,800 633 (1,167) Concessions 60,000 60,141 141
Total charges for services 148,622 149,490 868
Grants and donations 117,000 125,937 8,937 Investment income 6,300 269 (6,031) Miscellaneous 11,150 5,250 (5,900)
Total revenues 1,045,180 1,041,166 (4,014)
EXPENDITURESCurrent
MuseumMaintenance and operations
SalariesAdministrative 327,685 302,620 (25,065) Maintenance 75,141 70,544 (4,597) Horticulture 72,082 71,943 (139) Overtime 5,550 5,646 96 Part-time help 261,523 257,946 (3,577) Sick time 3,372 - (3,372)
Total salaries 745,353 708,699 (36,654)
ServicesMileage reimbursement 250 433 183 Veterinarian 12,000 14,816 2,816 Dues and subscriptions 7,730 5,867 (1,863) Advertising and publicity 4,824 5,465 641 In-service training 9,000 3,175 (5,825) Penny machine 1,275 793 (482)
COSLEY ZOO FUND
For the Year Ended December 31, 2009
WHEATON PARK DISTRICTWHEATON, ILLINOIS
DETAILED SCHEDULE OF REVENUES, EXPENDITURES ANDCHANGES IN FUND BALANCE - BUDGET AND ACTUAL
(This schedule is continued on the following pages.)- 54 -
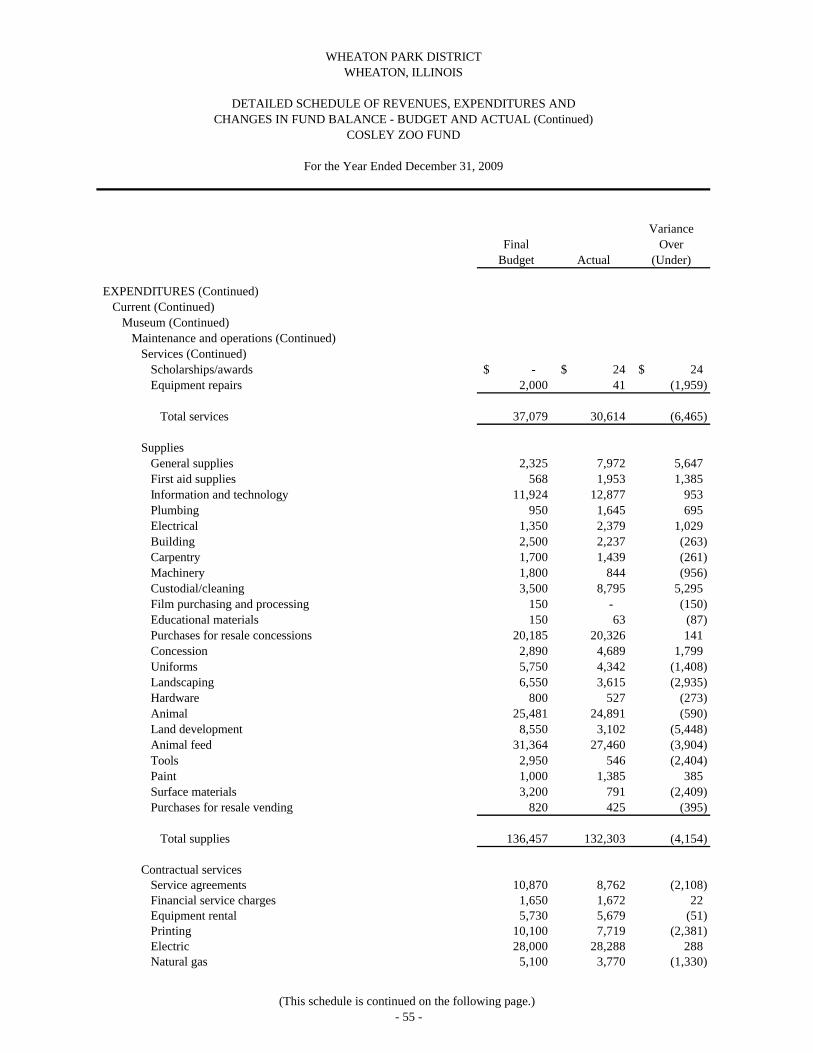
VarianceFinal Over
Budget Actual (Under)
EXPENDITURES (Continued)Current (Continued)
Museum (Continued)Maintenance and operations (Continued)
Services (Continued)Scholarships/awards -$ 24$ 24$ Equipment repairs 2,000 41 (1,959)
Total services 37,079 30,614 (6,465)
SuppliesGeneral supplies 2,325 7,972 5,647 First aid supplies 568 1,953 1,385 Information and technology 11,924 12,877 953 Plumbing 950 1,645 695 Electrical 1,350 2,379 1,029 Building 2,500 2,237 (263) Carpentry 1,700 1,439 (261) Machinery 1,800 844 (956) Custodial/cleaning 3,500 8,795 5,295 Film purchasing and processing 150 - (150) Educational materials 150 63 (87) Purchases for resale concessions 20,185 20,326 141 Concession 2,890 4,689 1,799 Uniforms 5,750 4,342 (1,408) Landscaping 6,550 3,615 (2,935) Hardware 800 527 (273) Animal 25,481 24,891 (590) Land development 8,550 3,102 (5,448) Animal feed 31,364 27,460 (3,904) Tools 2,950 546 (2,404) Paint 1,000 1,385 385 Surface materials 3,200 791 (2,409) Purchases for resale vending 820 425 (395)
Total supplies 136,457 132,303 (4,154)
Contractual servicesService agreements 10,870 8,762 (2,108) Financial service charges 1,650 1,672 22 Equipment rental 5,730 5,679 (51) Printing 10,100 7,719 (2,381) Electric 28,000 28,288 288 Natural gas 5,100 3,770 (1,330)
WHEATON PARK DISTRICTWHEATON, ILLINOIS
DETAILED SCHEDULE OF REVENUES, EXPENDITURES ANDCHANGES IN FUND BALANCE - BUDGET AND ACTUAL (Continued)
COSLEY ZOO FUND
For the Year Ended December 31, 2009
(This schedule is continued on the following page.)- 55 -
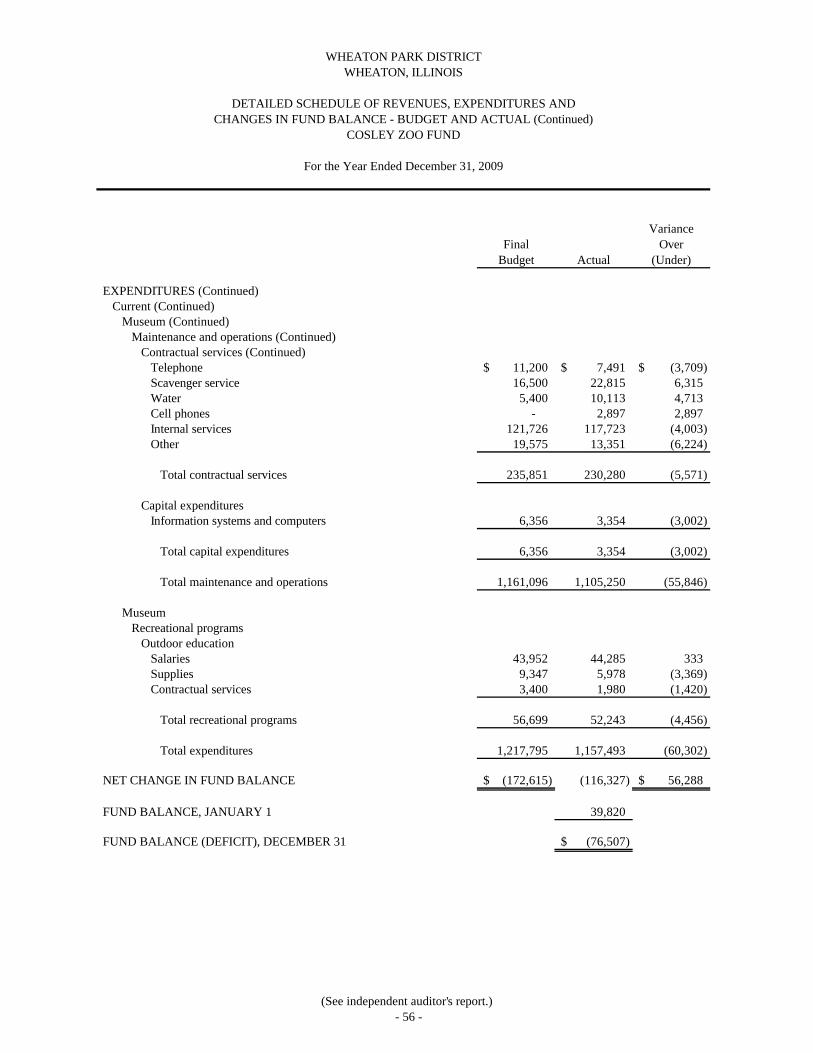
VarianceFinal Over
Budget Actual (Under)
WHEATON PARK DISTRICTWHEATON, ILLINOIS
DETAILED SCHEDULE OF REVENUES, EXPENDITURES ANDCHANGES IN FUND BALANCE - BUDGET AND ACTUAL (Continued)
COSLEY ZOO FUND
For the Year Ended December 31, 2009
EXPENDITURES (Continued)Current (Continued)
Museum (Continued)Maintenance and operations (Continued)
Contractual services (Continued)Telephone 11,200$ 7,491$ (3,709)$ Scavenger service 16,500 22,815 6,315 Water 5,400 10,113 4,713 Cell phones - 2,897 2,897 Internal services 121,726 117,723 (4,003) Other 19,575 13,351 (6,224)
Total contractual services 235,851 230,280 (5,571)
Capital expendituresInformation systems and computers 6,356 3,354 (3,002)
Total capital expenditures 6,356 3,354 (3,002)
Total maintenance and operations 1,161,096 1,105,250 (55,846)
MuseumRecreational programs
Outdoor educationSalaries 43,952 44,285 333 Supplies 9,347 5,978 (3,369) Contractual services 3,400 1,980 (1,420)
Total recreational programs 56,699 52,243 (4,456)
Total expenditures 1,217,795 1,157,493 (60,302)
NET CHANGE IN FUND BALANCE (172,615)$ (116,327) 56,288$
FUND BALANCE, JANUARY 1 39,820
FUND BALANCE (DEFICIT), DECEMBER 31 (76,507)$
(See independent auditor's report.)- 56 -
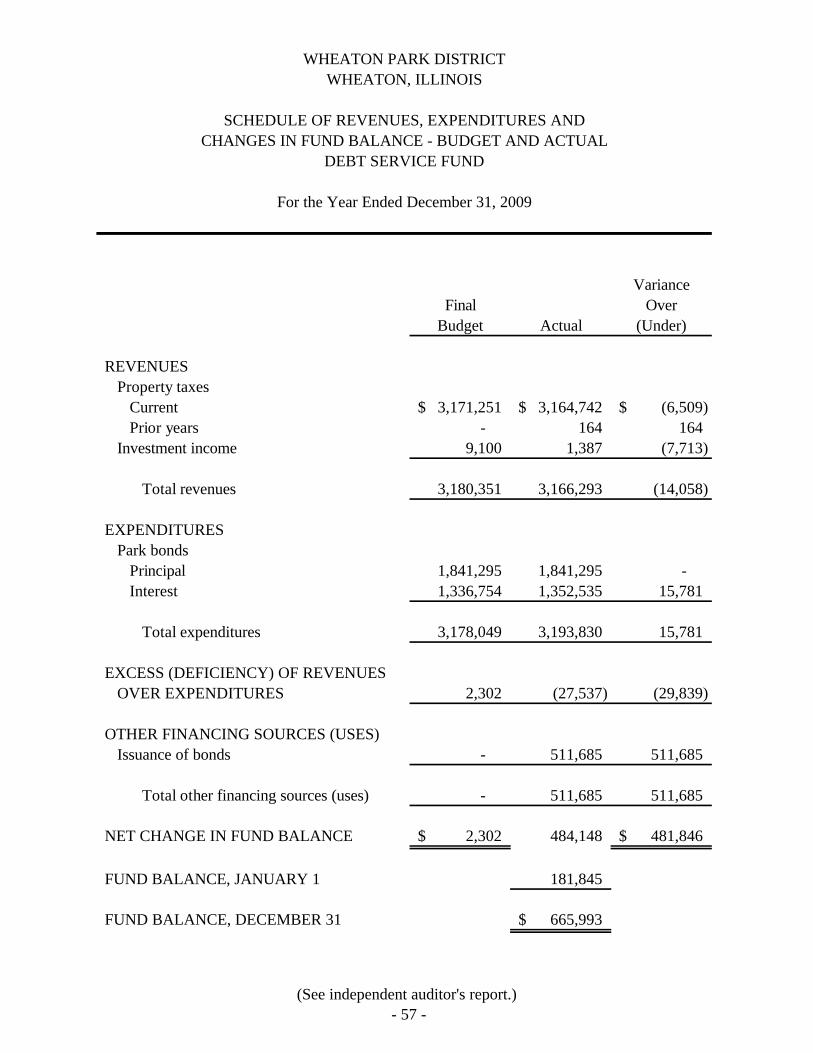
VarianceFinal Over
Budget Actual (Under)
REVENUESProperty taxes
Current 3,171,251$ 3,164,742$ (6,509)$ Prior years - 164 164
Investment income 9,100 1,387 (7,713)
Total revenues 3,180,351 3,166,293 (14,058)
EXPENDITURESPark bonds
Principal 1,841,295 1,841,295 - Interest 1,336,754 1,352,535 15,781
Total expenditures 3,178,049 3,193,830 15,781
EXCESS (DEFICIENCY) OF REVENUESOVER EXPENDITURES 2,302 (27,537) (29,839)
OTHER FINANCING SOURCES (USES)Issuance of bonds - 511,685 511,685
Total other financing sources (uses) - 511,685 511,685
NET CHANGE IN FUND BALANCE 2,302$ 484,148 481,846$
FUND BALANCE, JANUARY 1 181,845
FUND BALANCE, DECEMBER 31 665,993$
DEBT SERVICE FUND
For the Year Ended December 31, 2009
WHEATON PARK DISTRICTWHEATON, ILLINOIS
SCHEDULE OF REVENUES, EXPENDITURES ANDCHANGES IN FUND BALANCE - BUDGET AND ACTUAL
(See independent auditor's report.)- 57 -
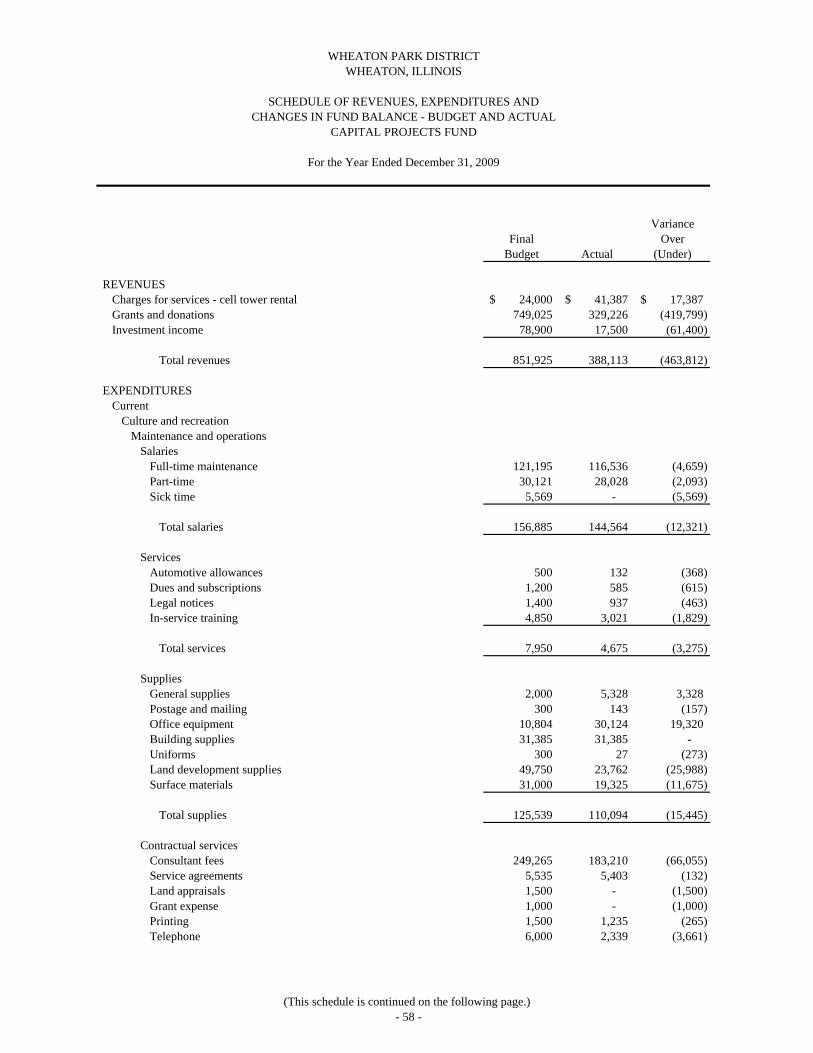
VarianceFinal Over
Budget Actual (Under)
REVENUESCharges for services - cell tower rental 24,000$ 41,387$ 17,387$ Grants and donations 749,025 329,226 (419,799) Investment income 78,900 17,500 (61,400)
Total revenues 851,925 388,113 (463,812)
EXPENDITURESCurrent
Culture and recreationMaintenance and operations
SalariesFull-time maintenance 121,195 116,536 (4,659) Part-time 30,121 28,028 (2,093) Sick time 5,569 - (5,569)
Total salaries 156,885 144,564 (12,321)
ServicesAutomotive allowances 500 132 (368) Dues and subscriptions 1,200 585 (615) Legal notices 1,400 937 (463) In-service training 4,850 3,021 (1,829)
Total services 7,950 4,675 (3,275)
SuppliesGeneral supplies 2,000 5,328 3,328 Postage and mailing 300 143 (157) Office equipment 10,804 30,124 19,320 Building supplies 31,385 31,385 - Uniforms 300 27 (273) Land development supplies 49,750 23,762 (25,988) Surface materials 31,000 19,325 (11,675)
Total supplies 125,539 110,094 (15,445)
Contractual servicesConsultant fees 249,265 183,210 (66,055) Service agreements 5,535 5,403 (132) Land appraisals 1,500 - (1,500) Grant expense 1,000 - (1,000) Printing 1,500 1,235 (265) Telephone 6,000 2,339 (3,661)
WHEATON PARK DISTRICTWHEATON, ILLINOIS
SCHEDULE OF REVENUES, EXPENDITURES ANDCHANGES IN FUND BALANCE - BUDGET AND ACTUAL
CAPITAL PROJECTS FUND
For the Year Ended December 31, 2009
(This schedule is continued on the following page.)- 58 -
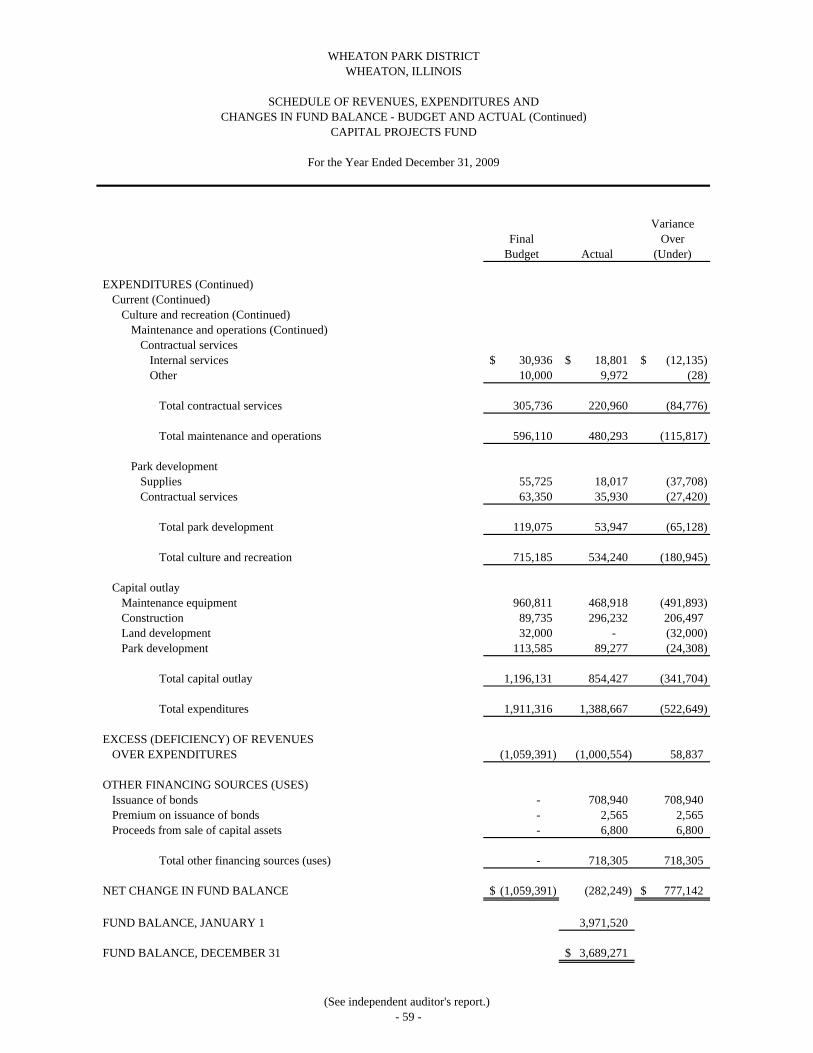
VarianceFinal Over
Budget Actual (Under)
EXPENDITURES (Continued)Current (Continued)
Culture and recreation (Continued)Maintenance and operations (Continued)
Contractual servicesInternal services 30,936$ 18,801$ (12,135)$ Other 10,000 9,972 (28)
Total contractual services 305,736 220,960 (84,776)
Total maintenance and operations 596,110 480,293 (115,817)
Park developmentSupplies 55,725 18,017 (37,708) Contractual services 63,350 35,930 (27,420)
Total park development 119,075 53,947 (65,128)
Total culture and recreation 715,185 534,240 (180,945)
Capital outlayMaintenance equipment 960,811 468,918 (491,893) Construction 89,735 296,232 206,497 Land development 32,000 - (32,000) Park development 113,585 89,277 (24,308)
Total capital outlay 1,196,131 854,427 (341,704)
Total expenditures 1,911,316 1,388,667 (522,649)
EXCESS (DEFICIENCY) OF REVENUESOVER EXPENDITURES (1,059,391) (1,000,554) 58,837
OTHER FINANCING SOURCES (USES)Issuance of bonds - 708,940 708,940 Premium on issuance of bonds - 2,565 2,565 Proceeds from sale of capital assets - 6,800 6,800
Total other financing sources (uses) - 718,305 718,305
NET CHANGE IN FUND BALANCE (1,059,391)$ (282,249) 777,142$
FUND BALANCE, JANUARY 1 3,971,520
FUND BALANCE, DECEMBER 31 3,689,271$
WHEATON PARK DISTRICTWHEATON, ILLINOIS
SCHEDULE OF REVENUES, EXPENDITURES ANDCHANGES IN FUND BALANCE - BUDGET AND ACTUAL (Continued)
CAPITAL PROJECTS FUND
For the Year Ended December 31, 2009
(See independent auditor's report.)- 59 -
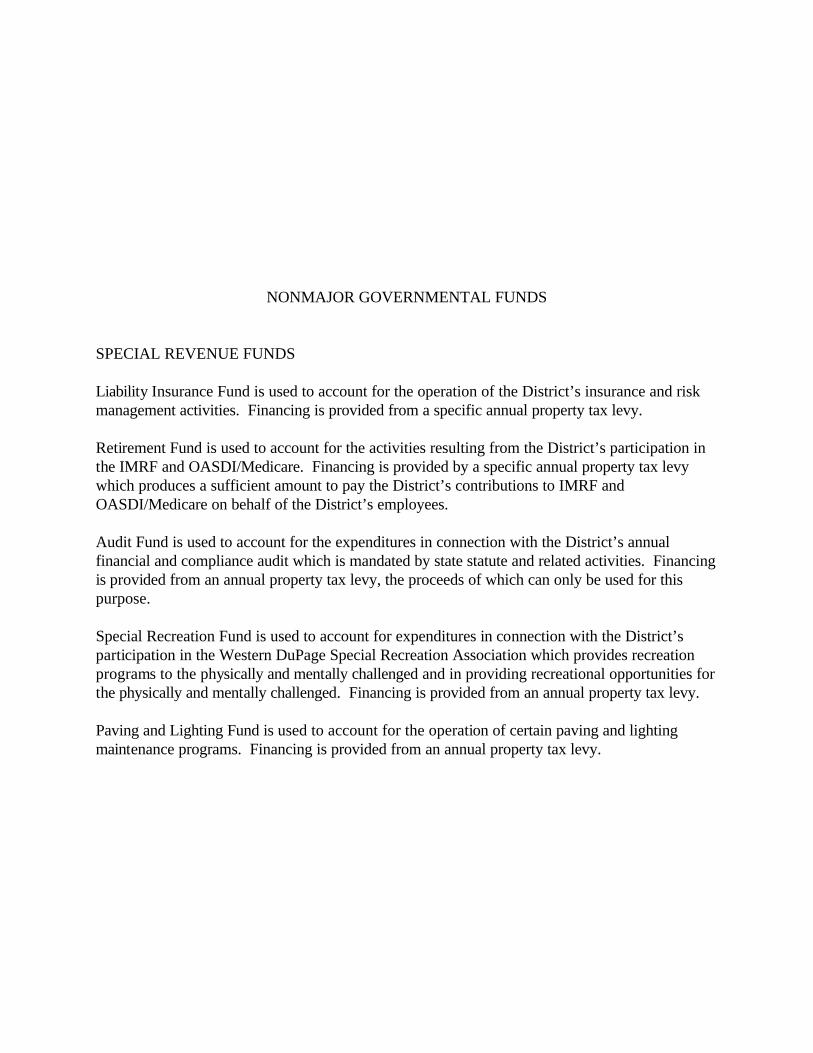
NONMAJOR GOVERNMENTAL FUNDS
SPECIAL REVENUE FUNDS
Liability Insurance Fund is used to account for the operation of the District’s insurance and risk management activities. Financing is provided from a specific annual property tax levy.
Retirement Fund is used to account for the activities resulting from the District’s participation in the IMRF and OASDI/Medicare. Financing is provided by a specific annual property tax levy which produces a sufficient amount to pay the District’s contributions to IMRF and OASDI/Medicare on behalf of the District’s employees.
Audit Fund is used to account for the expenditures in connection with the District’s annual financial and compliance audit which is mandated by state statute and related activities. Financing is provided from an annual property tax levy, the proceeds of which can only be used for this purpose.
Special Recreation Fund is used to account for expenditures in connection with the District’s participation in the Western DuPage Special Recreation Association which provides recreation programs to the physically and mentally challenged and in providing recreational opportunities for the physically and mentally challenged. Financing is provided from an annual property tax levy.
Paving and Lighting Fund is used to account for the operation of certain paving and lighting maintenance programs. Financing is provided from an annual property tax levy.
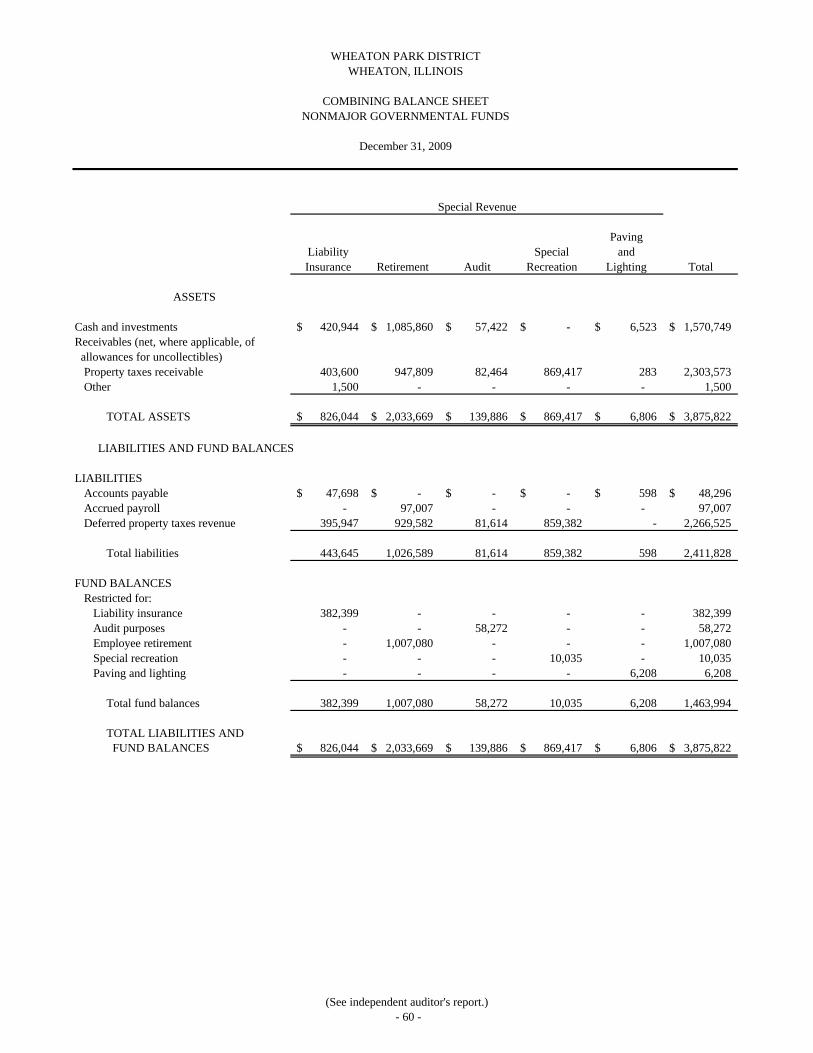
PavingLiability Special andInsurance Retirement Audit Recreation Lighting Total
ASSETS
Cash and investments 420,944$ 1,085,860$ 57,422$ -$ 6,523$ 1,570,749$ Receivables (net, where applicable, of
allowances for uncollectibles)Property taxes receivable 403,600 947,809 82,464 869,417 283 2,303,573 Other 1,500 - - - - 1,500
TOTAL ASSETS 826,044$ 2,033,669$ 139,886$ 869,417$ 6,806$ 3,875,822$
LIABILITIES AND FUND BALANCES
LIABILITIESAccounts payable 47,698$ -$ -$ -$ 598$ 48,296$ Accrued payroll - 97,007 - - - 97,007 Deferred property taxes revenue 395,947 929,582 81,614 859,382 - 2,266,525
Total liabilities 443,645 1,026,589 81,614 859,382 598 2,411,828
FUND BALANCES
Restricted for:Liability insurance 382,399 - - - - 382,399 Audit purposes - - 58,272 - - 58,272 Employee retirement - 1,007,080 - - - 1,007,080 Special recreation - - - 10,035 - 10,035 Paving and lighting - - - - 6,208 6,208
Total fund balances 382,399 1,007,080 58,272 10,035 6,208 1,463,994
TOTAL LIABILITIES AND
FUND BALANCES 826,044$ 2,033,669$ 139,886$ 869,417$ 6,806$ 3,875,822$
December 31, 2009
Special Revenue
WHEATON PARK DISTRICTWHEATON, ILLINOIS
COMBINING BALANCE SHEETNONMAJOR GOVERNMENTAL FUNDS
(See independent auditor's report.)- 60 -
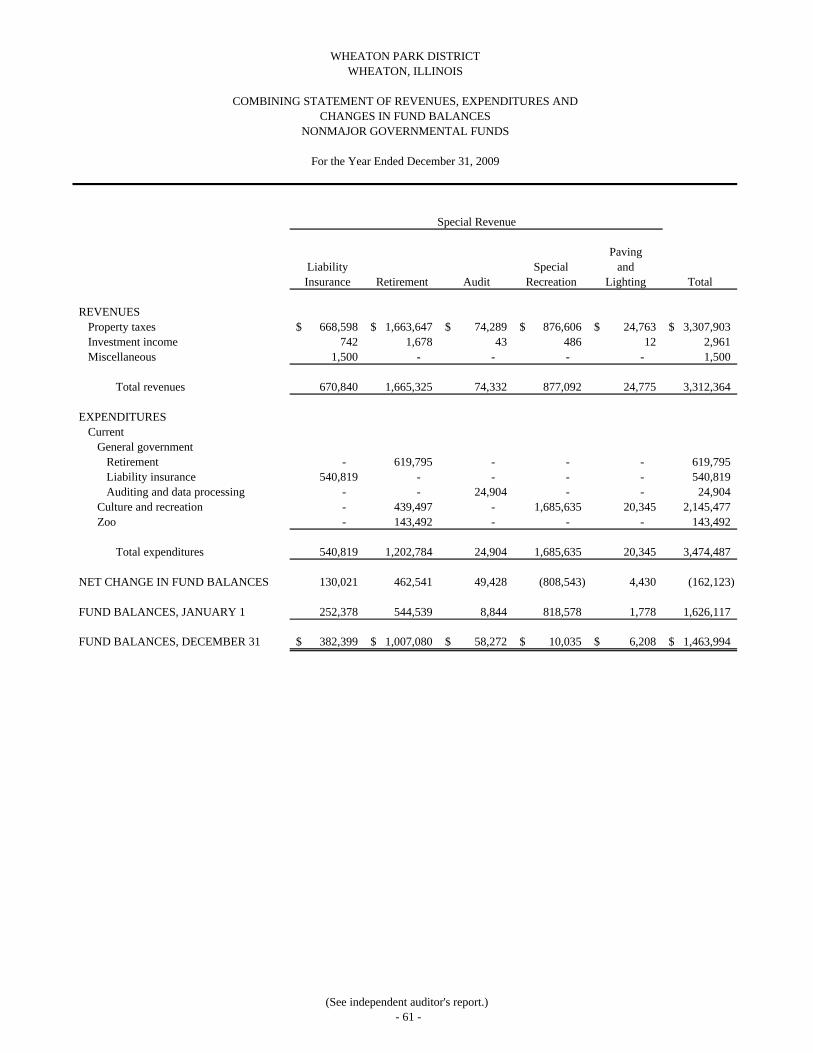
PavingLiability Special andInsurance Retirement Audit Recreation Lighting Total
REVENUESProperty taxes 668,598$ 1,663,647$ 74,289$ 876,606$ 24,763$ 3,307,903$ Investment income 742 1,678 43 486 12 2,961 Miscellaneous 1,500 - - - - 1,500
Total revenues 670,840 1,665,325 74,332 877,092 24,775 3,312,364
EXPENDITURES
CurrentGeneral government
Retirement - 619,795 - - - 619,795 Liability insurance 540,819 - - - - 540,819 Auditing and data processing - - 24,904 - - 24,904
Culture and recreation - 439,497 - 1,685,635 20,345 2,145,477 Zoo - 143,492 - - - 143,492
Total expenditures 540,819 1,202,784 24,904 1,685,635 20,345 3,474,487
NET CHANGE IN FUND BALANCES 130,021 462,541 49,428 (808,543) 4,430 (162,123)
FUND BALANCES, JANUARY 1 252,378 544,539 8,844 818,578 1,778 1,626,117
FUND BALANCES, DECEMBER 31 382,399$ 1,007,080$ 58,272$ 10,035$ 6,208$ 1,463,994$
CHANGES IN FUND BALANCESNONMAJOR GOVERNMENTAL FUNDS
For the Year Ended December 31, 2009
Special Revenue
WHEATON PARK DISTRICTWHEATON, ILLINOIS
COMBINING STATEMENT OF REVENUES, EXPENDITURES AND
(See independent auditor's report.)- 61 -
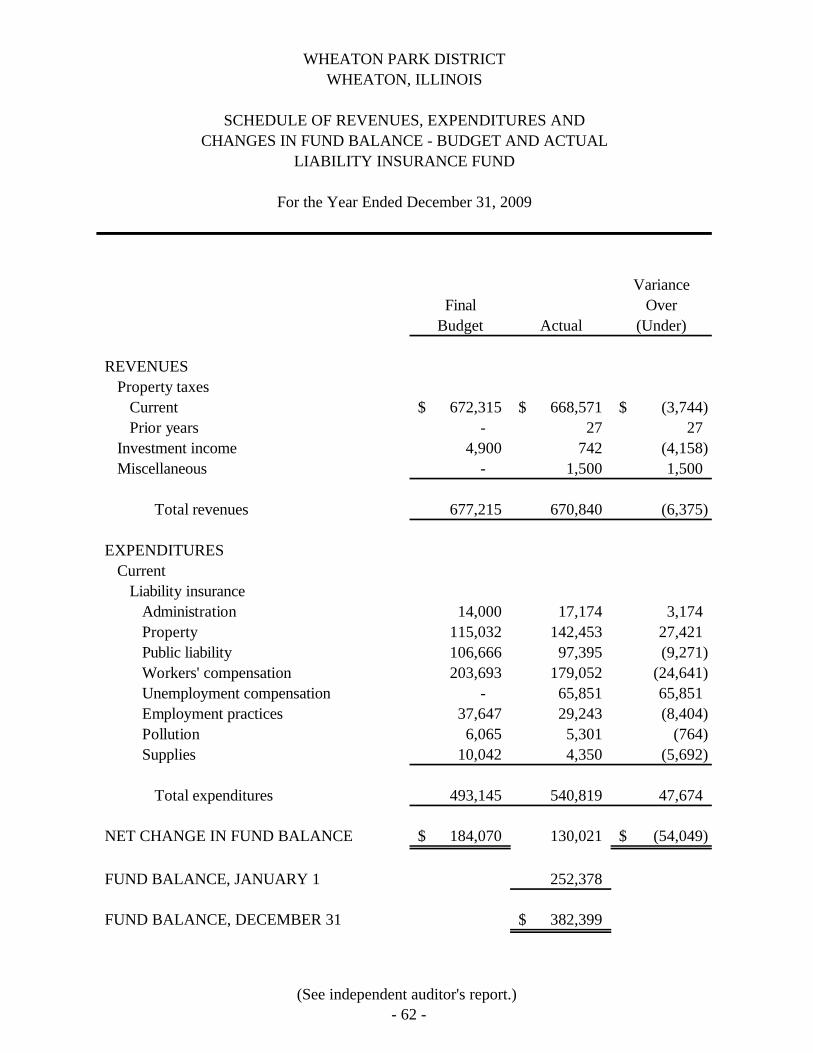
VarianceFinal Over
Budget Actual (Under)
REVENUESProperty taxes
Current 672,315$ 668,571$ (3,744)$ Prior years - 27 27
Investment income 4,900 742 (4,158) Miscellaneous - 1,500 1,500
Total revenues 677,215 670,840 (6,375)
EXPENDITURESCurrent
Liability insuranceAdministration 14,000 17,174 3,174 Property 115,032 142,453 27,421 Public liability 106,666 97,395 (9,271) Workers' compensation 203,693 179,052 (24,641) Unemployment compensation - 65,851 65,851 Employment practices 37,647 29,243 (8,404) Pollution 6,065 5,301 (764) Supplies 10,042 4,350 (5,692)
Total expenditures 493,145 540,819 47,674
NET CHANGE IN FUND BALANCE 184,070$ 130,021 (54,049)$
FUND BALANCE, JANUARY 1 252,378
FUND BALANCE, DECEMBER 31 382,399$
LIABILITY INSURANCE FUND
For the Year Ended December 31, 2009
WHEATON PARK DISTRICTWHEATON, ILLINOIS
SCHEDULE OF REVENUES, EXPENDITURES ANDCHANGES IN FUND BALANCE - BUDGET AND ACTUAL
(See independent auditor's report.)- 62 -
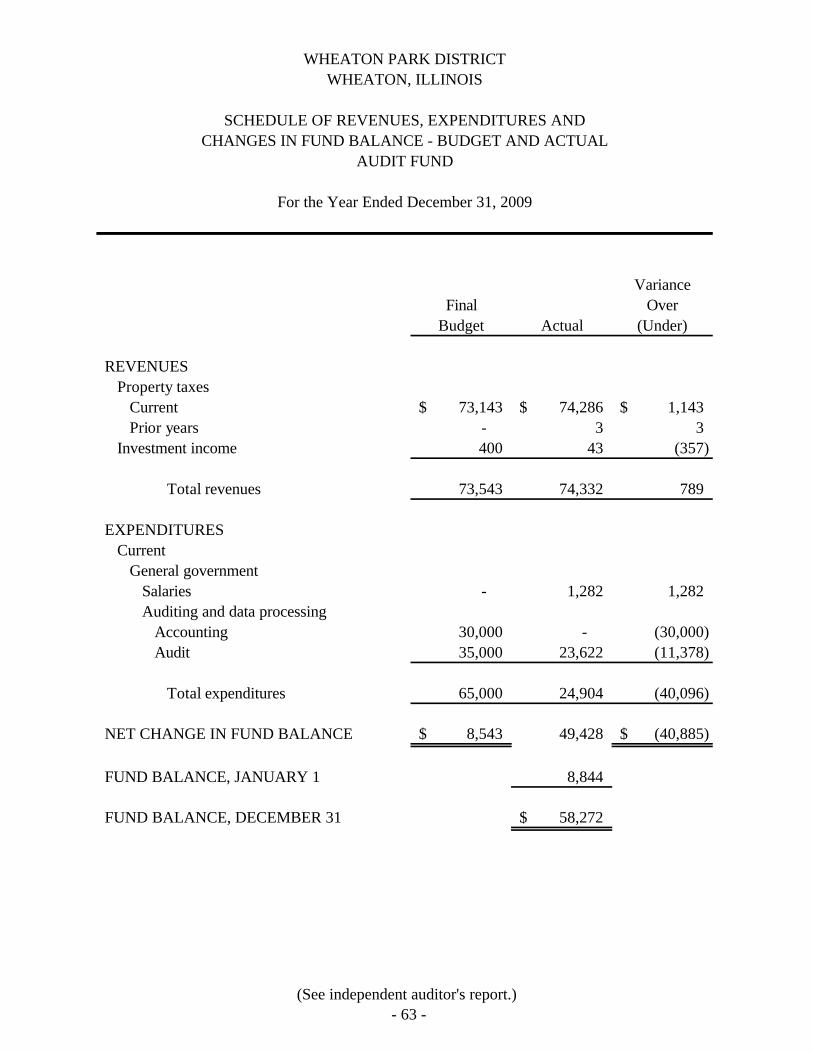
VarianceFinal Over
Budget Actual (Under)
REVENUESProperty taxes
Current 73,143$ 74,286$ 1,143$ Prior years - 3 3
Investment income 400 43 (357)
Total revenues 73,543 74,332 789
EXPENDITURESCurrent
General governmentSalaries - 1,282 1,282 Auditing and data processing
Accounting 30,000 - (30,000) Audit 35,000 23,622 (11,378)
Total expenditures 65,000 24,904 (40,096)
NET CHANGE IN FUND BALANCE 8,543$ 49,428 (40,885)$
FUND BALANCE, JANUARY 1 8,844
FUND BALANCE, DECEMBER 31 58,272$
AUDIT FUND
For the Year Ended December 31, 2009
WHEATON PARK DISTRICTWHEATON, ILLINOIS
SCHEDULE OF REVENUES, EXPENDITURES ANDCHANGES IN FUND BALANCE - BUDGET AND ACTUAL
(See independent auditor's report.)- 63 -
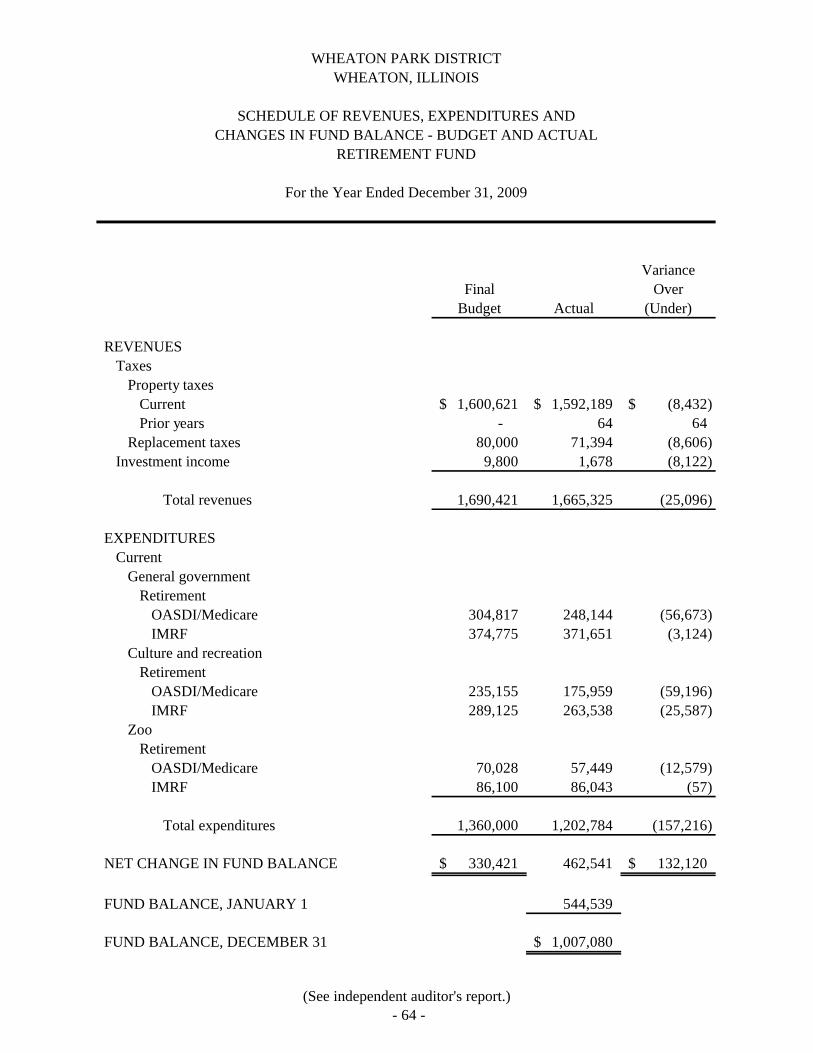
VarianceFinal Over
Budget Actual (Under)
REVENUESTaxes
Property taxesCurrent 1,600,621$ 1,592,189$ (8,432)$ Prior years - 64 64
Replacement taxes 80,000 71,394 (8,606) Investment income 9,800 1,678 (8,122)
Total revenues 1,690,421 1,665,325 (25,096)
EXPENDITURESCurrent
General governmentRetirement
OASDI/Medicare 304,817 248,144 (56,673) IMRF 374,775 371,651 (3,124)
Culture and recreationRetirement
OASDI/Medicare 235,155 175,959 (59,196) IMRF 289,125 263,538 (25,587)
ZooRetirement
OASDI/Medicare 70,028 57,449 (12,579) IMRF 86,100 86,043 (57)
Total expenditures 1,360,000 1,202,784 (157,216)
NET CHANGE IN FUND BALANCE 330,421$ 462,541 132,120$
FUND BALANCE, JANUARY 1 544,539
FUND BALANCE, DECEMBER 31 1,007,080$
WHEATON PARK DISTRICTWHEATON, ILLINOIS
SCHEDULE OF REVENUES, EXPENDITURES ANDCHANGES IN FUND BALANCE - BUDGET AND ACTUAL
RETIREMENT FUND
For the Year Ended December 31, 2009
(See independent auditor's report.)- 64 -
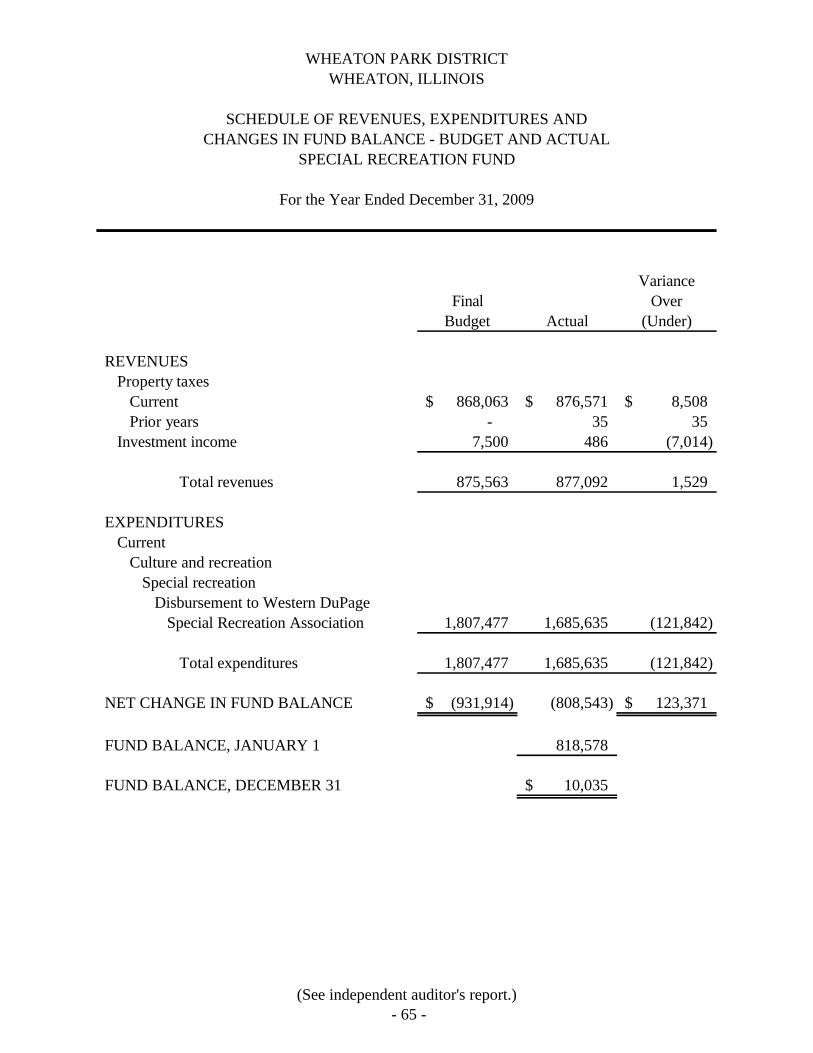
VarianceFinal Over
Budget Actual (Under)
REVENUESProperty taxes
Current 868,063$ 876,571$ 8,508$ Prior years - 35 35
Investment income 7,500 486 (7,014)
Total revenues 875,563 877,092 1,529
EXPENDITURESCurrent
Culture and recreationSpecial recreation
Disbursement to Western DuPageSpecial Recreation Association 1,807,477 1,685,635 (121,842)
Total expenditures 1,807,477 1,685,635 (121,842)
NET CHANGE IN FUND BALANCE (931,914)$ (808,543) 123,371$
FUND BALANCE, JANUARY 1 818,578
FUND BALANCE, DECEMBER 31 10,035$
SPECIAL RECREATION FUND
For the Year Ended December 31, 2009
WHEATON PARK DISTRICTWHEATON, ILLINOIS
SCHEDULE OF REVENUES, EXPENDITURES ANDCHANGES IN FUND BALANCE - BUDGET AND ACTUAL
(See independent auditor's report.)- 65 -

VarianceFinal Over
Budget Actual (Under)
REVENUESProperty taxes
Current 23,735$ 24,762$ 1,027$ Prior years - 1 1
Investment income 200 12 (188)
Total revenues 23,935 24,775 840
EXPENDITURESCurrent
General governmentMaintenance and operations
Supplies 22,600 20,345 (2,255)
Total expenditures 22,600 20,345 (2,255)
NET CHANGE IN FUND BALANCE 1,335$ 4,430 3,095$
FUND BALANCE, JANUARY 1 1,778
FUND BALANCE, DECEMBER 31 6,208$
PAVING AND LIGHTING FUND
For the Year Ended December 31, 2009
WHEATON PARK DISTRICTWHEATON, ILLINOIS
SCHEDULE OF REVENUES, EXPENDITURES ANDCHANGES IN FUND BALANCE - BUDGET AND ACTUAL
(See independent auditor's report.)- 66 -
MAJOR ENTERPRISE FUND
The Golf Course Fund accounts for the operation of the Arrowhead Golf Course and Clubhouse. Operations include greens fees, driving range, banquets, rentals and food and beverage sales. The cost of operations is recovered through user charges.
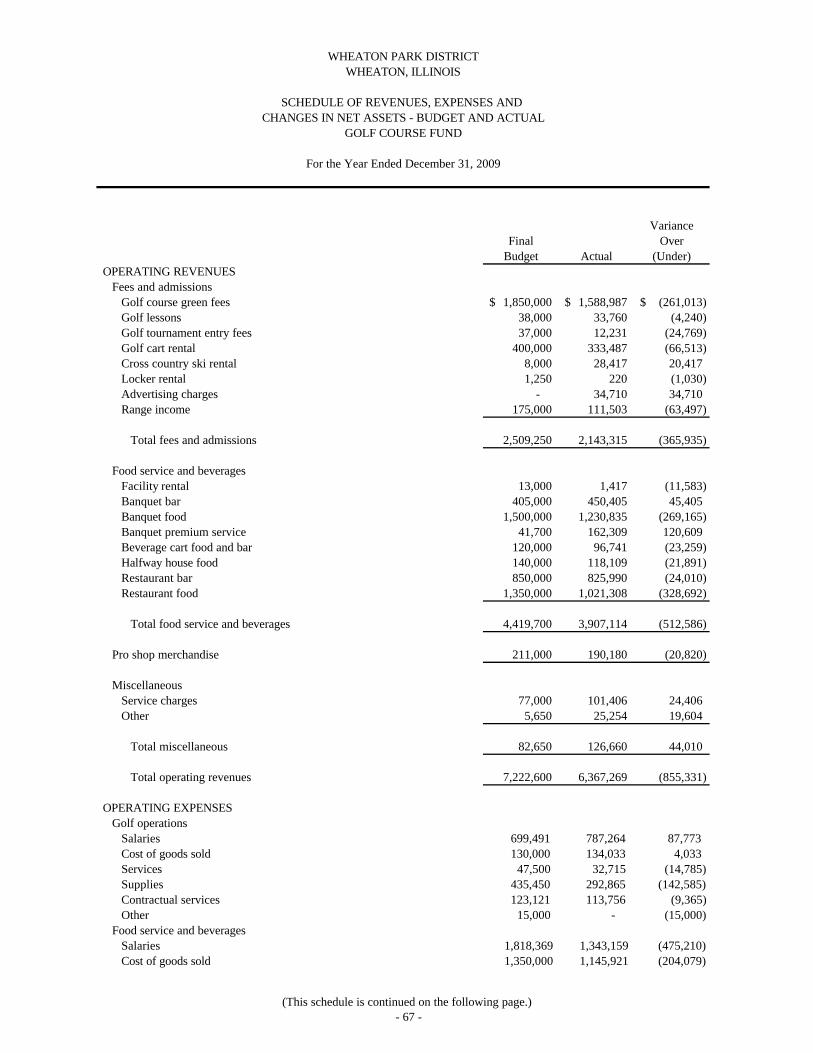
VarianceFinal Over
Budget Actual (Under)OPERATING REVENUES
Fees and admissionsGolf course green fees 1,850,000$ 1,588,987$ (261,013)$ Golf lessons 38,000 33,760 (4,240) Golf tournament entry fees 37,000 12,231 (24,769) Golf cart rental 400,000 333,487 (66,513) Cross country ski rental 8,000 28,417 20,417 Locker rental 1,250 220 (1,030) Advertising charges - 34,710 34,710 Range income 175,000 111,503 (63,497)
Total fees and admissions 2,509,250 2,143,315 (365,935)
Food service and beveragesFacility rental 13,000 1,417 (11,583) Banquet bar 405,000 450,405 45,405 Banquet food 1,500,000 1,230,835 (269,165) Banquet premium service 41,700 162,309 120,609 Beverage cart food and bar 120,000 96,741 (23,259) Halfway house food 140,000 118,109 (21,891) Restaurant bar 850,000 825,990 (24,010) Restaurant food 1,350,000 1,021,308 (328,692)
Total food service and beverages 4,419,700 3,907,114 (512,586)
Pro shop merchandise 211,000 190,180 (20,820)
MiscellaneousService charges 77,000 101,406 24,406 Other 5,650 25,254 19,604
Total miscellaneous 82,650 126,660 44,010
Total operating revenues 7,222,600 6,367,269 (855,331)
OPERATING EXPENSESGolf operations
Salaries 699,491 787,264 87,773 Cost of goods sold 130,000 134,033 4,033 Services 47,500 32,715 (14,785)Supplies 435,450 292,865 (142,585)Contractual services 123,121 113,756 (9,365)Other 15,000 - (15,000)
Food service and beveragesSalaries 1,818,369 1,343,159 (475,210)Cost of goods sold 1,350,000 1,145,921 (204,079)
WHEATON PARK DISTRICTWHEATON, ILLINOIS
SCHEDULE OF REVENUES, EXPENSES AND CHANGES IN NET ASSETS - BUDGET AND ACTUAL
GOLF COURSE FUND
For the Year Ended December 31, 2009
(This schedule is continued on the following page.)- 67 -
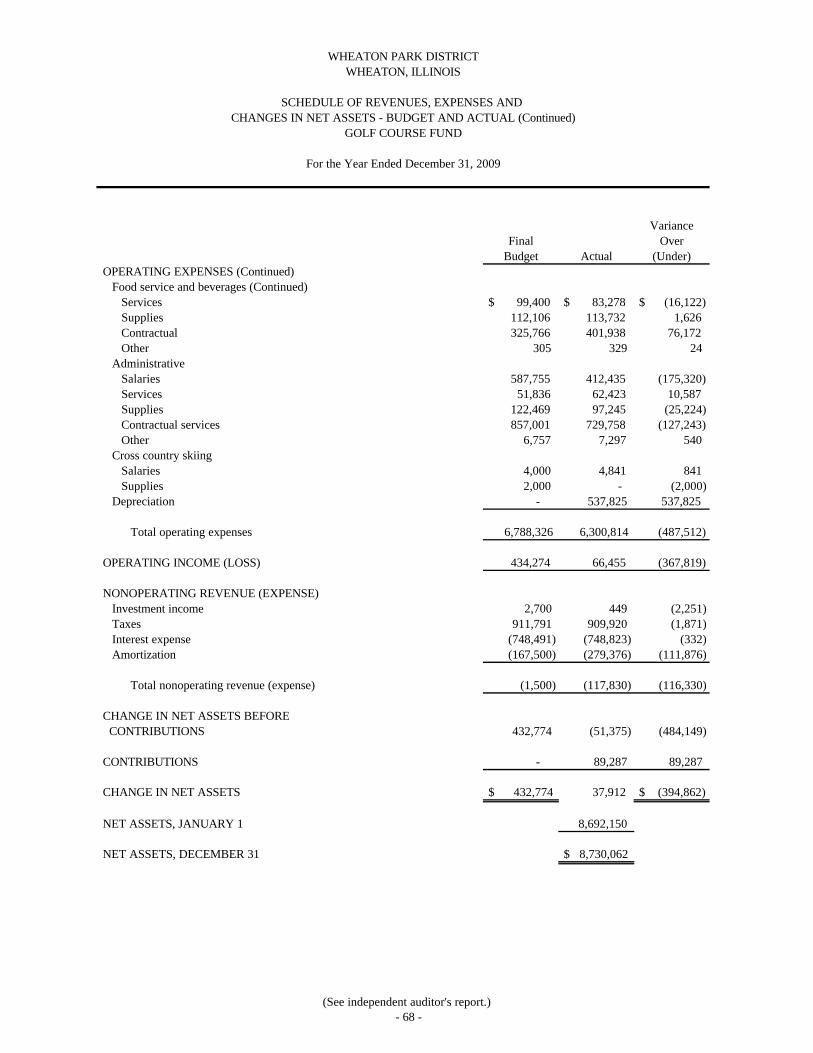
VarianceFinal Over
Budget Actual (Under)OPERATING EXPENSES (Continued)
Food service and beverages (Continued)Services $ 99,400 $ 83,278 $ (16,122)Supplies 112,106 113,732 1,626 Contractual 325,766 401,938 76,172 Other 305 329 24
AdministrativeSalaries 587,755 412,435 (175,320)Services 51,836 62,423 10,587 Supplies 122,469 97,245 (25,224)Contractual services 857,001 729,758 (127,243)Other 6,757 7,297 540
Cross country skiingSalaries 4,000 4,841 841 Supplies 2,000 - (2,000)
Depreciation - 537,825 537,825
Total operating expenses 6,788,326 6,300,814 (487,512)
OPERATING INCOME (LOSS) 434,274 66,455 (367,819)
NONOPERATING REVENUE (EXPENSE)Investment income 2,700 449 (2,251) Taxes 911,791 909,920 (1,871) Interest expense (748,491) (748,823) (332) Amortization (167,500) (279,376) (111,876)
Total nonoperating revenue (expense) (1,500) (117,830) (116,330)
CHANGE IN NET ASSETS BEFORE CONTRIBUTIONS 432,774 (51,375) (484,149)
CONTRIBUTIONS - 89,287 89,287
CHANGE IN NET ASSETS $ 432,774 37,912 $ (394,862)
NET ASSETS, JANUARY 1 8,692,150
NET ASSETS, DECEMBER 31 $ 8,730,062
WHEATON PARK DISTRICTWHEATON, ILLINOIS
SCHEDULE OF REVENUES, EXPENSES AND CHANGES IN NET ASSETS - BUDGET AND ACTUAL (Continued)
For the Year Ended December 31, 2009
GOLF COURSE FUND
(See independent auditor's report.)- 68 -
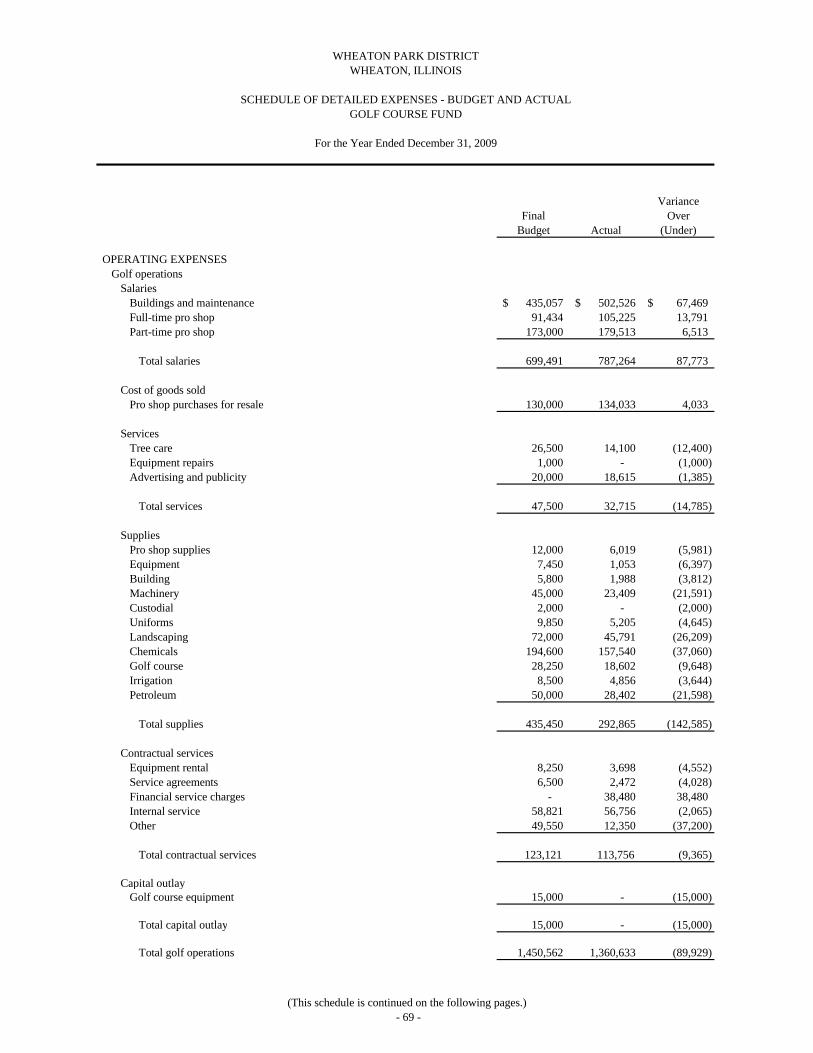
VarianceFinal Over
Budget Actual (Under)
OPERATING EXPENSESGolf operations
SalariesBuildings and maintenance 435,057$ 502,526$ 67,469$ Full-time pro shop 91,434 105,225 13,791 Part-time pro shop 173,000 179,513 6,513
Total salaries 699,491 787,264 87,773
Cost of goods soldPro shop purchases for resale 130,000 134,033 4,033
ServicesTree care 26,500 14,100 (12,400) Equipment repairs 1,000 - (1,000) Advertising and publicity 20,000 18,615 (1,385)
Total services 47,500 32,715 (14,785)
SuppliesPro shop supplies 12,000 6,019 (5,981) Equipment 7,450 1,053 (6,397) Building 5,800 1,988 (3,812) Machinery 45,000 23,409 (21,591) Custodial 2,000 - (2,000) Uniforms 9,850 5,205 (4,645) Landscaping 72,000 45,791 (26,209) Chemicals 194,600 157,540 (37,060) Golf course 28,250 18,602 (9,648) Irrigation 8,500 4,856 (3,644) Petroleum 50,000 28,402 (21,598)
Total supplies 435,450 292,865 (142,585)
Contractual servicesEquipment rental 8,250 3,698 (4,552) Service agreements 6,500 2,472 (4,028) Financial service charges - 38,480 38,480 Internal service 58,821 56,756 (2,065) Other 49,550 12,350 (37,200)
Total contractual services 123,121 113,756 (9,365)
Capital outlayGolf course equipment 15,000 - (15,000)
Total capital outlay 15,000 - (15,000)
Total golf operations 1,450,562 1,360,633 (89,929)
WHEATON PARK DISTRICTWHEATON, ILLINOIS
SCHEDULE OF DETAILED EXPENSES - BUDGET AND ACTUAL
For the Year Ended December 31, 2009
GOLF COURSE FUND
(This schedule is continued on the following pages.)- 69 -
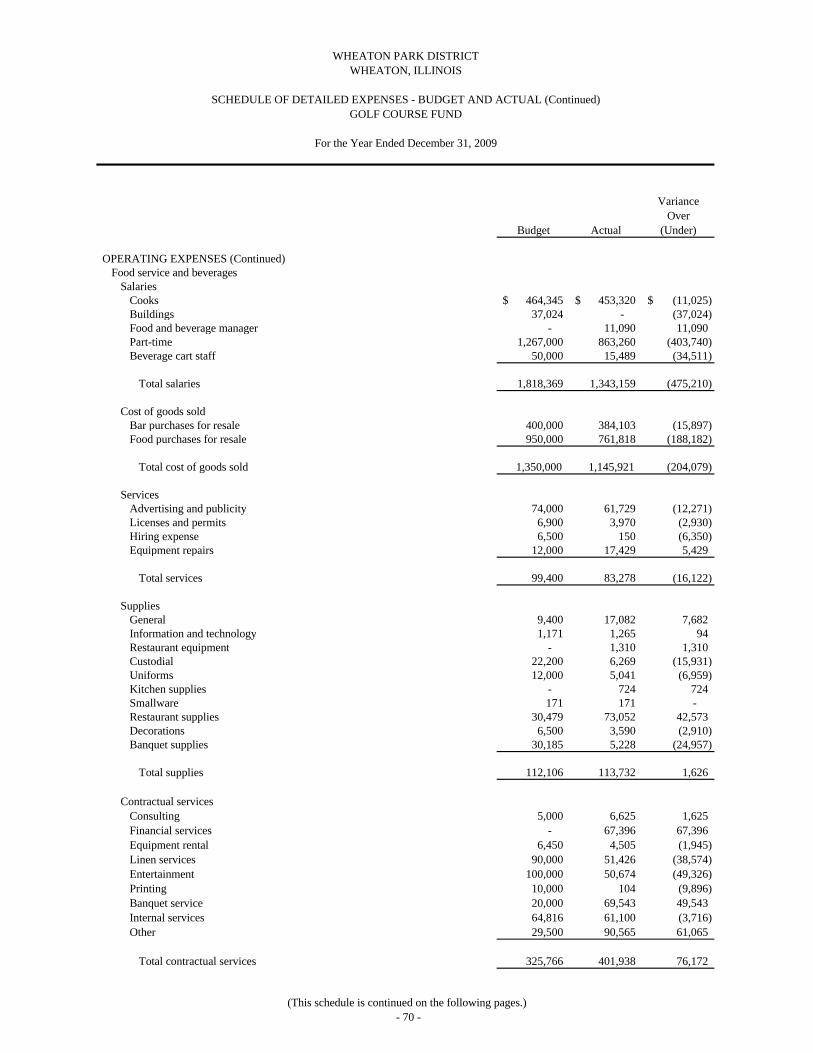
VarianceOver
Budget Actual (Under)
OPERATING EXPENSES (Continued)Food service and beverages
SalariesCooks 464,345$ 453,320$ (11,025)$ Buildings 37,024 - (37,024) Food and beverage manager - 11,090 11,090 Part-time 1,267,000 863,260 (403,740) Beverage cart staff 50,000 15,489 (34,511)
Total salaries 1,818,369 1,343,159 (475,210)
Cost of goods soldBar purchases for resale 400,000 384,103 (15,897) Food purchases for resale 950,000 761,818 (188,182)
Total cost of goods sold 1,350,000 1,145,921 (204,079)
ServicesAdvertising and publicity 74,000 61,729 (12,271) Licenses and permits 6,900 3,970 (2,930) Hiring expense 6,500 150 (6,350) Equipment repairs 12,000 17,429 5,429
Total services 99,400 83,278 (16,122)
SuppliesGeneral 9,400 17,082 7,682 Information and technology 1,171 1,265 94 Restaurant equipment - 1,310 1,310 Custodial 22,200 6,269 (15,931) Uniforms 12,000 5,041 (6,959) Kitchen supplies - 724 724 Smallware 171 171 - Restaurant supplies 30,479 73,052 42,573 Decorations 6,500 3,590 (2,910) Banquet supplies 30,185 5,228 (24,957)
Total supplies 112,106 113,732 1,626
Contractual servicesConsulting 5,000 6,625 1,625 Financial services - 67,396 67,396 Equipment rental 6,450 4,505 (1,945) Linen services 90,000 51,426 (38,574) Entertainment 100,000 50,674 (49,326) Printing 10,000 104 (9,896) Banquet service 20,000 69,543 49,543 Internal services 64,816 61,100 (3,716) Other 29,500 90,565 61,065
Total contractual services 325,766 401,938 76,172
WHEATON PARK DISTRICTWHEATON, ILLINOIS
SCHEDULE OF DETAILED EXPENSES - BUDGET AND ACTUAL (Continued)GOLF COURSE FUND
For the Year Ended December 31, 2009
(This schedule is continued on the following pages.)- 70 -
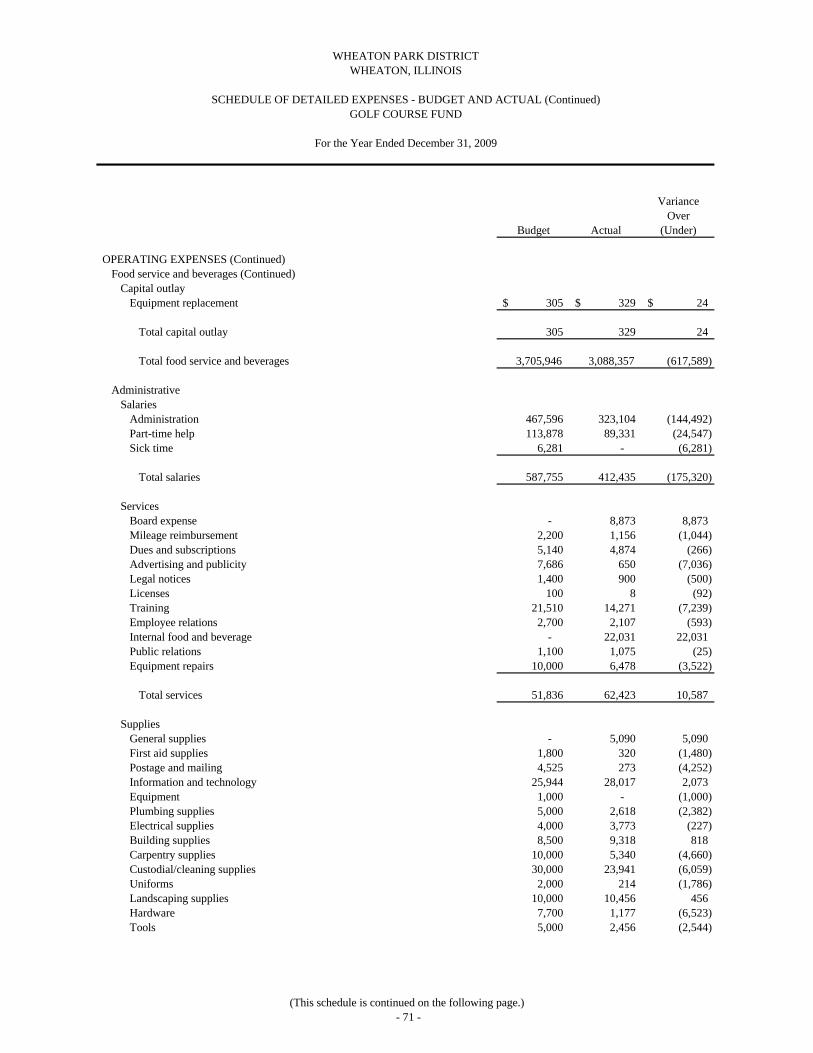
VarianceOver
Budget Actual (Under)
WHEATON PARK DISTRICTWHEATON, ILLINOIS
SCHEDULE OF DETAILED EXPENSES - BUDGET AND ACTUAL (Continued)GOLF COURSE FUND
For the Year Ended December 31, 2009
OPERATING EXPENSES (Continued)Food service and beverages (Continued)
Capital outlayEquipment replacement 305$ 329$ 24$
Total capital outlay 305 329 24
Total food service and beverages 3,705,946 3,088,357 (617,589)
AdministrativeSalaries
Administration 467,596 323,104 (144,492) Part-time help 113,878 89,331 (24,547) Sick time 6,281 - (6,281)
Total salaries 587,755 412,435 (175,320)
ServicesBoard expense - 8,873 8,873 Mileage reimbursement 2,200 1,156 (1,044) Dues and subscriptions 5,140 4,874 (266) Advertising and publicity 7,686 650 (7,036) Legal notices 1,400 900 (500) Licenses 100 8 (92) Training 21,510 14,271 (7,239) Employee relations 2,700 2,107 (593) Internal food and beverage - 22,031 22,031 Public relations 1,100 1,075 (25) Equipment repairs 10,000 6,478 (3,522)
Total services 51,836 62,423 10,587
SuppliesGeneral supplies - 5,090 5,090 First aid supplies 1,800 320 (1,480) Postage and mailing 4,525 273 (4,252) Information and technology 25,944 28,017 2,073 Equipment 1,000 - (1,000) Plumbing supplies 5,000 2,618 (2,382) Electrical supplies 4,000 3,773 (227) Building supplies 8,500 9,318 818 Carpentry supplies 10,000 5,340 (4,660) Custodial/cleaning supplies 30,000 23,941 (6,059) Uniforms 2,000 214 (1,786) Landscaping supplies 10,000 10,456 456 Hardware 7,700 1,177 (6,523) Tools 5,000 2,456 (2,544)
(This schedule is continued on the following page.)- 71 -
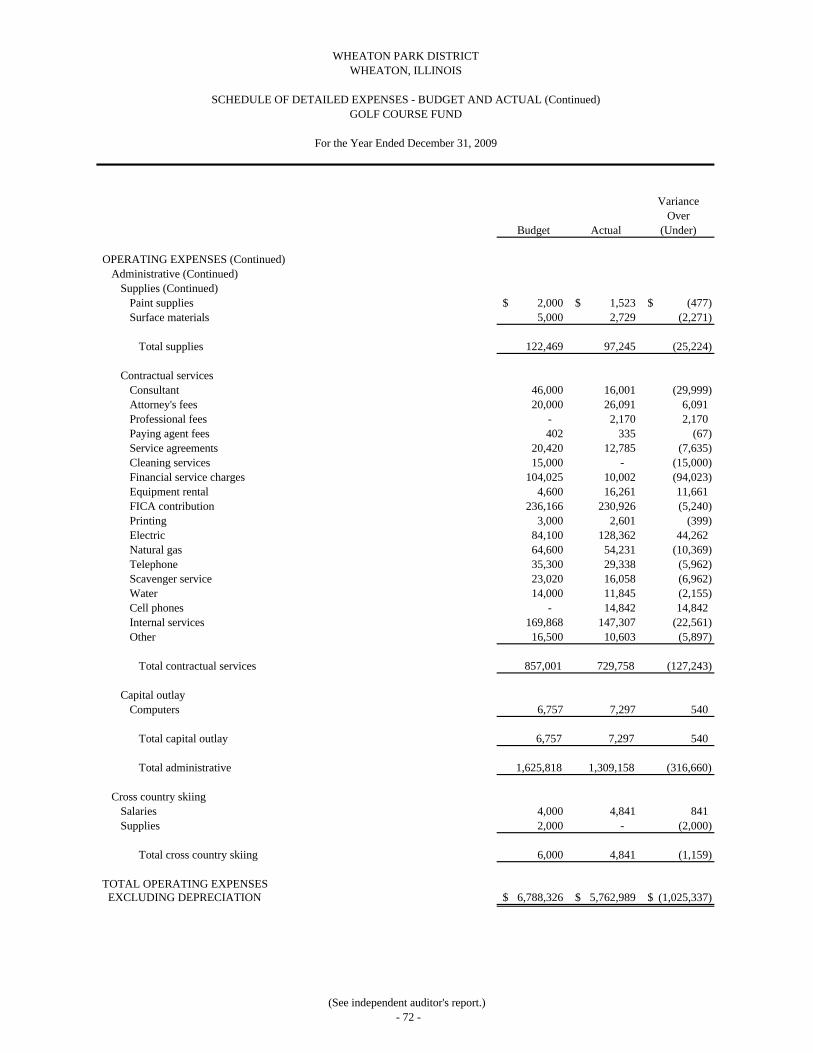
VarianceOver
Budget Actual (Under)
WHEATON PARK DISTRICTWHEATON, ILLINOIS
SCHEDULE OF DETAILED EXPENSES - BUDGET AND ACTUAL (Continued)GOLF COURSE FUND
For the Year Ended December 31, 2009
OPERATING EXPENSES (Continued)Administrative (Continued)
Supplies (Continued)Paint supplies 2,000$ 1,523$ (477)$ Surface materials 5,000 2,729 (2,271)
Total supplies 122,469 97,245 (25,224)
Contractual servicesConsultant 46,000 16,001 (29,999) Attorney's fees 20,000 26,091 6,091 Professional fees - 2,170 2,170 Paying agent fees 402 335 (67) Service agreements 20,420 12,785 (7,635) Cleaning services 15,000 - (15,000) Financial service charges 104,025 10,002 (94,023) Equipment rental 4,600 16,261 11,661 FICA contribution 236,166 230,926 (5,240) Printing 3,000 2,601 (399) Electric 84,100 128,362 44,262 Natural gas 64,600 54,231 (10,369) Telephone 35,300 29,338 (5,962) Scavenger service 23,020 16,058 (6,962) Water 14,000 11,845 (2,155) Cell phones - 14,842 14,842 Internal services 169,868 147,307 (22,561) Other 16,500 10,603 (5,897)
Total contractual services 857,001 729,758 (127,243)
Capital outlayComputers 6,757 7,297 540
Total capital outlay 6,757 7,297 540
Total administrative 1,625,818 1,309,158 (316,660)
Cross country skiingSalaries 4,000 4,841 841 Supplies 2,000 - (2,000)
Total cross country skiing 6,000 4,841 (1,159)
TOTAL OPERATING EXPENSESEXCLUDING DEPRECIATION 6,788,326$ 5,762,989$ (1,025,337)$
(See independent auditor's report.)- 72 -
INTERNAL SERVICE FUNDS
The Information Systems and Telecommunications Fund accounts for the costs related to the maintenance and capital expenditures for the District’s information systems and related technology.
The Health Insurance Fund accounts for the health insurance costs of the employees of the District.
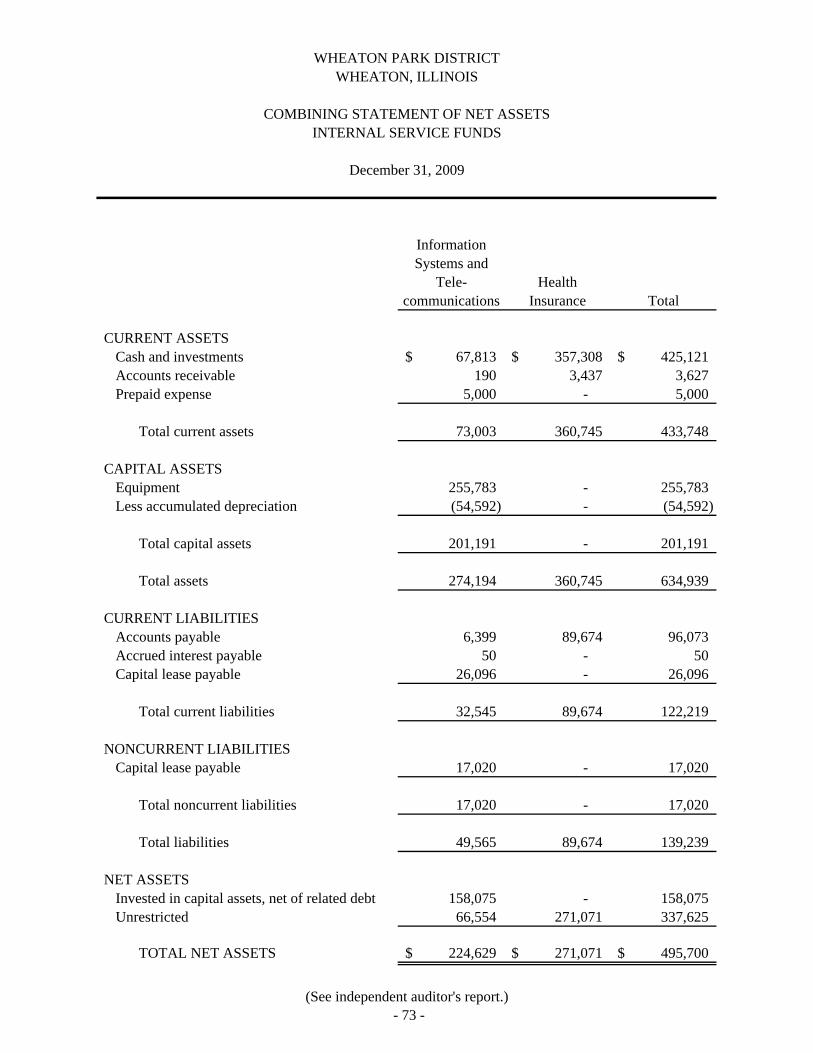
InformationSystems and
Tele- Healthcommunications Insurance Total
CURRENT ASSETSCash and investments 67,813$ 357,308$ 425,121$ Accounts receivable 190 3,437 3,627 Prepaid expense 5,000 - 5,000
Total current assets 73,003 360,745 433,748
CAPITAL ASSETSEquipment 255,783 - 255,783 Less accumulated depreciation (54,592) - (54,592)
Total capital assets 201,191 - 201,191
Total assets 274,194 360,745 634,939
CURRENT LIABILITIESAccounts payable 6,399 89,674 96,073 Accrued interest payable 50 - 50 Capital lease payable 26,096 - 26,096
Total current liabilities 32,545 89,674 122,219
NONCURRENT LIABILITIESCapital lease payable 17,020 - 17,020
Total noncurrent liabilities 17,020 - 17,020
Total liabilities 49,565 89,674 139,239
NET ASSETSInvested in capital assets, net of related debt 158,075 - 158,075 Unrestricted 66,554 271,071 337,625
TOTAL NET ASSETS 224,629$ 271,071$ 495,700$
WHEATON PARK DISTRICTWHEATON, ILLINOIS
COMBINING STATEMENT OF NET ASSETSINTERNAL SERVICE FUNDS
December 31, 2009
(See independent auditor's report.)- 73 -
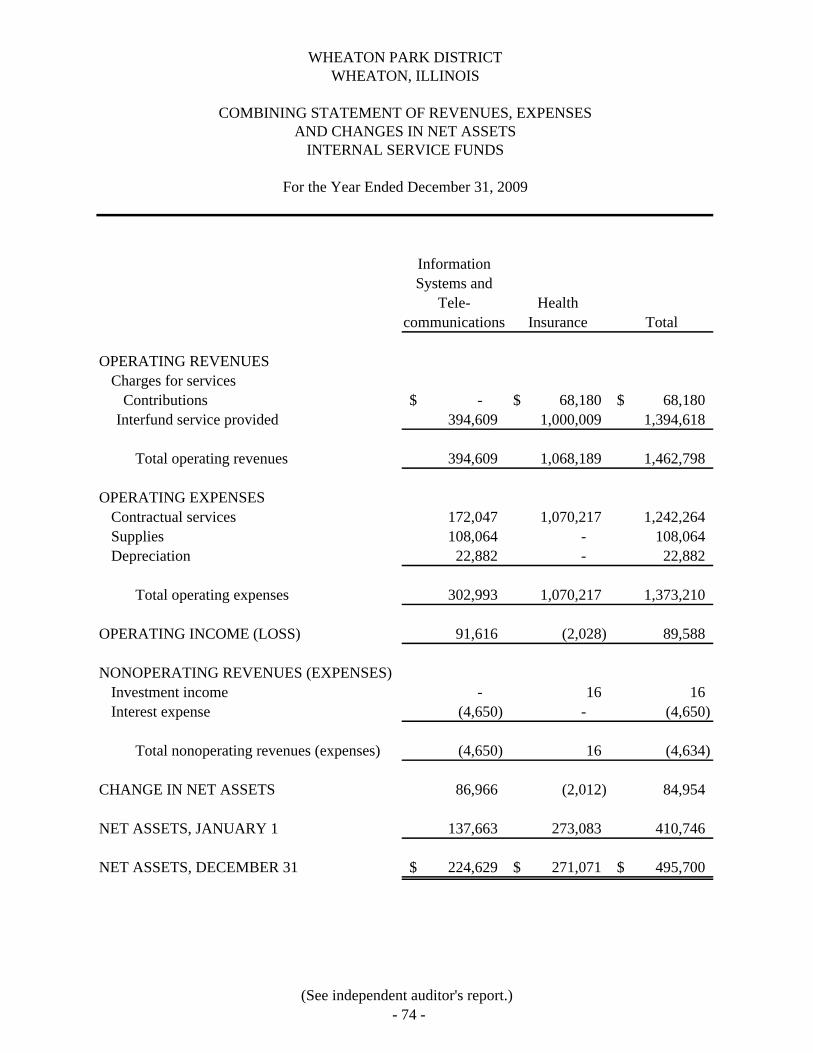
InformationSystems and
Tele- Healthcommunications Insurance Total
OPERATING REVENUESCharges for services
Contributions -$ 68,180$ 68,180$ Interfund service provided 394,609 1,000,009 1,394,618
Total operating revenues 394,609 1,068,189 1,462,798
OPERATING EXPENSESContractual services 172,047 1,070,217 1,242,264 Supplies 108,064 - 108,064 Depreciation 22,882 - 22,882
Total operating expenses 302,993 1,070,217 1,373,210
OPERATING INCOME (LOSS) 91,616 (2,028) 89,588
NONOPERATING REVENUES (EXPENSES)Investment income - 16 16 Interest expense (4,650) - (4,650)
Total nonoperating revenues (expenses) (4,650) 16 (4,634)
CHANGE IN NET ASSETS 86,966 (2,012) 84,954
NET ASSETS, JANUARY 1 137,663 273,083 410,746
NET ASSETS, DECEMBER 31 224,629$ 271,071$ 495,700$
WHEATON PARK DISTRICTWHEATON, ILLINOIS
COMBINING STATEMENT OF REVENUES, EXPENSESAND CHANGES IN NET ASSETS
INTERNAL SERVICE FUNDS
For the Year Ended December 31, 2009
(See independent auditor's report.)- 74 -

InformationSystems and
Tele- Healthcommunications Insurance Total
CASH FLOWS FROM OPERATING ACTIVITIES
Receipts from internal service provided 394,419$ 1,064,752$ 1,459,171$ Payments to suppliers (320,681) - (320,681) Claims paid - (1,068,718) (1,068,718)
Net cash from operating activities 73,738 (3,966) 69,772
CASH FLOWS FROM NONCAPITAL FINANCING ACTIVITIESNone - - -
CASH FLOWS FROM CAPITAL AND
RELATED FINANCING ACTIVITIESPrincipal payments - capital lease (24,055) - (24,055) Interest payments - capital lease (4,600) - (4,600) Purchase of capital assets (61,954) - (61,954)
Net cash from capital and related financing activities (90,609) - (90,609)
CASH FLOWS FROM INVESTING ACTIVITIESInterest on investments - 16 16
Net cash from investing activities - 16 16
NET INCREASE (DECREASE) IN CASH ANDCASH EQUIVALENTS (16,871) (3,950) (20,821)
CASH AND CASH EQUIVALENTS, JANUARY 1 84,684 361,258 445,942
CASH AND CASH EQUIVALENTS, DECEMBER 31 67,813$ 357,308$ 425,121$
RECONCILIATION OF OPERATING INCOME (LOSS) TO NETCASH FLOWS FROM OPERATING ACTIVITIESOperating income (loss) 91,616$ (2,028)$ 89,588$ Adjustments to reconcile operating income (loss)
to net cash from operating activitiesDepreciation 22,882 - 22,882 Changes in assets and liabilities
Accounts receivable (190) (3,437) (3,627) Prepaid expense (5,000) - (5,000) Accounts payable (35,570) 1,499 (34,071)
NET CASH FROM OPERATING ACTIVITIES 73,738$ (3,966)$ 69,772$
WHEATON PARK DISTRICTWHEATON, ILLINOIS
COMBINING STATEMENT OF CASH FLOWSINTERNAL SERVICE FUNDS
For the Year Ended December 31, 2009
(See independent auditor's report.)- 75 -
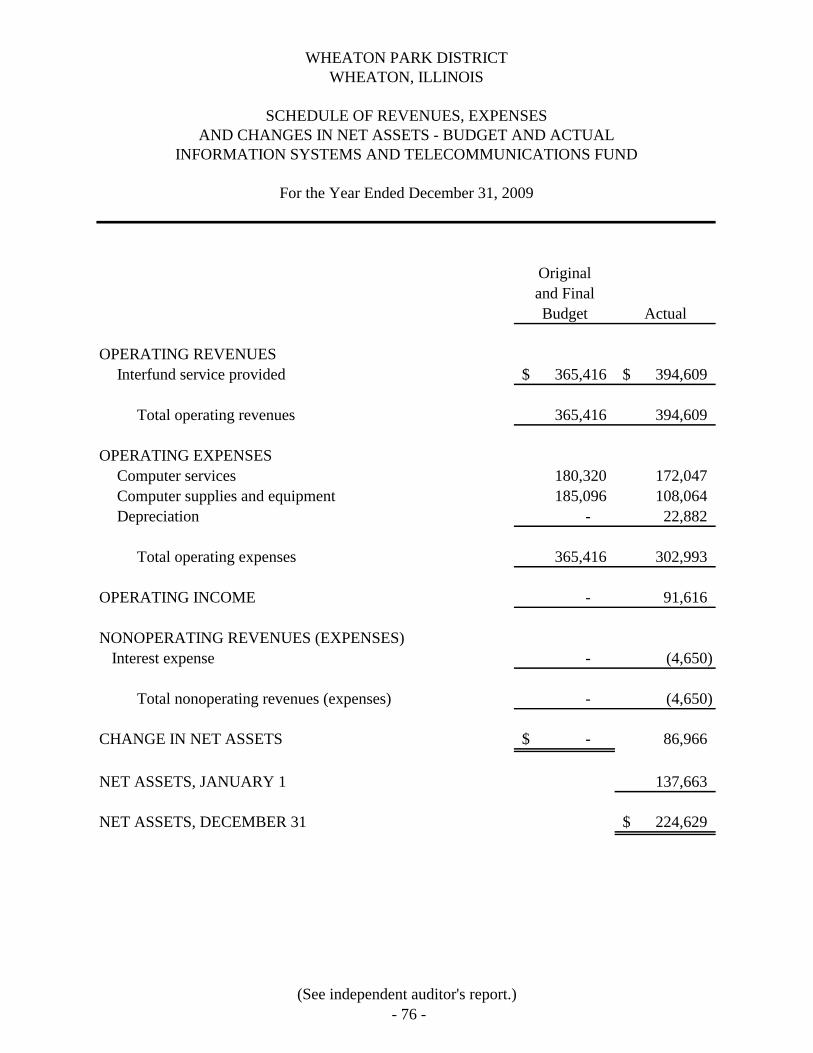
Originaland FinalBudget Actual
OPERATING REVENUESInterfund service provided 365,416$ 394,609$
Total operating revenues 365,416 394,609
OPERATING EXPENSESComputer services 180,320 172,047 Computer supplies and equipment 185,096 108,064 Depreciation - 22,882
Total operating expenses 365,416 302,993
OPERATING INCOME - 91,616
NONOPERATING REVENUES (EXPENSES)Interest expense - (4,650)
Total nonoperating revenues (expenses) - (4,650)
CHANGE IN NET ASSETS -$ 86,966
NET ASSETS, JANUARY 1 137,663
NET ASSETS, DECEMBER 31 224,629$
WHEATON PARK DISTRICTWHEATON, ILLINOIS
SCHEDULE OF REVENUES, EXPENSESAND CHANGES IN NET ASSETS - BUDGET AND ACTUAL
INFORMATION SYSTEMS AND TELECOMMUNICATIONS FUND
For the Year Ended December 31, 2009
(See independent auditor's report.)- 76 -
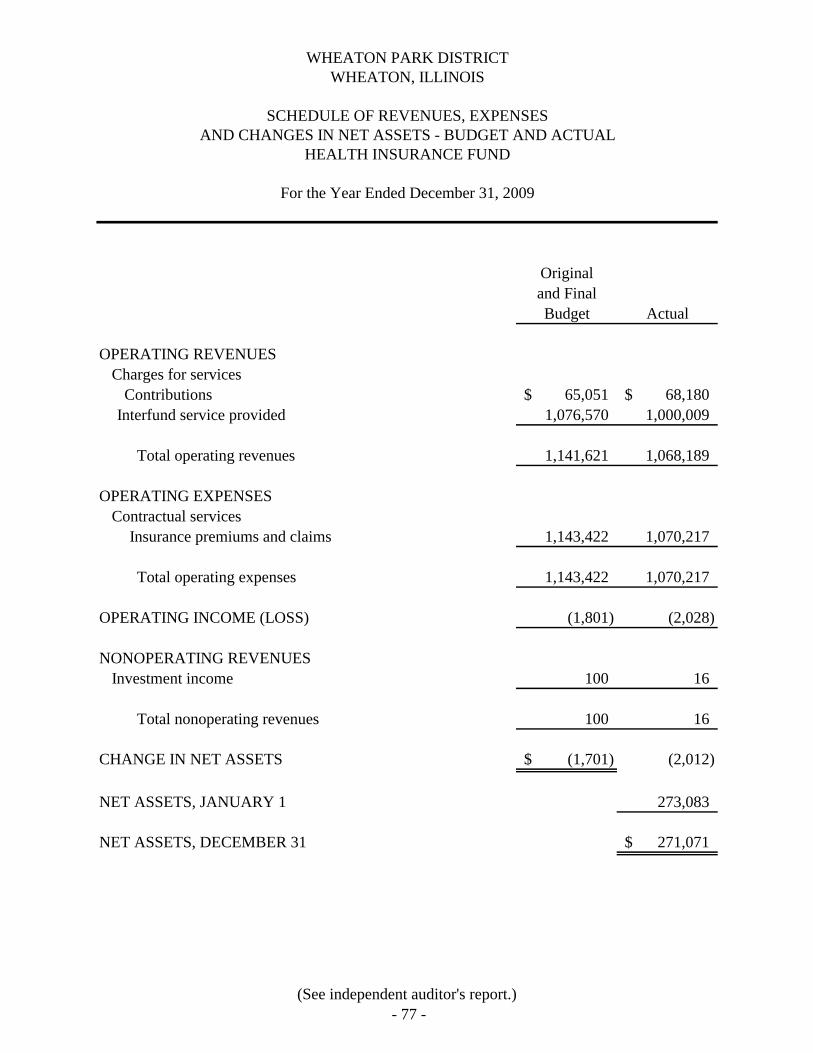
Originaland FinalBudget Actual
OPERATING REVENUESCharges for services
Contributions 65,051$ 68,180$ Interfund service provided 1,076,570 1,000,009
Total operating revenues 1,141,621 1,068,189
OPERATING EXPENSESContractual services
Insurance premiums and claims 1,143,422 1,070,217
Total operating expenses 1,143,422 1,070,217
OPERATING INCOME (LOSS) (1,801) (2,028)
NONOPERATING REVENUES Investment income 100 16
Total nonoperating revenues 100 16
CHANGE IN NET ASSETS (1,701)$ (2,012)
NET ASSETS, JANUARY 1 273,083
NET ASSETS, DECEMBER 31 271,071$
HEALTH INSURANCE FUND
For the Year Ended December 31, 2009
WHEATON PARK DISTRICTWHEATON, ILLINOIS
SCHEDULE OF REVENUES, EXPENSESAND CHANGES IN NET ASSETS - BUDGET AND ACTUAL
(See independent auditor's report.)- 77 -
OTHER SUPPLEMENTARY INFORMATION
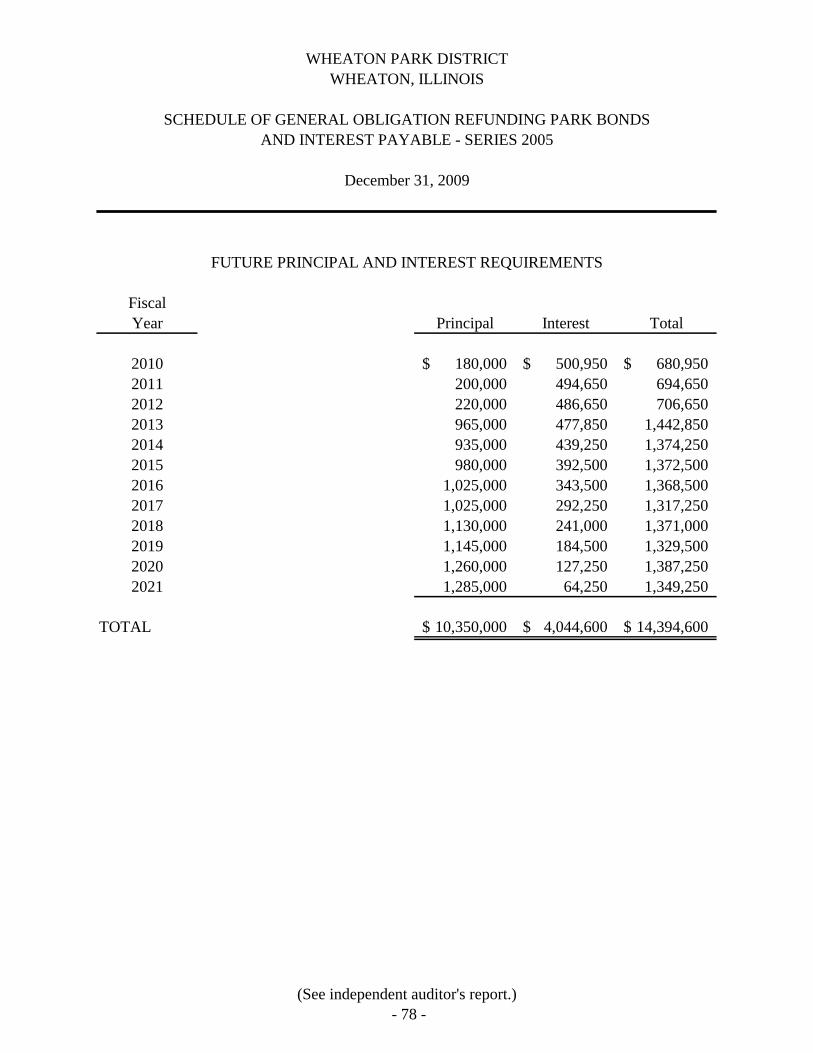
WHEATON PARK DISTRICTWHEATON, ILLINOIS
FUTURE PRINCIPAL AND INTEREST REQUIREMENTS
FiscalYear Principal Interest Total
2010 180,000$ 500,950$ 680,950$ 2011 200,000 494,650 694,650 2012 220,000 486,650 706,650 2013 965,000 477,850 1,442,850 2014 935,000 439,250 1,374,250 2015 980,000 392,500 1,372,500 2016 1,025,000 343,500 1,368,500 2017 1,025,000 292,250 1,317,250 2018 1,130,000 241,000 1,371,000 2019 1,145,000 184,500 1,329,500 2020 1,260,000 127,250 1,387,250 2021 1,285,000 64,250 1,349,250
TOTAL 10,350,000$ 4,044,600$ 14,394,600$
SCHEDULE OF GENERAL OBLIGATION REFUNDING PARK BONDSAND INTEREST PAYABLE - SERIES 2005
December 31, 2009
(See independent auditor's report.)- 78 -
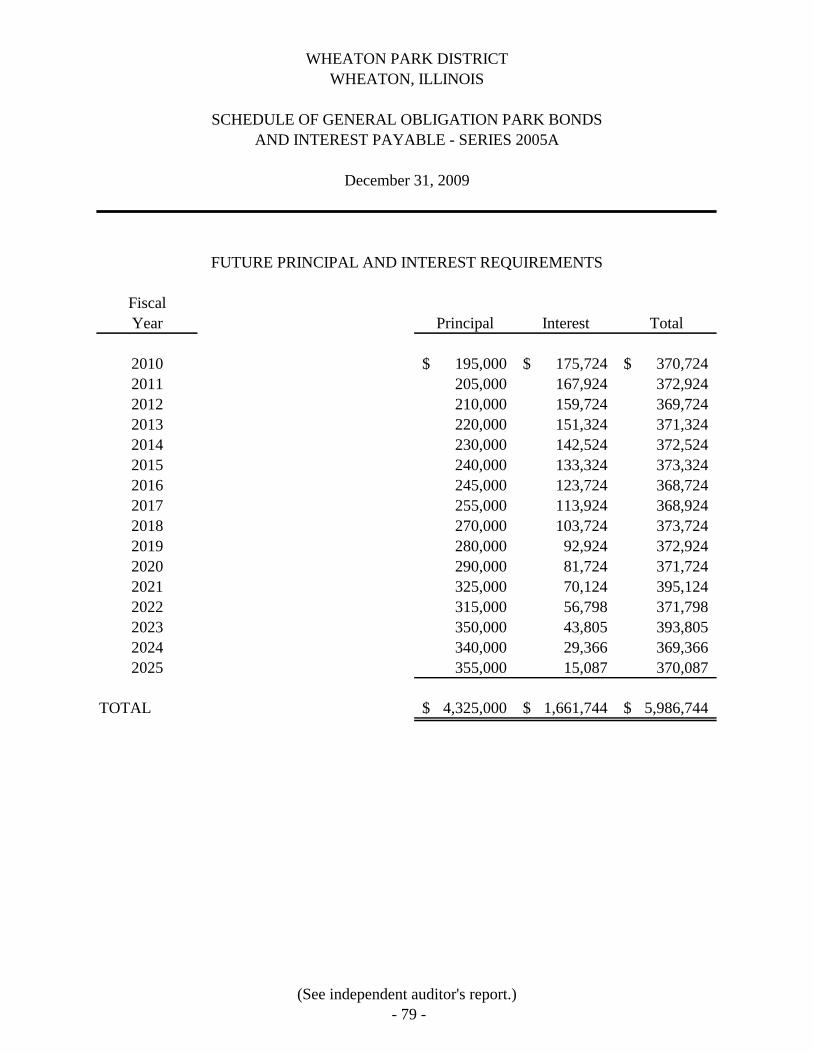
WHEATON PARK DISTRICTWHEATON, ILLINOIS
FUTURE PRINCIPAL AND INTEREST REQUIREMENTS
FiscalYear Principal Interest Total
2010 195,000$ 175,724$ 370,724$ 2011 205,000 167,924 372,924 2012 210,000 159,724 369,724 2013 220,000 151,324 371,324 2014 230,000 142,524 372,524 2015 240,000 133,324 373,324 2016 245,000 123,724 368,724 2017 255,000 113,924 368,924 2018 270,000 103,724 373,724 2019 280,000 92,924 372,924 2020 290,000 81,724 371,724 2021 325,000 70,124 395,124 2022 315,000 56,798 371,798 2023 350,000 43,805 393,805 2024 340,000 29,366 369,366 2025 355,000 15,087 370,087
TOTAL 4,325,000$ 1,661,744$ 5,986,744$
SCHEDULE OF GENERAL OBLIGATION PARK BONDSAND INTEREST PAYABLE - SERIES 2005A
December 31, 2009
(See independent auditor's report.)- 79 -
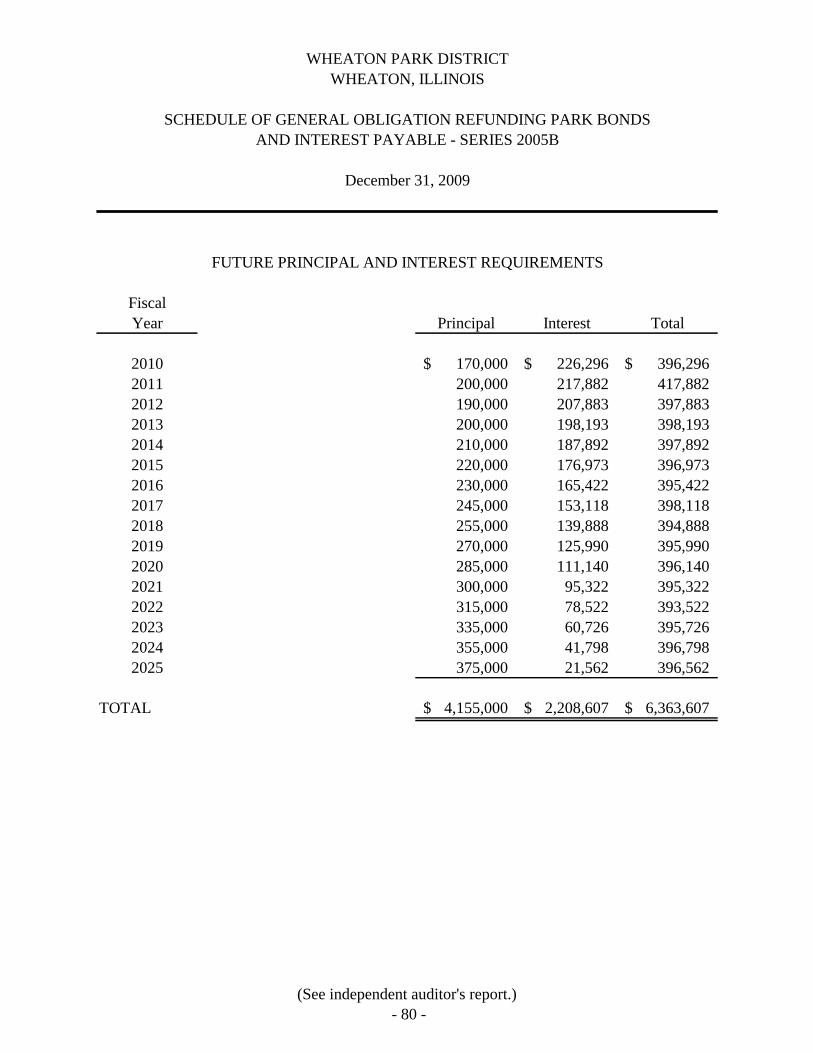
WHEATON PARK DISTRICTWHEATON, ILLINOIS
FUTURE PRINCIPAL AND INTEREST REQUIREMENTS
FiscalYear Principal Interest Total
2010 170,000$ 226,296$ 396,296$ 2011 200,000 217,882 417,882 2012 190,000 207,883 397,883 2013 200,000 198,193 398,193 2014 210,000 187,892 397,892 2015 220,000 176,973 396,973 2016 230,000 165,422 395,422 2017 245,000 153,118 398,118 2018 255,000 139,888 394,888 2019 270,000 125,990 395,990 2020 285,000 111,140 396,140 2021 300,000 95,322 395,322 2022 315,000 78,522 393,522 2023 335,000 60,726 395,726 2024 355,000 41,798 396,798 2025 375,000 21,562 396,562
TOTAL 4,155,000$ 2,208,607$ 6,363,607$
SCHEDULE OF GENERAL OBLIGATION REFUNDING PARK BONDSAND INTEREST PAYABLE - SERIES 2005B
December 31, 2009
(See independent auditor's report.)- 80 -
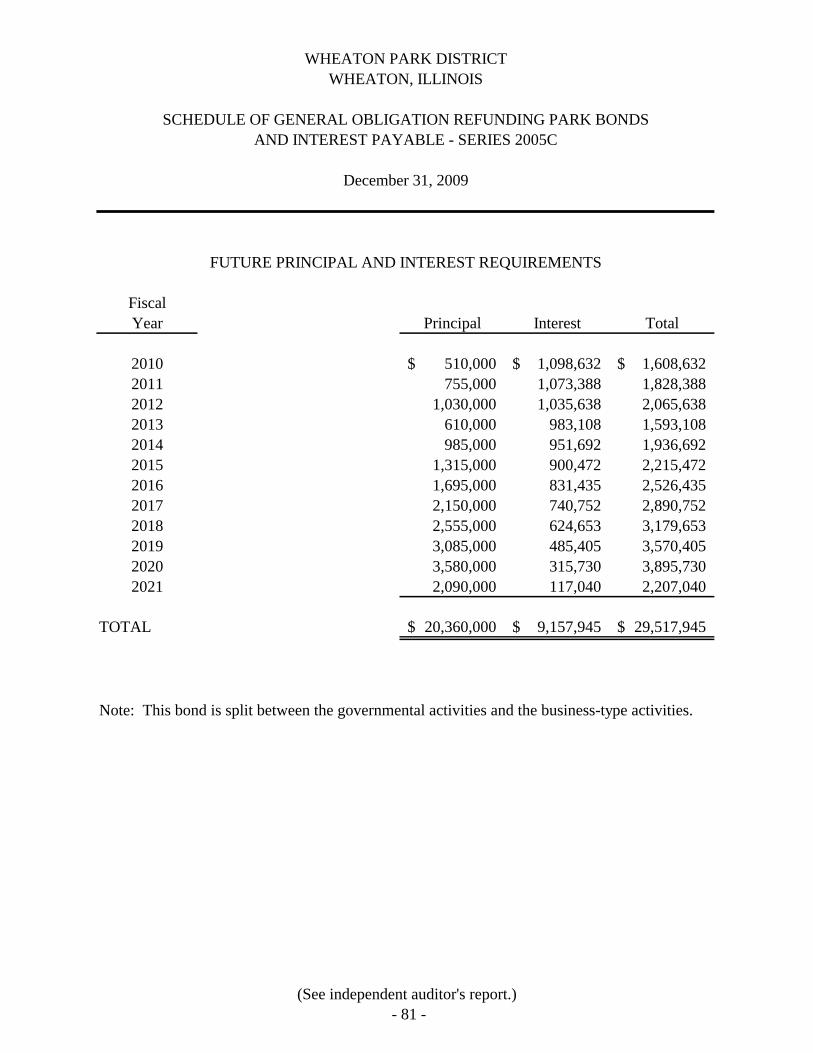
WHEATON PARK DISTRICTWHEATON, ILLINOIS
FUTURE PRINCIPAL AND INTEREST REQUIREMENTS
FiscalYear Principal Interest Total
2010 510,000$ 1,098,632$ 1,608,632$ 2011 755,000 1,073,388 1,828,388 2012 1,030,000 1,035,638 2,065,638 2013 610,000 983,108 1,593,108 2014 985,000 951,692 1,936,692 2015 1,315,000 900,472 2,215,472 2016 1,695,000 831,435 2,526,435 2017 2,150,000 740,752 2,890,752 2018 2,555,000 624,653 3,179,653 2019 3,085,000 485,405 3,570,405 2020 3,580,000 315,730 3,895,730 2021 2,090,000 117,040 2,207,040
TOTAL 20,360,000$ 9,157,945$ 29,517,945$
Note: This bond is split between the governmental activities and the business-type activities.
SCHEDULE OF GENERAL OBLIGATION REFUNDING PARK BONDSAND INTEREST PAYABLE - SERIES 2005C
December 31, 2009
(See independent auditor's report.)- 81 -
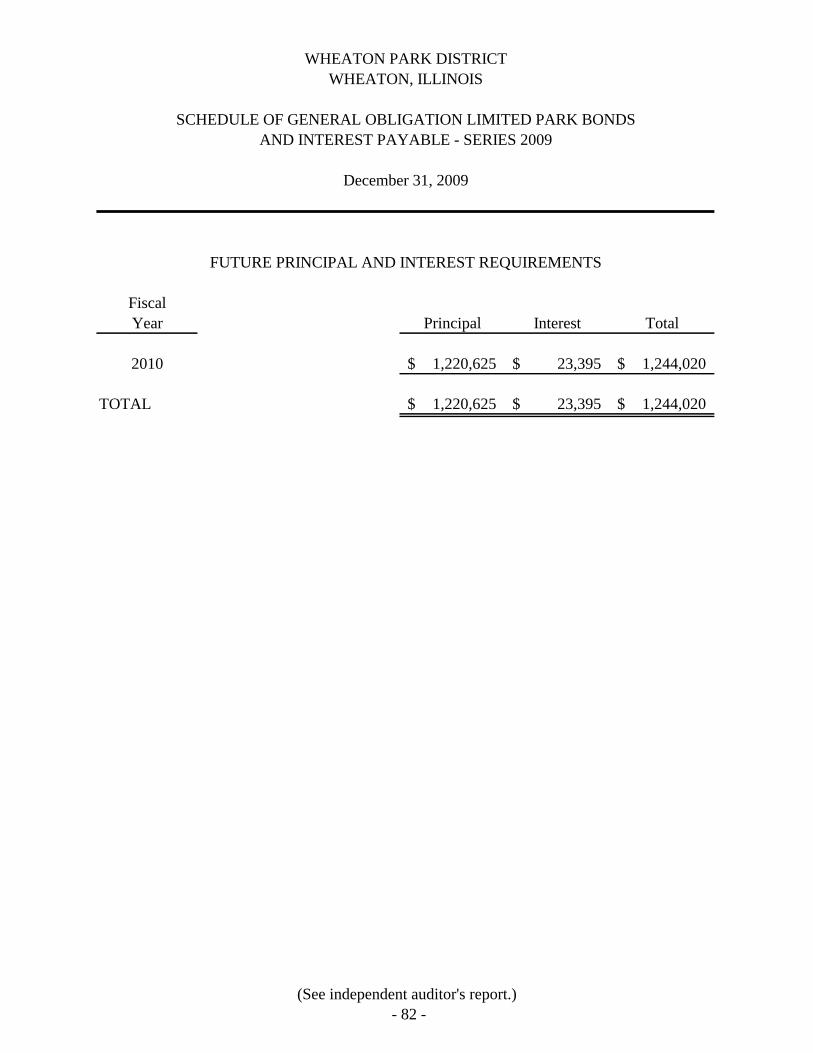
WHEATON PARK DISTRICTWHEATON, ILLINOIS
FUTURE PRINCIPAL AND INTEREST REQUIREMENTS
FiscalYear Principal Interest Total
2010 1,220,625$ 23,395$ 1,244,020$
TOTAL 1,220,625$ 23,395$ 1,244,020$
SCHEDULE OF GENERAL OBLIGATION LIMITED PARK BONDSAND INTEREST PAYABLE - SERIES 2009
December 31, 2009
(See independent auditor's report.)- 82 -
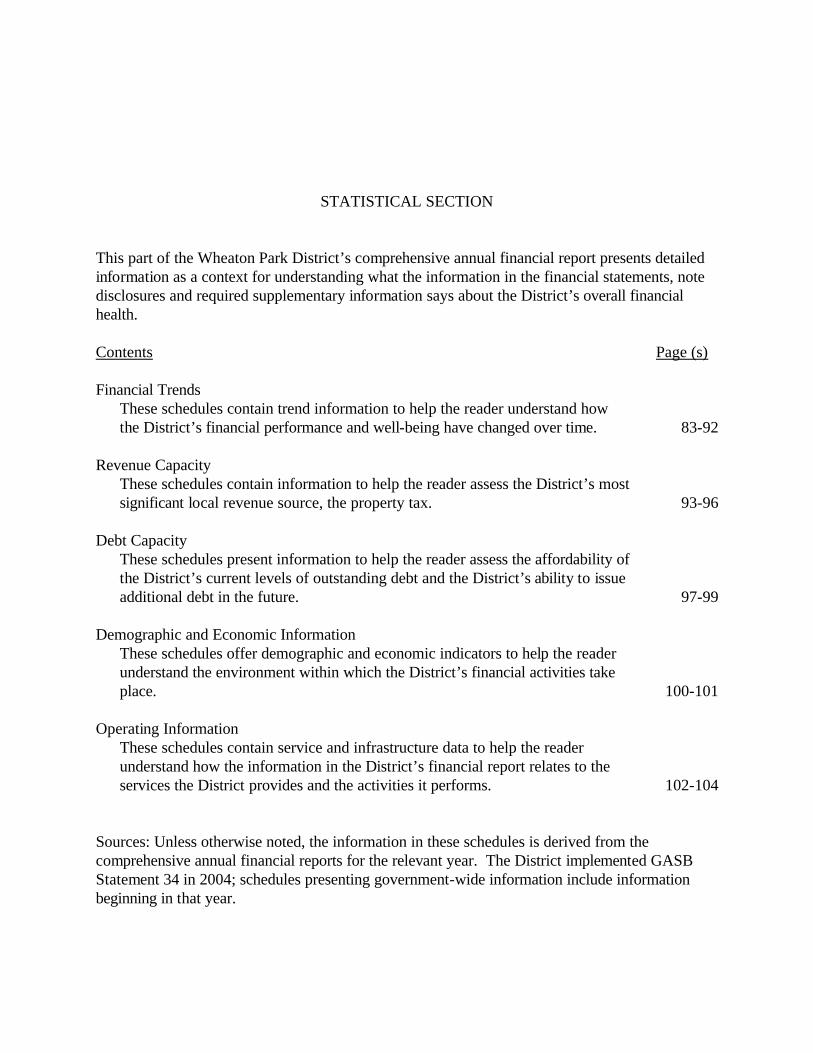
STATISTICAL SECTION
This part of the Wheaton Park District’s comprehensive annual financial report presents detailed information as a context for understanding what the information in the financial statements, note disclosures and required supplementary information says about the District’s overall financial health.
Contents Page (s)
Financial TrendsThese schedules contain trend information to help the reader understand how the District’s financial performance and well-being have changed over time. 83-92
Revenue CapacityThese schedules contain information to help the reader assess the District’s most significant local revenue source, the property tax. 93-96
Debt CapacityThese schedules present information to help the reader assess the affordability of the District’s current levels of outstanding debt and the District’s ability to issue additional debt in the future. 97-99
Demographic and Economic InformationThese schedules offer demographic and economic indicators to help the reader understand the environment within which the District’s financial activities take place. 100-101
Operating InformationThese schedules contain service and infrastructure data to help the reader understand how the information in the District’s financial report relates to the services the District provides and the activities it performs. 102-104
Sources: Unless otherwise noted, the information in these schedules is derived from the comprehensive annual financial reports for the relevant year. The District implemented GASB Statement 34 in 2004; schedules presenting government-wide information include information beginning in that year.
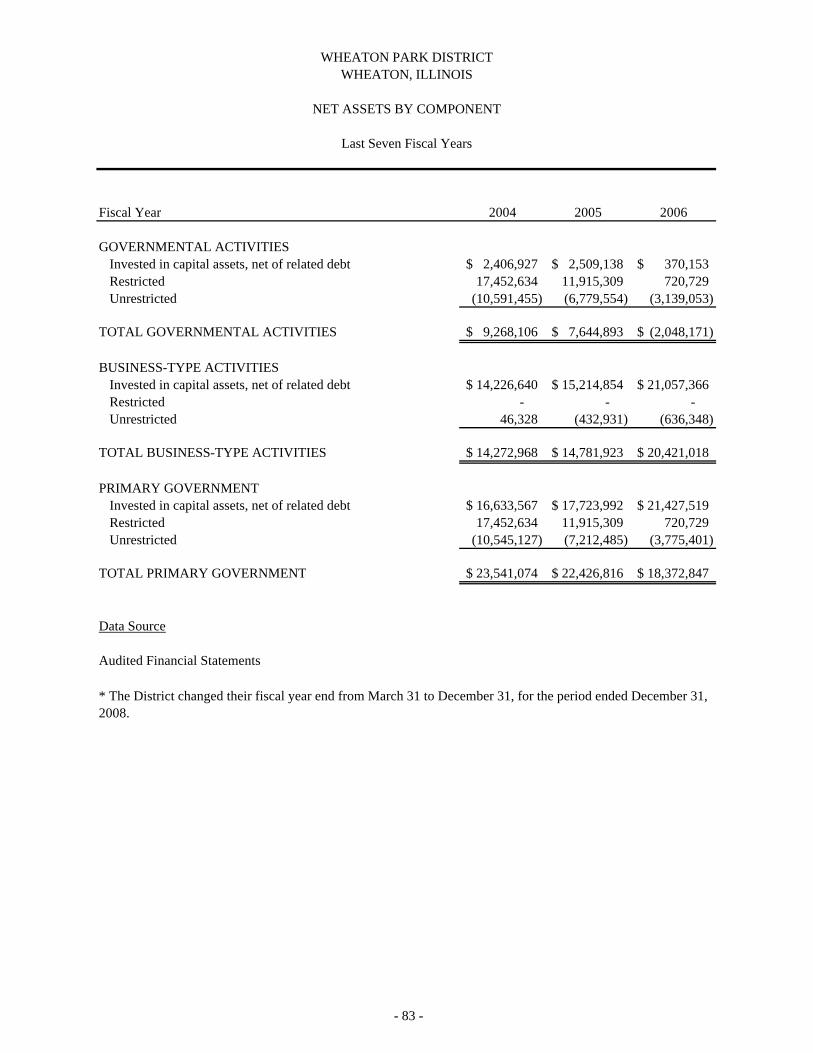
Fiscal Year 2004 2005 2006
GOVERNMENTAL ACTIVITIESInvested in capital assets, net of related debt 2,406,927$ 2,509,138$ 370,153$ Restricted 17,452,634 11,915,309 720,729 Unrestricted (10,591,455) (6,779,554) (3,139,053)
TOTAL GOVERNMENTAL ACTIVITIES 9,268,106$ 7,644,893$ (2,048,171)$
BUSINESS-TYPE ACTIVITIESInvested in capital assets, net of related debt 14,226,640$ 15,214,854$ 21,057,366$ Restricted - - - Unrestricted 46,328 (432,931) (636,348)
TOTAL BUSINESS-TYPE ACTIVITIES 14,272,968$ 14,781,923$ 20,421,018$
PRIMARY GOVERNMENTInvested in capital assets, net of related debt 16,633,567$ 17,723,992$ 21,427,519$ Restricted 17,452,634 11,915,309 720,729 Unrestricted (10,545,127) (7,212,485) (3,775,401)
TOTAL PRIMARY GOVERNMENT 23,541,074$ 22,426,816$ 18,372,847$
Data Source
Audited Financial Statements
* The District changed their fiscal year end from March 31 to December 31, for the period ended December 31, 2008.
WHEATON PARK DISTRICTWHEATON, ILLINOIS
NET ASSETS BY COMPONENT
Last Seven Fiscal Years
- 83 -
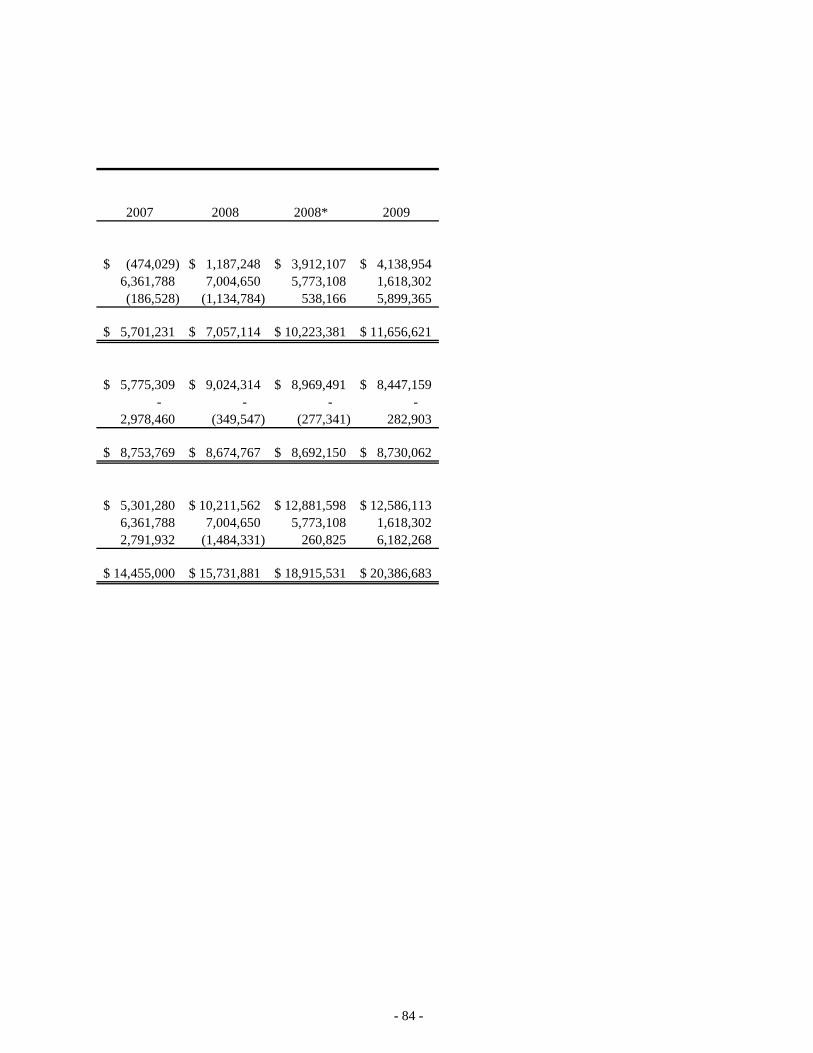
2007 2008 2008* 2009
(474,029)$ 1,187,248$ 3,912,107$ 4,138,954$ 6,361,788 7,004,650 5,773,108 1,618,302 (186,528) (1,134,784) 538,166 5,899,365
5,701,231$ 7,057,114$ 10,223,381$ 11,656,621$
5,775,309$ 9,024,314$ 8,969,491$ 8,447,159$ - - - -
2,978,460 (349,547) (277,341) 282,903
8,753,769$ 8,674,767$ 8,692,150$ 8,730,062$
5,301,280$ 10,211,562$ 12,881,598$ 12,586,113$ 6,361,788 7,004,650 5,773,108 1,618,302 2,791,932 (1,484,331) 260,825 6,182,268
14,455,000$ 15,731,881$ 18,915,531$ 20,386,683$
- 84 -
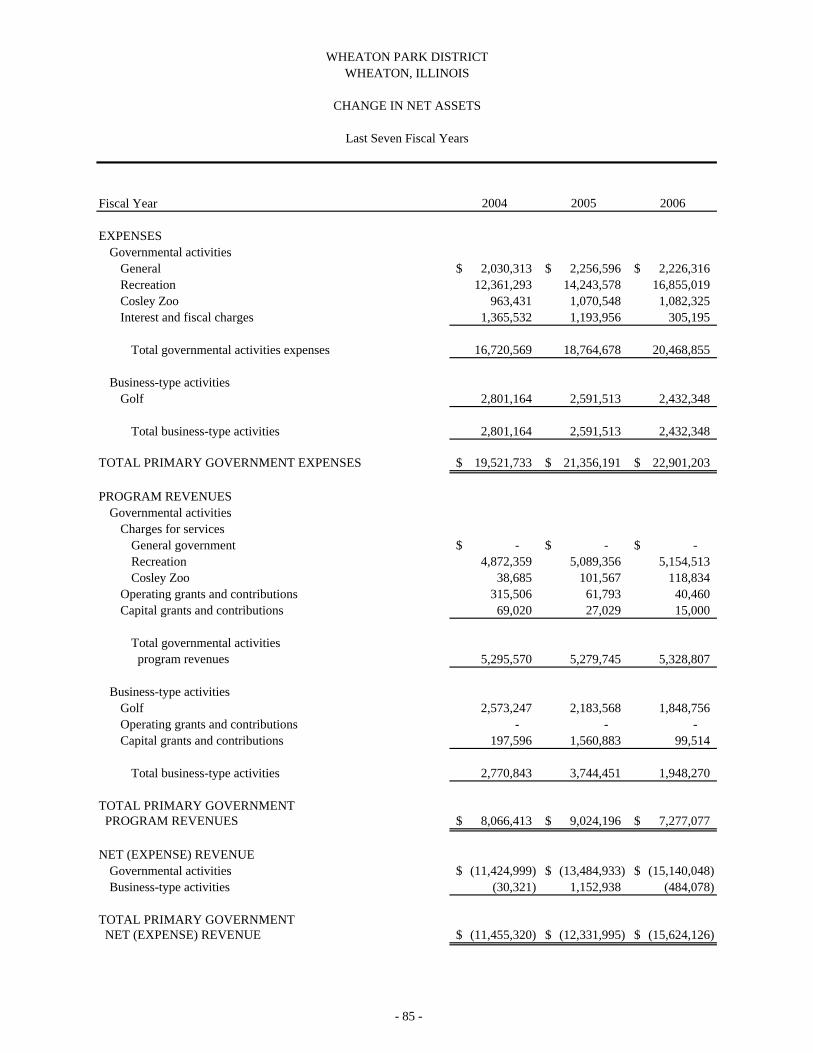
Fiscal Year 2004 2005 2006
EXPENSESGovernmental activities
General 2,030,313$ 2,256,596$ 2,226,316$ Recreation 12,361,293 14,243,578 16,855,019 Cosley Zoo 963,431 1,070,548 1,082,325 Interest and fiscal charges 1,365,532 1,193,956 305,195
Total governmental activities expenses 16,720,569 18,764,678 20,468,855
Business-type activitiesGolf 2,801,164 2,591,513 2,432,348
Total business-type activities 2,801,164 2,591,513 2,432,348
19,521,733$ 21,356,191$ 22,901,203$
PROGRAM REVENUESGovernmental activities
Charges for servicesGeneral government -$ -$ -$ Recreation 4,872,359 5,089,356 5,154,513 Cosley Zoo 38,685 101,567 118,834
Operating grants and contributions 315,506 61,793 40,460 Capital grants and contributions 69,020 27,029 15,000
Total governmental activities program revenues 5,295,570 5,279,745 5,328,807
Business-type activitiesGolf 2,573,247 2,183,568 1,848,756 Operating grants and contributions - - - Capital grants and contributions 197,596 1,560,883 99,514
Total business-type activities 2,770,843 3,744,451 1,948,270
TOTAL PRIMARY GOVERNMENT8,066,413$ 9,024,196$ 7,277,077$
NET (EXPENSE) REVENUEGovernmental activities (11,424,999)$ (13,484,933)$ (15,140,048)$ Business-type activities (30,321) 1,152,938 (484,078)
TOTAL PRIMARY GOVERNMENT(11,455,320)$ (12,331,995)$ (15,624,126)$ NET (EXPENSE) REVENUE
CHANGE IN NET ASSETS
WHEATON, ILLINOISWHEATON PARK DISTRICT
Last Seven Fiscal Years
TOTAL PRIMARY GOVERNMENT EXPENSES
PROGRAM REVENUES
- 85 -
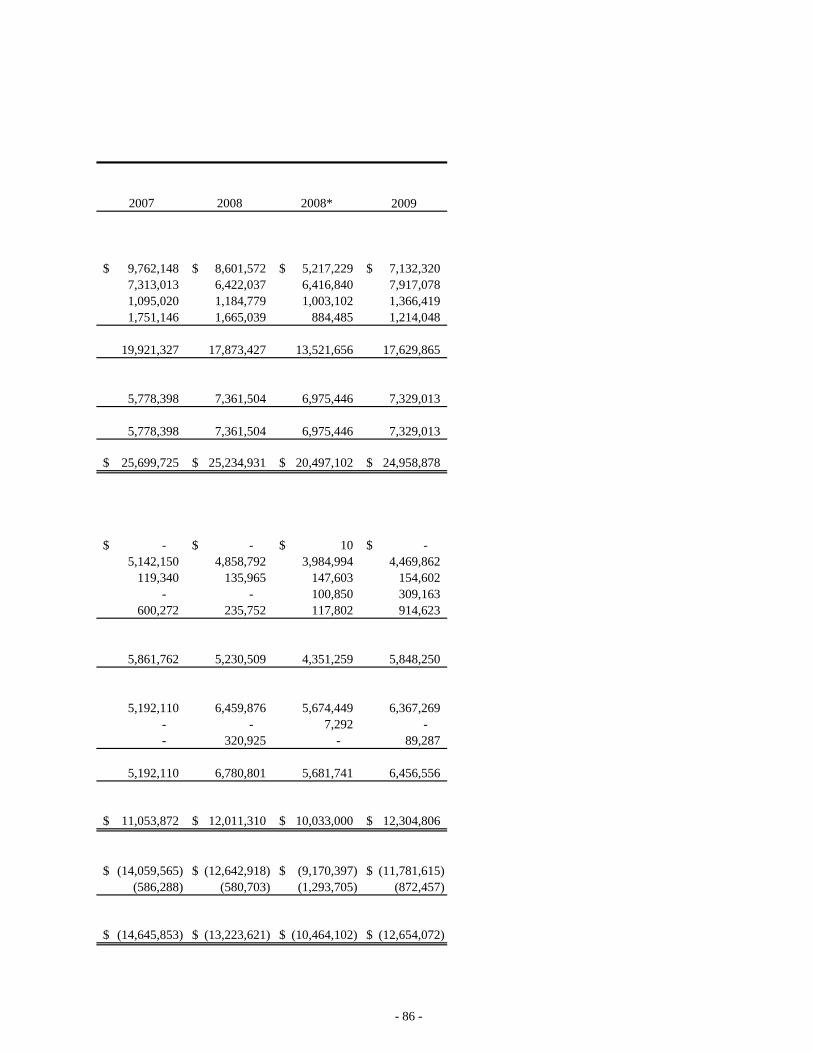
2007 2008 2008* 2009
9,762,148$ 8,601,572$ 5,217,229$ 7,132,320$ 7,313,013 6,422,037 6,416,840 7,917,078 1,095,020 1,184,779 1,003,102 1,366,419 1,751,146 1,665,039 884,485 1,214,048
19,921,327 17,873,427 13,521,656 17,629,865
5,778,398 7,361,504 6,975,446 7,329,013
5,778,398 7,361,504 6,975,446 7,329,013
25,699,725$ 25,234,931$ 20,497,102$ 24,958,878$
-$ -$ 10$ -$ 5,142,150 4,858,792 3,984,994 4,469,862
119,340 135,965 147,603 154,602 - - 100,850 309,163
600,272 235,752 117,802 914,623
5,861,762 5,230,509 4,351,259 5,848,250
5,192,110 6,459,876 5,674,449 6,367,269 - - 7,292 - - 320,925 - 89,287
5,192,110 6,780,801 5,681,741 6,456,556
11,053,872$ 12,011,310$ 10,033,000$ 12,304,806$
(14,059,565)$ (12,642,918)$ (9,170,397)$ (11,781,615)$ (586,288) (580,703) (1,293,705) (872,457)
(14,645,853)$ (13,223,621)$ (10,464,102)$ (12,654,072)$
- 86 -
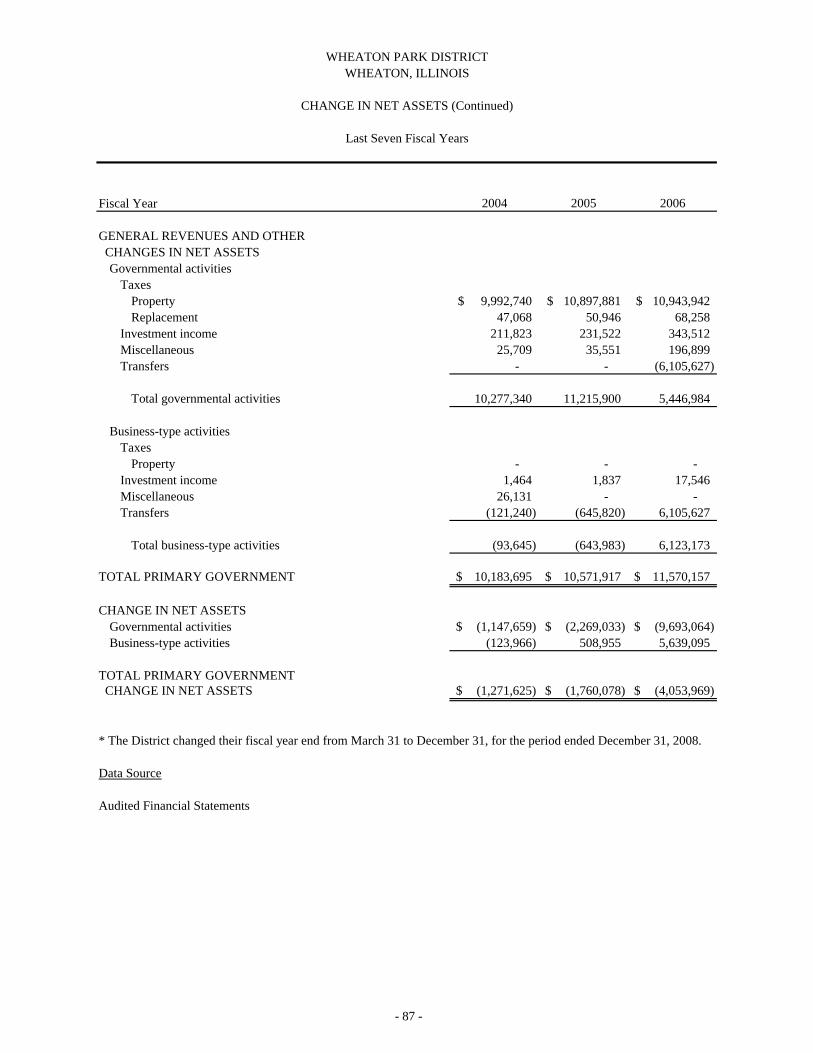
Fiscal Year 2004 2005 2006
GENERAL REVENUES AND OTHERCHANGES IN NET ASSETSGovernmental activities
TaxesProperty 9,992,740$ 10,897,881$ 10,943,942$ Replacement 47,068 50,946 68,258
Investment income 211,823 231,522 343,512 Miscellaneous 25,709 35,551 196,899 Transfers - - (6,105,627)
Total governmental activities 10,277,340 11,215,900 5,446,984
Business-type activitiesTaxes
Property - - - Investment income 1,464 1,837 17,546 Miscellaneous 26,131 - - Transfers (121,240) (645,820) 6,105,627
Total business-type activities (93,645) (643,983) 6,123,173
TOTAL PRIMARY GOVERNMENT 10,183,695$ 10,571,917$ 11,570,157$
CHANGE IN NET ASSETSGovernmental activities (1,147,659)$ (2,269,033)$ (9,693,064)$ Business-type activities (123,966) 508,955 5,639,095
TOTAL PRIMARY GOVERNMENTCHANGE IN NET ASSETS (1,271,625)$ (1,760,078)$ (4,053,969)$
* The District changed their fiscal year end from March 31 to December 31, for the period ended December 31, 2008.
Data Source
Audited Financial Statements
Last Seven Fiscal Years
CHANGE IN NET ASSETS (Continued)
WHEATON, ILLINOISWHEATON PARK DISTRICT
- 87 -
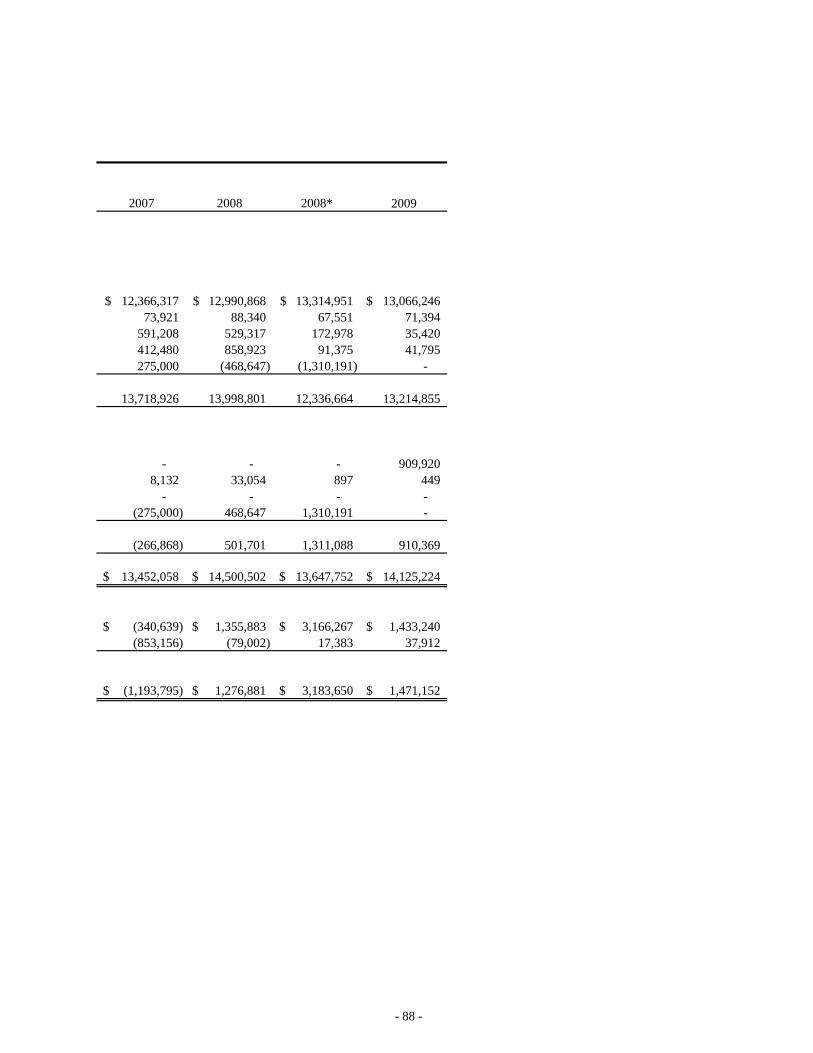
2007 2008 2008* 2009
12,366,317$ 12,990,868$ 13,314,951$ 13,066,246$ 73,921 88,340 67,551 71,394
591,208 529,317 172,978 35,420 412,480 858,923 91,375 41,795 275,000 (468,647) (1,310,191) -
13,718,926 13,998,801 12,336,664 13,214,855
- - - 909,920 8,132 33,054 897 449
- - - - (275,000) 468,647 1,310,191 -
(266,868) 501,701 1,311,088 910,369
13,452,058$ 14,500,502$ 13,647,752$ 14,125,224$
(340,639)$ 1,355,883$ 3,166,267$ 1,433,240$ (853,156) (79,002) 17,383 37,912
(1,193,795)$ 1,276,881$ 3,183,650$ 1,471,152$
- 88 -
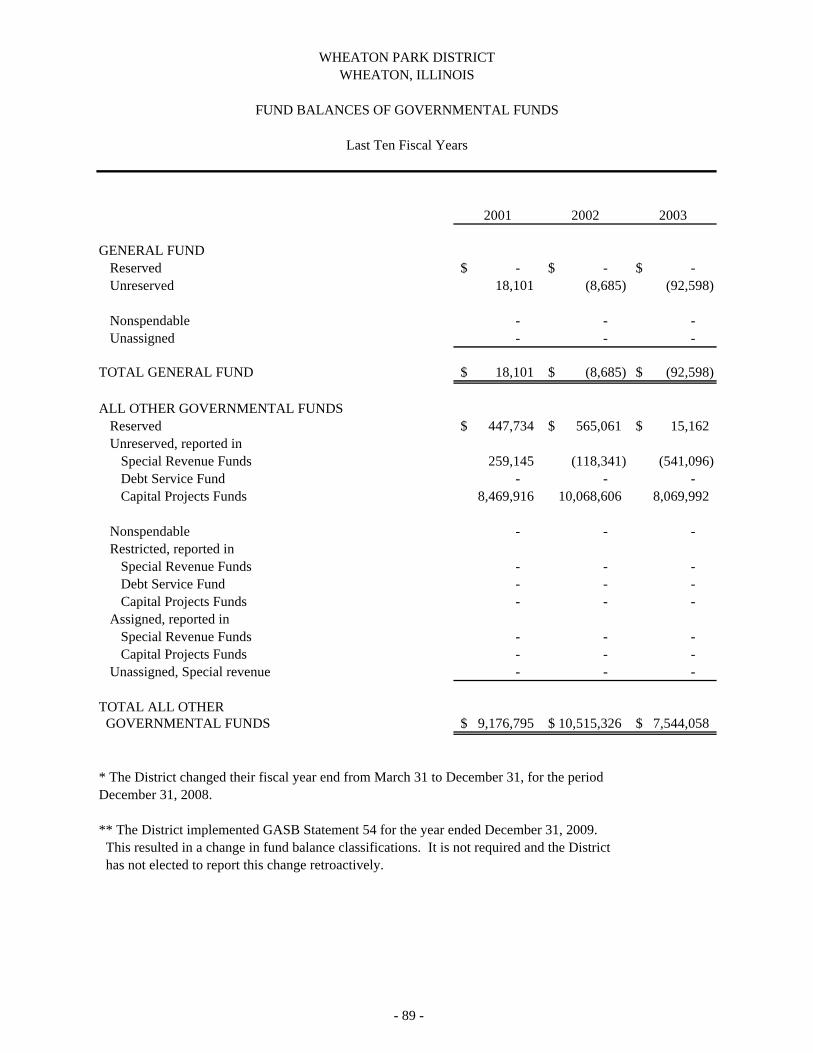
2001 2002 2003
GENERAL FUNDReserved -$ -$ -$ Unreserved 18,101 (8,685) (92,598)
Nonspendable - - - Unassigned - - -
TOTAL GENERAL FUND 18,101$ (8,685)$ (92,598)$
ALL OTHER GOVERNMENTAL FUNDSReserved 447,734$ 565,061$ 15,162$ Unreserved, reported in
Special Revenue Funds 259,145 (118,341) (541,096) Debt Service Fund - - - Capital Projects Funds 8,469,916 10,068,606 8,069,992
Nonspendable - - - Restricted, reported in
Special Revenue Funds - - - Debt Service Fund - - - Capital Projects Funds - - -
Assigned, reported inSpecial Revenue Funds - - - Capital Projects Funds - - -
Unassigned, Special revenue - - -
TOTAL ALL OTHER GOVERNMENTAL FUNDS 9,176,795$ 10,515,326$ 7,544,058$
December 31, 2008.
** The District implemented GASB Statement 54 for the year ended December 31, 2009.This resulted in a change in fund balance classifications. It is not required and the Districthas not elected to report this change retroactively.
* The District changed their fiscal year end from March 31 to December 31, for the period
WHEATON PARK DISTRICTWHEATON, ILLINOIS
FUND BALANCES OF GOVERNMENTAL FUNDS
Last Ten Fiscal Years
- 89 -
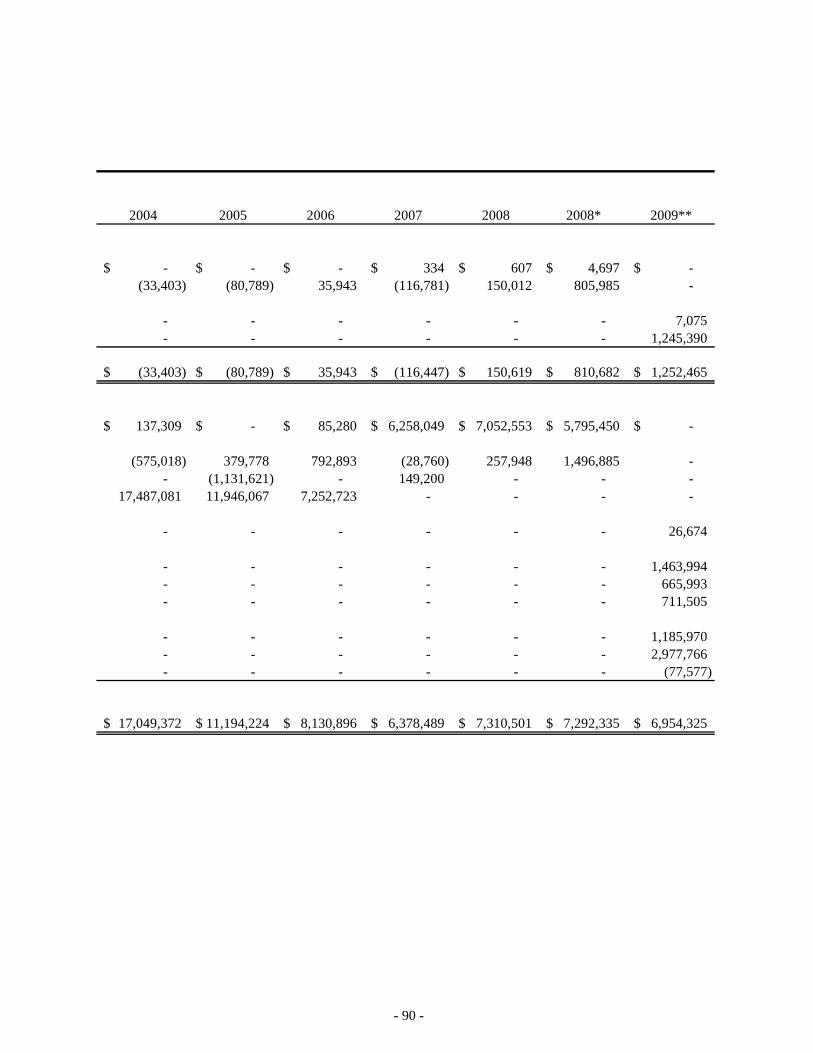
2004 2005 2006 2007 2008 2008* 2009**
-$ -$ -$ 334$ 607$ 4,697$ -$ (33,403) (80,789) 35,943 (116,781) 150,012 805,985 -
- - - - - - 7,075 - - - - - - 1,245,390
(33,403)$ (80,789)$ 35,943$ (116,447)$ 150,619$ 810,682$ 1,252,465$
137,309$ -$ 85,280$ 6,258,049$ 7,052,553$ 5,795,450$ -$
(575,018) 379,778 792,893 (28,760) 257,948 1,496,885 - - (1,131,621) - 149,200 - - -
17,487,081 11,946,067 7,252,723 - - - -
- - - - - - 26,674
- - - - - - 1,463,994 - - - - - - 665,993 - - - - - - 711,505
- - - - - - 1,185,970 - - - - - - 2,977,766 - - - - - - (77,577)
17,049,372$ 11,194,224$ 8,130,896$ 6,378,489$ 7,310,501$ 7,292,335$ 6,954,325$
- 90 -
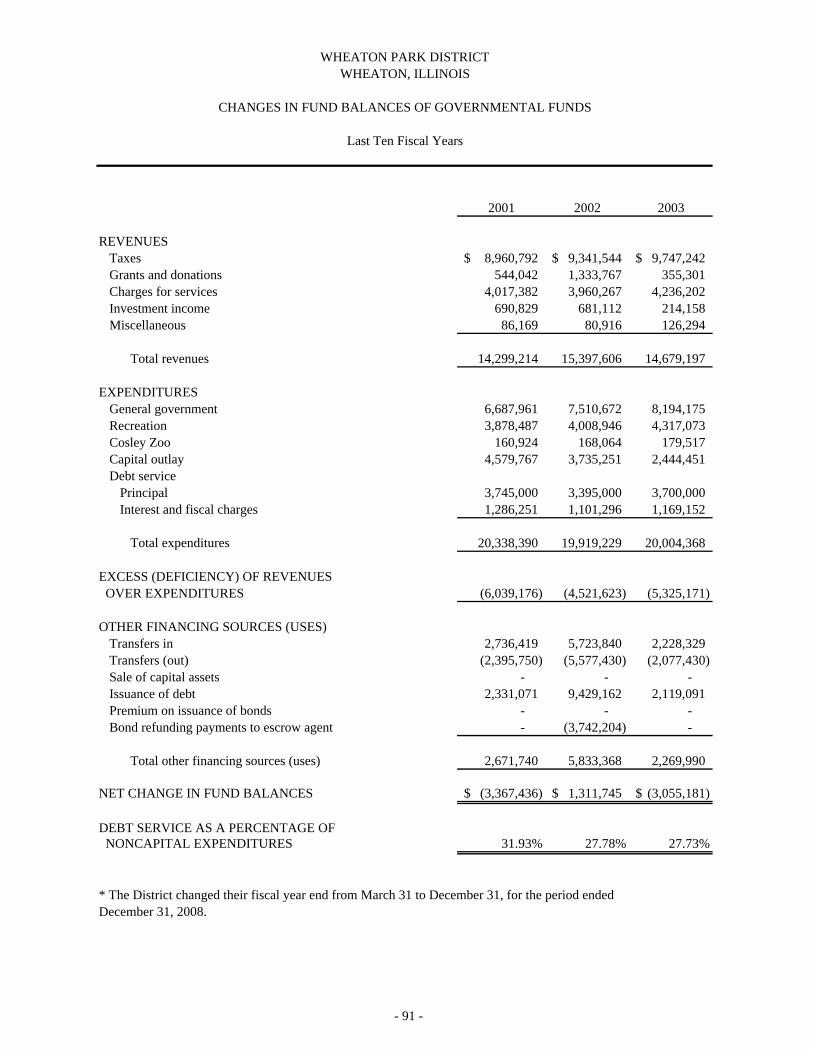
2001 2002 2003
REVENUESTaxes 8,960,792$ 9,341,544$ 9,747,242$ Grants and donations 544,042 1,333,767 355,301 Charges for services 4,017,382 3,960,267 4,236,202 Investment income 690,829 681,112 214,158 Miscellaneous 86,169 80,916 126,294
Total revenues 14,299,214 15,397,606 14,679,197
EXPENDITURESGeneral government 6,687,961 7,510,672 8,194,175 Recreation 3,878,487 4,008,946 4,317,073 Cosley Zoo 160,924 168,064 179,517 Capital outlay 4,579,767 3,735,251 2,444,451 Debt service
Principal 3,745,000 3,395,000 3,700,000 Interest and fiscal charges 1,286,251 1,101,296 1,169,152
Total expenditures 20,338,390 19,919,229 20,004,368
EXCESS (DEFICIENCY) OF REVENUES OVER EXPENDITURES (6,039,176) (4,521,623) (5,325,171)
OTHER FINANCING SOURCES (USES)Transfers in 2,736,419 5,723,840 2,228,329 Transfers (out) (2,395,750) (5,577,430) (2,077,430) Sale of capital assets - - - Issuance of debt 2,331,071 9,429,162 2,119,091 Premium on issuance of bonds - - - Bond refunding payments to escrow agent - (3,742,204) -
Total other financing sources (uses) 2,671,740 5,833,368 2,269,990
NET CHANGE IN FUND BALANCES (3,367,436)$ 1,311,745$ (3,055,181)$
DEBT SERVICE AS A PERCENTAGE OF NONCAPITAL EXPENDITURES 31.93% 27.78% 27.73%
December 31, 2008.* The District changed their fiscal year end from March 31 to December 31, for the period ended
WHEATON PARK DISTRICTWHEATON, ILLINOIS
CHANGES IN FUND BALANCES OF GOVERNMENTAL FUNDS
Last Ten Fiscal Years
- 91 -
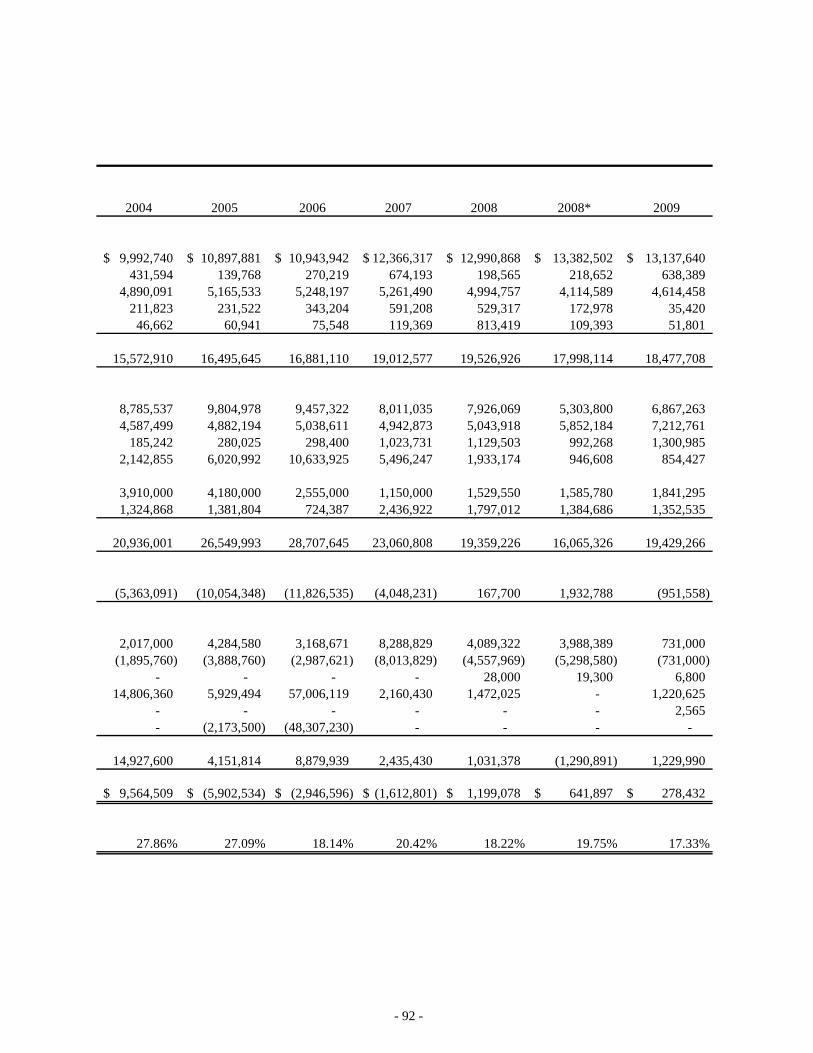
2004 2005 2006 2007 2008 2008* 2009
9,992,740$ 10,897,881$ 10,943,942$ 12,366,317$ 12,990,868$ 13,382,502$ 13,137,640$ 431,594 139,768 270,219 674,193 198,565 218,652 638,389
4,890,091 5,165,533 5,248,197 5,261,490 4,994,757 4,114,589 4,614,458 211,823 231,522 343,204 591,208 529,317 172,978 35,420
46,662 60,941 75,548 119,369 813,419 109,393 51,801
15,572,910 16,495,645 16,881,110 19,012,577 19,526,926 17,998,114 18,477,708
8,785,537 9,804,978 9,457,322 8,011,035 7,926,069 5,303,800 6,867,263 4,587,499 4,882,194 5,038,611 4,942,873 5,043,918 5,852,184 7,212,761
185,242 280,025 298,400 1,023,731 1,129,503 992,268 1,300,985 2,142,855 6,020,992 10,633,925 5,496,247 1,933,174 946,608 854,427
3,910,000 4,180,000 2,555,000 1,150,000 1,529,550 1,585,780 1,841,295 1,324,868 1,381,804 724,387 2,436,922 1,797,012 1,384,686 1,352,535
20,936,001 26,549,993 28,707,645 23,060,808 19,359,226 16,065,326 19,429,266
(5,363,091) (10,054,348) (11,826,535) (4,048,231) 167,700 1,932,788 (951,558)
2,017,000 4,284,580 3,168,671 8,288,829 4,089,322 3,988,389 731,000 (1,895,760) (3,888,760) (2,987,621) (8,013,829) (4,557,969) (5,298,580) (731,000)
- - - - 28,000 19,300 6,800 14,806,360 5,929,494 57,006,119 2,160,430 1,472,025 - 1,220,625
- - - - - - 2,565 - (2,173,500) (48,307,230) - - - -
14,927,600 4,151,814 8,879,939 2,435,430 1,031,378 (1,290,891) 1,229,990
9,564,509$ (5,902,534)$ (2,946,596)$ (1,612,801)$ 1,199,078$ 641,897$ 278,432$
27.86% 27.09% 18.14% 20.42% 18.22% 19.75% 17.33%
- 92 -
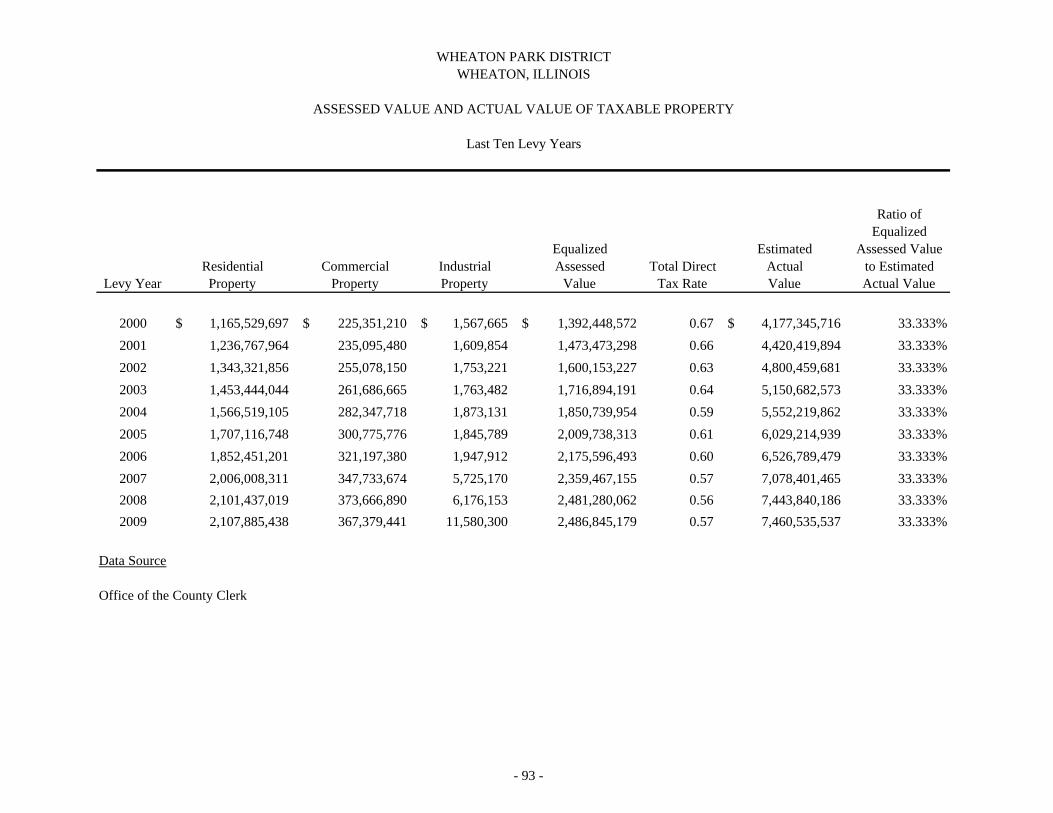
Ratio ofEqualized
Equalized Estimated Assessed ValueResidential Commercial Industrial Assessed Total Direct Actual to Estimated
Levy Year Property Property Property Value Tax Rate Value Actual Value
2000 1,165,529,697$ 225,351,210$ 1,567,665$ 1,392,448,572$ 0.67 4,177,345,716$ 33.333%2001 1,236,767,964 235,095,480 1,609,854 1,473,473,298 0.66 4,420,419,894 33.333%2002 1,343,321,856 255,078,150 1,753,221 1,600,153,227 0.63 4,800,459,681 33.333%2003 1,453,444,044 261,686,665 1,763,482 1,716,894,191 0.64 5,150,682,573 33.333%2004 1,566,519,105 282,347,718 1,873,131 1,850,739,954 0.59 5,552,219,862 33.333%2005 1,707,116,748 300,775,776 1,845,789 2,009,738,313 0.61 6,029,214,939 33.333%2006 1,852,451,201 321,197,380 1,947,912 2,175,596,493 0.60 6,526,789,479 33.333%2007 2,006,008,311 347,733,674 5,725,170 2,359,467,155 0.57 7,078,401,465 33.333%2008 2,101,437,019 373,666,890 6,176,153 2,481,280,062 0.56 7,443,840,186 33.333%2009 2,107,885,438 367,379,441 11,580,300 2,486,845,179 0.57 7,460,535,537 33.333%
Data Source
Office of the County Clerk
WHEATON PARK DISTRICT
ASSESSED VALUE AND ACTUAL VALUE OF TAXABLE PROPERTY
Last Ten Levy Years
WHEATON, ILLINOIS
- 93 -
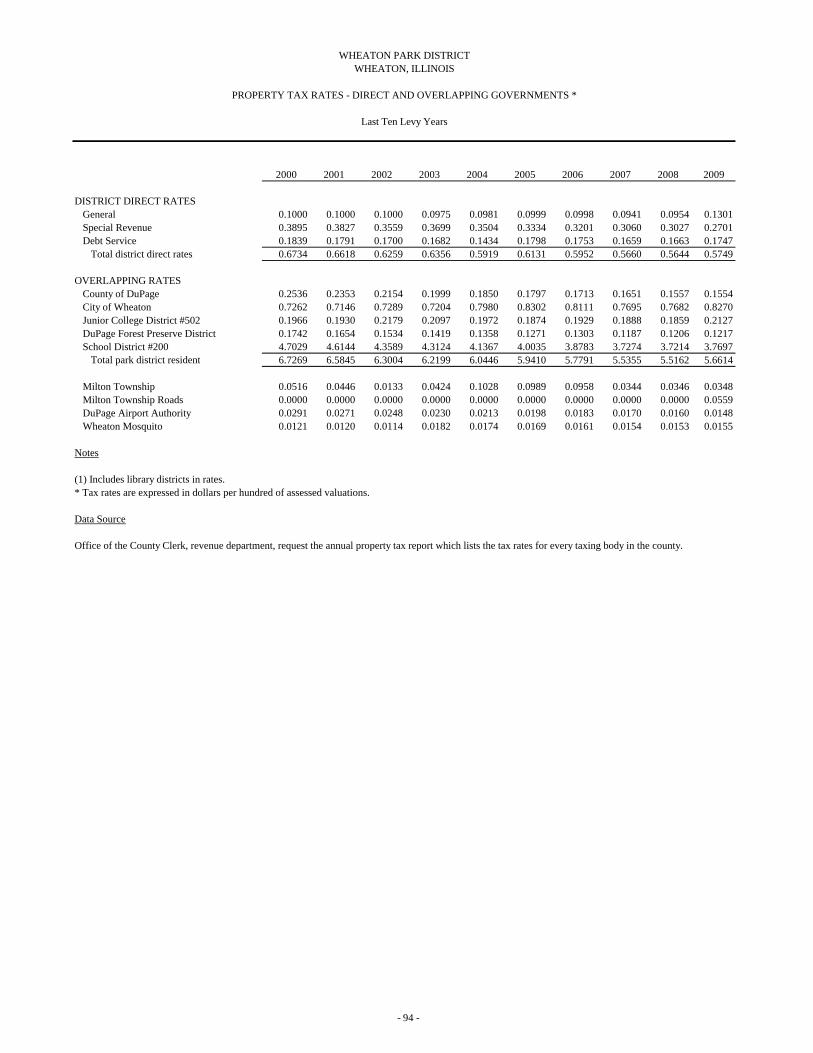
2000 2001 2002 2003 2004 2005 2006 2007 2008 2009
DISTRICT DIRECT RATESGeneral 0.1000 0.1000 0.1000 0.0975 0.0981 0.0999 0.0998 0.0941 0.0954 0.1301Special Revenue 0.3895 0.3827 0.3559 0.3699 0.3504 0.3334 0.3201 0.3060 0.3027 0.2701Debt Service 0.1839 0.1791 0.1700 0.1682 0.1434 0.1798 0.1753 0.1659 0.1663 0.1747
Total district direct rates 0.6734 0.6618 0.6259 0.6356 0.5919 0.6131 0.5952 0.5660 0.5644 0.5749
OVERLAPPING RATESCounty of DuPage 0.2536 0.2353 0.2154 0.1999 0.1850 0.1797 0.1713 0.1651 0.1557 0.1554City of Wheaton 0.7262 0.7146 0.7289 0.7204 0.7980 0.8302 0.8111 0.7695 0.7682 0.8270Junior College District #502 0.1966 0.1930 0.2179 0.2097 0.1972 0.1874 0.1929 0.1888 0.1859 0.2127DuPage Forest Preserve District 0.1742 0.1654 0.1534 0.1419 0.1358 0.1271 0.1303 0.1187 0.1206 0.1217School District #200 4.7029 4.6144 4.3589 4.3124 4.1367 4.0035 3.8783 3.7274 3.7214 3.7697
Total park district resident 6.7269 6.5845 6.3004 6.2199 6.0446 5.9410 5.7791 5.5355 5.5162 5.6614
Milton Township 0.0516 0.0446 0.0133 0.0424 0.1028 0.0989 0.0958 0.0344 0.0346 0.0348Milton Township Roads 0.0000 0.0000 0.0000 0.0000 0.0000 0.0000 0.0000 0.0000 0.0000 0.0559DuPage Airport Authority 0.0291 0.0271 0.0248 0.0230 0.0213 0.0198 0.0183 0.0170 0.0160 0.0148Wheaton Mosquito 0.0121 0.0120 0.0114 0.0182 0.0174 0.0169 0.0161 0.0154 0.0153 0.0155
Notes
(1) Includes library districts in rates.* Tax rates are expressed in dollars per hundred of assessed valuations.
Data Source
Office of the County Clerk, revenue department, request the annual property tax report which lists the tax rates for every taxing body in the county.
WHEATON PARK DISTRICTWHEATON, ILLINOIS
PROPERTY TAX RATES - DIRECT AND OVERLAPPING GOVERNMENTS *
Last Ten Levy Years
- 94 -
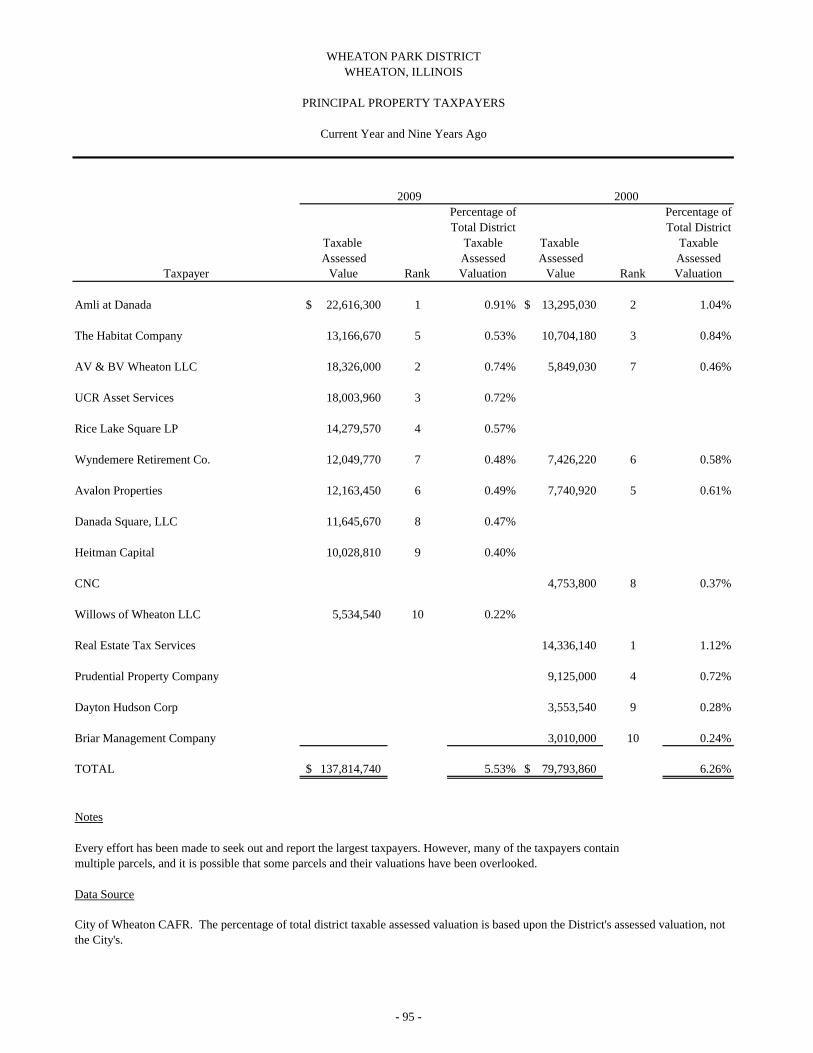
Percentage of Percentage ofTotal District Total District
Taxable Taxable Taxable TaxableAssessed Assessed Assessed Assessed
Taxpayer Value Rank Valuation Value Rank Valuation
Amli at Danada 22,616,300$ 1 0.91% 13,295,030$ 2 1.04%
The Habitat Company 13,166,670 5 0.53% 10,704,180 3 0.84%
AV & BV Wheaton LLC 18,326,000 2 0.74% 5,849,030 7 0.46%
UCR Asset Services 18,003,960 3 0.72%
Rice Lake Square LP 14,279,570 4 0.57%
Wyndemere Retirement Co. 12,049,770 7 0.48% 7,426,220 6 0.58%
Avalon Properties 12,163,450 6 0.49% 7,740,920 5 0.61%
Danada Square, LLC 11,645,670 8 0.47%
Heitman Capital 10,028,810 9 0.40%
CNC 4,753,800 8 0.37%
Willows of Wheaton LLC 5,534,540 10 0.22%
Real Estate Tax Services 14,336,140 1 1.12%
Prudential Property Company 9,125,000 4 0.72%
Dayton Hudson Corp 3,553,540 9 0.28%
Briar Management Company 3,010,000 10 0.24%
TOTAL 137,814,740$ 5.53% 79,793,860$ 6.26%
Notes
Data Source
City of Wheaton CAFR. The percentage of total district taxable assessed valuation is based upon the District's assessed valuation, not the City's.
Every effort has been made to seek out and report the largest taxpayers. However, many of the taxpayers contain multiple parcels, and it is possible that some parcels and their valuations have been overlooked.
WHEATON PARK DISTRICT
PRINCIPAL PROPERTY TAXPAYERS
Current Year and Nine Years Ago
2009 2000
WHEATON, ILLINOIS
- 95 -
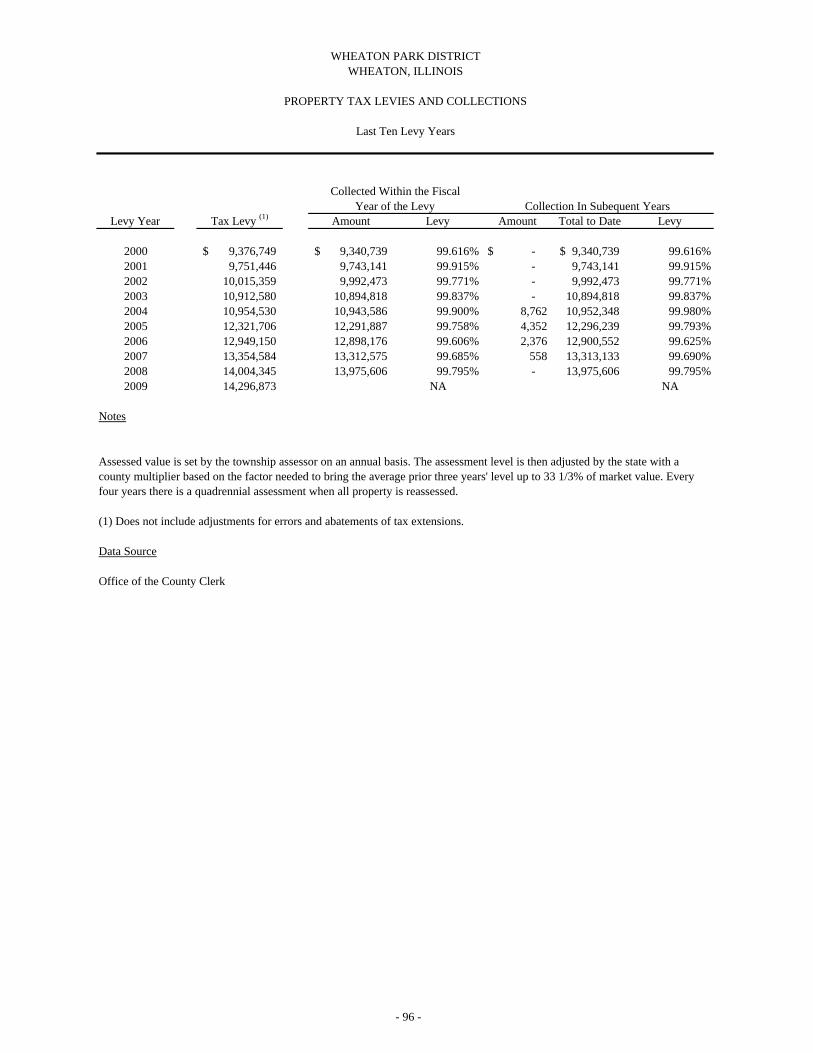
Levy Year Tax Levy (1) Amount Levy Amount Total to Date Levy
2000 9,376,749$ 9,340,739$ 99.616% -$ 9,340,739$ 99.616%2001 9,751,446 9,743,141 99.915% - 9,743,141 99.915%2002 10,015,359 9,992,473 99.771% - 9,992,473 99.771%2003 10,912,580 10,894,818 99.837% - 10,894,818 99.837%2004 10,954,530 10,943,586 99.900% 8,762 10,952,348 99.980%2005 12,321,706 12,291,887 99.758% 4,352 12,296,239 99.793%2006 12,949,150 12,898,176 99.606% 2,376 12,900,552 99.625%2007 13,354,584 13,312,575 99.685% 558 13,313,133 99.690%2008 14,004,345 13,975,606 99.795% - 13,975,606 99.795%2009 14,296,873 NA NA
Notes
(1) Does not include adjustments for errors and abatements of tax extensions.
Data Source
Office of the County Clerk
Assessed value is set by the township assessor on an annual basis. The assessment level is then adjusted by the state with a county multiplier based on the factor needed to bring the average prior three years' level up to 33 1/3% of market value. Every four years there is a quadrennial assessment when all property is reassessed.
WHEATON PARK DISTRICT
PROPERTY TAX LEVIES AND COLLECTIONS
Last Ten Levy Years
Collection In Subequent Years
WHEATON, ILLINOIS
Collected Within the FiscalYear of the Levy
- 96 -
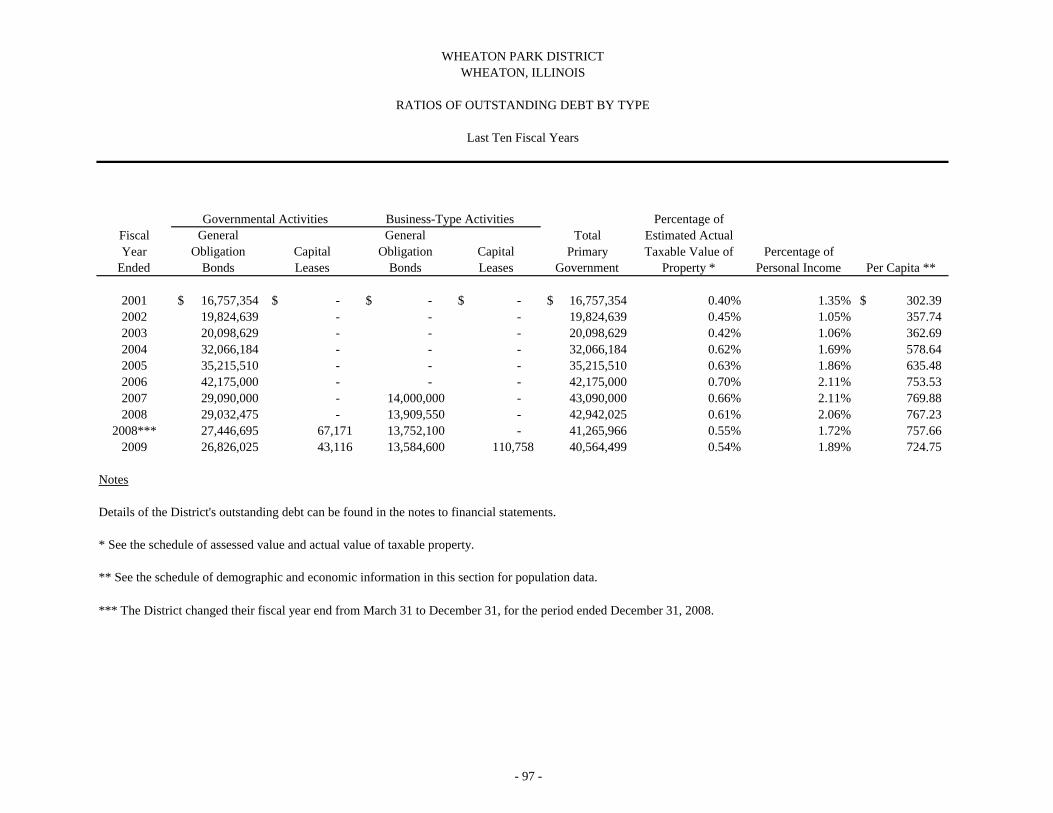
Percentage ofFiscal General General Total Estimated ActualYear Obligation Capital Obligation Capital Primary Taxable Value of Percentage of
Ended Bonds Leases Bonds Leases Government Property * Personal Income Per Capita **
2001 16,757,354$ -$ -$ -$ 16,757,354$ 0.40% 1.35% 302.39$ 2002 19,824,639 - - - 19,824,639 0.45% 1.05% 357.74 2003 20,098,629 - - - 20,098,629 0.42% 1.06% 362.69 2004 32,066,184 - - - 32,066,184 0.62% 1.69% 578.64 2005 35,215,510 - - - 35,215,510 0.63% 1.86% 635.48 2006 42,175,000 - - - 42,175,000 0.70% 2.11% 753.53 2007 29,090,000 - 14,000,000 - 43,090,000 0.66% 2.11% 769.88 2008 29,032,475 - 13,909,550 - 42,942,025 0.61% 2.06% 767.23
2008*** 27,446,695 67,171 13,752,100 - 41,265,966 0.55% 1.72% 757.66 2009 26,826,025 43,116 13,584,600 110,758 40,564,499 0.54% 1.89% 724.75
Notes
Details of the District's outstanding debt can be found in the notes to financial statements.
** See the schedule of demographic and economic information in this section for population data.
* See the schedule of assessed value and actual value of taxable property.
WHEATON PARK DISTRICT
RATIOS OF OUTSTANDING DEBT BY TYPE
Last Ten Fiscal Years
WHEATON, ILLINOIS
*** The District changed their fiscal year end from March 31 to December 31, for the period ended December 31, 2008.
Governmental Activities Business-Type Activities
- 97 -
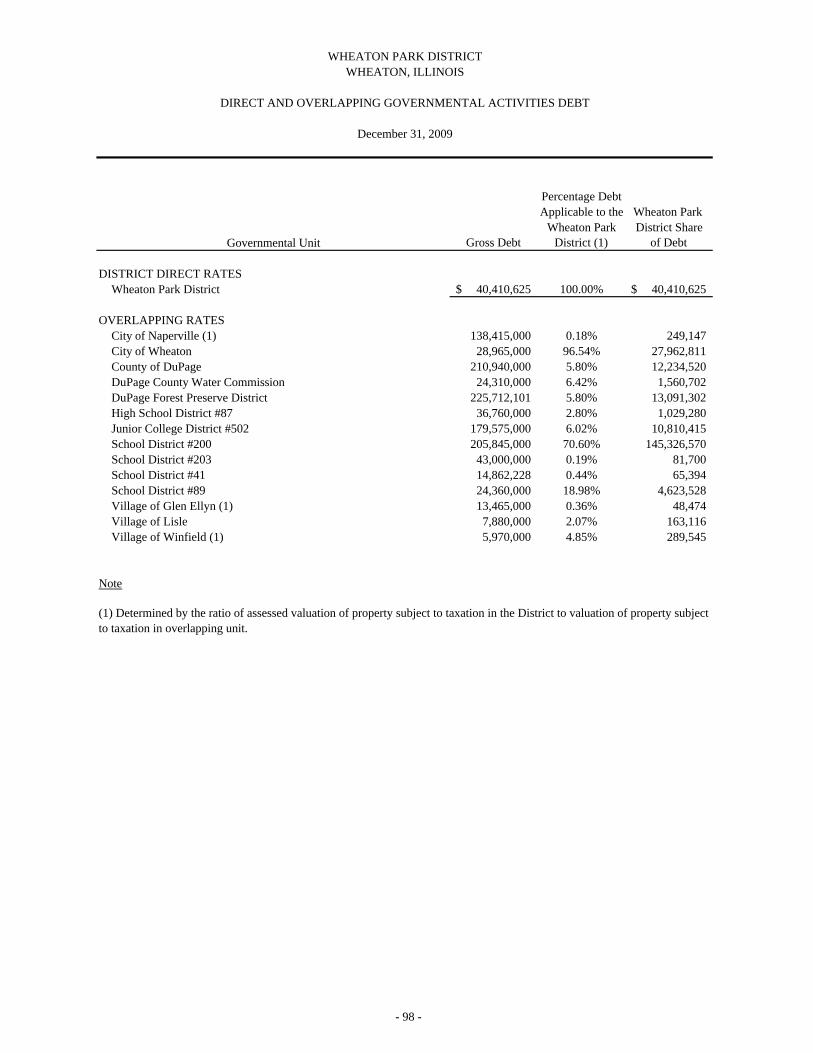
Percentage DebtApplicable to the Wheaton Park
Wheaton Park District ShareGross Debt District (1) of Debt
DISTRICT DIRECT RATESWheaton Park District 40,410,625$ 100.00% 40,410,625$
OVERLAPPING RATESCity of Naperville (1) 138,415,000 0.18% 249,147 City of Wheaton 28,965,000 96.54% 27,962,811 County of DuPage 210,940,000 5.80% 12,234,520 DuPage County Water Commission 24,310,000 6.42% 1,560,702 DuPage Forest Preserve District 225,712,101 5.80% 13,091,302 High School District #87 36,760,000 2.80% 1,029,280 Junior College District #502 179,575,000 6.02% 10,810,415 School District #200 205,845,000 70.60% 145,326,570 School District #203 43,000,000 0.19% 81,700 School District #41 14,862,228 0.44% 65,394 School District #89 24,360,000 18.98% 4,623,528 Village of Glen Ellyn (1) 13,465,000 0.36% 48,474 Village of Lisle 7,880,000 2.07% 163,116 Village of Winfield (1) 5,970,000 4.85% 289,545
Note
(1) Determined by the ratio of assessed valuation of property subject to taxation in the District to valuation of property subject to taxation in overlapping unit.
WHEATON PARK DISTRICT
DIRECT AND OVERLAPPING GOVERNMENTAL ACTIVITIES DEBT
December 31, 2009
Governmental Unit
WHEATON, ILLINOIS
- 98 -
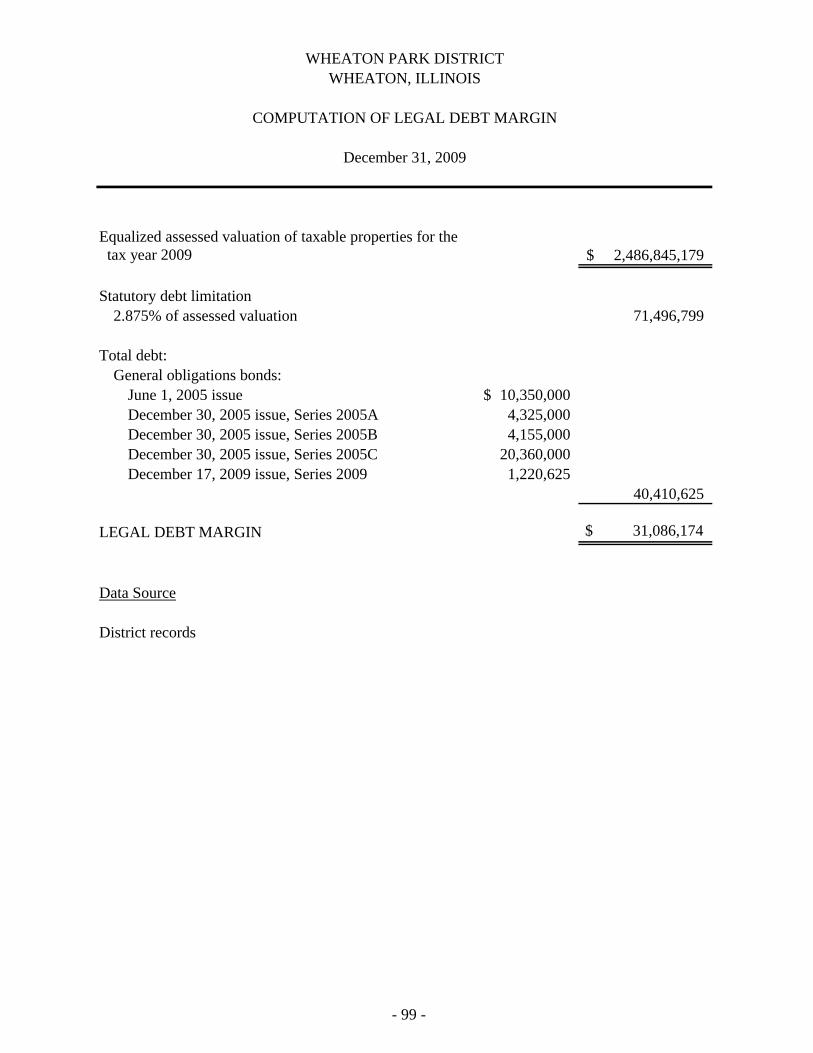
Equalized assessed valuation of taxable properties for the2,486,845,179$
Statutory debt limitation2.875% of assessed valuation 71,496,799
Total debt:General obligations bonds:
June 1, 2005 issue 10,350,000$ December 30, 2005 issue, Series 2005A 4,325,000 December 30, 2005 issue, Series 2005B 4,155,000 December 30, 2005 issue, Series 2005C 20,360,000 December 17, 2009 issue, Series 2009 1,220,625
40,410,625
LEGAL DEBT MARGIN $ 31,086,174
Data Source
District records
WHEATON PARK DISTRICT
COMPUTATION OF LEGAL DEBT MARGIN
December 31, 2009
tax year 2009
WHEATON, ILLINOIS
- 99 -
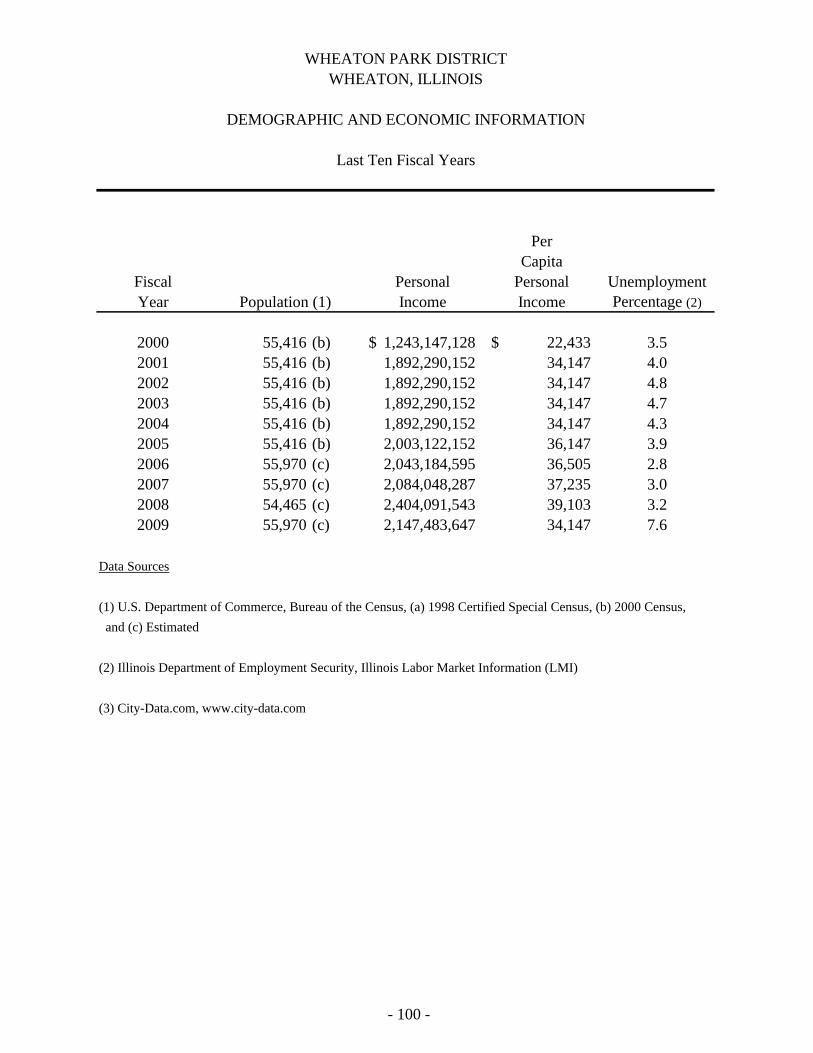
PerCapita
Fiscal Personal Personal UnemploymentYear Income Income Percentage (2)
2000 55,416 (b) 1,243,147,128$ 22,433$ 3.52001 55,416 (b) 1,892,290,152 34,147 4.02002 55,416 (b) 1,892,290,152 34,147 4.82003 55,416 (b) 1,892,290,152 34,147 4.72004 55,416 (b) 1,892,290,152 34,147 4.32005 55,416 (b) 2,003,122,152 36,147 3.92006 55,970 (c) 2,043,184,595 36,505 2.82007 55,970 (c) 2,084,048,287 37,235 3.02008 54,465 (c) 2,404,091,543 39,103 3.22009 55,970 (c) 2,147,483,647 34,147 7.6
Data Sources
(1) U.S. Department of Commerce, Bureau of the Census, (a) 1998 Certified Special Census, (b) 2000 Census,and (c) Estimated
(2) Illinois Department of Employment Security, Illinois Labor Market Information (LMI)
(3) City-Data.com, www.city-data.com
Population (1)
Last Ten Fiscal Years
WHEATON PARK DISTRICTWHEATON, ILLINOIS
DEMOGRAPHIC AND ECONOMIC INFORMATION
- 100 -
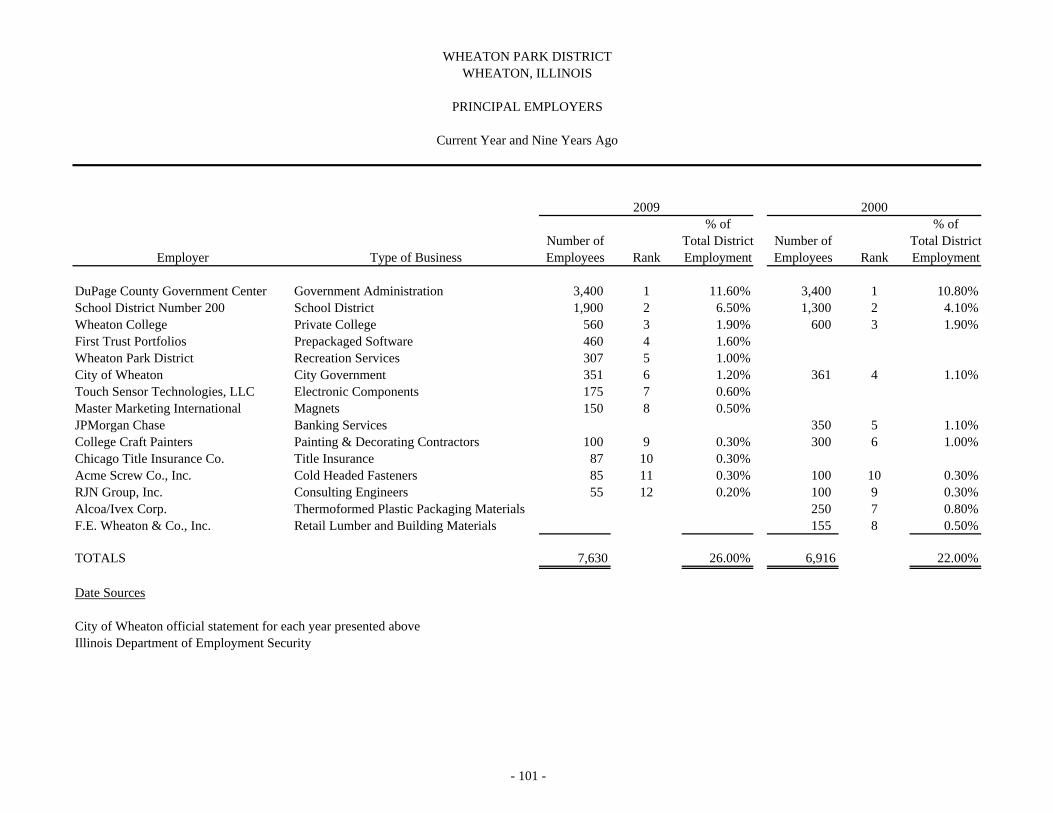
% of % ofNumber of Total District Number of Total District
Employer Type of Business Employees Rank Employment Employees Rank Employment
DuPage County Government Center Government Administration 3,400 1 11.60% 3,400 1 10.80%School District Number 200 School District 1,900 2 6.50% 1,300 2 4.10%Wheaton College Private College 560 3 1.90% 600 3 1.90%First Trust Portfolios Prepackaged Software 460 4 1.60%Wheaton Park District Recreation Services 307 5 1.00%City of Wheaton City Government 351 6 1.20% 361 4 1.10%Touch Sensor Technologies, LLC Electronic Components 175 7 0.60%Master Marketing International Magnets 150 8 0.50%JPMorgan Chase Banking Services 350 5 1.10%College Craft Painters Painting & Decorating Contractors 100 9 0.30% 300 6 1.00%Chicago Title Insurance Co. Title Insurance 87 10 0.30%Acme Screw Co., Inc. Cold Headed Fasteners 85 11 0.30% 100 10 0.30%RJN Group, Inc. Consulting Engineers 55 12 0.20% 100 9 0.30%Alcoa/Ivex Corp. Thermoformed Plastic Packaging Materials 250 7 0.80%F.E. Wheaton & Co., Inc. Retail Lumber and Building Materials 155 8 0.50%
TOTALS 7,630 26.00% 6,916 22.00%
Date Sources
City of Wheaton official statement for each year presented aboveIllinois Department of Employment Security
WHEATON PARK DISTRICT
PRINCIPAL EMPLOYERS
Current Year and Nine Years Ago
2009
WHEATON, ILLINOIS
2000
- 101 -
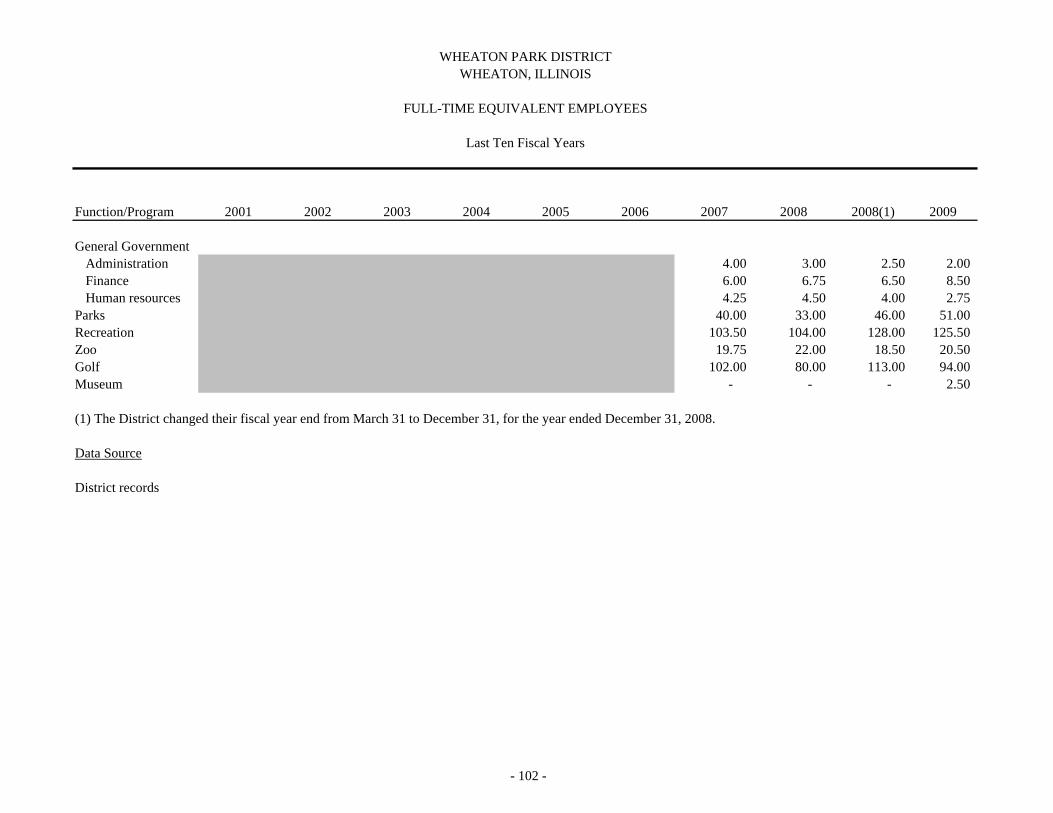
Function/Program 2001 2002 2003 2004 2005 2006 2007 2008 2008(1) 2009
General GovernmentAdministration 4.00 3.00 2.50 2.00 Finance 6.00 6.75 6.50 8.50 Human resources 4.25 4.50 4.00 2.75
Parks 40.00 33.00 46.00 51.00 Recreation 103.50 104.00 128.00 125.50 Zoo 19.75 22.00 18.50 20.50 Golf 102.00 80.00 113.00 94.00 Museum - - - 2.50
(1) The District changed their fiscal year end from March 31 to December 31, for the year ended December 31, 2008.
Data Source
District records
Last Ten Fiscal Years
FULL-TIME EQUIVALENT EMPLOYEES
WHEATON, ILLINOISWHEATON PARK DISTRICT
- 102 -
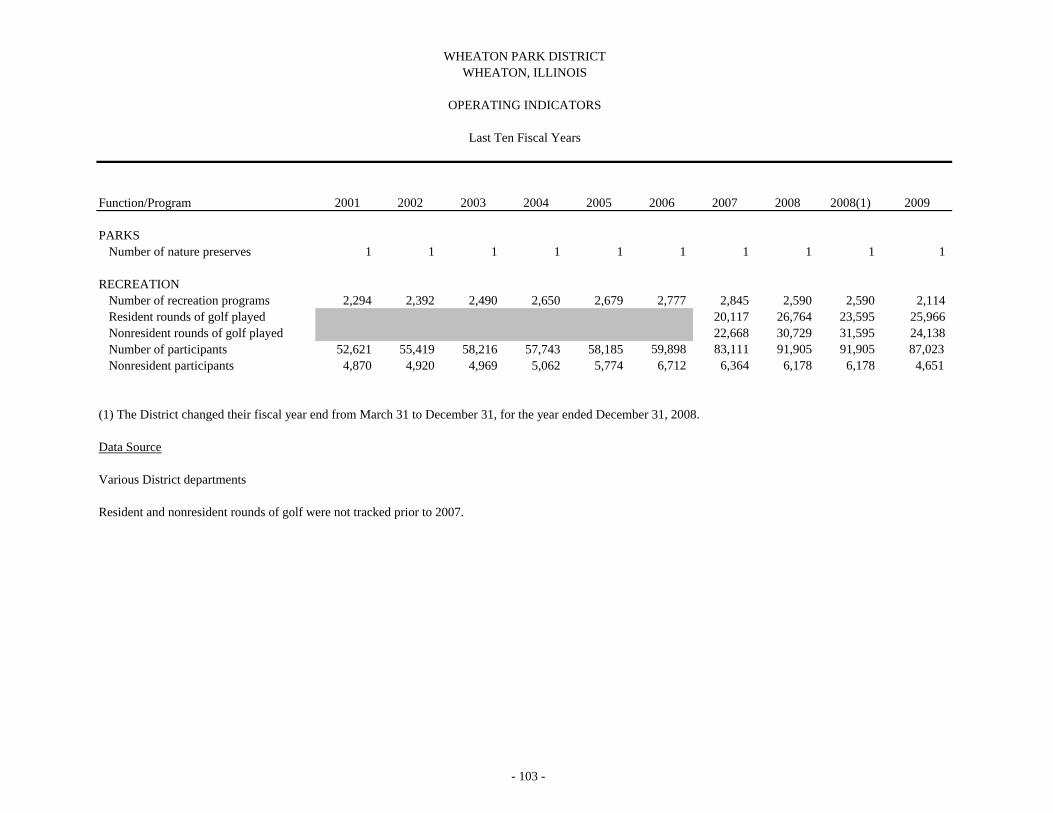
Function/Program 2001 2002 2003 2004 2005 2006 2007 2008 2008(1) 2009
PARKSNumber of nature preserves 1 1 1 1 1 1 1 1 1 1
RECREATIONNumber of recreation programs 2,294 2,392 2,490 2,650 2,679 2,777 2,845 2,590 2,590 2,114 Resident rounds of golf played 20,117 26,764 23,595 25,966 Nonresident rounds of golf played 22,668 30,729 31,595 24,138 Number of participants 52,621 55,419 58,216 57,743 58,185 59,898 83,111 91,905 91,905 87,023 Nonresident participants 4,870 4,920 4,969 5,062 5,774 6,712 6,364 6,178 6,178 4,651
(1) The District changed their fiscal year end from March 31 to December 31, for the year ended December 31, 2008.
Data Source
Various District departments
Resident and nonresident rounds of golf were not tracked prior to 2007.
Last Ten Fiscal Years
OPERATING INDICATORS
WHEATON, ILLINOISWHEATON PARK DISTRICT
- 103 -
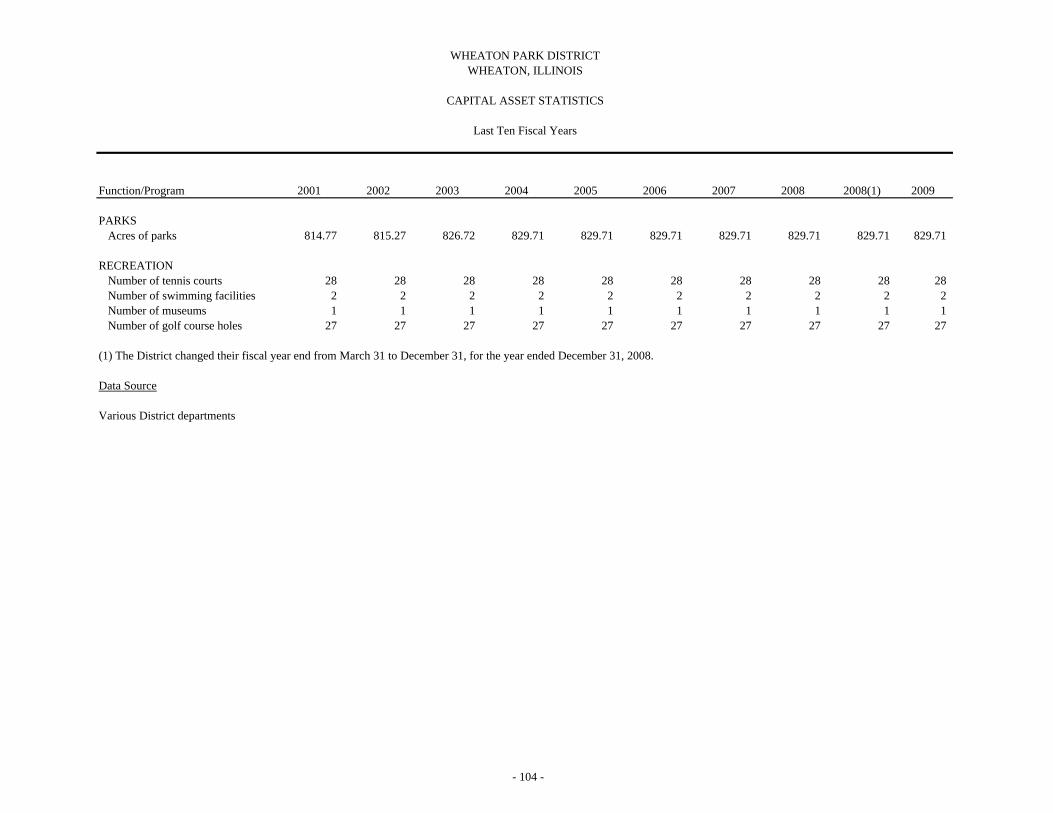
Function/Program 2001 2002 2003 2004 2005 2006 2007 2008 2008(1) 2009
PARKSAcres of parks 814.77 815.27 826.72 829.71 829.71 829.71 829.71 829.71 829.71 829.71
RECREATIONNumber of tennis courts 28 28 28 28 28 28 28 28 28 28 Number of swimming facilities 2 2 2 2 2 2 2 2 2 2 Number of museums 1 1 1 1 1 1 1 1 1 1 Number of golf course holes 27 27 27 27 27 27 27 27 27 27
(1) The District changed their fiscal year end from March 31 to December 31, for the year ended December 31, 2008.
Data Source
Various District departments
Last Ten Fiscal Years
CAPITAL ASSET STATISTICS
WHEATON, ILLINOISWHEATON PARK DISTRICT
- 104 -