Embed Size (px)
Citation preview
AFRL-RH-WP-TR-2013-0061
WHAT'S WRONG WITH AUTOMATIC SPEECH
RECOGNITION (ASR) AND HOW CAN WE FIX IT?
Nelson Morgan Steven Wegmann
Jordan Cohen International Computer Science Institute
1947 Center Street, Suite 600 Berkeley, CA 94704
MARCH 2013 Final Report
Distribution A: Approved for public release; distribution unlimited.
AIR FORCE RESEARCH LABORATORY 711TH HUMAN PERFORMANCE WING
HUMAN EFFECTIVENESS DIRECTORATE WRIGHT-PATTERSON AIR FORCE BASE, OH 45433
AIR FORCE MATERIEL COMMAND UNITED STATES AIR FORCE
NOTICE AND SIGNATURE PAGE
Using Government drawings, specifications, or other data included in this document for any purpose other than Government procurement does not in any way obligate the U.S. Government. The fact that the Government formulated or supplied the drawings, specifications, or other data does not license the holder or any other person or corporation; or convey any rights or permission to manufacture, use, or sell any patented invention that may relate to them.
This report was cleared for public release by the 88th Air Base Wing Public Affairs Office and is available to the general public, including foreign nationals. Copies may be obtained from the Defense Technical Information Center (DTIC) (http://www.dtic.mil).
AFRL-RH-WP-TR-2013-0061 HAS BEEN REVIEWED AND IS APPROVED FOR PUBLICATION IN ACCORDANCE WITH ASSIGNED DISTRIBUTION STATEMENT.
//Signed// //Signed// ______________________________________ ___________________________________ William Kilpatrick Louise A. Carter, PhD Work Unit Manager Chief, Human-Centered ISR Division Patterns of Life Branch Human Effectiveness Directorate 711th Human Performance Wing Air Force Research Laboratory This report is published in the interest of scientific and technical information exchange, and its publication does not constitute the Government’s approval or disapproval of its ideas or findings.

i
REPORT DOCUMENTATION PAGE Form Approved
OMB No. 0704-0188 Public reporting burden for this collection of information is estimated to average 1 hour per response, including the time for reviewing instructions, searching existing data sources, gathering and maintaining the data needed, and completing and reviewing this collection of information. Send comments regarding this burden estimate or any other aspect of this collection of information, including suggestions for reducing this burden to Department of Defense, Washington Headquarters Services, Directorate for Information Operations and Reports (0704-0188), 1215 Jefferson Davis Highway, Suite 1204, Arlington, VA 22202-4302. Respondents should be aware that notwithstanding any other provision of law, no person shall be subject to any penalty for failing to comply with a collection of information if it does not display a currently valid OMB control number. PLEASE DO NOT RETURN YOUR FORM TO THE ABOVE ADDRESS.
1. REPORT DATE (DD-MM-YYYY) 08-MAR-2013
2. REPORT TYPE
Final Report3. DATES COVERED (From - To)
March 2012 - March 20134. TITLE AND SUBTITLE
What's Wrong With Automatic Speech Recognition (ASR) and How Can We Fix It?
5a. CONTRACT NUMBER
FA8650-12-C-7217
5b. GRANT NUMBER
5c. PROGRAM ELEMENT NUMBER
6. AUTHOR(S) Nelson Morgan, Steven Wegmann, Jordan Cohen
5d. PROJECT NUMBER
5e. TASK NUMBER
5f. WORK UNIT NUMBER
H0BD (OMSS0001) 7. PERFORMING ORGANIZATION NAME(S) AND ADDRESS(ES)
8. PERFORMING ORGANIZATION REPORT NUMBER
International Computer Science Institute 1947 Center Street, Suite 600 Berkeley, CA 94704
9. SPONSORING / MONITORING AGENCY NAME(S) AND ADDRESS(ES) 10. SPONSOR/MONITOR’S ACRONYM(S)
11. SPONSOR/MONITOR’S REPORT
NUMBER(S)
AFRL-WP-TR-RH-2013-0061 12. DISTRIBUTION / AVAILABILITY STATEMENT
Distribution A. Approved for public release; distribution is unlimited. 13. SUPPLEMENTARY NOTES
88ABW-2013-3714, cleared 20 August 2013 14. ABSTRACT Seedling effort sponsored by IARPA to investigate the sources of speech recognition errors associated with noisy or unusual acoustic conditions. Research was conducted through two separate mechanisms: an in-depth study of the source of errors in the acoustic model, using a novel sampling process to quantify the effects that the two major Hidden Markov Model (HMM) assumptions have on recognition accuracy; and a broader study of problems in speech recognition relying on a surveys of area experts and relevant literature. The in-depth study demonstrates that a lack of robustness (to mismatched training/test conditions) is a significant source of error and that the sensitivity to such mismatches in the acoustic representations is a prominent source of errors. The results also show that in the case of matched conditions, one of the incorrect assumptions inherent to the standard statistical models is the dominant source of errors. A survey of automatic speech recognition (ASR) researchers and of the ASR literature provides a further sense of the community’s perspective on the topic. The report concludes with some speculations for fruitful directions of future research. The authors also suggest some extensions of this line of inquiry to other prediction and classification problems beyond speech recognition. 15. SUBJECT TERMS Automatic Speech Recognition (ASR), acoustic model, source errors, failure modes, resampling methods, noisy acoustic data, far-field acoustic data, accented speech, disfluent speech, unusual acoustic conditions, community survey
16. SECURITY CLASSIFICATION OF:
17. LIMITATION OF ABSTRACT
18. NUMBER OF PAGES
19a. NAME OF RESPONSIBLE PERSONWilliam Kilpatrick
a. REPORT U
b. ABSTRACT U
c. THIS PAGE U SAR
19b. TELEPHONE NUMBER (include area code)
Standard Form 298 (Rev. 8-98)Prescribed by ANSI Std. 239.18
Air Force Material Command Air Force Research Laboratory Human Effectiveness Division Human-Centered ISR Division Wright-Patterson AFB, OH 45433

ii
THIS PAGE IS INTENTIONALLY LEFT BLANK.
iii
TABLE OF CONTENTS
Section Page
LIST OF FIGURES .........................................................................................................................v
LIST OF TABLES ......................................................................................................................... vi
1.0 EXECUTIVE SUMMARY .................................................................................................1
2.0 INTRODUCTION ...............................................................................................................3
2.1 Historical Background ...................................................................................................35
2.2 In-Depth Study: The Effects of Standard HMM Assumptions on Performance ...........4
2.3 Breasth-Wise Study: The Community/Literature Surves on Errors in ASR ...............35
3.0 METHODS, ASSUMPTIONS, AND PROCEDURES .......................................................6
3.1 In-Depth Study: Simulation and Resampling Methodology ...........................................6
3.1.1. Datasets ................................................................................................................7
3.1.2. Models and Experimental Setup ...........................................................................9
3.2 Breadth-Wise Study .......................................................................................................10
3.2.1. Demographics .....................................................................................................10
3.2.2. The Questionnaire ..............................................................................................10
3.2.3 The Literature Review. ........................................................................................11
4.0 RESULTS AND DISCUSSION ........................................................................................12
4.1 In-Depth STudy .............................................................................................................12
4.1.1. Analysis of Matched NF Results ........................................................................12
4.1.2. Analysis of Matched FF Results ........................................................................13
4.1.3. Analysis of the Mismatched Case ......................................................................14
4.1.4. Experiments with some Standard Methods of Improvements ............................35
4.1.5. Commentary on the Efficacy of These Three Methods .....................................17
4.2 Breadth-Wise Study .......................................................................................................18
4.2.1. Question Two: Where has the Current Technology Failed ...............................18
4.2.2. Question Three: What do you Think is Broken? ...............................................20
4.2.3. Question Four: What have you Tried to do to Improve the Technology that Should Have Worked but did not? ...................................................................................21
4.2.4. Question Five: Why didn’t your Fix Work? .....................................................22
4.2.5. Question Six: Have you Solved any Speech Technology Problems that weren’t Published? If so, What? ...................................................................................................24
4.2.6. Summary of Responses to Technical Questions ................................................24
iv
4.2.7. Perspectives from Earl;ier Surveys of Speech Recognition ...............................24
5.0 CONCLUSIONS................................................................................................................31
6.0 RECOMMENDATIONS ...................................................................................................33
6.1 Make Use of Diagnostics Analysis to Drive Development of Remedies ......................33
6.2 Extend Diagnostic Analysis to Other Components .......................................................35
6.3 Update the Model ...........................................................................................................35
6.4 Seek Low Dimensional Parameters to Characterize Speech Variability .......................35
6.5 Study the Brain ..............................................................................................................35
6.6 Beyond ASR ..................................................................................................................35
7.0 REFERENCES ..................................................................................................................35
APPENDIX A – Detailed Numberical Results, In-Depth Study ...................................................35
APPENDIX B – Demographic Information for Surveys ...............................................................39
APPENDIX C – Bibliography (Other Relevant Publications) ......................................................42
LIST OF ACRONYMS .................................................................................................................46
v
LIST OF FIGURES
Figure Page
1 Time Alignment .......................................................................................................8
2 WER for Framewise Resampled Data and for Original Data, NF Recordings .....13
3 WERfor Framewise Resampled Data and for Original Data, FF Recordings .......14
4 WER for Framewise Resampled Data and for Original Data, FF Recordings, NF Models .............................................................................................................15
5 Categorization of Responses to “Where has the Current Technology Failed?” ....19
6 Categorized Responses to Question, “What is Broken.” .......................................20
7 Categorization of Unsuccessful Attempts to FIx the Technology .........................22
8 Categorizations of Responses Explaining why Their Plausible Solutions to ASR Technology Limitations had not Succeeded .................................................23
9 Official NIST ASR History Graph ........................................................................25
10 Inferred Error Proportions for Sources of Word Errors in Recognition of NF Meeting Data from Models Trained on NF Data, ICSI Meeting Corpus ..............32
11 Inferred Error Proportions for Sources of Word Errors in Recognition of FF Meeting Data from Models trained on NF Data, ICSI Meeting Corpus ................32
12 Distribution of Interviewees by Organization Type ..............................................39
13 Distribution of Interviewees by Age ......................................................................40
14 Distribution of Interviewees by Job Type ..............................................................40
15 Distribution of Interviewees by Current Work Area .............................................41
vi
LIST OF TABLES
Table Page
1 Training and Test Statistics for NF and FF ..............................................................9
2 NF Results ..............................................................................................................12
3 Simulation from the Model and Resampling at the Different Levels of Granularity for the FF Matched Case ....................................................................13
4 Simulation from the Model andResampling at the Different Levels of Granularity for the Mismatched Case (NF Training, FF Test) ..............................15
5 Maximum Likelihood vs MPE WER for the 3 Conditions Under Study and for 1, 2, 4, and 8 Gaussian Components per Crossword Triphone ........................37
6 Effect of Transforming MFCCs with a Phonetically and Discriminantly Trained MLP for NF Data and NF Models ............................................................38
7 Effect of Transforming MFCCs with a Phonetically and Discriminantly Trained MLP for FF Data and FF Models .............................................................38
8 Effect of Transforming MFCCs with a Phonetically and Discriminantly Trained MLP for the Case of Framewise Resampling FF Data and NF Models....................................................................................................................38
ACKNOWLEDGEMENTS
This research effort was supported by the Intelligence Advanced Research Projects Activity (IARPA) via the Air Force Research Laboratory. The U.S. Government is authorized to reproduce and distribute reprints for Governmental purposes notwithstanding any copyright annotation thereon. Disclaimer: The views and conclusions contained herein are those of the authors and should not be interpreted as necessarily representing the official policies or endorsements, either expressed or implied, of IARPA, AFRL, or the U.S. Government.
vii
1 Distribution A: Approved for public release; distribution unlimited. 88 ABW-2013-3714, cleared 20 August 2013
1.0 EXECUTIVE SUMMARY
Automatic Speech Recognition (ASR) forms a critical link in the acquisition of information from audio and video data. Currently, the accuracy of this component in common real world acoustic conditions is quite poor. Depending on acoustic conditions and microphone placement, speech recognition error rates for conversational speech range from the mid-teens to 30-50%, even for the best systems. This range makes further analysis by humans or machines extremely difficult.
Over the last year, with sponsorship from Intelligence Advanced Research Projects Activity (IARPA) and Air Force Research Laboratory (AFRL), we have focused on determining the primary sources of these difficulties. We did this through two separate mechanisms: an in-depth study of the source of errors in the acoustic model, using a novel sampling process to quantify the effects that the two major Hidden Markov Model (HMM) assumptions have on recognition accuracy; and a broader study of problems in this area, in which we relied on a survey of area experts and of the relevant literature.
In the in-depth study, we have obtained results that demonstrate, among other things, that a lack of robustness (to mismatched training/test conditions) is a significant source of error in our own experiments, and that the sensitivity to such mismatch in the acoustic representations is a prominent source of errors. However, our results also show that in the case of matched conditions, the incorrect assumptions inherent to our standard statistical models is the dominant source of errors.
In particular, by exploiting a resampling method based on Efron’s bootstrap [1], we constructed a series of pseudo datasets from Near-Field (NF)and Far-Field (FF) meeting room datasets, that at one end satisfied the HMM model assumptions, while at the other end deviated from the model in the way real data did. Using these datasets, we probed the standard HMM/Gaussian Mixture Model (GMM) framework for ASR. Experiments show that when the conditions are matched (even if they are FF), the model errors dominate; however, in mismatched conditions features are neither invariant nor are they separable using the NF models, and contribute as much to the total errors as does the model. We then studied unsupervised Maximum Likelihood Linear Regression (MLLR) adaptation as a means to compensate for this issue in the model space; while this approach mitigates the errors, the conclusions about the lack of invariance of the Mel Frequency Cepstral Coefficient (MFCC) features in mismatched conditions still holds true. As part of future work, this study paves way for principled investigations into other spectro-temporal representations [2].
Our surveys of ASR researchers and of the ASR literature have provided a further sense of the community’s perspective on the topic. Our informants believed that they were working with an emerging technology. In fact, there was a note of cynicism from many as they felt that the core recognition models were so old, that the technology had been an emerging technology for 30 years. It was noted as immature in essentially all of the technical aspects of recognition. While there was minor dissatisfaction with recognition performance per se, the major complaint was that the speech recognition systems that are deployed today are not robust to conditions other than the training conditions. They degrade rapidly and not gracefully in noise, for novel speakers, in far-field or other unusual acoustic conditions, in accented speech, and for speech in which other signals or noises share the acoustic channel.
2 Distribution A: Approved for public release; distribution unlimited. 88 ABW-2013-3714, cleared 20 August 2013
Our informants identified essentially every element of the current ASR technology as the focus of experiments to attempt to improve the technology. Failures were abundant, and performance continues to lag that of people in similar situations.
Our two studies were primarily focused on finding the source of difficulties in ASR technology, and the determination of promising directions is much harder. That being said, given the extremely low error rates for data matching our models’ independence assumptions, it is likely that explorations of methods for properly representing the conditional dependence between frames and phones (given the state) should have a major effect. On the other hand, given the problems that our community identified with brittle system and their lack of robustness, our results point to the relevance of acoustic representations that would be more invariant to such mismatches or those that are easily compensated for those conditions. Furthermore, the use of resampling techniques such as the ones we have used could provide a useful tool during the development of methods to handle these two issues – it could provide a more sensitive indicator than just looking at the word error rate for the real data.
3 Distribution A: Approved for public release; distribution unlimited. 88 ABW-2013-3714, cleared 20 August 2013
2.0 INTRODUCTION
2.1 Historical Background
Speech recognition is defined as the science of recovering words from an acoustic signal meant to convey those words to a human listener. Since the initial use of patterns in speech displayed by “spectrograms”, developed during World War II but released to the public in the years following the war, the art of speech recognition has gone through several phases. Early work centered on hand-crafted models of spectra and their movements, such as the early digit recognizers from Bell Laboratories. In the 1970’s recognition work was focused on Dynamic Time Warping (DTW), where some spectral distance was coupled with a time-warping algorithm and the space of potential warps was searched using a dynamic program. In the 1970’s, the HMM approach was developed by Jim Baker at Carnegie Mellon, by Fred Jelinek and his team at IBM, following fundamental developments by a small number of research scientists at the Institute for Defense Analysis (IDA) in Princeton, NJ.
The IDA team brought the community together in 1982, in a seminar in Princeton, NJ, where they outlined the benefits and practice of HMMs. Shortly thereafter, the Bell Laboratories team, under Larry Rabiner, published several papers comparing the results of speech recognition using DTW and HMM models, noting the substantial improvements of HMM over DTW systems. The field then pivoted to HMM systems. Of note, the IBM laboratories had been doing HMM systems without much fanfare since 1969, and they developed some of the early continuous speech recognition systems using that technology. However, it was the Bell Laboratories publications that swayed the community at large to use HMMs.
Additionally, Defense Advanced Research Projects Agency (DARPA) funded several projects in speech recognition, from the earliest in the 1970’s to the latest in the 2000’s. While the early projects focused on technology, later projects have emphasized pushing the existing technology into more challenging areas, and creating systems that worked in noisy, distorted, and spontaneous conditions. In addition, there was an attempt to create speech-to-speech translation in the Global Autonomous Language Exploitation (GALE) project, where the recognizer simply created a word string that was then manipulated to form words in the target language. None of the later projects focused on improving the under-lying technology of speech recognition, apparently assuming that the work had been done, and that the technology was mature.
Commercialization of the technology was successful in Interactive Voice Response (IVR) systems with limited vocabularies that provide self-service options for customers calling into contact centers, and in dictation products with motivated, engaged talkers. However, more complex, natural language IVR applications required costly professional services engagements in order to tightly tune the applications to work. Additionally, it was not successful for general transcription applications either, as error rates remained stubbornly high. The advent of power-ful smart phones with high quality audio systems, internet connections, and substantial comput-ing power created a new interest in speech recognition technology commercially. For example, as of 2012, a multitude of vendors providing contact center and customer service applications have developed speech-enabled customer care applications on smart phones. While these work well in many environments, they often fail in accented speech, in noisy situations, and in other challenging acoustic environments. Overall, National Institute of Standards and Technology (NIST), who tracks performance of government-funded speech recognition systems, has found

4 Distribution A: Approved for public release; distribution unlimited. 88 ABW-2013-3714, cleared 20 August 2013
that the tremendous decrease in error rates seen in the ‘70s and ‘80s has slowed to a crawl, and in fact, they have not reported any decrease in speech recognition error rates for the last decade.
There has always been a sense among the researchers in speech recognition that our modeling assumptions in HMM systems were too simplistic to be sensible. Larry Gillick and Steven Wegmann, working at Nuance in 2009, explored the hypothesis that the independence assumptions in our models were instrumental in the failure of our models. After this, Steven Wegmann came to ICSI to work on an NSF-funded project to further develop the analysis required, working with Berkeley graduate student, Dan Gillick (Larry’s son). This early work led to the current IARPA/AFRL project to examine the issues in some detail, including an analysis of conditions of acoustic mismatch between training and test. At the same time, we thought it would be useful to probe the large commercial and academic community working in speech and language technology to see how they viewed the technology, and if there was an obvious path to an improved technology that was emerging.
Consequently, we proposed a two part study for the project reported on in this document: (1) an in-depth study of the statistical properties of the standard GMM/HMM-based acoustic model, and (2) a breadth-wise study of the overall field based on a community survey and a corresponding literature search.
2.2 In-Depth Study: The Effects of Standard HMM Assumptions on Performance
It is a reasonable hypothesis that one of the major contributing factors to the oft-observed brittleness of ASR is the remarkable inability of the standard HMM-based acoustic model to accurately model speech test data that differs in character from the data that was used for its training. While there has long been speculation about the root causes of this brittleness, ranging from the over-fitting of the acoustic model to its training data to the lack of invariance of the standard front-end MFCCs, there is surprisingly little quantitative evidence available to back up one claim over another. Furthermore, the research aimed at improving HMM-based speech recognition accuracy has largely ignored questions concerning understanding or quantifying the underlying causes of recognition errors with notable exceptions being [3, 4]. Instead, improve-ments – many of which are reviewed in [5, 6, 7, 8, 9] – to the front-end and the acoustic models have largely proceeded by trial and error. The research that we will describe benefits from our earlier research described in [10, 11] that used simulation and a novel sampling process to quantify the effects that the two major HMM assumptions have on recognition accuracy. In this previous work, we analyzed recognition performance on tasks1 where the properties of the training and test acoustic data were not challenging and were homogeneous, or matched, across the training and test sets. In this report, however, we will summarize analysis of recognition performance using the ICSI meeting corpus [12], where the acoustic data are more challenging. In particular, we are able to exploit properties of this corpus to compare recognition performance when the training and test data acoustics are matched or mismatched.
More specifically, we have used the parallel recordings using near- and far-field microphones in the ICSI meeting corpus to construct three sets of related recognition tasks: (a) matched near-field acoustic model training and recognition test data; (b) matched far-field acoustic model training and recognition test data; (c) mismatched near-field acoustic model training data and far-field recognition test data.
1Based on the Wall Street Journal and Switchboard corpora
5 Distribution A: Approved for public release; distribution unlimited. 88 ABW-2013-3714, cleared 20 August 2013
We are interested in understanding which properties of real data are surprising to the acoustic models that we use, where we will use recognition word error rates as our measure of “surprise”. There are many potential sources of surprise (or mismatch) that the data can present to the acoustic models. However, in the in-depth study described here, we are specifically interested in quantifying the effects of the surprise due to statistical dependence in the data, due to the deviation of real data to the parametric form of the marginal distributions in the model (GMMs), and due to training on near-field data and testing on far-field data. In order to obtain accurate estimates of the degree of surprise due to these factors we must, to the extent that it is possible, eliminate other sources of surprise that, while interesting in their own right, are conflating factors in this study. There are two broad categories of factors that we address involving, on the one hand, properties of the data, and, on the other hand, acoustic model technicalities.
2.3 Breadth-Wise Study: The Community/Literature Surveys on Errors in ASR
It was not possible in a one-year study to do a detailed analysis of every potential source of errors in ASR, certainly not at the level of the in-depth study of the acoustic model introduced above. On the other hand, it was agreed at the outset that we needed to at least consider a broader class of issues in order to better advise the government about fruitful directions for future programs. Consequently, we developed a plan to conduct a survey of the speech recognition community and a search of the relevant literature to get a representative sampling of expert opinions on the state of speech recognition. The project included a survey of many of the active participants in the speech recognition community. We wanted to evaluate what people told us about speech technology and its application in the context of our findings about the performance of modern speech recognition algorithms and their flaws. It is our hope that this analysis, in combination with the in-depth study of the statistical acoustic model, will lead to a way forward for the community to improve speech, or at least show us how to analyze the current state of the technology and uncover areas and ideas for future work.
We set out to interview a significant number of major participants in speech and language technology, asking questions about their sense of the technology, their experience with improving the technology, and their projections for the future. Our interviews were mostly by telephone, although some were in person, and we followed the “snowball” polling practice (described further in Section 3.2), which promised a reasonably unbiased view of international experts’ views. We interviewed academics, commercial developers, and government employees. Both through our own intuitions and the suggestions of the interviewees, we also conducted a search of the relevant literature. The results of both of these efforts certainly show a wide diversity of opinions, but there are some major impressions that we feel are justified by the data. Both the common themes and the diversity of opinions are presented in this report.
6 Distribution A: Approved for public release; distribution unlimited. 88 ABW-2013-3714, cleared 20 August 2013
3.0 METHODS, ASSUMPTIONS, AND PROCEDURES
3.1 In-Depth Study: Simulation and Resampling Methodology
We use simulation and a novel sampling process to generate pseudo test data that deviate from the major HMM assumptions in a controlled fashion. The novel sampling process, called resampling, was adapted from Bradley Efron’s work on the bootstrap [1] in [10, 11]. These processes allow us to generate pseudo data that, at one extreme, agree with all of the model’s assumptions, and at another extreme, deviate from the model in exactly the way real data do. Across this range, we can control the degree of data/model mismatch. By measuring recognition performance on this pseudo test data, we are able to quantify the effect of this controlled data/model mismatch on recognition accuracy.
The Simulation and Resampling Process: Our methodology allows six levels of simulation and resampling:
simulation frame resampling state resampling phone resampling word resampling original test utterance.
Simulation: We follow the full generative process assumed by HMMs. The simulated data, therefore, matches all the assumptions of the model. These assumptions are:
the sequence of states are hidden and are constrained to follow a Markov chain the features are independent conditioned on the states the specific form of the probability distribution of the data generated by a given
hidden state
We follow the standard practice in ASR and use GMMs for these probability distributions. To generate the test data by simulation, we start with the test transcriptions, and look up each word in the pronunciation dictionary to create phone transcriptions. We then use the state transitions and the output distribution associated with the states belonging to the triphones to generate the data. Note however that the delta and acceleration features are also generated.
Frame Resampling: In this case, we do not use the full generative process. Nevertheless, we create data that respects the independence assumptions at different levels. To generate the data in this fashion the following process is performed:
we use the training model to perform forced alignment on the training utterances, so that each speech frame is annotated with its most likely generating state.
we walk through this alignment, filling an urn for each state with its representative frames; at the end of this process, each urn is populated with frames representing its empirical distribution.
To generate resampled data, we use the model to create a forced alignment of the test data, and then sample a frame (at random, with replacement) from the appropriate urn for each frame position; these resampled frames are concatenated.
7 Distribution A: Approved for public release; distribution unlimited. 88 ABW-2013-3714, cleared 20 August 2013
With this frame-level resampling, the pseudo test data is exactly the same length as the original, and has the same underlying alignment, but the frames are now conditionally independent (given the state).
State, phone, and word resampling: By placing entire state sequences of frames in the urns, and then resampling (again, concatenating samples), we end up with pseudo test data with dependence among frames within state regions, but independence across state boundaries (note that resampling units larger than single frames produces pseudo test data that may be a different length from the original). We can further extend this idea to phones and to words; in all cases, the urn labels include the full triphone context.
Enforcing Common Alignment for NF and FF Data: The method of resampling creates an alignment of the training dataset using the recognition model; it then uses the alignments to fill urns that are in turn used to create the pseudo test utterances. The differences in the alignments created by the NF and the FF model will lead to the creation of pseudo test sets that are not parallel, leading to the NF model trying to compensate, in addition, for a mismatched alignment. In order to minimize this effect, we create alignments using the NF model on the NF data, and use this alignment to generate pseudo, FF test data (for the mismatched case).
3.1.1. Datasets
We are using a dataset of spontaneous meeting speech recorded at ICSI [12] where each spoken utterance was captured using NF and FF2 microphones. Our training set is based on the meeting data used for adaptation in the SRI-ICSI meeting recognition system [13]. For the test set, we used the ICSI meetings drawn from the NIST RT eval sets [14, 15, 16]; this was done to control the variability in the data for the resampling experiments.
The remainder of this subsection discusses the creation of the parallel NF and FF corpora for this paper. First, we describe how we estimate and remove a variable length time delay that exists between the corresponding NF and FF utterances, so that each training and test utterance has two parallel versions – NF and FF – that are aligned at the MFCC frame level. Next we discuss how we partition these parallel NF and FF corpora data into training and test sets.
Time-Aligning the Corpora: In order to synchronize the NF and FF recordings, we must deal with a time delay, or skew, that exists between the two recordings. These time delays arise from two factors:
different physical distances between the speakers and the microphones, and systematic delays introduced by the recording software
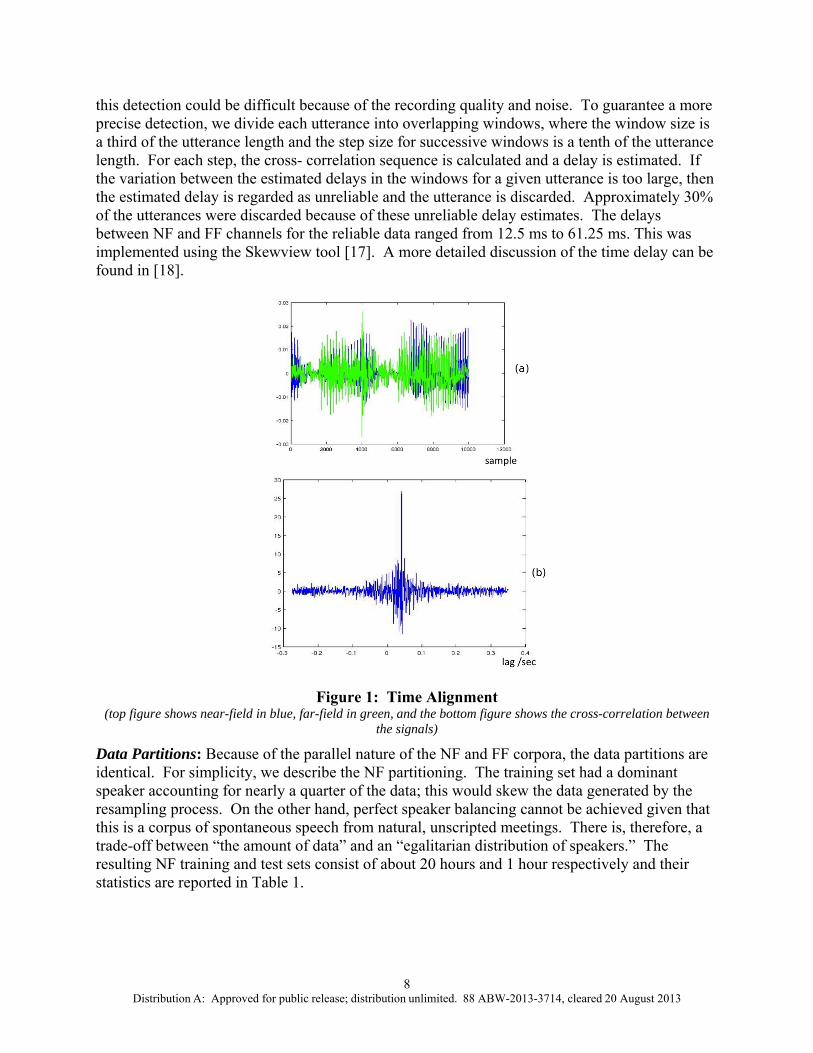
The latter factor appears to dominate the skew between the NF and FF recordings. Fixed delays were introduced when the channels were initialized at the start of a recording. Since this systematic delay dominates the skew, the NF recordings have a time delay relative to the FF recordings. Figure 1(a) illustrates an utterance captured by the FF microphone that is advanced in time in comparison to the same utterance captured by the NF microphone.
Time delay is more evident in the cross-correlation between the NF and FF signals, as shown in Figure 1(b). The delay could be estimated by searching for a peak in the cross-correlation sequence. In Figure 1(b) the peak is at a lag of 41.88 ms (670 samples at 16 kHz). However,
2 We used the SDM or “Single Distant Microphone” recordings for the far-field data.
8 Distribution A: Approved for public release; distribution unlimited. 88 ABW-2013-3714, cleared 20 August 2013
this detection could be difficult because of the recording quality and noise. To guarantee a more precise detection, we divide each utterance into overlapping windows, where the window size is a third of the utterance length and the step size for successive windows is a tenth of the utterance length. For each step, the cross- correlation sequence is calculated and a delay is estimated. If the variation between the estimated delays in the windows for a given utterance is too large, then the estimated delay is regarded as unreliable and the utterance is discarded. Approximately 30% of the utterances were discarded because of these unreliable delay estimates. The delays between NF and FF channels for the reliable data ranged from 12.5 ms to 61.25 ms. This was implemented using the Skewview tool [17]. A more detailed discussion of the time delay can be found in [18].
Figure 1: Time Alignment
(top figure shows near-field in blue, far-field in green, and the bottom figure shows the cross-correlation between the signals)
Data Partitions: Because of the parallel nature of the NF and FF corpora, the data partitions are identical. For simplicity, we describe the NF partitioning. The training set had a dominant speaker accounting for nearly a quarter of the data; this would skew the data generated by the resampling process. On the other hand, perfect speaker balancing cannot be achieved given that this is a corpus of spontaneous speech from natural, unscripted meetings. There is, therefore, a trade-off between “the amount of data” and an “egalitarian distribution of speakers.” The resulting NF training and test sets consist of about 20 hours and 1 hour respectively and their statistics are reported in Table 1.

9 Distribution A: Approved for public release; distribution unlimited. 88 ABW-2013-3714, cleared 20 August 2013
Table 1: Training and Test Statistics for NF and FF
Dataset Speakers Utterances Time Training 26 23729 20.4 (hrs)
Test 18 1063 57.9 (mins)
3.1.2 Models and Experimental Setup
We use version 3.4 of the HMM Tool Kit (HTK) toolkit [19] for the front-end, acoustic model training, and decoding. In particular, we use the standard HTK front-end to produce a 39 dimensional feature vector every 10 ms: 13 Mel-cepstral coefficients, including energy, plus their first and second differences. The cepstral coefficients are mean-normalized at the utterance level. We use HDecode for decoding with a wide search beam (300) to avoid search errors. To evaluate recognition accuracy the reference and the decoded utterances are text normalized before the NIST tool sclite is used to obtain Word Error Rate (WER). The remainder of this section discusses the recognition acoustic models, dictionary, and language model.
NF Acoustic Models: The NF acoustic models use cross-word triphones and are estimated using maximum likelihood. Except for silence, each triphone is modeled using a three-state HMM with a discrete linear transition structure that prevents skipping. The output distribution for each HMM state is a GMM with each component being a multivariate Gaussian with diagonal covariance. We use GMMs with 1, 2, 4, and 8 mixture components. While significantly better performance can be achieved with mixtures of more components, the simplicity of a single component is preferable for our analysis; it also highlights the performance differences between our experiments. Maximum likelihood training roughly follows the HTK tutorial: monophone models are estimated from a “flat start,” duplicated to form triphone models, clustered to 2500 states and re-estimated.
FF Acoustic Models: Via Single-Pass Retraining: Instead of building the FF acoustic models from a flat start, we exploit the parallel nature of the NF and FF training sets to build the FF models using single-pass retraining from the final NF models and the FF data. Single-pass retraining is a form of EM, which is supported by HTK, where, in our case, the E-step is performed using the NF models and data, while the M-step and model updates use the FF data. We only update the means and variances of the FF models, so the result is a parallel set of NF and FF acoustic models that share the same state-tying but the (unknown) transformation between the NF and FF means and variances is determined by the frame-level transformation between the parallel NF and FF acoustic data.
Dictionary and Language Models (LMs): Since we are using relatively simple acoustic models – small mixture models per state and 2500 tied states–and that the recognition task is much more complex compared to [10,11], we use a powerful LM to keep the error rate manageable. In fact, our initial experiments using a weaker LM derived from the training set resulted in WERs as high as 64% in the matched NF condition. We use a LM [20] that was trained at SRI by interpolating a number of source LMs; these consisted of webtext and the transcripts of the following corpora: Switchboard, meetings (CMU, ICSI, and NIST), Fisher, Hub4- LM96, and TDT4. We then removed words not in the training dictionary from the trigram LM and renormalized it. The perplexity of this meeting room LM is around 70 on our test set. To avoid out-of-vocabulary issues, all test utterances containing a word not present in the LM were removed. To be compatible with the SRI LM, we use the SRI pronunciation dictionary; it uses two extra phones in comparison with the CMU phone set – “puh” and “pum” – for hesitations.
10 Distribution A: Approved for public release; distribution unlimited. 88 ABW-2013-3714, cleared 20 August 2013
3.2 Breadth-Wise Study
The survey was conducted using “snowball sampling,” which is a method for gathering research subjects through the identification of an initial subject or set of subjects who are used to provide the names of other potential subjects [22]. This was used in our study in order to gain access to experts within the field of speech recognition. As such, we started with a few targeted participants and asked each of them at the end of the survey to give us contact information for two other people within the industry that might participate in our survey.
Whereas the snowball sampling technique can be construed as presenting some bias, in the case of this study we were trying to reach participants with the broadest range of experience within speech recognition. Therefore, having participants nominate those in their peer group they felt had the most experience to draw from was an important factor.
We also asked participants if they would be willing to take a more in-depth survey in the future if we did one.
3.2.1. Demographics
The identities of the interviewees in our survey were anonymized. That is, in keeping with the human subjects requirement from the UC Berkeley IRB, access to the raw subject data was restricted to a limited number of researchers on our team3. However, we collected basic demographic information about them to see if we could glean any trend information on who is working in the field.
Name Sex Age Organization Number of Years in Speech Technologies Position/Title Questions as to the state of speech recognition
3.2.2. The Questionnaire
The questionnaire was designed to elicit the broadest possible range of answers and was limited to six questions beyond demographic information.
1. Are you currently working on speech technology products, if so what areas and why?
2. Where has the current technology failed?
3. What do you think is broken?
4. What have you tried to do to improve the technology that should have worked but did not?
5. Why did it fail?
3 This was approved by the UC Berkeley Committee for the Protection of Human Subjects, Protocol number 2012-04-4187, April 23, 2012.
11 Distribution A: Approved for public release; distribution unlimited. 88 ABW-2013-3714, cleared 20 August 2013
6. Have you solved any speech technology problems that were not published? If so, what?
3.2.3. The Literature Review
As noted in Section 2.0, the community survey was augmented by a review of the relevant research literature. In addition to an abundance of survey articles that were apparent to us, we were also guided by suggestions that came from our interviewees. The key results are given in the next section and Appendix C provides an additional list of references that either came from our own perspectives or from those of the interviewees.

12 Distribution A: Approved for public release; distribution unlimited. 88 ABW-2013-3714, cleared 20 August 2013
4.0 RESULTS AND DISCUSSION
4.1 In-Depth Study
NF and FF test data are created by simulation, and then by resampling frames, states, phonemes, and words; the corresponding recognition models are then used for decoding. Each resampling experiment was jackknifed five times (using different partitions each time for decoding) and the results are shown in Tables 2, 3, and 4. In the matched NF experiments, NF models were used to recognize NF test data, while the matched FF experiments used FF models and FF test data. In the mismatched experiments, NF models were used to recognize FF test data. Listed in the table for the matched and the mismatched cases were the WER, Standard Error (SE), and the relative increase in WER from previous level of simulation/resampling (the next highest row). The standard errors ranged from 0.03 (simulation in the NF case) to 0.45 (word resampling in the FF case), so all the WER differences between matched and mismatched conditions were significant. Note that the WERs on the test data increase as we move from NF (44.7%) to FF (71.4%), and then to the mismatched conditions (84.7%); this indicates the difficulty of the tasks.
4.1.1. Analysis of Matched NF Results
NF results are summarized in Table 2. It was remarkable to see that the WER for simulation and frame resampling was negligibly small in meeting room data, albeit with NF microphones; for these cases all assumptions made by the model are satisfied by the data. When this is the case, the WER obtained by the system must be similar to human performance. The largest increase in WER is observed when we move from frame resampling to state resampling – a little more than a four-fold increase in errors. Another large increase in WER (123%) occured when we moved down to phone resampling. As dependence was introduced (going down the rows), we started observing larger WER. These results were consistent with what we observed in [11] on the WSJ and Switchboard corpora, both of which also had matched training and test conditions.
Table 2: Rates Shown are for Simulation from the Model and Resampling at the Different Levels of Granularity for the NF Matched Case
Resampling Method
WER (%) Standard Error ∆ WER (%)
Simulation 1.4 0.03 - Frame 1.9 0.05 31 State 9.6 0.17 416 Phone 21.4 0.21 123 Word 37.6 0.28 75
Original data 44.7 - 19 Note: The last column shows the % increase in WER obtained over the next higher level of resampling. All results are for the 1-Gaussian case; similar trends are observed for 8-Gaussian models, but with lower error rates overall (see Appendix for full results) Figure 2 shows the WERs for models ranging from 1 to 8 Gaussians per state and for two of the cases shown in the table: resampling at the frame level so that the conditional independence assumptions of the model are satisfied; and the original data, for which these assumptions definitely are not satisfied. Note that the differences in performance due to the number of Gaussians are inconsequential compared to the huge effect of the assumption violation in the original data.

13 Distribution A: Approved for public release; distribution unlimited. 88 ABW-2013-3714, cleared 20 August 2013
Figure 2: WERs for Framewise Resampled data and for Original Data (NF recordings on the ICSI meeting corpus, for triphone models ranging from 1 Gaussian per state to 8 Gaussians per state)
4.1.2. Analysis of Matched FF Results
Although the WER is consistently worse for the FF results than they were for the NF results, the pattern of error rates over the different resampling methods for the FF case is consistent with what we observed in the NF experiments and in [11]. However, it is striking how small the WER for simulation (1.8%) is when we consider how large the WERs are on real FF data (71.4%). This shows that, when the training and test conditions are matched, and the model assumptions implicit in HMMs are met, MFCC features are essentially separable even for the more challenging FF meeting data.
Table 3: Rates Shown are For Simulation from the Model and Resampling at Different Levels of Granularity for the FF Matched Case
Resampling Method
WER (%) Standard Error ∆ WER (%)
Simulation 1.8 0.03 - Frame 3.4 0.02 88 State 23.2 0.2 580
Phone 45.5 0.41 96 Word 63.5 0.45 40
Original data 71.4 - 12 Note: The last column shows the % increase in WER obtained over the next higher level of resampling. All results are for the 1-Gaussian case; similar trends are observed for 8-Gaussian models, but with lower error rates overall
Figure 3 shows the WERs for models ranging from 1 to 8 Gaussians per state and for two of the cases shown in the table: resampling at the frame level so that the conditional independence assumptions of the model are satisfied; and the original data, for which these assumptions definitely are not satisfied. Note that, although the WER for original data is far worse than it was for the NF data, as with the earlier case, the differences in performance due to the number of Gaussians is inconsequential compared to the huge effect of the assumption violation in the original data.

14 Distribution A: Approved for public release; distribution unlimited. 88 ABW-2013-3714, cleared 20 August 2013
Figure 3: WERs for Framewise Resampled Data and for Original Data
FF recordings on the ICSI meeting corpus, for triphone models ranging from 1 Gaussian per state to 8 Gaussians per state)
4.1.3. Analysis of the Mismatched Case
The results in the mismatched case were in stark contrast to those obtained for the matched cases. The WER for simulation was much higher at 43%, which indicated MFCCs aren’t separable in this mismatched case, i.e., using the NF models. While the errors due to statistical dependence – the WER from the state resampling to the original data – were considerable (from 59.9% to 84.7%), they were no longer such a dominant cause of recognition errors. To better understand the mismatched simulation result, we compared it to the matched NF simulation result. In both cases we used NF models to recognize simulated data: in the matched case, this data is simulated by the NF models, while in the mismatched case, this data is simulated from the FF models. Because we used single-pass retraining to create the FF models from the NF models, the unknown transformation between the NF and FF means and variances is inherited from the unknown transformation between the parallel NF and FF training utterances. Thus the transformation between the test utterances simulated from the NF and FF models is derived from the transformation between the NF and FF models, and it is related to, but much simpler than, the transformation between the parallel NF and FF training data. The NF models had a low WER on the simulated NF test data (1.4%), but they had a high WER (43%) on the simulated FF data, which was transformed simulated NF data. If the features (MFCCs) were invariant to this transformation, then the WERs would be similar. However, since the WERs were very different, the features couldn’t be invariant and the large difference in WERs is due to this lack of invariance.

15 Distribution A: Approved for public release; distribution unlimited. 88 ABW-2013-3714, cleared 20 August 2013
Table 4: Rates Shown are for Simulation from the Model and Resampling at Different Levels of Granularity for the Mismatched Case (NF Training and FF Test)
Resampling Method
WER (%) Standard Error ∆ WER (%)
Simulation 43.0 0.23 - Frame 59.9 0.26 39 State 75.8 0.27 27
Phone 80.6 0.29 6 Word 80.6 0.15 0
Original data 84.7 - 5 Note: The last column shows the % increase in WER obtained over the next higher level of resampling. All results are for the 1-Gaussian case; similar trends are observed for 8-Gaussian models, but with lower error rates overall (see Appendix)
Figure 4 shows the WERs for models ranging from 1 to 8 Gaussians per state and for two of the cases shown in the table: resampling at the frame level so that the conditional independence assumptions of the model are satisfied; and the original data, for which these assumptions definitely are not satisfied. As with the matched cases, the differences in performance due to the number of Gaussians are inconsequential compared to the huge effect of the assumption violation in the original data. However, unlike the matched cases, the error rates for the framewise resampling are not tiny, indicating that even compensating for the conditional dependence in the data does not fix the problem.
Figure 4: WERs for Framewise Resampled Data and for Original Data
(FF recordings on the ICSI meeting corpus, for triphone models trained on NF recordings, ranging from 1 Gaussian per state to 8 Gaussians per state)
4.1.4. Experiments with Some Standard Methods of Improvement
The literature is replete with methods that have been shown to provide incremental reductions in word error rates under various conditions, and it is far beyond the scope of this report to cover all or even a majority of such methods. However, we have experimented with three of the common methods: MLLR adaptation, Minimum Phone Error (MPE) discriminant retraining, and Multi-Layer Perceptron (MLP) transformation. Here we describe our results for these three in the
16 Distribution A: Approved for public release; distribution unlimited. 88 ABW-2013-3714, cleared 20 August 2013
context of the experimental methods of this study. The results of the breadthwise studies (given below in Section 4.2) will provide a different perspective on the efficacy of the ensemble of such methods. Tables providing specific results for these tests are provided in the Appendix, but the most significant results are described here.
Adaptation: A standard approach to mitigating recognition errors due to mismatched conditions is to perform unsupervised MLLR [21], a form of linear mean adaptation. Since the large difference between the matched NF and mismatched simulation and results is due to the lack of invariance of MFCCs to a (presumably non-linear) transformation between the NF and FF data, it is natural to try to compensate for this using MLLR. We treat one hour of simulated test data as belonging to a single speaker and use the recognition hypotheses to generate the adaptation transforms for the NF models. We do two passes of adaptation: in the first pass a global adaptation is performed, while the second pass uses a regression class tree. We experimented with up to 16 regression classes in the second pass, but we found that 3 classes were optimal. In this case, the simulation WER improves from 43.0% to 15.4% (for the single Gaussian case). While this is a large improvement, the adapted WER, 15.4%, is still much higher than the 1.4% WER on simulated NF data (or the 1.8% WER on simulated FF data). For the case of framewise resampling, MLLR reduced the WER from 59.9% to 43.2%, again, this reduction is modest compared to the framewise resampling result for the NF case, which yielded a WER of 1.9% ; or for the FF case with matched models, which yielded a WER of 3.4%.
In short, while MLLR provides good improvements for original data, and quite substantial improvements for simulation and framewise resampling from the NF model that is recognized using FF models, the remaining errors are still substantial even for these cases that provide test data that satisfy the statistical independence assumptions.
Discriminant Training via the MPE Approach: It is also currently standard in large speech recognition systems to incorporate discriminant model training such as MPE to reduce WER beyond what has been obtained with Maximum Likelihood (ML) models. While this approach is motivated by the desire to more effectively discriminate between correct and nearby incorrect explanations of the data, another perspective is that MPE somehow partially compensates for the dependence in the data. This is suggested by our results with MPE on our meeting data. MPE provides no improvement for the simulated or framewise resampled NF data, for which the conditional independence assumption is satisfied; in particular, for the framewise resampled case, retraining with MPE doesn’t decrease the error rate (from actually slightly increasing from 1.86% to 2.06% for the 1-Gaussian models, and staying the same at .70% for the 8-Gaussian models). For the matched FF data case, the error rate actually increases after applying MPE, going from 3.42% to 7.10% for the 1-Gaussian models, and from 1.32% to 1.50% for the 8-Gaussian models. In both cases, MPE provides the anticipated improvements for the original meeting data. For NF data, MPE reduces the error rate from 44.70% to 39.00% for 1-Gaussian models, and from 33.10% to 30.90% for 8-Gaussian models. For FF data, MPE reduces the error rate from 71.40% to 67.50% for 1-Gaussian models, and from 63.20% to 61.60% for 8-Gaussian models.
For the mismatched case, similar trends are observed. For data generated by simulation using NF models, MPE actually makes things worse, increasing WER from 43.04% to 69.60% for the 1-Gaussian models, and from 24.80% to 34.85% for the 8-Gaussian models. For framewise resampling, WER stayed roughly the same for MPE as it had been for ML models, with WER only moving from 59.93% to 59.50% for the 1-Gaussian case, and from 24.90% to 24.75% for

17 Distribution A: Approved for public release; distribution unlimited. 88 ABW-2013-3714, cleared 20 August 2013
the 8-Gaussian case. As with the matched cases, MPE does help for the original data, bringing the 1-Gaussian WER down from 84.7% to 81.9%, and the 8-Gaussian case down from 80.6% to 77.0%. These results suggest that the gain from using MPE is associated with somehow compensating for the conditional dependence in the data, since such gains are not observed when this dependence is artificially removed.
The full set of results is given in Appendix A, with contrast to the maximum likelihood results.
Discriminant Features via MLP Training: ICSI has been a leader for many years in MLP processing of speech to improve acoustic processing. For a number of tasks in which we used MLP outputs (after log and PCA transformations) as additional features for HMM/GMM systems, we observed significant gains. However, in general, these were for tasks in which the training was reasonably representative of the test set. In our MLP experiments within this study, we found similar effects. For the NF data, transforming the MFCC front end with a phonetically discriminantly-trained MLP provided relative improvements (for the 1 Gaussian case) for the simulation, all levels of resampled data, and even (modestly) for the original data; e.g., WER dropped from 1.9% to 1.0% for the framewise resampling, and from 44.7% to 42.3% for the original data, using 1-Gaussian models. For the FF data, similar effects were seen, although there was no improvement for the original FF data. In particular, transforming MFCCs with an MLP-reduced WER for the framewise resampling from 3.4% to 2.8%, while for the original data the error rate actually increased slightly from 71.4% to 72.2%. In both cases and for all conditions, augmenting the MFCC frontend with the MLP-processed MFCCs improved WER further. However, for the mismatch case, neither using the MLP features alone nor using them in combination with the MFCC front end provided any relief from the increased error rates; in fact, the MLP features worsened the results. For example, for framewise resampling, the error rate increased hugely from 59.9% to 92.5%. For at least this task, the MLP training seemed to overly specialize the representation to an acoustic that was clearly mismatched with the test data.
The full set of results is given in Appendix A.
4.1.5. Commentary on the Efficacy of These Three Methods
As can be seen from the results briefly described above, only MLLR provided significant relief from the huge number of errors engendered by the mismatch in acoustic data characteristics between training and test. MPE provided modest gains for the original data, but when the issues of statistical dependence are accounted for, MPE provides no gain (i.e., for the simulation and framewise resampling cases). Transforming MFCCs with an MLP is even more disappointing, as it shows no improvement for either the original data or the simulated or framewise resampled case.
There is an obvious difference between MLLR adaptation and the other two methods; the former uses information from the test set to improve performance on that very test. This is not “cheating,” as there is no use of supervisory information. But it does differ significantly from the other two methods. Both MPE and MLP feature training attempt to improve discrimination on the training data, and (at least is they are ordinarily implemented) make use of no information from the test data. On the other hand, both methods provide significant gains when used for matched training and testing. This suggests that adaptation methods for discriminant methods should be explored to see if they can provide similar or better (or complementary) gains to what is seen with MLLR.
18 Distribution A: Approved for public release; distribution unlimited. 88 ABW-2013-3714, cleared 20 August 2013
4.2 Breadth-Wise Study
We discuss the primary results of the community survey in this section. In Appendix B, we provide detailed information about the characteristics of the respondents, including their professional affiliation (mostly industrial or academic, with some governmental), their age (essentially all over 40, median age in their mid-50’s), their position (mostly in research or development), and their professional focus (working in a range of ASR-related topics, but with roughly half directly focused on ASR itself).
In the following subsections, we focus on the responses to six questions given in Section 3.2. Each interview was on average 30 minutes long, which also led to many anecdotal comments. We have encapsulated some of the more common themes below and also provide figures showing a categorization of the responses. The answers to Question 1, which were about the interviewees per se, are summarized above and described in detail in Appendix B.
4.2.1. Question 2: Where has the Current Technology Failed?
The interviewees cited many failures in the current speech technology. Often the failures were closely associated with the area in which the informant had been working, but in other cases they took a more global view of the technology, and attempted to tell us under which conditions the technology failed to deliver an acceptable result.
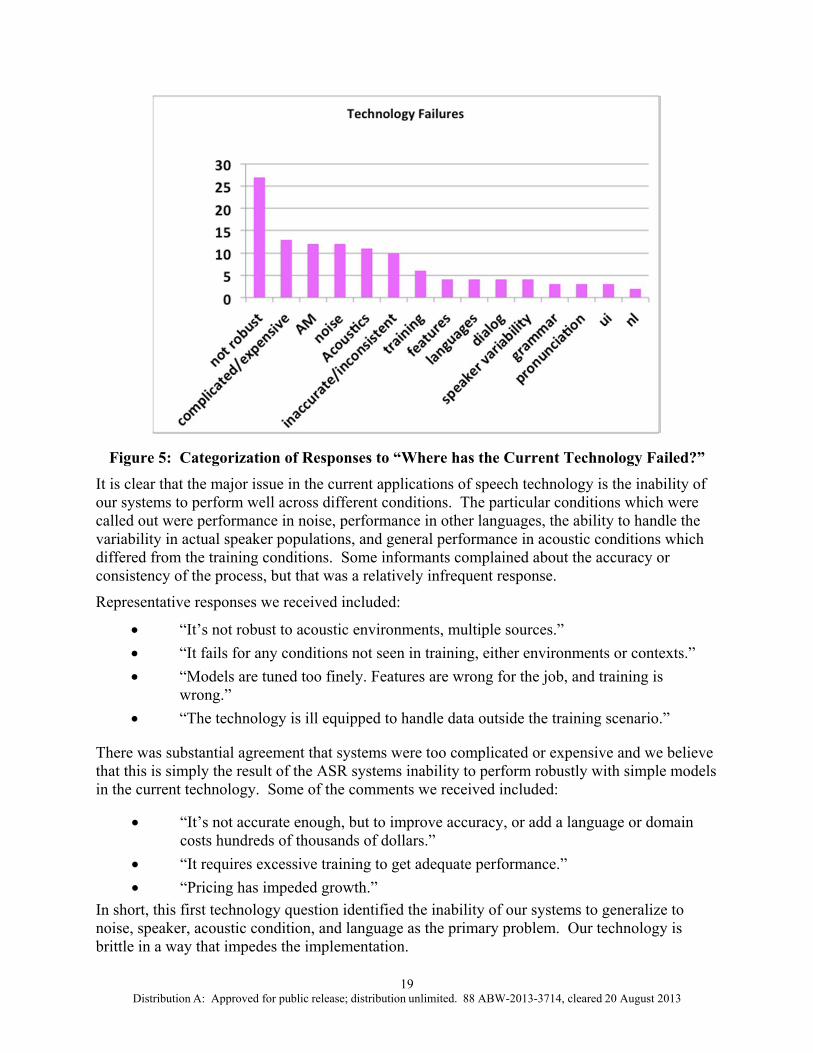
Figure 5 shows the identification of technology failures. Many of our informants identified the lack of robustness as a primary source of failure. One of the most frequent responses was identifying the particular characteristic of speech or language that caused this lack of robustness, such as noise, the acoustic mismatch between test and training, and variability in the speaker population. The second most frequent response was that the technology was too complicated to use or too expensive to implement. They often cited that in order to get an application to be usable, particularly a natural dialog application, there had to be an inordinate amount of tuning or tinkering to get it to work. They cited that the amount of work that had to be done increased the cost of the application. This, too, can be seen as a failure of manageable systems to deliver robust performance in practice.
19 Distribution A: Approved for public release; distribution unlimited. 88 ABW-2013-3714, cleared 20 August 2013
Figure 5: Categorization of Responses to “Where has the Current Technology Failed?” It is clear that the major issue in the current applications of speech technology is the inability of our systems to perform well across different conditions. The particular conditions which were called out were performance in noise, performance in other languages, the ability to handle the variability in actual speaker populations, and general performance in acoustic conditions which differed from the training conditions. Some informants complained about the accuracy or consistency of the process, but that was a relatively infrequent response.
Representative responses we received included:
“It’s not robust to acoustic environments, multiple sources.” “It fails for any conditions not seen in training, either environments or contexts.” “Models are tuned too finely. Features are wrong for the job, and training is
wrong.” “The technology is ill equipped to handle data outside the training scenario.”
There was substantial agreement that systems were too complicated or expensive and we believe that this is simply the result of the ASR systems inability to perform robustly with simple models in the current technology. Some of the comments we received included:
“It’s not accurate enough, but to improve accuracy, or add a language or domain costs hundreds of thousands of dollars.”
“It requires excessive training to get adequate performance.” “Pricing has impeded growth.”
In short, this first technology question identified the inability of our systems to generalize to noise, speaker, acoustic condition, and language as the primary problem. Our technology is brittle in a way that impedes the implementation.

20 Distribution A: Approved for public release; distribution unlimited. 88 ABW-2013-3714, cleared 20 August 2013
4.2.2. Question 3: What do you Think is Broken?
This technology question was an attempt to elicit the specific cause of the technology failures noted in the previous question. While we were hoping for specific indications of technical areas that were not performing well, the question allowed for broad assessment of the problems in the ASR technology.
As seen in Figure 6, there was not a consensus on what part of the technology was failing to deliver. The language model and the acoustic models were identified most frequently, but that was to be expected as, these are two of the basic building blocks of any speech recognition system. The features (or the signal processing system) followed more general complaints of lack of robustness and systems being too complicated. Less frequently cited, but still with substantial comments, were problems with adaptation and pronunciation. These were followed by more global issues of technology environmental awareness, system integration, small data, and the lack of funding for research.
Figure 6: Categorized Responses to Question - “What is Broken.”
Some of the comments we received included the following:
“Acoustic models don't communicate well with language models.” “We are using old models with new computational abilities, the systems are non-
robust.” “Most signal processing development was done in the 80's with close mike, and not
using the devices we use today. There are no new models. HMMs and Cepstral analysis are still here.”
“The core isn't robust, and it doesn't do a good job of modeling human conversation. It assumes regimented turn-taking.”
“The core engines aren't robust, so we tweak as many parameters as we can, but the caller is an unwilling participant.”
What is Broken?
0 5
10 15 20 25 30 35 40
lm and NL
am
not robust
too complicated
features
adaptaon
pronuncia
on
env awareness
integraon
data
funding UI
21 Distribution A: Approved for public release; distribution unlimited. 88 ABW-2013-3714, cleared 20 August 2013
Far down the list was the problem of matching the user interface to the technological capabilities of the technology. However, while not cited frequently as one of the top two core issues with speech, this issue was another recurrent theme throughout the interview process. It was oft noted that the industry (researchers, vendors, press, analysts, etc.) has oversold the capabilities of speech. While not a technological problem, it is an underlying industry problem, which leads to less adoption, acceptance, and revenue generated from speech applications. This in turn drives the perception that speech is a less valuable area to invest in. The issue is that the industry has said that speech works well, which implies that it is easy to use. While some of the perceptual issues are caused by the deployment of speech applications that do not follow best practices in Voice User Interface (VUI) design, this is only one symptom of the larger issues we uncovered in this survey. Some responses we received included:
“Its capabilities have been oversold. There are misunderstood constraints and limitations. Speech is also used inappropriately.”
“It took too long to get to natural language as we have it today, but we have also over-marketed the capabilities.”
In short, the interviewees thought that everything was broken. Every major subsystem of the current ASR technology was identified. Not a single informant told us that his or her applications were successfully served by the current technology
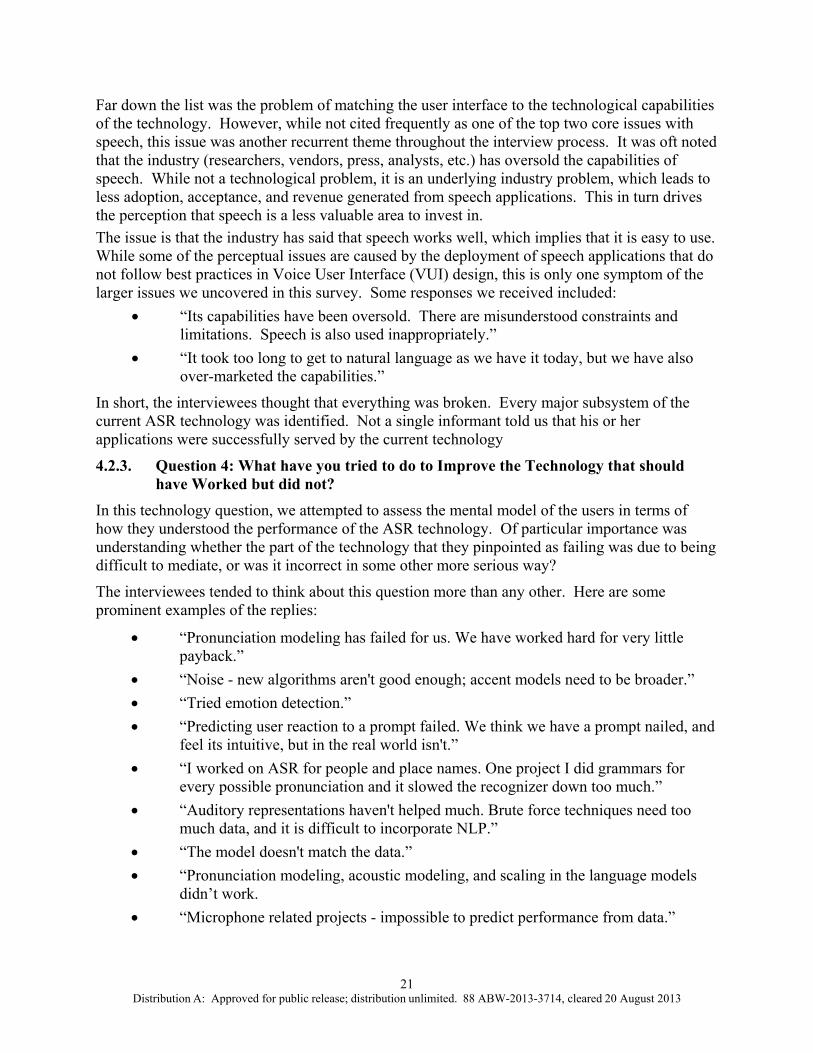
4.2.3. Question 4: What have you tried to do to Improve the Technology that should have Worked but did not?
In this technology question, we attempted to assess the mental model of the users in terms of how they understood the performance of the ASR technology. Of particular importance was understanding whether the part of the technology that they pinpointed as failing was due to being difficult to mediate, or was it incorrect in some other more serious way?
The interviewees tended to think about this question more than any other. Here are some prominent examples of the replies:
“Pronunciation modeling has failed for us. We have worked hard for very little payback.”
“Noise - new algorithms aren't good enough; accent models need to be broader.” “Tried emotion detection.” “Predicting user reaction to a prompt failed. We think we have a prompt nailed, and
feel its intuitive, but in the real world isn't.” “I worked on ASR for people and place names. One project I did grammars for
every possible pronunciation and it slowed the recognizer down too much.” “Auditory representations haven't helped much. Brute force techniques need too
much data, and it is difficult to incorporate NLP.” “The model doesn't match the data.” “Pronunciation modeling, acoustic modeling, and scaling in the language models
didn’t work. “Microphone related projects - impossible to predict performance from data.”

22 Distribution A: Approved for public release; distribution unlimited. 88 ABW-2013-3714, cleared 20 August 2013
“I tried to model different parts of the sentence differently. For example, we gave information at the beginning and content at the end, with the verb as the pivot point. But it didn't improve anything. “
“I tried to model non-linear acoustics.” “We tried to get more data from our domains to get different accents. After
hundreds of hours of data, there was very little improvement at all.”
Figure 7 shows the categories of what interviewees tried to fix in speech that should have worked but did not. The answers were reasonably in agreement. While “fixing” training or adaptation or features were standard portions of the ASR systems, it is striking that every respondent who tried to adjust pronunciation failed to make his or her systems better. Attempts to enhance performance with emotions or more sophisticated grammars generally failed as well, as did attempts to make the systems more complicated by redesign. While some people have had success using posterior probabilities rather than feature measurements in the process, the success was not universal. Major improvements through adaptation were done several decades ago in the form of Vocal Tract Length Normalization (VTLN) or MLLR, and these early successes have not been generally extended.
Figure 7: Categorization of Unsuccessful Attempts to Fix the Technology
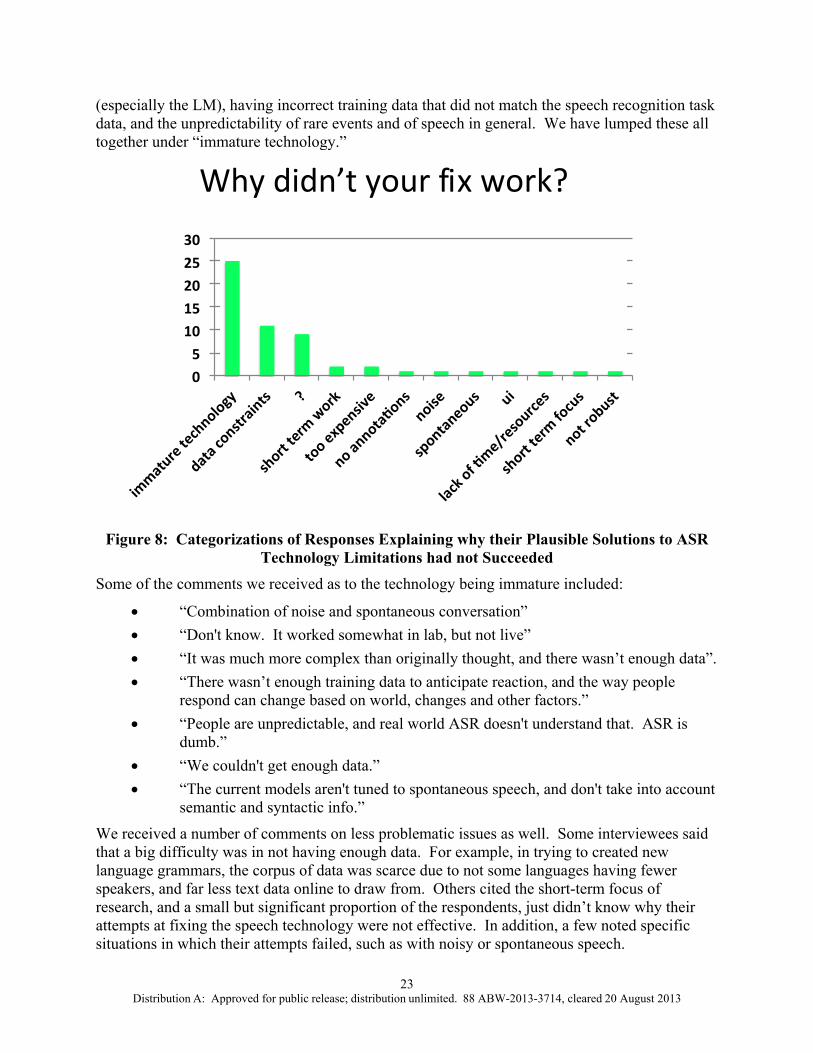
4.2.4. Question 5: Why didn’t your Fix Work?
The question of why did it fail was meant to elicit the reasons for the lack of success cited in the previous question. Again, answers were mixed between specific technical issues that were attempted and more general comments about the speech recognition technology itself.
Figure 8 shows the answers given for “Why didn’t your fix work?” Respondents were generally in agreement that the technology was not mature. Several of them said this directly, while many others complained about the lack of standardization, the immaturity of the particular models
What didn’t fix what was broken?
0 2 4 6 8
10 12 14 16 18 20
training
redesign
pronuncia
on
adapta
on
features
grammar
emoons
posteriors
search
separa
on
23 Distribution A: Approved for public release; distribution unlimited. 88 ABW-2013-3714, cleared 20 August 2013
(especially the LM), having incorrect training data that did not match the speech recognition task data, and the unpredictability of rare events and of speech in general. We have lumped these all together under “immature technology.”
Figure 8: Categorizations of Responses Explaining why their Plausible Solutions to ASR
Technology Limitations had not Succeeded
Some of the comments we received as to the technology being immature included:
“Combination of noise and spontaneous conversation” “Don't know. It worked somewhat in lab, but not live” “It was much more complex than originally thought, and there wasn’t enough data”. “There wasn’t enough training data to anticipate reaction, and the way people
respond can change based on world, changes and other factors.” “People are unpredictable, and real world ASR doesn't understand that. ASR is
dumb.” “We couldn't get enough data.” “The current models aren't tuned to spontaneous speech, and don't take into account
semantic and syntactic info.”
We received a number of comments on less problematic issues as well. Some interviewees said that a big difficulty was in not having enough data. For example, in trying to created new language grammars, the corpus of data was scarce due to not some languages having fewer speakers, and far less text data online to draw from. Others cited the short-term focus of research, and a small but significant proportion of the respondents, just didn’t know why their attempts at fixing the speech technology were not effective. In addition, a few noted specific situations in which their attempts failed, such as with noisy or spontaneous speech.
Why didn’t your fix work?
0 5
10 15 20 25 30
immature technology
data
constraints
?
short term
work
too expensive
no annotaons
noise
spontaneous ui
lack
of me/resources
short term
focus
not robust
24 Distribution A: Approved for public release; distribution unlimited. 88 ABW-2013-3714, cleared 20 August 2013
4.2.5. Question 6: Have you solved any Speech Technology Problems that were not Published? If so, what?
The general answer to this question was “no” and there were two reasons for the no’s.
The first reason was that the respondent had done all of the work under government sponsorship or at an institution that made everything public. In this case, everything was essentially made available in some form, so there were no hidden solutions.
The second reason for saying no came from our corporate interviewees, who said they weren’t allowed to say because the results were either trade secrets or in patents that were pending.
There were a few random pointers to old work that would not be relevant to the current issues. For example, a few respondents spoke of integration issues, and a slightly larger number of people noted that their solutions were “simply” engineering solutions and not generally applicable to the larger technology.
In a few cases people told us of things that they had fixed, but didn’t publish because the projects ran out of funds, or it was in the course of other work that didn’t merit a separate research paper. Despite our hope that we would discover a hidden mine of essential but unshared technical gold, we were disappointed.
4.2.6. Summary of Responses to Technical Questions
Our interviewees believed that they were working with an emerging technology. In fact, there was a note of cynicism from many as they felt that the core recognition models were so old, that the technology had been an emerging technology for 30 years. It was described as immature in essentially all of the technical aspects of recognition. While there was minor dissatisfaction with recognition performance per se, the major complaint was that the speech recognition systems that are deployed today are not robust to conditions other than the training conditions. They degrade rapidly and not gracefully in noise, for novel speakers, in far-field or other unusual acoustic conditions, in accented speech, and for speech in which other signals or noises share the acoustic channel.
Our respondents identified essentially every element of the current ASR technology as the focus of experiments to attempt to improve the technology. Failures were abundant, and performance continues to lag that of people in similar situations.
4.2.7. Perspectives from Earlier Surveys of Speech Recognition
In the past two decades, there have been six surveys of speech and language technology that attempted to report the state of the art; the latest of which was published in the Institute of Electrical and Electronics Engineers (IEEE) Signal Processing Journal in 2012. We attempt here to summarize the major findings of these surveys, and to assess whether our industry poll was consistent with the findings of the literature surveys. We begin with the perspective from the NIST ASR testing history (referred to as Speech-To-Text STT)).
NIST has been the arm of the government which oversees the DARPA speech recognition programs. They have tracked many different systems over their lifetime, and publish a Test History benchmark occasionally. The most recent is from May, 2009.
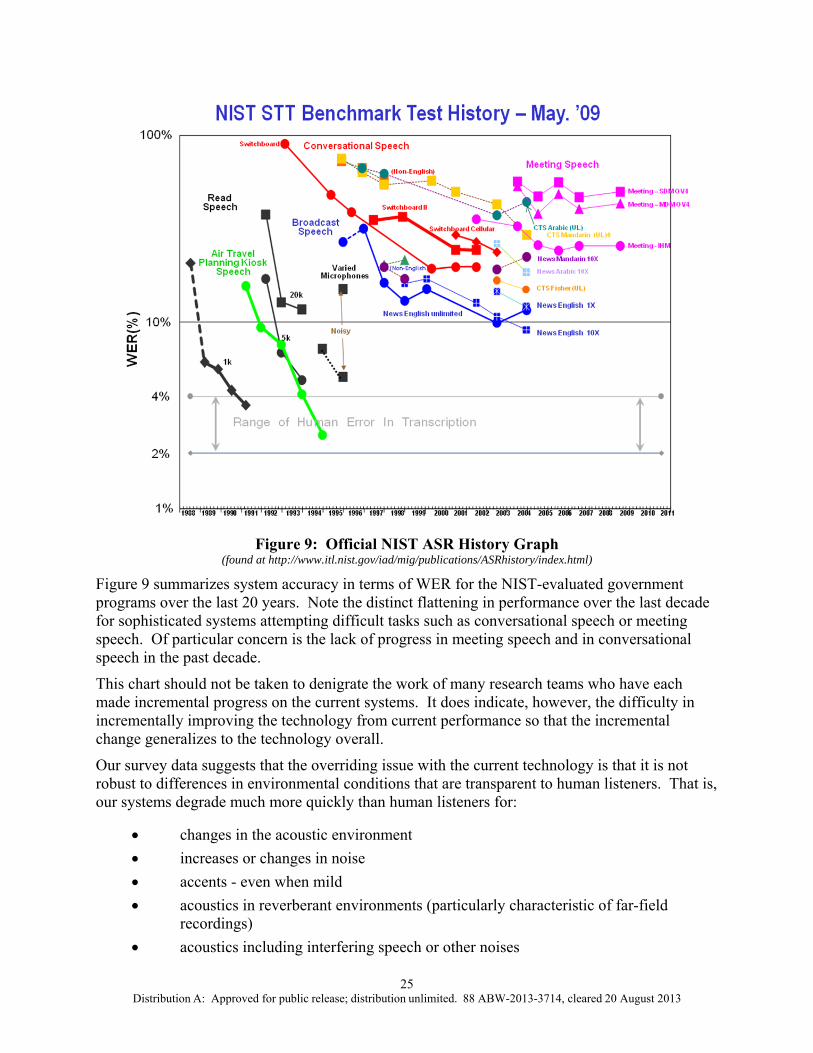
25 Distribution A: Approved for public release; distribution unlimited. 88 ABW-2013-3714, cleared 20 August 2013
Figure 9: Official NIST ASR History Graph
(found at http://www.itl.nist.gov/iad/mig/publications/ASRhistory/index.html)
Figure 9 summarizes system accuracy in terms of WER for the NIST-evaluated government programs over the last 20 years. Note the distinct flattening in performance over the last decade for sophisticated systems attempting difficult tasks such as conversational speech or meeting speech. Of particular concern is the lack of progress in meeting speech and in conversational speech in the past decade.
This chart should not be taken to denigrate the work of many research teams who have each made incremental progress on the current systems. It does indicate, however, the difficulty in incrementally improving the technology from current performance so that the incremental change generalizes to the technology overall.
Our survey data suggests that the overriding issue with the current technology is that it is not robust to differences in environmental conditions that are transparent to human listeners. That is, our systems degrade much more quickly than human listeners for:
changes in the acoustic environment increases or changes in noise accents - even when mild acoustics in reverberant environments (particularly characteristic of far-field
recordings) acoustics including interfering speech or other noises
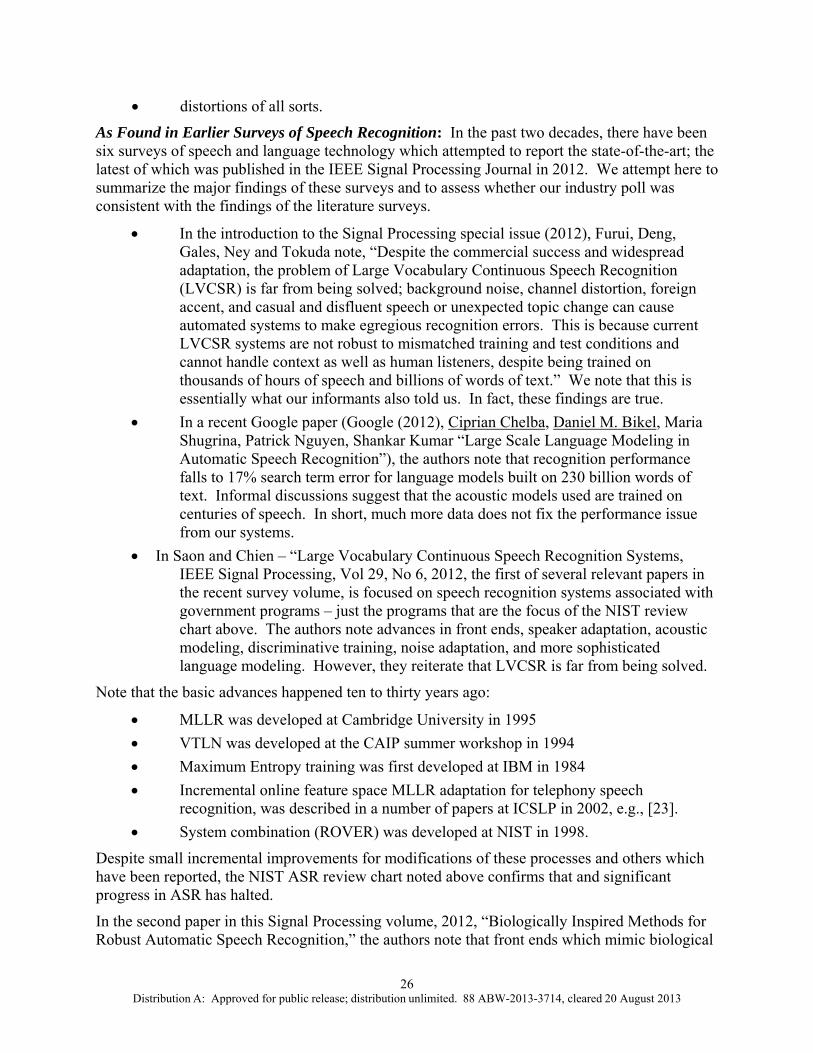
26 Distribution A: Approved for public release; distribution unlimited. 88 ABW-2013-3714, cleared 20 August 2013
distortions of all sorts.
As Found in Earlier Surveys of Speech Recognition: In the past two decades, there have been six surveys of speech and language technology which attempted to report the state-of-the-art; the latest of which was published in the IEEE Signal Processing Journal in 2012. We attempt here to summarize the major findings of these surveys and to assess whether our industry poll was consistent with the findings of the literature surveys.
In the introduction to the Signal Processing special issue (2012), Furui, Deng, Gales, Ney and Tokuda note, “Despite the commercial success and widespread adaptation, the problem of Large Vocabulary Continuous Speech Recognition (LVCSR) is far from being solved; background noise, channel distortion, foreign accent, and casual and disfluent speech or unexpected topic change can cause automated systems to make egregious recognition errors. This is because current LVCSR systems are not robust to mismatched training and test conditions and cannot handle context as well as human listeners, despite being trained on thousands of hours of speech and billions of words of text.” We note that this is essentially what our informants also told us. In fact, these findings are true.
In a recent Google paper (Google (2012), Ciprian Chelba, Daniel M. Bikel, Maria Shugrina, Patrick Nguyen, Shankar Kumar “Large Scale Language Modeling in Automatic Speech Recognition”), the authors note that recognition performance falls to 17% search term error for language models built on 230 billion words of text. Informal discussions suggest that the acoustic models used are trained on centuries of speech. In short, much more data does not fix the performance issue from our systems.
In Saon and Chien – “Large Vocabulary Continuous Speech Recognition Systems, IEEE Signal Processing, Vol 29, No 6, 2012, the first of several relevant papers in the recent survey volume, is focused on speech recognition systems associated with government programs – just the programs that are the focus of the NIST review chart above. The authors note advances in front ends, speaker adaptation, acoustic modeling, discriminative training, noise adaptation, and more sophisticated language modeling. However, they reiterate that LVCSR is far from being solved.
Note that the basic advances happened ten to thirty years ago:
MLLR was developed at Cambridge University in 1995 VTLN was developed at the CAIP summer workshop in 1994 Maximum Entropy training was first developed at IBM in 1984 Incremental online feature space MLLR adaptation for telephony speech
recognition, was described in a number of papers at ICSLP in 2002, e.g., [23]. System combination (ROVER) was developed at NIST in 1998.
Despite small incremental improvements for modifications of these processes and others which have been reported, the NIST ASR review chart noted above confirms that and significant progress in ASR has halted.
In the second paper in this Signal Processing volume, 2012, “Biologically Inspired Methods for Robust Automatic Speech Recognition,” the authors note that front ends which mimic biological
27 Distribution A: Approved for public release; distribution unlimited. 88 ABW-2013-3714, cleared 20 August 2013
or psychoacoustic properties “have in many cases provided significant reductions in errors, and we are experiencing a resurgence in community interest.” They note RelAtive SpecTral Analysis (RASTA) and cepstral mean subtraction as proving significant improvement. RASTA was developed in 1991 (Hermansky, H., and Morgan, N. “RASTA processing of speech,” (IEEE Transactions on Speech and Audio Processing, Oct. 1994, p 578 - 589), and cepstral mean subtraction dates from 1981 (Furui, Cepstral Analysis Technique for Automatic Speaker Verification, IEEE Transactions on Acoustics, Speech and Signal Processing 29) (1981) 254–272. The authors do not report recent improvements, but rather report renewed interest in this area in hope of increasing the robustness of speech recognition systems.
The authors note that “While machines struggle to cope with even modest amounts of acoustic variability, human beings can recognize speech remarkably well in similar conditions: a solution to the difficult problem of environmental robustness does indeed exist. While a number of fundamental attributes of auditory processing remain poorly understood, there are many instances in which analysis of psychoacoustical or physiological data can inspire signal processing research” (page 36). It appears that the solution in practice remains elusive.
In the third paper of the Signal Processing Magazine review, 2012, (“Subword Modeling for Automatic Speech Recognition,” Livescu, Fosler-Lussier, and Metze), the authors recount experiments with an alternate to the standard phonetic representations. They, like our informants above, find a brittle system, when they say, “That speech recognition is worse for both conversational and hyper-clear speech suggest that the representation used in today’s recognizers may be flawed” (page 46). While recounting in detail a subword alternative, they do not find substantial performance increases using these methods.
In the fourth paper of the review, “Discriminative Training for Automatic Speech Recognition,” (Heigold, Ney, Schulter, and Weisler), the authors review many of the models for discriminative training of modern recognizers. The original HMM formulation, using ML training, can be shown to converge to an error minimum (in the presence of infinite training data) only in the case that the data were generated by the same geometry as the model. For speech recognition this most basic constraint does not hold, and discriminative training has been used since the ‘80s (One author was a member of the IBM speech recognition group at Yorktown in 1984, where an initial implementation of discriminative training was used to improve the performance of Tangora, the early 5000-word office dictation system). In this paper, the authors recount many heuristics, including Minimum Bayes Risk, and Margin Based Training, showing gains of 10-20 percent over ML systems. But these improvements are not new, and they do not improve the robust performance problem. In fact, the authors note that “it might be worth rethinking computing models and considering alternative architectures” (Page 68).
The fifth paper “Structured Discriminative Models for Speech Recognition”, (Gales, Watanabe, and Fosler-Lussier), discusses more sophisticated models for discriminative training. However, the authors do not offer performance measures, and they do note that “Though current state-of-the-art systems yield satisfactory recognition rates in some domains, performance is generally not good enough for speech applications to become ubiquitous” (Page 71).
The sixth paper, titled “Deep Neural Networks for Acoustic Modeling in Speech Recognition” (Hinton, et al) recounts the newest “big thing” in ASR is using many-layer nets, despite the fact that “Deep Neural Network (DNNs) with many hidden layers are hard to optimize.” The authors recount a large number of examples of speech recognition in which DNN systems perform better

28 Distribution A: Approved for public release; distribution unlimited. 88 ABW-2013-3714, cleared 20 August 2013
than “good” modern systems. The comparisons, while interesting, do not compare “best” modern systems with DNNs, and thus simply set the stage for more work. It does appear that DNN systems are efficient at training from limited data, but the heuristic nature of the solutions leaves the situation in doubt. In any case, these solutions do not solve the generalization problem.
In the last relevant paper of the Signal Processing review volume, “Making Machines Understand Us in Reverberant Rooms” (Yoshioka et al), the authors review many processes for dealing with reverberant speech. They note that dealing with the reverberation is better than simply adapting the current speech recognition systems, but “the problem of reverberant speech recognition leaves ample room for further research and development.” The authors note that this problem is a subpart of the far-field acoustics problem.
In summary, the latest substantive review of the state-of-the-art in speech recognition finds that the current technology is flawed. It may be used in some limited circumstances, but there is not a clear direction forward, except for “more work.” The systems we produce are tedious, complicated, and brittle.
Further relevant reviews:
In a two-part survey of the state of the art published in 2009, (Baker, J.; Li Deng; Glass, J.; Khudanpur, S.; Chin-hui Lee; Morgan, N.; O'Shaughnessy, D), "Developments and Directions in Speech Recognition and Understanding, Part 1 [DSP Education]," Signal Processing Magazine, IEEE, Vol.26, no.3, pp.75-80, May 2009), the authors offer a view of ASR technology not dissimilar to the 2012 view. The authors cite identical “advances”, most of which occurred a decade or more before the review. They note, “The most significant paradigm shift for speech-recognition progress has been the introduction of statistical methods, especially stochastic processing with HMMs in the early 1970s. More than 30 years later, this methodology still predominates. Statistical discriminative training techniques are typically based on utilizing Maximum Mutual Information (MMI) and the minimum-error model parameters. Adaptation is vital to accommodating a wide range of variable conditions for the channel, environment, speaker, vocabulary, topic domain, and so on.”
Despite all of this wonderful (if backward-looking) progress, the authors cite, “grand challenges” which remain. Of those, the first is dealing with everyday audio. They note, “This is a term that represents a wide range of speech, speaker, channel, and environmental conditions that people typically encounter and routinely adapt to in responding and recognizing speech signals. Currently, ASR systems deliver significantly degraded performance when they encounter audio signals that differ from the limited conditions under which they were originally developed and trained.” The authors further suggest challenges of self-adaptive language, rapid portability, detection of rare events, and others. These comments are consistent with those of our interviewees.
The view from across the ocean is the same. In “Survey of Russian Speech Recognition Systems Andrey L. Ronzhin, Rafael M. Yusupov, Izolda V. Li, Anastasia B. Leontieva SPECOM'2006, St. Petersburg, 25-29 June 2006,” the authors write “The interaction between a human and a computer, which is similar to the interaction between humans, is one of the most important and difficult problems of the artificial intelligence. Existing models of speech recognition yield to human speech capabilities yet; it evidences of their insufficient adequacy and limits the introduction of speech technologies in industry and everyday life.”

29 Distribution A: Approved for public release; distribution unlimited. 88 ABW-2013-3714, cleared 20 August 2013
In “Speech Recognition by Machine: A Review, by M.A.Anusuya, and S.K.Katti, (IJCSIS) International Journal of Computer Science and Information Security, Vol. 6, No. 3, 2009,” the authors note: “In most speech recognition tasks, human subjects produce one to two orders of magnitude less errors than machines. There is now increasing interest in finding ways to bridge such a performance gap. What we know about human speech processing is very limited.”
A remarkably modern review, “Large-Vocabulary Continuous Speech Recognition: Advances and Applications” (Jean-Luc Gauvain, Member, IEEE, and Lori Lamel, Member, IEEE Proceedings of the, Vol. 88, No. 8, August 2000) was written from a European perspective. The authors said, “Most of today’s state-of-the-art systems for transcription of broadcast data employ the techniques described in Section II, such as PLP features with cepstral mean and variance normalization, VTLN, unsupervised MLLR, decision tree state tying, and gender- and bandwidth-specific acoustic models. Over the past four years, tremendous progress has been made on transcription of broadcast data. State-of-the-art transcription systems achieve word error rates around 20% on unrestricted broadcast news data, with a word error of about 15% obtained on the recent NIST test sets. Despite the numerous advances made over the past decade, speech recognition is far from a solved problem, as evidenced by the large gap between machine and human performance. The performance difference is a factor of five to ten, depending upon the transcription task and test conditions.”
This analysis could have been written today – the basic observations still hold, and if anything the laboratory-measured error rates he cites are optimistic!
It is particularly sobering to read Richard Lippmann’s review of speech recognition from 1997. Speech Recognition by Machines and Humans (Richard P. Lippmann) Speech Communication 22, 1997, 1–15. He states “Error rates of machines are often more than an order of magnitude greater than those of humans for quiet, wideband, read speech. Machine performance degrades further below that of humans in noise, with channel variability, and for spontaneous speech.” This comment could be made today, although there are now a few situations where human performance is approximated in narrow domains (see below).
Other relevant documents are listed in Appendix C.
Commentary on the Literature Survey: As is obvious from these papers and articles, the serious deficit of current speech technology compared to human performance noted by Lippman in 1997 still remains the major finding of researchers today. While several techniques have been developed for more advanced features, adaptation, language model smoothing, and vocal tract length modeling, the rate of decrease of error rates has slowed to essentially zero over the past decade. Each review, and many of the papers citing better performance in particular circumstances, notes that our recognitions systems are not robust to noise, reverberation, different speakers, and accent, and they are too complicated to port easily to new circumstances or to new languages. In short, the speech recognition field has developed a collection of small-scale solutions to very constrained speech problems, and these solutions fail in the world at large. Their failure modes are acute but unpredictable and non-intuitive, thus leaving the technology defective in broad applications, and difficult to manage even in well behaved environments. In short, this technology is badly broken.
Thus, the literature reinforces the broad conclusions of the community survey, namely that the current technology is deficient in many ways that are not readily fixed by current methodologies. On the other hand, diagnostic methods such as those used in in-depth study reported earlier in

30 Distribution A: Approved for public release; distribution unlimited. 88 ABW-2013-3714, cleared 20 August 2013
this document may provide a guide to improvements beyond what the community has seen before.
31 Distribution A: Approved for public release; distribution unlimited. 88 ABW-2013-3714, cleared 20 August 2013
5.0 CONCLUSIONS
The state of speech recognition, as reported by our interviewees, is awaiting a transition from a difficult, immature technology to a robust, mature technical system4. Our interviewees identified every portion of the current technology as defective, and in turn identified those same areas as the focus of work that has failed to fix the major problems. The major issue seems to be the lack of robust performance, leading to system failures for acoustic and linguistic variabilities that do not bother human listeners. This failure makes system design difficult, as our systems break in unpredictable and unintuitive ways. A secondary problem is that these systems do not perform well for sophisticated tasks like spontaneous dictation, although that may be a problem with more than the non-robust performance problem.
The survey of practitioners of speech and language technology reported here finds that modern speech recognition systems are brittle, non-robust, and overly complex. The systems fail to generalize outside the domain of the training data, and within the training domain they fail for moderately complicated tasks such as meeting transcriptions.
Every aspect of the speech recognition technology has been exercised in an effort to make the performance better and more robust. Despite several decades of small incremental improvements in performance (nearly all of which occurred prior to the last decade) overall performance appears to have plateaued. A survey of the literature in speech recognition confirms the continuing inability of our systems to mimic human performance in the presence of noise, reverberation, different dialects, different languages, and other variations which are part of the everyday environment.
In the past decade, we have greatly increased the size of our research datasets, the number of free parameters in our models, and the amount of computation available for both training and testing of our systems. While we have been able to improve performance along many dimensions, the final result is much the same as those of a decade ago.
For the specific issue of the acoustic model, by exploiting the method of resampling, we constructed a series of pseudo datasets from NF and FF meeting room datasets. The most artificial of these satisfied the HMM model assumptions, while at the other extreme, the resampled data deviated from the model in the way real data did. Using these datasets, we probed the standard HMM/GMM framework for ASR. Our results showed that when the conditions are matched (even if they are FF), the model errors (i.e., errors due the incorrect assumption of conditional independence) dominate; however, in mismatched conditions, the standard ASR features computed from FF data are neither invariant nor separable with NF models, and contribute significantly to the total errors; these basic conclusions are illustrated in Figures 10 and 11. We then studied unsupervised MLLR adaptation and MPE training as the means to compensate for this issue in the model space; while these approaches mitigate the errors somewhat, the conclusions about the lack of invariance of the MFCC features in varying acoustic conditions still holds true. Finally, we also used discriminatively trained MLPs to transform the MFCCs, and these too failed to alter the conclusion about MFCCs. On the contrary, the highly discriminant MLP training actually worsened performance for all the experiments under the mismatched condition.
4 As one of us has noted in a recent presentation, one can be old and still be immature.
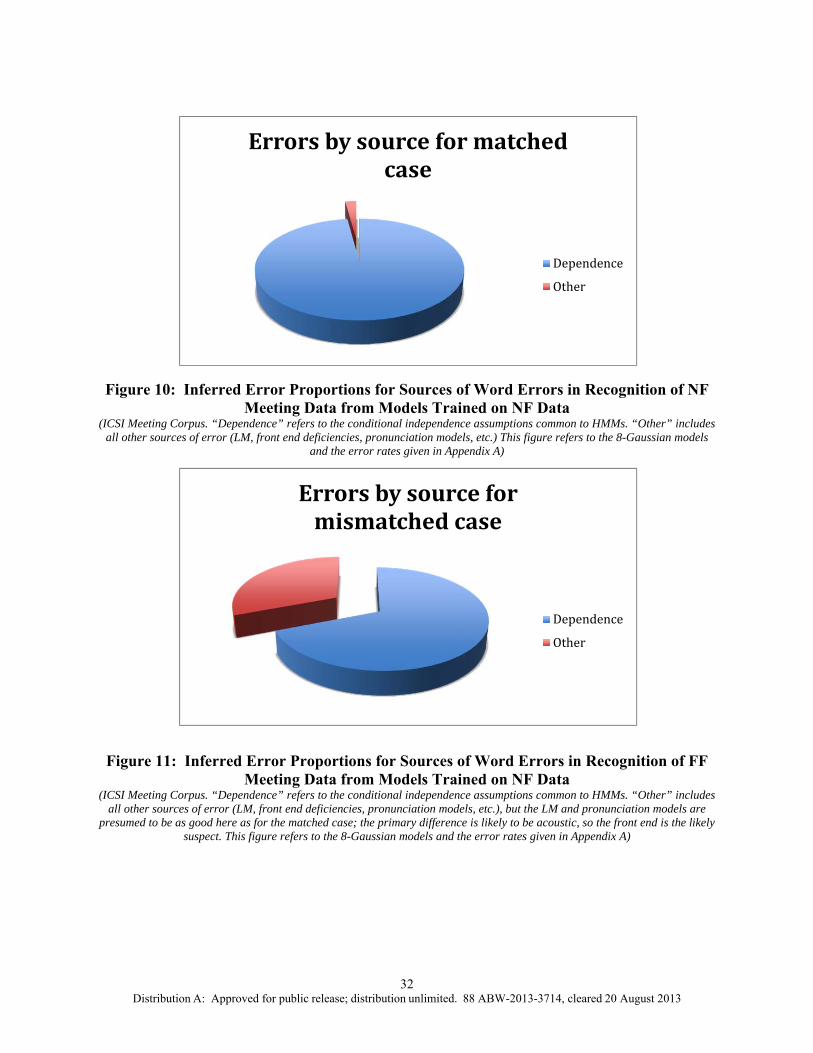
32 Distribution A: Approved for public release; distribution unlimited. 88 ABW-2013-3714, cleared 20 August 2013
Figure 10: Inferred Error Proportions for Sources of Word Errors in Recognition of NF Meeting Data from Models Trained on NF Data
(ICSI Meeting Corpus. “Dependence” refers to the conditional independence assumptions common to HMMs. “Other” includes all other sources of error (LM, front end deficiencies, pronunciation models, etc.) This figure refers to the 8-Gaussian models
and the error rates given in Appendix A)
Figure 11: Inferred Error Proportions for Sources of Word Errors in Recognition of FF Meeting Data from Models Trained on NF Data
(ICSI Meeting Corpus. “Dependence” refers to the conditional independence assumptions common to HMMs. “Other” includes all other sources of error (LM, front end deficiencies, pronunciation models, etc.), but the LM and pronunciation models are
presumed to be as good here as for the matched case; the primary difference is likely to be acoustic, so the front end is the likely suspect. This figure refers to the 8-Gaussian models and the error rates given in Appendix A)
Errorsbysourceformatchedcase
Dependence
Other
Errorsbysourceformismatchedcase
Dependence
Other

33 Distribution A: Approved for public release; distribution unlimited. 88 ABW-2013-3714, cleared 20 August 2013
6.0 RECOMMENDATIONS
6.1 Make Use of Diagnostic Analysis to Drive Development of Remedies
It has been suspected for some time that, for instance, the inaccuracy of the standard conditional independence assumption in the acoustic model is a key reason for the high error rates in fluent speech recognition; further, it has been largely assumed that the lack of invariance of ASR signal processing to variability in acoustic conditions is also a significant source of errors. Our study has confirmed both of these points. However, there is potential for much greater gain than “simply” confirming our preconceptions. As researchers propose potential remedies, there is now a method for analyzing the effects of their proposed methods with greater specificity and utility than simply seeing if the word error rate went down. For instance, while segment models and episodic approaches both might be able to better handle local statistical dependence, the details probably matter – and using methods such as those that we developed here could be useful in a host of decisions made in the development of alternative methods.
6.2 Extend Diagnostic Analysis to Other Components
We have shown that the independence assumption in acoustic modeling, particularly for frames within a state, is a significant remaining problem, even under matched acoustic conditions. Is there a related problem with other components, such as the language model? Much as with the acoustic model, attempts to transcend the limitations of the simple n-gram have yielded only incremental improvements. It is likely that moving beyond this point will not be possible without effective diagnostics, ones that are more specific than word error rate (or certainly more effective than perplexity).
6.3 Update the Model
This would be an opportune time to reconsider the decades-old HMM formulation, and search for models that better capture speech and language characteristics. We should enlist the help of theorists (such as those who will be associated with the new Simons Center for Theoretical Computer Science at Berkeley) to derive a better model. Whoever studies the problem should have a particular focus on the case of mismatch between training and test data, i.e., on generalization.
6.4 Seek Low Dimensional Parameters to Characterize Speech Variability
Many phenomena arise from complex interactions between many components; the production and perception of speech by the human brain is an example of such phenomena. Consequently, it may be the case that the recognition of speech is and must be complicated. On the other hand, some of the cases of significant progress in ASR (e.g., VTLN, RASTA, cepstral mean subtraction) are surprisingly simple. Consequently, it would be worthwhile to seek to develop systems that automatically account for predictable variations from the training data without specific training for that condition, where the obvious conditions one would like to compensate for are FF acoustics, additive noise, speakers with light accents or dialects, and informal spontaneous speech.
6.5 Study the Brain
There is an existing significant example of speech recognition that actually works well in many adverse conditions, namely, the recognition performed by the human ear and brain. Methods for analyzing functional brain activity have become more sophisticated in recent years, so there are
34 Distribution A: Approved for public release; distribution unlimited. 88 ABW-2013-3714, cleared 20 August 2013
new opportunities for the development of models that better track the desirable properties of human speech perception. While many such methods have been tried before and have provided, at best, limited improvements, recent improvements in basic brain scan technology (e.g., “eCog”, which collects data directly from the surface of the human cortex) provides an opportunity to significantly limit the vast search space of all possible ASR approaches. In particular, this field of knowledge should be mined to assist in the design of new acoustic front ends that would be more invariant to signal variability that is independent of the linguistic content.
6.6 Beyond ASR
The “in-depth” study described in this report was focused specifically on speech recognition. That being said, since the use of HMMs has spread far beyond speech processing, there are many fields of inquiry that are also limited by the limitations of these models. One application of the methods described here to many other fields, e.g. speech synthesis, machine translation, part of speech tagging, bioinformatics (e.g., DNA sequencing, gene prediction), protein folding, and time series analysis.
More generally speaking, HMMs are a staple of machine learning as applied to many tasks requiring the decoding of sequences, and there are likely improvements that could be found in many areas given improved diagnostic methodology. In speech recognition research, very little diagnostic analysis has ever been undertaken, and we would argue that as a result progress in the field has proceeded largely by trial and error and it has been susceptible to fads (success of an interesting technique in a very different field leads to "trying it out" in speech recognition: wavelets, compressed sensing, deep learning, etc.). In the more general field of machine learning, very little effort has been expended on understanding how algorithms fail when applied to real world problems outside the laboratory. We anticipate that encouraging more of a diagnostic spirit for machine learning research could have very broad effects, much as the introduction of HMMs to this field did earlier.

35 Distribution A: Approved for public release; distribution unlimited. 88 ABW-2013-3714, cleared 20 August 2013
7.0 REFERENCES
[1] B. Efron, “Bootstrap Methods: Another Look at the Jackknife,” Annals of Statistics, Vol. 7, No. 1, pp. 1–26, 1979.
[2] N. Morgan, Q. Zhu, A. Stolcke, K. Sonmez, S. Sivadas, T. Shinozaki, M. Ostendorf, P. Jain, H. Hermansky, D. Gelbart, D. Ellis, G. Doddington, B. Chen, B., O. Cetin, H. Bourlard, and M. Athineos, “Pushing the envelope aside: Beyond the spectral envelope as the fundamental N for speech recognition,” Signal Processing Magazine, IEEE, Vol. 22, No. 5, pp. 81 –88, 2005.
[3] E. Eide, H. Gish, P. Jeanrenaud, and A. Mielke, “Understanding and Improving Speech Recognition Performance through the Use of Diagnostic Tools,” in Proc. ICASSP, 1995.
[4] L. Chase, Error-Responsive Feedback Mechanisms for Speech Recognizers, Ph.D. thesis, Robotics Institute, Carnegie Mellon University, Pittsburgh, PA, April 1997.
[5] G. Saon and J.-T. Chien, “Large-Vocabulary Continuous Speech Recognition Systems: A Look at some Recent Advances,” Signal Processing Magazine, IEEE, Vol. 29, No. 6, pp. 18 –33, Nov. 2012.
[6] G. Heigold, H. Ney, R. Schluter, and S. Wiesler, “Discriminative Training for Automatic Speech Recognition: Modeling, Criteria, Optimization, Implementation, and Performance,” Signal Processing Magazine, IEEE, Vol. 29, No. 6, pp. 58 –69, Nov. 2012.
[7] M. Gales, S.Watanabe, and E. Fosler-Lussier, “Structured Discriminative Models for Speech Recognition: An Overview,” Signal Processing Magazine, IEEE, vol. 29, no. 6, pp. 70 –81, Nov. 2012.
[8] T. Yoshioka, A. Sehr, M. Delcroix, K. Kinoshita, R. Maas, T. Nakatani, and W. Kellermann, “Making Machines Understand us in Reverberant Rooms: Robustness against Reverberation for Automatic Speech Recognition,” Signal Processing Magazine, IEEE, Vol. 29, No. 6, pp. 114 –126, Nov. 2012.
[9] R.M. Stern and N. Morgan, “Hearing is Believing: Biologically Inspired Methods for Robust Automatic Speech Recognition,” Signal Processing Magazine, IEEE, Vol. 29, No. 6, pp. 34 –43, Nov. 2012.
[10] S. Wegmann and L. Gillick, “Why has (Reasonably Accurate) Automatic Speech Recognition been so Hard to Achieve?” arXiv:1003.0206 [cs.CL], 2010.
[11] D. Gillick, L. Gillick, and S. Wegmann, “Don’t Multiply Lightly: Quantifying Problems with the Acoustic Model Assumptions in Speech Recognition,” in Proceedings of ASRU. 2011, pp. 71–76, IEEE.
[12] A. Janin, D. Baron, J. Edwards, D. Ellis, D. Gelbart, N. Morgan, B. Peskin, T. Pfau, E. Shriberg, A. Stolcke, and C. Wooters, “The ICSI Meeting Corpus,” in Proceedings of International Conference on Acoustics, Speech, and Signal Processing, 2003.
[13] A. Stolcke, X. Anguera, K. Boakye, O. Cetin, A. Janin, M. Magimai-Doss, C. Wooters, and J. Zheng, “The SRI-ICSISpring 2007 Meeting and Lecture Recognition System,” in Proceedings of the Second International Workshop on Classification of Events, Activities, and Relationships (CLEAR 2007) and the Fifth Rich Transcription 2007 Meeting Recognition (RT 2007), 2007.
[14] “Rt-2002 Evaluation Plan,”http://www.itl.nist.gov/iad/mig/tests/rt/2002/docs/rt02 eval plan
36 Distribution A: Approved for public release; distribution unlimited. 88 ABW-2013-3714, cleared 20 August 2013
v3.pdf
[15] “Rt-04s Evaluation Data Documentation,” http://www.itl.nist.gov/iad/mig/tests/rt/2004-spring/eval/docs.html
[16] “Rich Transcription Spring 2005 Evaluation,” http://www.itl.nist.gov/iad/mig/tests/rt/2005-spring/index.html
[17] Dan Ellis, “Skewview Tool,” http://labrosa.ee.columbia.edu/projects/skewview/
[18] “ICSI Meeting Alignments,” http://www1.icsi.berkeley.edu/_shuoyiin/research/meetingskew/chanskew.html
[19] S.J. Young, G. Evermann, MJF Gales, D. Kershaw, G. Moore, JJ Odell, DG Ollason, D. Povey, V. Valtchev, and PC Woodland, The HTK Book Version 3.4, 2006.
[20] O. Cetin and A. Stolcke, “Language Modeling in the ICSI-SRI Spring 2005 Meeting Speech Recognition Evaluation System,” Tech. Rep., International Computer Science Institute, 2005.
[21] C. J. Leggetter and P. C. Woodland, “Maximum Likelihood Linear Regression for Speaker Adaptation of Continuous Density Hidden Markov Models,” Comput. Speech. Lang., no. 9, 1995.
[22] J. Faugier and M. Sargeant, “Sampling Hard to Reach Populations,” http://www.soc.washington.edu/users/brines/hardsampling.pdf
[23] Y. Li, H. Erdogan, Y. Gao, and E. Marcheret, “Incremental On-Line Feature Space MLLR Adaptation for Telephony Speech Recognition,” International Conference on Spoken Language Processing, Denver, September 2002, pp. 1417-1420.
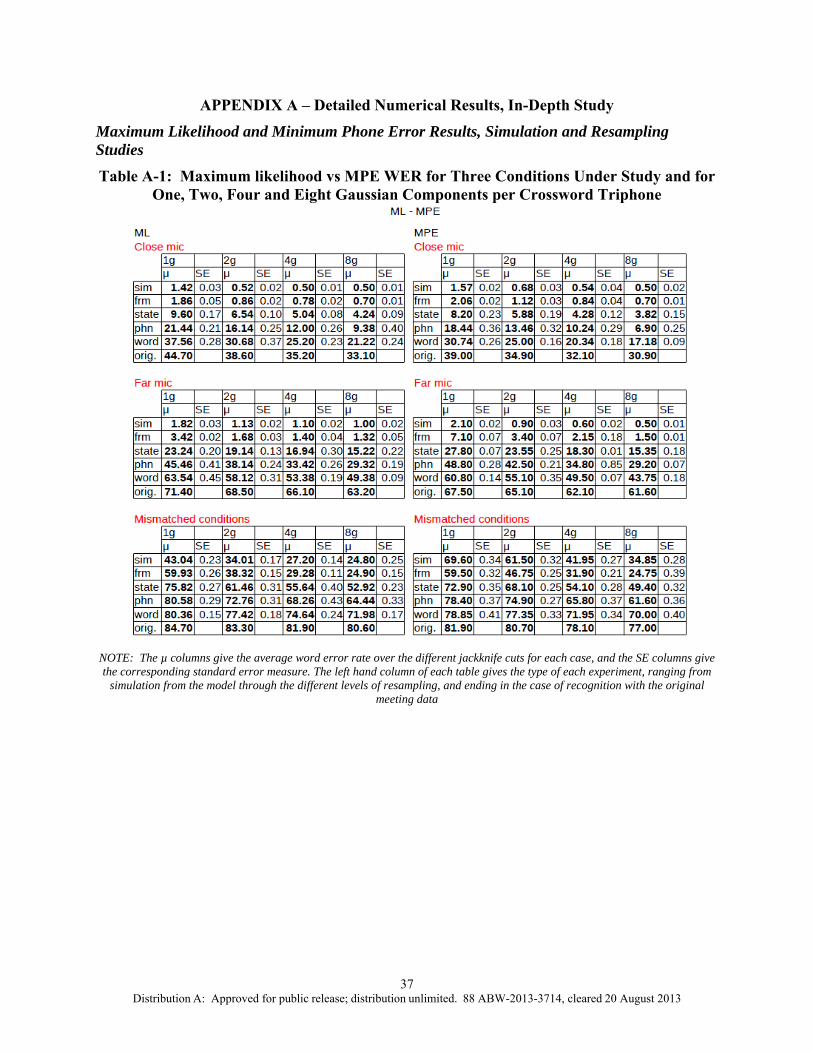
37 Distribution A: Approved for public release; distribution unlimited. 88 ABW-2013-3714, cleared 20 August 2013
APPENDIX A – Detailed Numerical Results, In-Depth Study
Maximum Likelihood and Minimum Phone Error Results, Simulation and Resampling Studies
Table A-1: Maximum likelihood vs MPE WER for Three Conditions Under Study and for One, Two, Four and Eight Gaussian Components per Crossword Triphone
NOTE: The µ columns give the average word error rate over the different jackknife cuts for each case, and the SE columns give the corresponding standard error measure. The left hand column of each table gives the type of each experiment, ranging from
simulation from the model through the different levels of resampling, and ending in the case of recognition with the original meeting data
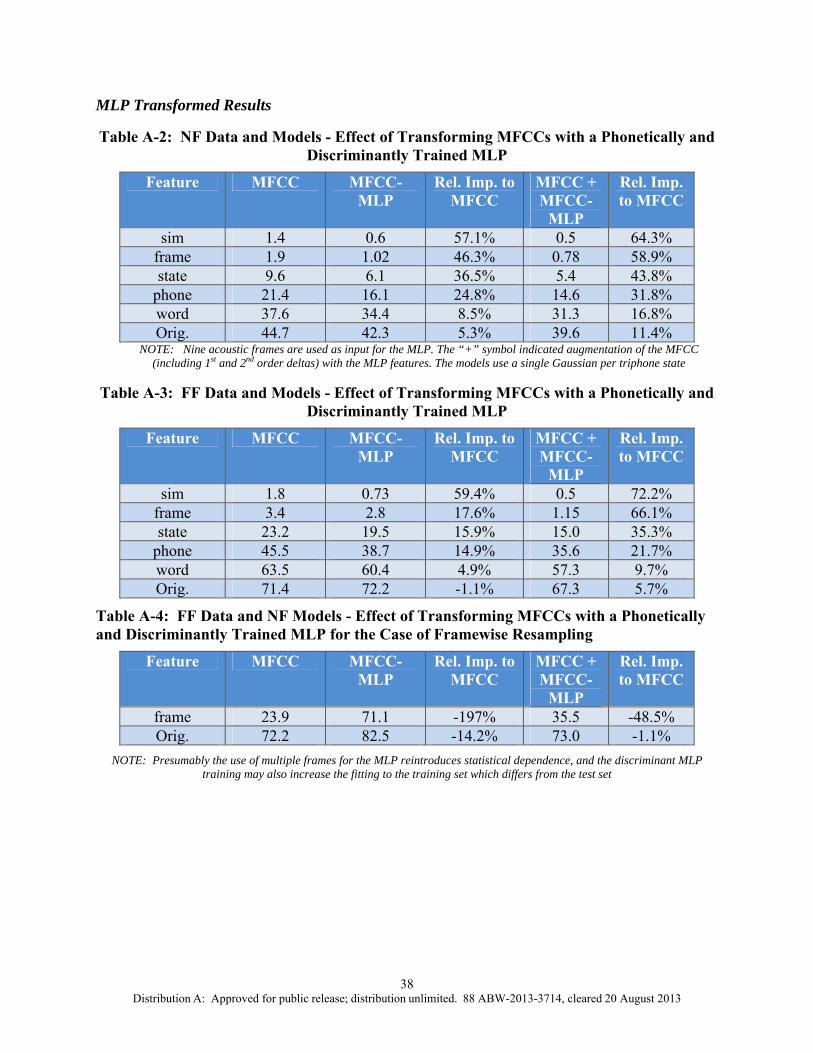
38 Distribution A: Approved for public release; distribution unlimited. 88 ABW-2013-3714, cleared 20 August 2013
MLP Transformed Results
Table A-2: NF Data and Models - Effect of Transforming MFCCs with a Phonetically and Discriminantly Trained MLP
Feature MFCC MFCC-MLP
Rel. Imp. to MFCC
MFCC + MFCC-
MLP
Rel. Imp. to MFCC
sim 1.4 0.6 57.1% 0.5 64.3% frame 1.9 1.02 46.3% 0.78 58.9% state 9.6 6.1 36.5% 5.4 43.8%
phone 21.4 16.1 24.8% 14.6 31.8% word 37.6 34.4 8.5% 31.3 16.8% Orig. 44.7 42.3 5.3% 39.6 11.4%
NOTE: Nine acoustic frames are used as input for the MLP. The “+” symbol indicated augmentation of the MFCC (including 1st and 2nd order deltas) with the MLP features. The models use a single Gaussian per triphone state
Table A-3: FF Data and Models - Effect of Transforming MFCCs with a Phonetically and Discriminantly Trained MLP
Feature MFCC MFCC-MLP
Rel. Imp. to MFCC
MFCC + MFCC-
MLP
Rel. Imp. to MFCC
sim 1.8 0.73 59.4% 0.5 72.2% frame 3.4 2.8 17.6% 1.15 66.1% state 23.2 19.5 15.9% 15.0 35.3%
phone 45.5 38.7 14.9% 35.6 21.7% word 63.5 60.4 4.9% 57.3 9.7% Orig. 71.4 72.2 -1.1% 67.3 5.7%
Table A-4: FF Data and NF Models - Effect of Transforming MFCCs with a Phonetically and Discriminantly Trained MLP for the Case of Framewise Resampling
Feature MFCC MFCC-MLP
Rel. Imp. to MFCC
MFCC + MFCC-
MLP
Rel. Imp. to MFCC
frame 23.9 71.1 -197% 35.5 -48.5% Orig. 72.2 82.5 -14.2% 73.0 -1.1%
NOTE: Presumably the use of multiple frames for the MLP reintroduces statistical dependence, and the discriminant MLP training may also increase the fitting to the training set which differs from the test set
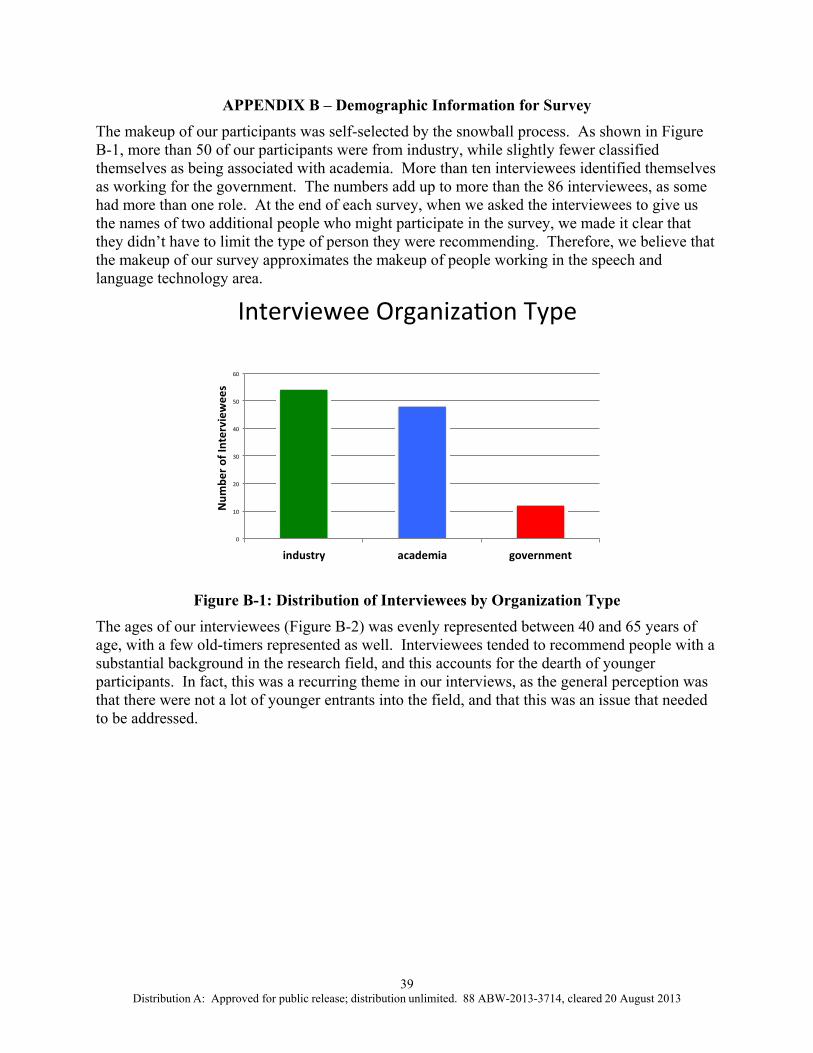
39 Distribution A: Approved for public release; distribution unlimited. 88 ABW-2013-3714, cleared 20 August 2013
APPENDIX B – Demographic Information for Survey
The makeup of our participants was self-selected by the snowball process. As shown in Figure B-1, more than 50 of our participants were from industry, while slightly fewer classified themselves as being associated with academia. More than ten interviewees identified themselves as working for the government. The numbers add up to more than the 86 interviewees, as some had more than one role. At the end of each survey, when we asked the interviewees to give us the names of two additional people who might participate in the survey, we made it clear that they didn’t have to limit the type of person they were recommending. Therefore, we believe that the makeup of our survey approximates the makeup of people working in the speech and language technology area.
Figure B-1: Distribution of Interviewees by Organization Type The ages of our interviewees (Figure B-2) was evenly represented between 40 and 65 years of age, with a few old-timers represented as well. Interviewees tended to recommend people with a substantial background in the research field, and this accounts for the dearth of younger participants. In fact, this was a recurring theme in our interviews, as the general perception was that there were not a lot of younger entrants into the field, and that this was an issue that needed to be addressed.
Interviewee Organiza on Type
0
10
20
30
40
50
60
industry academia government
Number of Interviewees

40 Distribution A: Approved for public release; distribution unlimited. 88 ABW-2013-3714, cleared 20 August 2013
Figure B-2: Distribution of Interviewees by Age Ages were rounded to the nearest 5 years, so “40” represents ages from 37.5 to 42.5 years old
We then asked our interviewees what their current job or “professional affiliation” was. Figure B-3 shows the job categories as self-reported.
Figure B-3: Distribution of Interviewees by Job Type
Subjects sometimes identified themselves as working in more than one area (e.g., research and teaching)
Our interviewees identified more than 12 technology areas in which they are currently working in, although there is substantial overlap in the categories . This was particularly true if the interviewee was working at a speech technology company or in a speech research group within industry. Additionally, there were a smattering of unidentified management people, and a few analysts and consultants, who cover the field more broadly than those doing research or development. This led to further identification with more than one area of coverage. The resulting distribution is shown in Figure B-4.
Age of Interviewees
0
2
4
6
8
10
12
14
16
40 45 50 55 60 65 70
Number
of Interviees
Age in Years
Interviewee Jobs
0
10
20
30
40
50
60
research
development
management
eingineer
bd
teaching
analyst
marke
ng
qa
consultant
Interviewees

41 Distribution A: Approved for public release; distribution unlimited. 88 ABW-2013-3714, cleared 20 August 2013
The predominant identification was work in automatic speech recognition. However, categories of mobile-embedded, acoustics, keyword spotting, and language modeling could also have been considered ASR. The other categories included text-to-speech, human-computer interfaces, and various identification tasks (language, speaker, and other biometrics).
Figure B-4: Distribution of Interviewees by Current Work Area
Technology Areas
0
5
10
15
20
25
30
35
40
45
asr
mobile
embedded
s
acouscs
management
hci
teaching
language
model
lid, sid, biometrics
analyst
kw
consultant

42 Distribution A: Approved for public release; distribution unlimited. 88 ABW-2013-3714, cleared 20 August 2013
APPENDIX C - Bibliography (Other Relevant Publications)
The reviews given in the main body of the report have extensive bibliographies of papers and books in the speech and language technology arena. These are readily available, and we have not attempted to replicate or mimic them here.
In the process of our surveys we located many other papers that seemed relevant to our study, and in particular the experts interviewed in our community survey also recommended a number of other significant papers. Here are a few of the more instructive additional documents that we found.
An early paper, “Analytic Methods for Acoustic Model Adaptation: A Review” (Shigeki Sagayama1;2, Koichi Shinoda3, Mitsuru Nakai2 and Hiroshi Shimodaira 2, ITRW on Adaptation Methods for Speech Recognition, Sophia Antipolis, France, August 29-30, 1991) is interesting because of the breadth of adaptation methods known at that time, and which are still used in our modern systems. The paper outlines MAP estimation, Cepstral Mean Normalization, MLLR, Vector Field Smoothing, VTLN, and Speaker Adaptive Training. It is stunning that these basic methods are still in use, and that they have been evolved over the past two decades, without fixing the basic performance issues in ASR.
An intriguing exercise in modern speech recognition system building may be found in André Mansikkaniemi’s “Acoustic Model and Language Model Adaptation for a Mobile Dictation Service” (Alto University School of Science and Technology Master’s Thesis, 2010). The author carefully exercises modern acoustic and language models, including language model and acoustic adaptation, to build a system for one talker. The descriptions are succinct and clear. The performance of the resulting system is typical: 20 to 40% word error for simple sentences. This is a detailed and dismal view of current technology.
There have been attempts to field the current ASR technology in large scale applications. The paper “Your Word is My Command - Google Search by Voice: A case study” (Johan Schalkwyk, Doug Beeferman, Fracoise Beaufays, Bill Byrne, Ciprian Chelba, Mike Cohen, Maryam Garret, Brian Strope, in Advances in Speech Recognition, Springer Verlag, 2010, pp 61-90) describes the monumental effort to create speech recognition for voice search at Google, along with the appropriate user interface and other infrastructure. The bottom line is that this indefatigable creator of technology has created a speech recognizer with a word error rate of 17%. While this performance is apparently commercially viable, it gives the technician looking for success substantial heartache. It means that the current technology, fed by essentially infinite data and compute, is substantially defective!
There is a move afoot to look at robustness directly. In “A Study on the Generalization Capability of Acoustic Models for Robust Speech Recognition,” (Xiong Xiao, Jinyu Li, Eng Siong Chng, Haizhou Li, Chin-Hui Lee, IEEE Transactions on Audio, Speech and Language Processing, Vol. 18, No. 6, August 2010), the authors show that large margin measures create slightly more robust processes. It is encouraging to see movement towards robustness, but broader statistics, while part of the answer, ignores the difficulties in the models themselves.

43 Distribution A: Approved for public release; distribution unlimited. 88 ABW-2013-3714, cleared 20 August 2013
An attempt to move away from the simple HMM models dating from the 1960’s may be seen in “A Hidden Trajectory Model with Bi-Directional Target Filtering: Cascaded vs. Integrated Implementation for Phonetic Recognition, (Li Deng, Xiang Li, Dong Yu, and Alex Acero, Proc. ICASSP 2005). The authors attempt to use an underlying hidden generative model and demonstrate improved performance on phonetic recognition of TIMIT. This movement away from simple HMM states points out the potential gain from more sensible models of the speech generation process.
Adaptation using unsupervised data is described in “Adapting Acoustic Models to New Domains and Conditions Using Untranscribed Data” (Asela Gunawardana and Alex Acero, International Conference on Speech Communication and Technology, International Speech Communication Association, September 2003), creating a “robust” system on-the-fly. They demonstrate that transcription is not a necessary part of adaptation.
We tried to ask our informants about papers or books which might inform a reader about the issues in the state of the art performance, or which were particularly enlightening about the engineering or scientific issues. Most declined to make a recommendation, but several interesting suggestions were made. We list them here:
The recent writings and papers of Larry Gillick o Dan Gillick, Steven Wegmann, Larry Gillick: Discriminative Training for
Speech Recognition is Compensating for Statistical Dependence in the HMM Framework. ICASSP 2012: 4745-4748
o Dan Gillick, Larry Gillick, Steven Wegmann: Don't Multiply Lightly: Quantifying Problems with the Acoustic Model Assumptions in Speech Recognition. ASRU 2011: 71-76
o Steven Wegmann, Larry Gillick: Why has (Reasonably Accurate) Automatic Speech Recognition been so Hard to Achieve? CoRR abs/1003.0206 (2010)
Good’s paper on smoothing in Biometrica o The Population Frequencies of Species and the Estimation of Population
Parameters, I. J. Good, Biometrika, Vol. 40, No. 3/4. (Dec., 1953), pp. 237-264.
The papers of Dan Povey o "Krylov Subspace Descent for Deep Learning", Oriol Vinyals and D. Povey,
AISTATS 2012 (pdf) o "Generating exact lattices in the WFST framework", D. Povey, M.
Hannemann et. al, ICASSP 2012(pdf) o "Revisiting Semi-continuous Hidden Markov Models", K. Reidhammer, T.
Bocklet, A. Ghoshal and D. Povey, ICASSP 2012 (pdf) o "Modeling Gender Dependency in the Subspace GMM Framework", Ngoc
Thang Vu, Tanja Schultz and D. Povey, ICASSP 2012(pdf) o "Revisiting Recurrent Neural Networks for Robust ASR", Oriol Vinyals,
Suman V. Ravuri, Daniel Povey, ICASSP 2012(pdf)

44 Distribution A: Approved for public release; distribution unlimited. 88 ABW-2013-3714, cleared 20 August 2013
o "The Kaldi Speech Recognition Toolkit," D. Povey, A. Ghoshal et. al, ASRU 2011 (accepted) (pdf)
o "Speaker Adaptation with an Exponential Transform," Daniel Povey, Geoffrey Zweig and Alex Acero, ASRU 2011 (accepted) (pdf)(+tech report)
o "The Subspace Gaussian Mixture Model – a Structured Model for Speech Recognition," D. Povey, Lukas Burget et. al Computer Speech and Language, 2011 (pdf)
o "A Basis Representation of Constrained MLLR Transforms for Robust Adaptation," Daniel Povey and Kaisheng Yao, Computer Speech and Language, 2011. (pdf)
o "Minimum Bayes Risk Decoding and System Combination Based on a Recursion for Edit Distance," Haihua Xu, Daniel Povey, Lidia Mangu and Jie Zhu, Computer Speech and Language, 2011. (pdf)
o "A Basis Method for Robust Estimation of Constrained MLLR," Daniel Povey and Kaisheng Yao, ICASSP 2011 (pdf)
o "A Symmetrization of the Subspace Gaussian Mixture Model," Daniel Povey, Martin Karafiat, Arnab Ghoshal, Petr Schwarz, ICASSP 2011 (pdf)
o "State-Level Data Borrowing for Low-Resource Speech Recognition Based on Subspace GMMs," Yanmin Qian, Daniel Povey and Jia Lu, Interspeech 2011 (pdf)
Colin Cox – Statistical Significance o Statistical Significance Tests,D.R. COX, Br. J. clin. Pharmac. (1982), 14,
325-331 HMMs for Speech Recognition by Huang et al
o Xuedong D Huang, Yasuo Ariki, Mervyn A Jack (1990). Hidden Markov Models for Speech Recognition, Edinburgh University Press
Kai Fu Li Thesis o The Development of the SPHINX Recognition System, Kai Fu Li, Springer,
31 October 1988 Holmes and Mattingly writings (a small selection noted here)
o J. Holmes, I.G. Mattingly, J.N. Shearme: Speech Synthesis by Rule, Lang. Speech 7, 127-143 (1964)
o I.G. Mattingly: Synthesis by Rule as a Tool for Phonological Research, Lang. Speech 14(1), 47-56 (1971)
o J. Holmes: Formant Synthesizers, Cascade or Parallel, Speech Commun. 2, 251-273 (1983)
o J. Holmes: Influence of the Glottal Waveform on the Naturalness of Speech from a Parallel Formant Synthesizer, IEEE Trans. Audio Electroac. AU-21, 298-305 (1973)
David MacKay on Information Theory and Algorithms

45 Distribution A: Approved for public release; distribution unlimited. 88 ABW-2013-3714, cleared 20 August 2013
o Information Theory, Inference, and Learning Algorithms, David Mackay, University of Cambridge, various years. available at http://www.inference.phy.cam.ac.uk/itprnn/book.html
Hervé Bourlard et al on increasing error rate o Towards increasing speech recognition error rates, Hervé Bourlard), Hynek
Hermansky, Nelson Morgan, Speech Communication 18 _1996. 205–231 Bridle and Richards on Hidden Dynamic Models
o The HDM: A Segmental Hidden Dynamic Model of Coarticulation (1999) o by Hywel B. Richards , John S. Bridle, Proc. Of the IEEE Int. Conf. on
Acoustics, Speech, and Sign. Proc. (ICASSP’99), Volume I Deep Neural Network papers from Microsoft
o Context-Dependent Pre-trained Deep Neural Networks for Large Vocabulary Speech Recognition, George E. Dahl, Dong Yu, Li Deng, and Alex Acero, ICASSP, forthcoming.
Li Deng’s writings (These are extensive – this is an important example, but there are literally hundreds of references) o Li Deng, Dynamic Speech Models --- Theory, Algorithm, and Application;
(book review in IEEE Trans. Neural Networks, Vol. March 2009), Morgan & Claypool, December 2006
Miami Children’s Hospital o When Time Breaks Down – the Story of Fractals, Arthur T. Winfree (1987).
When Time Breaks Down: The Three-Dimensional Dynamics of Electrochemical Waves and Cardiac Arrhythmias. Princeton University Press. ISBN 0-691-02402-2.
The autobiography of Craig Vitner o A Life Decoded - My Genome: My Life. By J. Craig Venter. Viking, 2007

46 Distribution A: Approved for public release; distribution unlimited. 88 ABW-2013-3714, cleared 20 August 2013
LIST OF ACRONYMS
AFRL Air Force Research Laboratory ASR Automatic Speech Recognition DARPA Defense Advanced Research Projects Agency DNN Deep Neural Network DTW Dynamic Time Warp ECoG Electrocorticography FF Far-Field GALE Global Autonomous Language Exploitation GMM Gaussian Mixture Model HMM Hidden Markov Model HTK HMM Tool Kit IARPA Intelligence Advanced Research Projects Activity IEEE Institute of Electrical and Electronics Engineers IDA Institute for Defense Analysis IVR Interactive Voice Response LM Language Model LVCSR Large Vocabulary Continuous Speech Recognition MFCC Mel Frequency Cepstral Coefficient ML Maximum Likelihood MLLR Maximum Likelihood Linear Regression MLP Multi-Layer Perceptron MMI Maximum Mutual Information MPE Minimum Phone Error NF Near-field NIST National Institute of Standards and Technology RASTA RelAtive SpecTral Analysis ROVER Recognizer Output Voting Error Reduction SE Standard Error STT Speech-To-Text VTLN Vocal Tract Length Normalization VUI Voice User Interface WER Word Error Rate