Embed Size (px)
Citation preview
Oracle® CloudWhat's New in Oracle Management Cloud
E72223-56
April 2020
What’s New in Oracle Management Cloud• What's New in Oracle Management Cloud – Global
• What's New in Oracle Database Management
• What's New in Oracle Application Performance Monitoring
• What's New in Oracle Infrastructure Monitoring
• What's New in Oracle IT Analytics
• What's New in Oracle Log Analytics
• What's New in Data Explorer and Dashboards
• What’s New in Solutions for Packaged Applications
• What's New in Oracle Orchestration
What's New in Oracle Management Cloud – GlobalLearn about what's new in the global areas of Oracle Management Cloud.
New Features in Oracle Management Cloud – Global inSeptember 2019
Feature Description
Changes to the gettingstarted with Oracle Cloudworkflow
The getting started with Oracle Cloud workflow has undergonechanges to ensure a unified getting started experience for newand existing customers. For information on how this affects OracleManagement Cloud, see Access Oracle Management Cloud inGetting Started with Oracle Management Cloud.
New Features in Oracle Management Cloud – Global inJune 2019
1
Feature Description
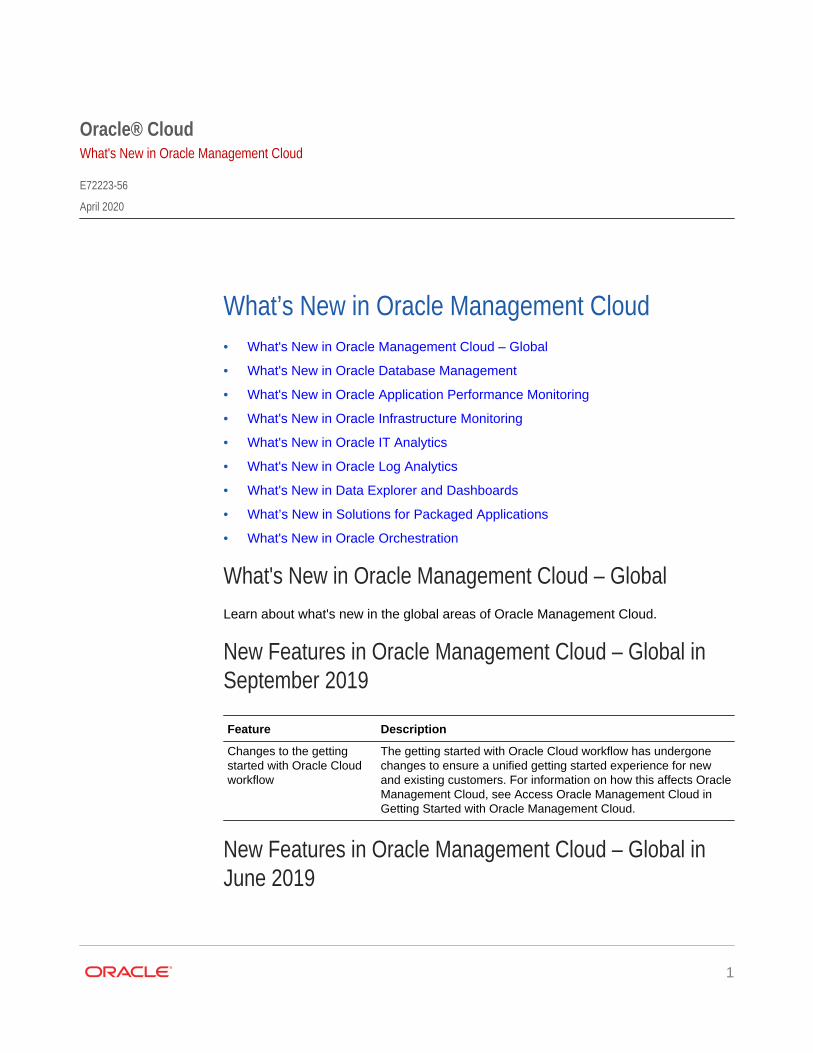
Monitor Usage in OracleManagement Cloudconsole
You can now monitor your usage and obtain information aboutyour billing on the Billing Usage tab on the Licensing page inthe Oracle Management Cloud console.
See Monitor Your Billing Usage in Getting Started with OracleManagement Cloud.
Create out-of-the-boxentities using the RESTAPI for OracleManagement Cloud
You can now create entities from a number of predefinedWebLogic and Oracle Database entity types using the REST APIfor Oracle Management Cloud.
See Out-of-the-box Entity Types Reference in REST API forOracle Management Cloud.
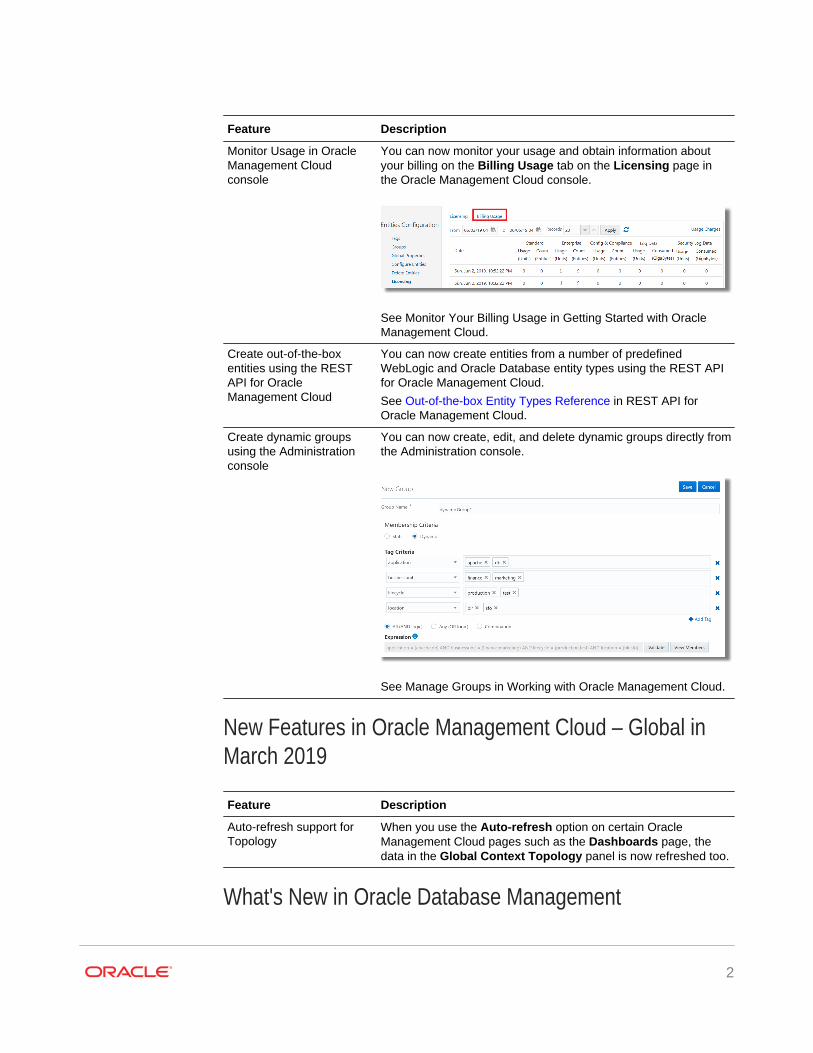
Create dynamic groupsusing the Administrationconsole
You can now create, edit, and delete dynamic groups directly fromthe Administration console.
See Manage Groups in Working with Oracle Management Cloud.
New Features in Oracle Management Cloud – Global inMarch 2019
Feature Description
Auto-refresh support forTopology
When you use the Auto-refresh option on certain OracleManagement Cloud pages such as the Dashboards page, thedata in the Global Context Topology panel is now refreshed too.
What's New in Oracle Database Management
2
Learn about what's new in Oracle Database Management.
New Features in Oracle Database Management inFebruary 2020
Feature Description
Monitor the metricssupported for AutonomousDatabases
You can now monitor the metrics supported for AutonomousDatabases on the Workload tab on the Performance Hub page.See Monitor Workload Metrics in Using Oracle DatabaseManagement for Autonomous Databases.
New Features in Oracle Database Management in June2019
Feature Description
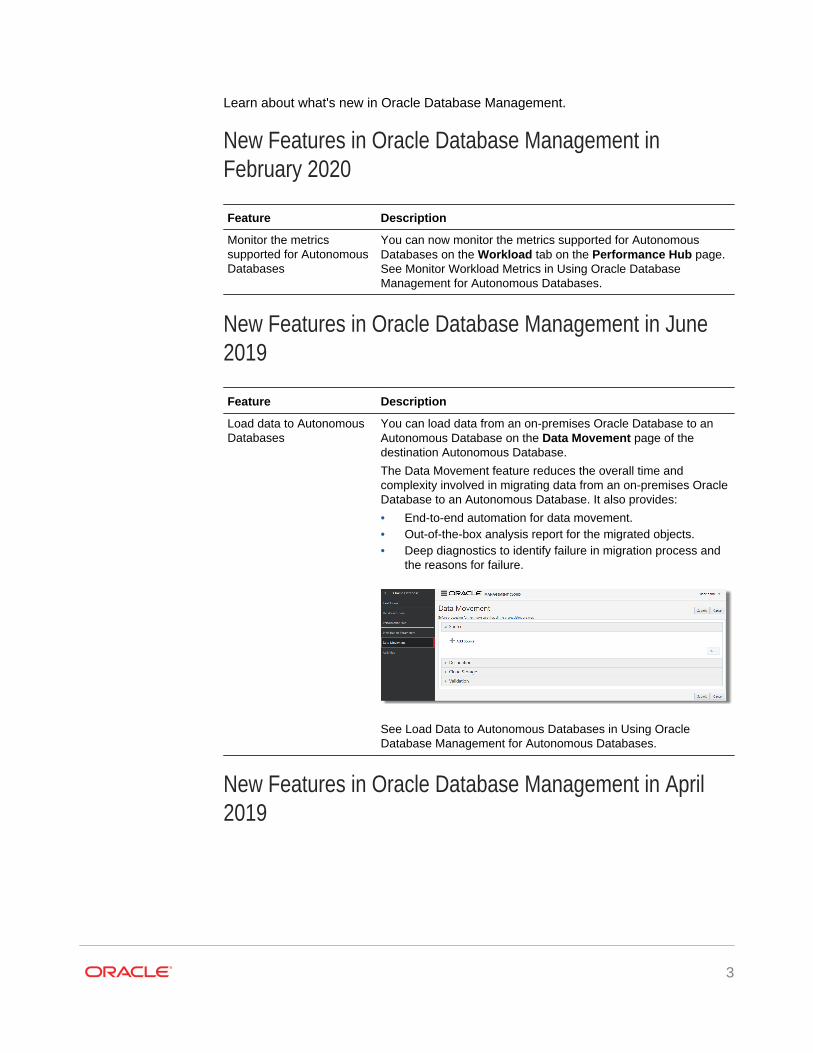
Load data to AutonomousDatabases
You can load data from an on-premises Oracle Database to anAutonomous Database on the Data Movement page of thedestination Autonomous Database.
The Data Movement feature reduces the overall time andcomplexity involved in migrating data from an on-premises OracleDatabase to an Autonomous Database. It also provides:
• End-to-end automation for data movement.• Out-of-the-box analysis report for the migrated objects.• Deep diagnostics to identify failure in migration process and
the reasons for failure.
See Load Data to Autonomous Databases in Using OracleDatabase Management for Autonomous Databases.
New Features in Oracle Database Management in April2019
3
Feature Description
Oracle DatabaseManagement is a newcomponent available aspart of Oracle ManagementCloud
Oracle Database Management enables you to monitorAutonomous Databases and on-premises Oracle Databases on aunified platform.
For information on how to use Oracle Database Management tomonitor Autonomous Databases, see Using Oracle DatabaseManagement for Autonomous Databases.
What’s New in Oracle Application Performance MonitoringLearn about what's new in Oracle Application Performance Monitoring.
New Features in Oracle Application PerformanceMonitoring in November 2019
Feature Description
Added enable/disable storepersonal identifiableinformation under privacysettings
You can now choose if you want to store private information suchas full URLs, page titles, and clicks names. Existing APM usershave this behavior enabled, new APM users have this behaviordisabled by default.
See Configure Privacy Settings in Installing and ConfiguringOracle Application Performance Monitoring.
Support for Oracle Formsmonitoring
You can now deploy the APM Java Agent with Oracle EBS Formsmonitoring.
See Oracle EBS: Requirements and Installation Instructions inInstalling and Configuring Oracle Application PerformanceMonitoring.
Support for WebApplication Definitions
With Web Applications, you can define and save a filter to pulltogether a set of pages in the application that match the definedfilter criteria at a particular time point.
See Monitoring End User Experience of a Web Application inUsing Oracle Application Performance Monitoring.
New Features in Oracle Application PerformanceMonitoring in July 2019
Feature Description
Added enable/disableoption inside APM AgentConfiguration Menu
You can now enable or disable multiple APM agents by usingmulti-select from the APM Agent list and clicking Configure.
4
Feature Description
Support for CustomInstrumentation
You can now use Custom Instrumentation to add monitoringcapabilities to technologies not supported by Oracle ApplicationPerformance Monitoring.
See Set Up Custom Instrumentation in Using ApplicationPerformance Monitoring.
New Features in Oracle Application PerformanceMonitoring in February 2019
Feature Description
Support for .side files forSynthetic Tests
You can now record scripted actions using Selenium IDE andsave as a .side file and upload it when you create and schedulea synthetic test.
See Define Synthetic Tests and Supported Selenium Commandsin Using Application Performance Monitoring.
What’s New in Oracle Infrastructure MonitoringLearn about what's new in Oracle Infrastructure Monitoring.
New Features in Oracle Infrastructure Monitoring inFebruary 2020
Feature Description
Advanced NotificationOptions: RepeatNotification
You can specify that alert notifications be sent repeatedly atspecified intervals until an alert is either cleared or acknowledgedor the number of Maximum number of repeat notifications hasbeen reached.
This option only applies to Email notification channels.
See Create an Alert Rule in Using Infrastructure Monitoring.
SQL Server monitoring withTLS 1.2
Microsoft SQL Server entity types now support monitoring via TLS1.2.
See Add Microsoft SQL Server in Using Oracle InfrastructureMonitoring.
New Features in Oracle Infrastructure Monitoring inAugust 2019
5
Feature Description
Advanced NotificationOptions: Notify based onSeverity
New advanced notification options allow you to specify the alertseverities on which you would like to send notifications. Bydefault, notifications are sent when the alert is created, when itworsens in severity, and when the alert is cleared. You canchange this default behavior by specifying:
• When to notify: use default or on every severity changeand/or
• When not to notify: based on selected severitiesThese options apply only to Email, Mobile, and Slack notificationchannels.
New Features in Oracle Infrastructure Monitoring in July2019
6
Feature Description
GoldenGate Dashboard When monitoring a GoldenGate composite entity, the GoldenGatedashboard now displays detailed information about the membersof the GoldenGate composite.
New Features in Oracle Infrastructure Monitoring in June2019
Feature Description
Apache Kafka In this release, monitoring of Apache Kafka is supported. Thisallows you to monitor Kafka broker performance such as amountof data passed into and out of Kafka, number of partitions withoutin-sync replicas, or rate of in-sync replicas going high.
Enhancements toExisting Entity Types
.
Database SystemDiscovery
Single Instance database system discovery has been enhancedto also discover ASM (Automatic Storage Management).
See Discover Oracle Database Systems in Using OracleInfrastructure Monitoring.
7
Feature Description
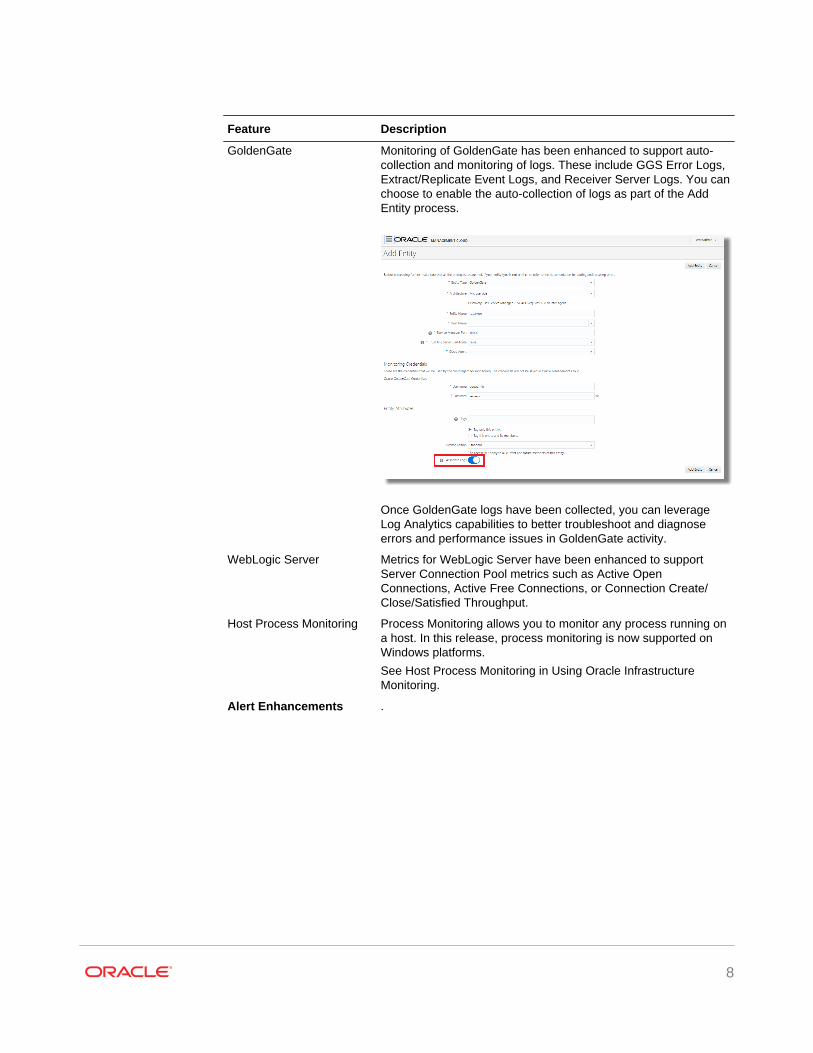
GoldenGate Monitoring of GoldenGate has been enhanced to support auto-collection and monitoring of logs. These include GGS Error Logs,Extract/Replicate Event Logs, and Receiver Server Logs. You canchoose to enable the auto-collection of logs as part of the AddEntity process.
Once GoldenGate logs have been collected, you can leverageLog Analytics capabilities to better troubleshoot and diagnoseerrors and performance issues in GoldenGate activity.
WebLogic Server Metrics for WebLogic Server have been enhanced to supportServer Connection Pool metrics such as Active OpenConnections, Active Free Connections, or Connection Create/Close/Satisfied Throughput.
Host Process Monitoring Process Monitoring allows you to monitor any process running ona host. In this release, process monitoring is now supported onWindows platforms.
See Host Process Monitoring in Using Oracle InfrastructureMonitoring.
Alert Enhancements .
8
Feature Description
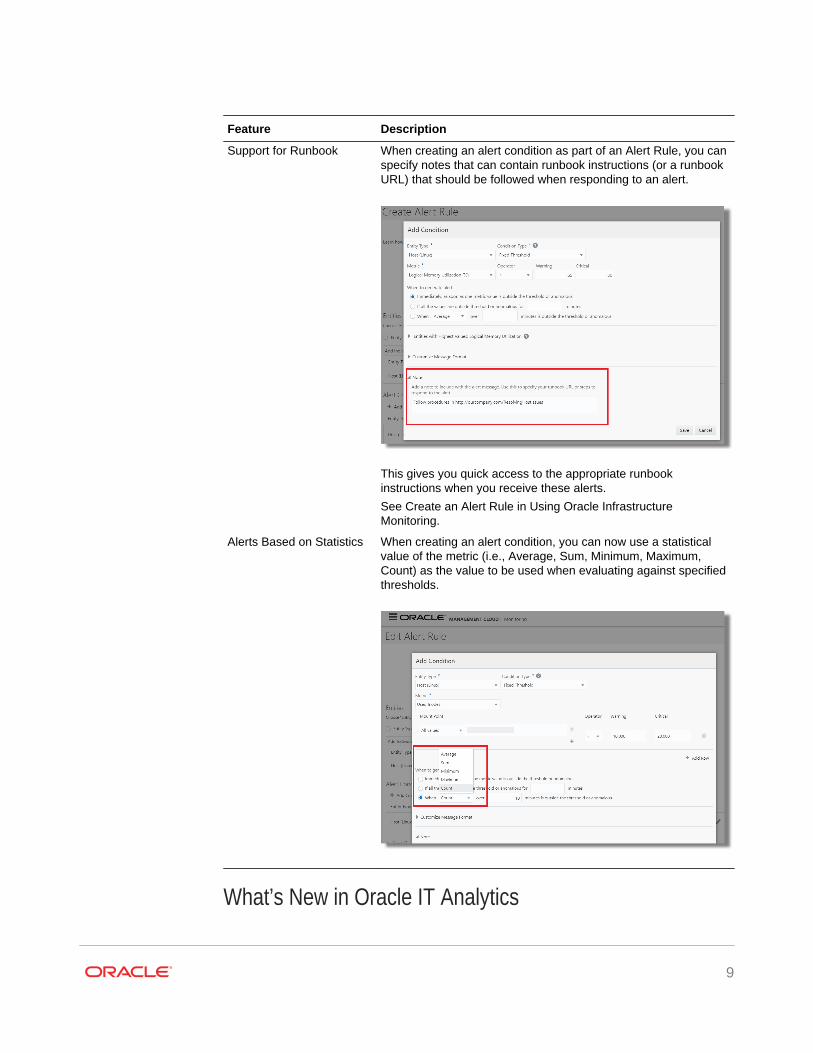
Support for Runbook When creating an alert condition as part of an Alert Rule, you canspecify notes that can contain runbook instructions (or a runbookURL) that should be followed when responding to an alert.
This gives you quick access to the appropriate runbookinstructions when you receive these alerts.
See Create an Alert Rule in Using Oracle InfrastructureMonitoring.
Alerts Based on Statistics When creating an alert condition, you can now use a statisticalvalue of the metric (i.e., Average, Sum, Minimum, Maximum,Count) as the value to be used when evaluating against specifiedthresholds.
What’s New in Oracle IT Analytics
9
Learn about what's new in Oracle IT Analytics.
New Features in Oracle IT Analytics in November 2019
Feature Description
Enable Text/Plan DataCollection
You can now enable SQL Text and Plan data to be collected andyou can visualize and analyze it with Oracle IT Analytics.Collecting SQL text and plans across all your databases allowsyou to analyze problematic or inefficient SQL. You can performtasks that help you tune your SQL, such as view historical data,do trend analysis, review and compare plans, drill down to specificSQL details, and so on.
See Enable Text Plan Collections and Findings and PerformanceAnalysis in Using Oracle IT Analytics.
New Features in Oracle IT Analytics in March 2019
Feature Description
Support for out-of-boxalerts on Exadata IOPSand Storage.
You can now use the following alert rules to receive notificationsabout capacity utilization of Exadata IOPS and Exadata storageresources:
• Exadata IOPS Capacity Headroom Rule• Exadata Storage Capacity Headroom RuleYou can modify these rules, based on your requirement.
See About Alert Thresholds and Notifications and Modify an AlertRule in Using Oracle IT Analytics.
New Features in Oracle IT Analytics in February 2019
Feature Description
Access the ExadataOverview page from thenew Exadata menuavailable in the OMCnavigation pane.
See Analyze Exadata Systems with the Integrated View of Logsand Analytics in Using Oracle IT Analytics.
Set the high and lowutilization threshold valuesfor Exadata Storage andExadata IOPS.
You can now specify the high and low threshold values in the ITAnalytics Settings page. By default, the values are 75% and 25%,respectively.
See Configure Capacity Thresholds for Your Environment inUsing Oracle IT Analytics.
What’s New in Oracle Log Analytics
10
Learn about what's new in Oracle Log Analytics.
New Features in Oracle Log Analytics in April 2020
Feature Description
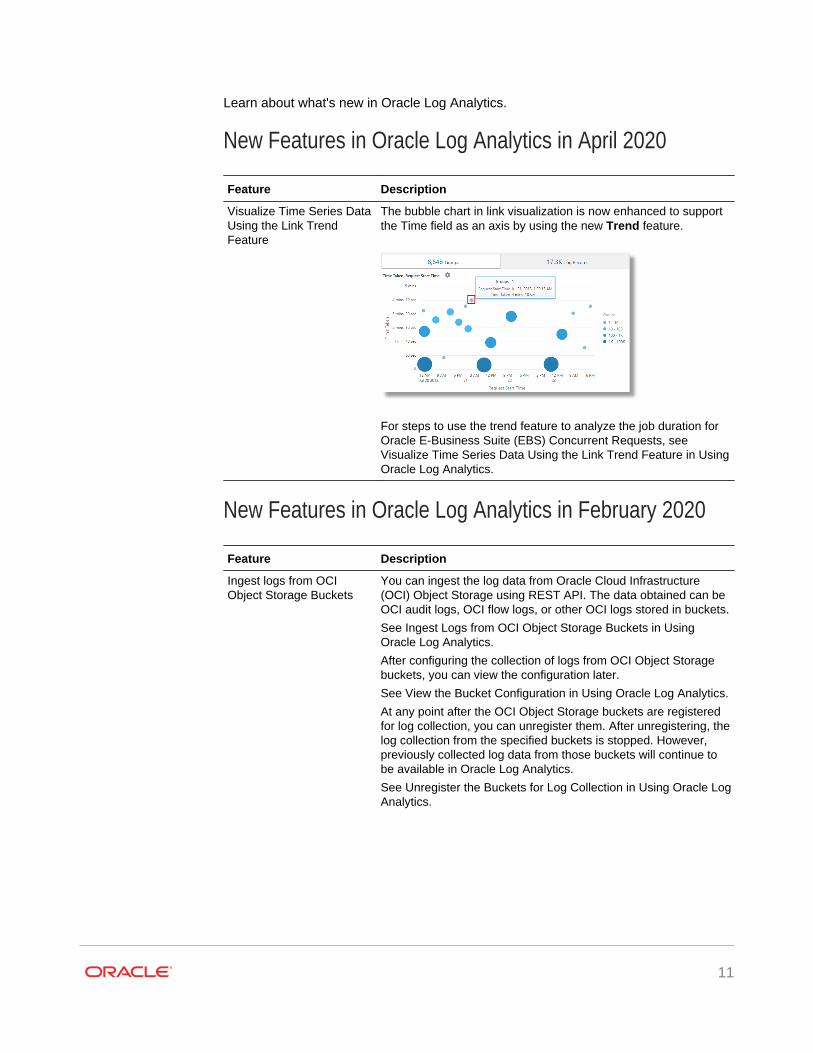
Visualize Time Series DataUsing the Link TrendFeature
The bubble chart in link visualization is now enhanced to supportthe Time field as an axis by using the new Trend feature.
For steps to use the trend feature to analyze the job duration forOracle E-Business Suite (EBS) Concurrent Requests, see Visualize Time Series Data Using the Link Trend Feature in UsingOracle Log Analytics.
New Features in Oracle Log Analytics in February 2020
Feature Description
Ingest logs from OCIObject Storage Buckets
You can ingest the log data from Oracle Cloud Infrastructure(OCI) Object Storage using REST API. The data obtained can beOCI audit logs, OCI flow logs, or other OCI logs stored in buckets.
See Ingest Logs from OCI Object Storage Buckets in UsingOracle Log Analytics.
After configuring the collection of logs from OCI Object Storagebuckets, you can view the configuration later.
See View the Bucket Configuration in Using Oracle Log Analytics.
At any point after the OCI Object Storage buckets are registeredfor log collection, you can unregister them. After unregistering, thelog collection from the specified buckets is stopped. However,previously collected log data from those buckets will continue tobe available in Oracle Log Analytics.
See Unregister the Buckets for Log Collection in Using Oracle LogAnalytics.
11
Feature Description
Use Fluentd for logcollection
Use the open source data collector software, Fluentd to collect logdata from your source. Install the Oracle supplied output plug-in toallow the log data to be collected in Oracle Log Analytics.
See Use Fluentd for Log Collection in Using Oracle Log Analytics.
Use the gem file provided by Oracle for the installation of theoutput plug-in.
See Install the Output Plug-In in Using Oracle Log Analytics.
Edit the configuration file provided by Fluentd or td-agent andprovide the information pertaining to Oracle Log Analytics andother customizations.
See Edit Fluentd Configuration File in Using Oracle Log Analytics.
Ensure that the parameters required by Oracle Log Analytics areavailable in the Fluentd event processed by the output plug-in.
See Configure the Format of the Incoming Log Events in UsingOracle Log Analytics.
12
Feature Description
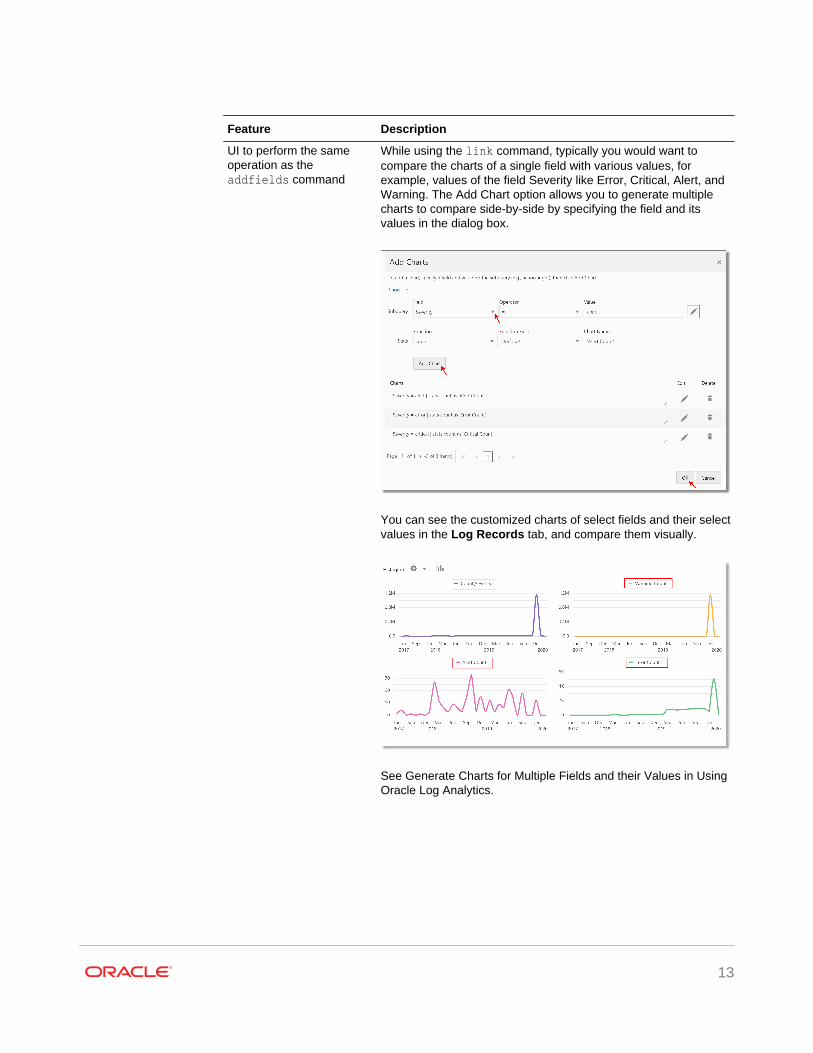
UI to perform the sameoperation as theaddfields command
While using the link command, typically you would want tocompare the charts of a single field with various values, forexample, values of the field Severity like Error, Critical, Alert, andWarning. The Add Chart option allows you to generate multiplecharts to compare side-by-side by specifying the field and itsvalues in the dialog box.
You can see the customized charts of select fields and their selectvalues in the Log Records tab, and compare them visually.
See Generate Charts for Multiple Fields and their Values in UsingOracle Log Analytics.
13
Feature Description
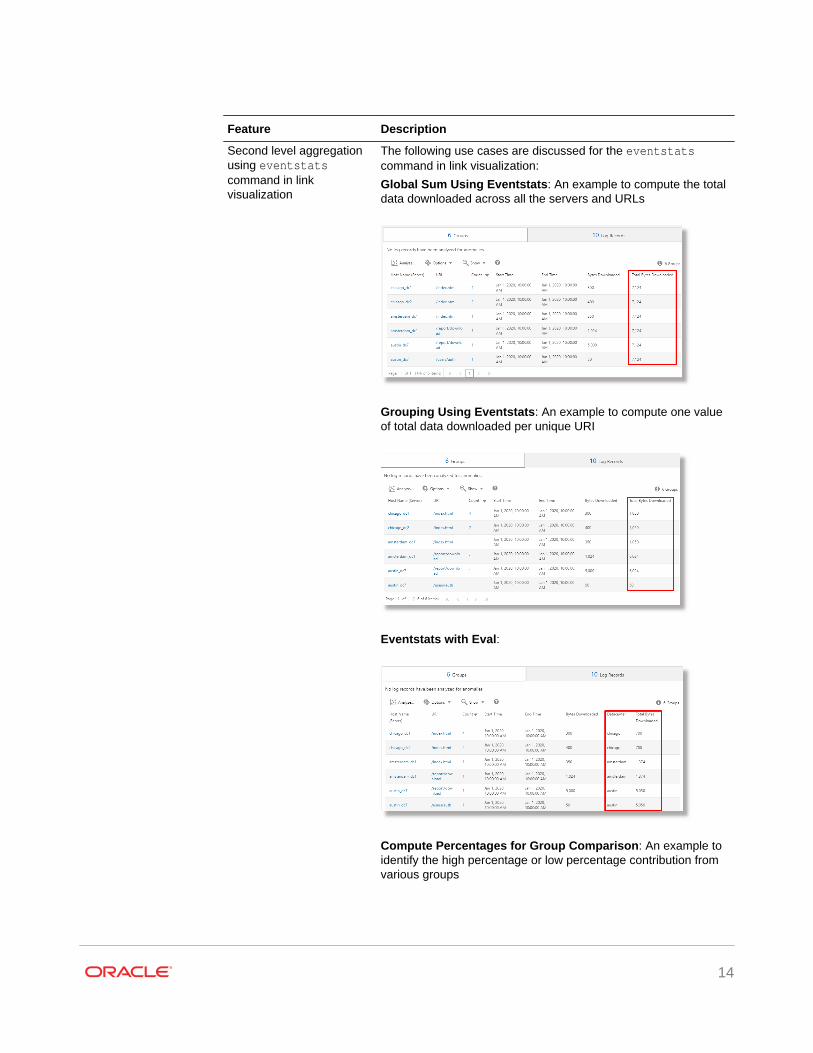
Second level aggregationusing eventstatscommand in linkvisualization
The following use cases are discussed for the eventstatscommand in link visualization:
Global Sum Using Eventstats: An example to compute the totaldata downloaded across all the servers and URLs
Grouping Using Eventstats: An example to compute one valueof total data downloaded per unique URI
Eventstats with Eval:
Compute Percentages for Group Comparison: An example toidentify the high percentage or low percentage contribution fromvarious groups
14
Feature Description
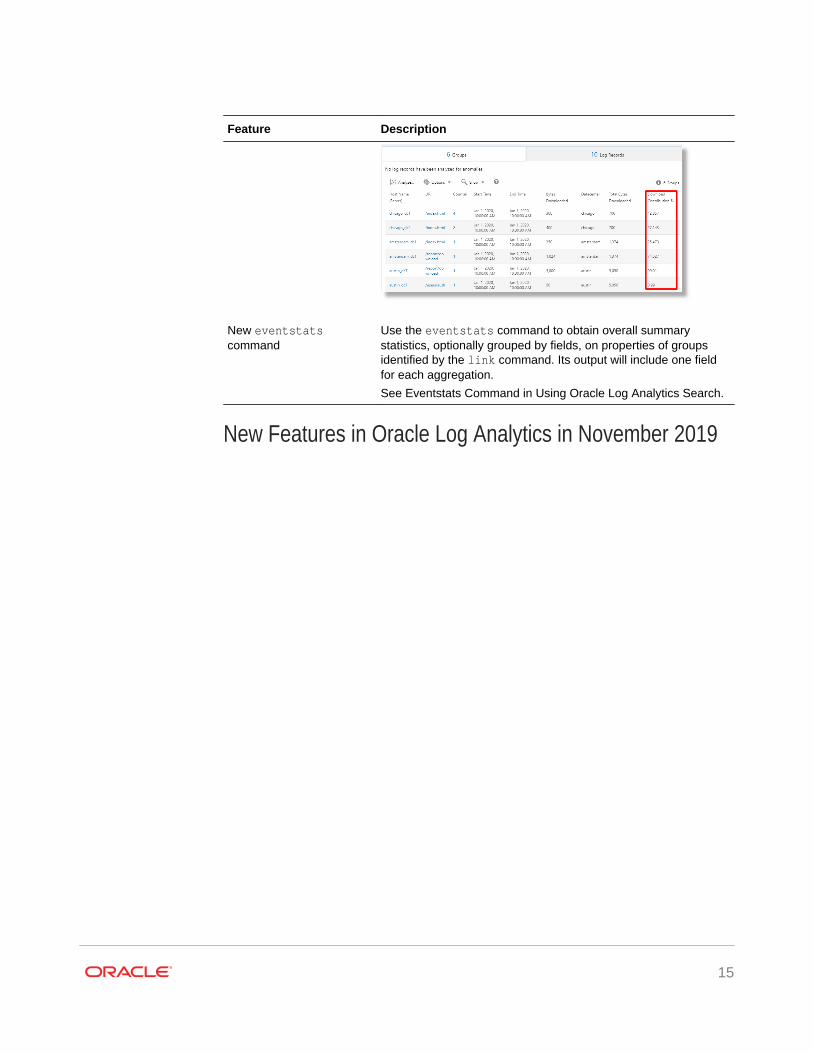
New eventstatscommand
Use the eventstats command to obtain overall summarystatistics, optionally grouped by fields, on properties of groupsidentified by the link command. Its output will include one fieldfor each aggregation.
See Eventstats Command in Using Oracle Log Analytics Search.
New Features in Oracle Log Analytics in November 2019
15
Feature Description
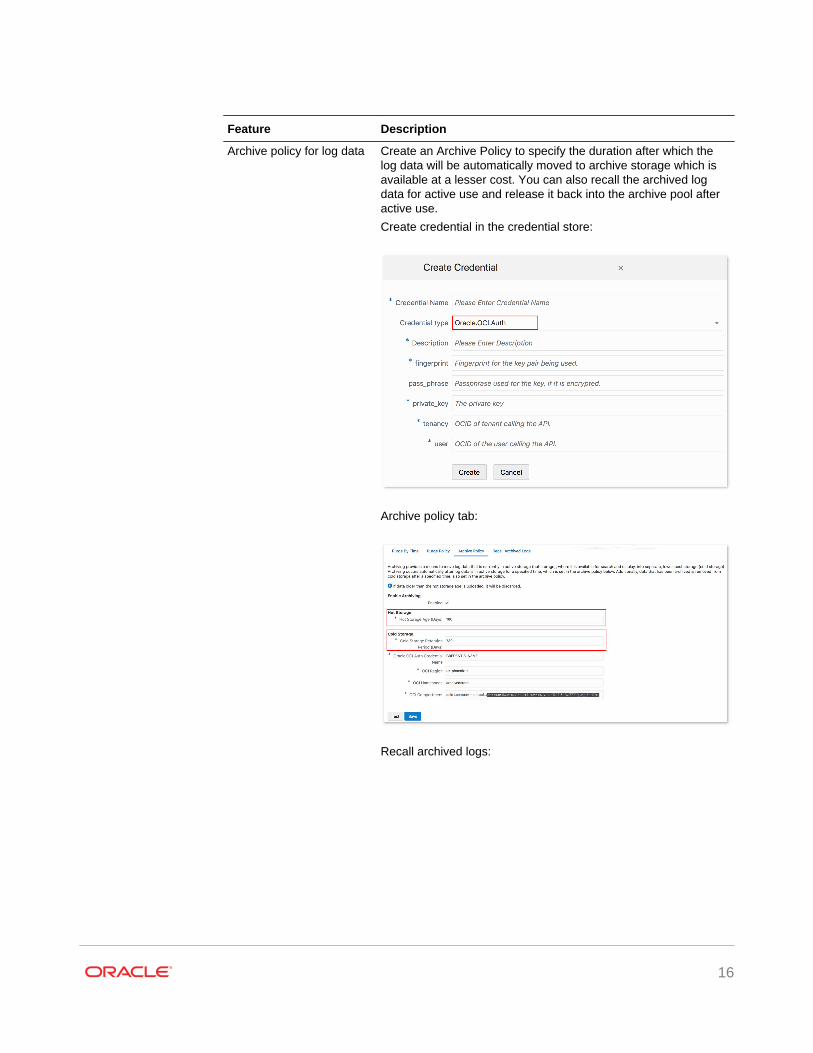
Archive policy for log data Create an Archive Policy to specify the duration after which thelog data will be automatically moved to archive storage which isavailable at a lesser cost. You can also recall the archived logdata for active use and release it back into the archive pool afteractive use.
Create credential in the credential store:
Archive policy tab:
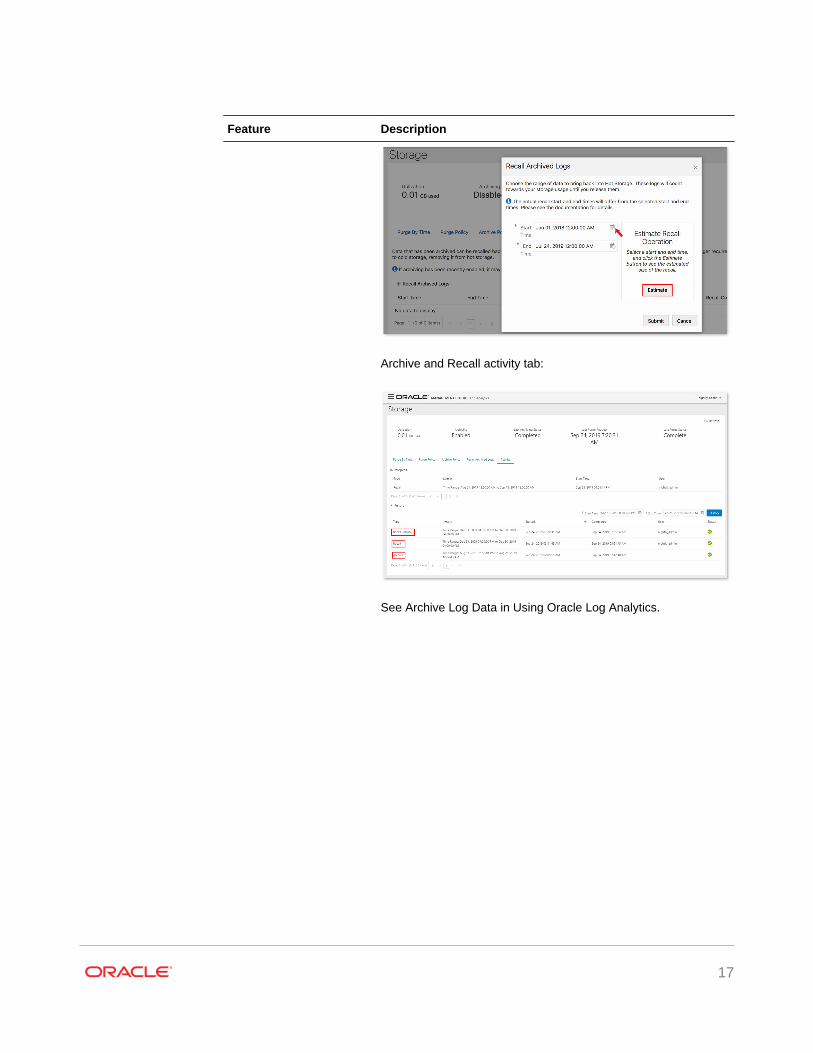
Recall archived logs:
16
Feature Description
Archive and Recall activity tab:
See Archive Log Data in Using Oracle Log Analytics.
17
Feature Description
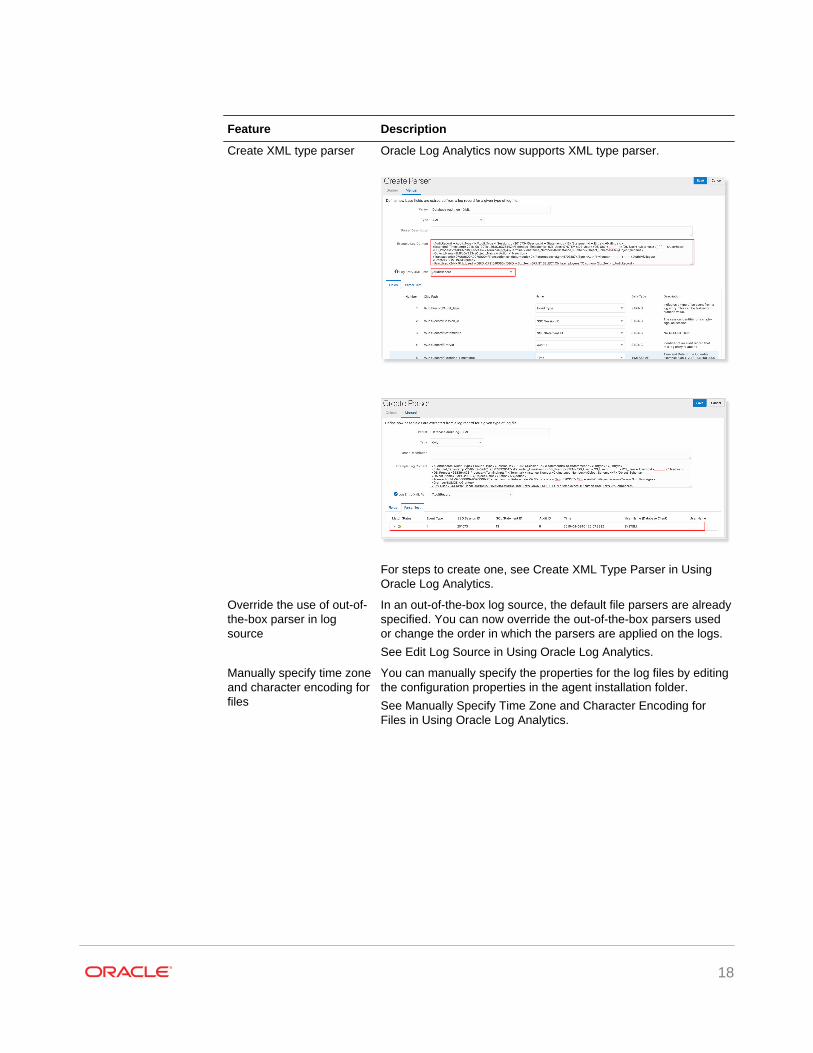
Create XML type parser Oracle Log Analytics now supports XML type parser.
For steps to create one, see Create XML Type Parser in UsingOracle Log Analytics.
Override the use of out-of-the-box parser in logsource
In an out-of-the-box log source, the default file parsers are alreadyspecified. You can now override the out-of-the-box parsers usedor change the order in which the parsers are applied on the logs.
See Edit Log Source in Using Oracle Log Analytics.
Manually specify time zoneand character encoding forfiles
You can manually specify the properties for the log files by editingthe configuration properties in the agent installation folder.
See Manually Specify Time Zone and Character Encoding forFiles in Using Oracle Log Analytics.
18
Feature Description
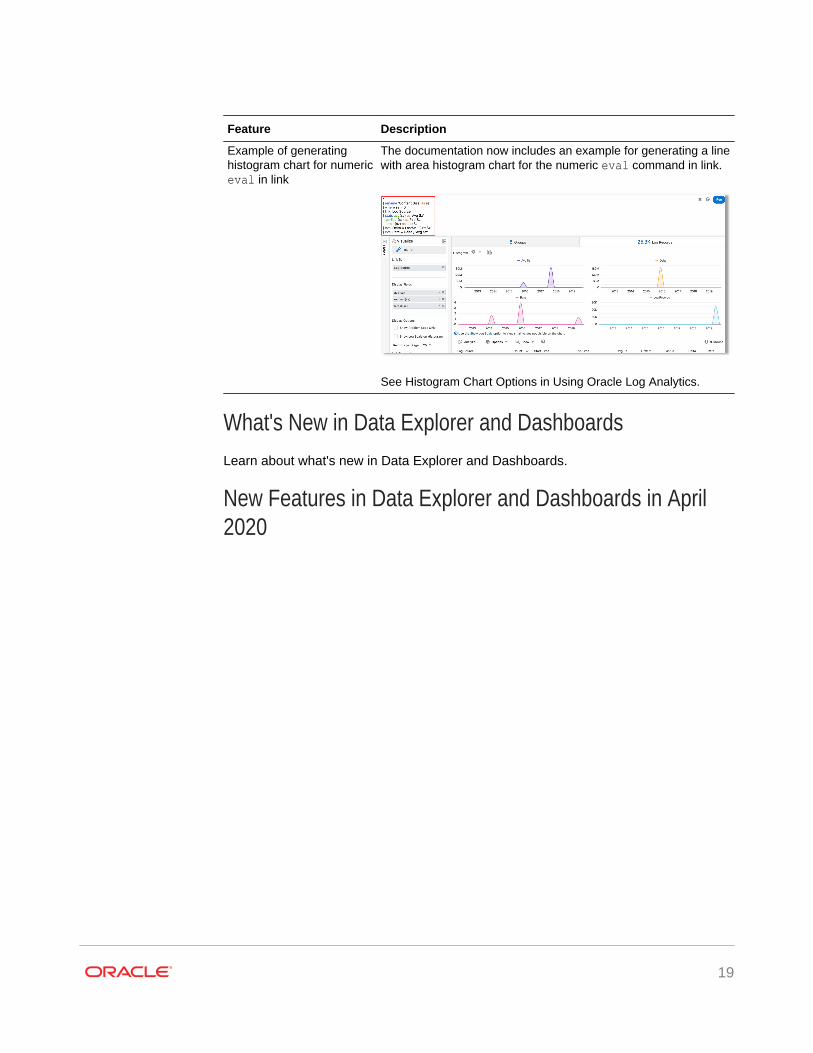
Example of generatinghistogram chart for numericeval in link
The documentation now includes an example for generating a linewith area histogram chart for the numeric eval command in link.
See Histogram Chart Options in Using Oracle Log Analytics.
What's New in Data Explorer and DashboardsLearn about what's new in Data Explorer and Dashboards.
New Features in Data Explorer and Dashboards in April2020
19
Feature Description
Enhancement to the Lineand Area visualizationoptions in Data Explorer
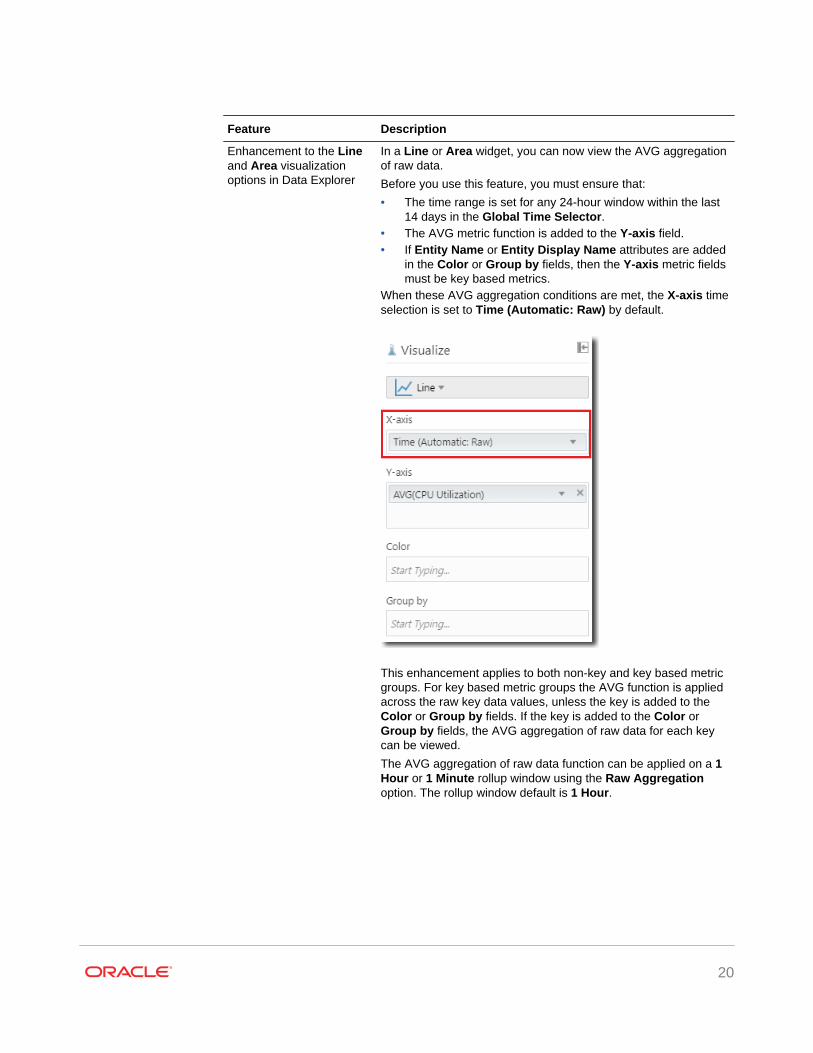
In a Line or Area widget, you can now view the AVG aggregationof raw data.
Before you use this feature, you must ensure that:
• The time range is set for any 24-hour window within the last14 days in the Global Time Selector.
• The AVG metric function is added to the Y-axis field.• If Entity Name or Entity Display Name attributes are added
in the Color or Group by fields, then the Y-axis metric fieldsmust be key based metrics.
When these AVG aggregation conditions are met, the X-axis timeselection is set to Time (Automatic: Raw) by default.
This enhancement applies to both non-key and key based metricgroups. For key based metric groups the AVG function is appliedacross the raw key data values, unless the key is added to theColor or Group by fields. If the key is added to the Color orGroup by fields, the AVG aggregation of raw data for each keycan be viewed.
The AVG aggregation of raw data function can be applied on a 1Hour or 1 Minute rollup window using the Raw Aggregationoption. The rollup window default is 1 Hour.
20
Feature Description
New Features in Data Explorer and Dashboards inFebruary 2020
Feature Description
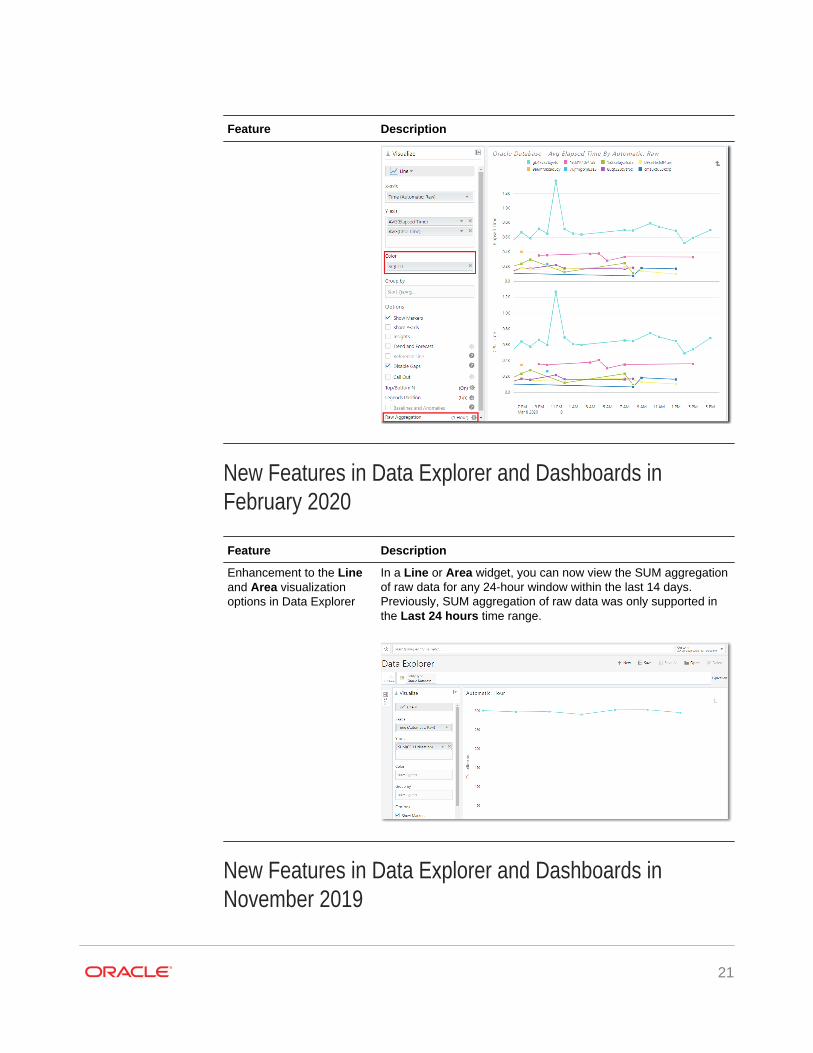
Enhancement to the Lineand Area visualizationoptions in Data Explorer
In a Line or Area widget, you can now view the SUM aggregationof raw data for any 24-hour window within the last 14 days.Previously, SUM aggregation of raw data was only supported inthe Last 24 hours time range.
New Features in Data Explorer and Dashboards inNovember 2019
21
Feature Description
Enhancement to the DataGrid visualization option inData Explorer
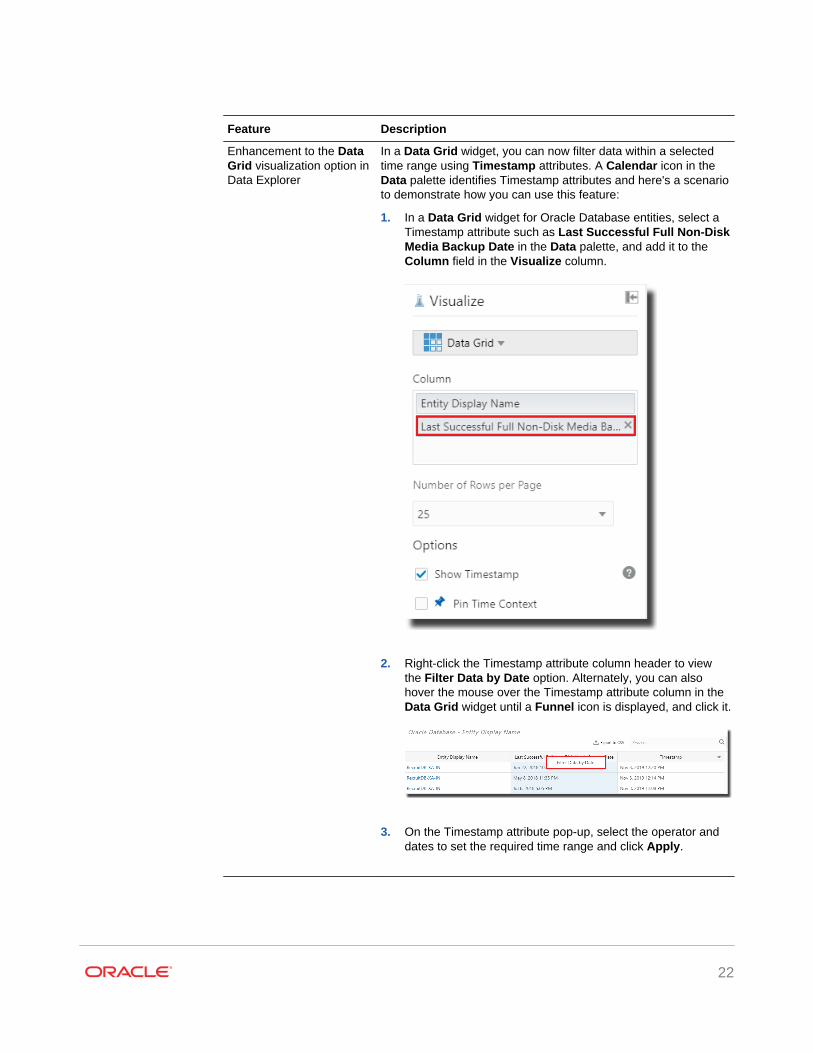
In a Data Grid widget, you can now filter data within a selectedtime range using Timestamp attributes. A Calendar icon in theData palette identifies Timestamp attributes and here's a scenarioto demonstrate how you can use this feature:
1. In a Data Grid widget for Oracle Database entities, select aTimestamp attribute such as Last Successful Full Non-DiskMedia Backup Date in the Data palette, and add it to theColumn field in the Visualize column.
2. Right-click the Timestamp attribute column header to viewthe Filter Data by Date option. Alternately, you can alsohover the mouse over the Timestamp attribute column in theData Grid widget until a Funnel icon is displayed, and click it.
3. On the Timestamp attribute pop-up, select the operator anddates to set the required time range and click Apply.
22
Feature Description
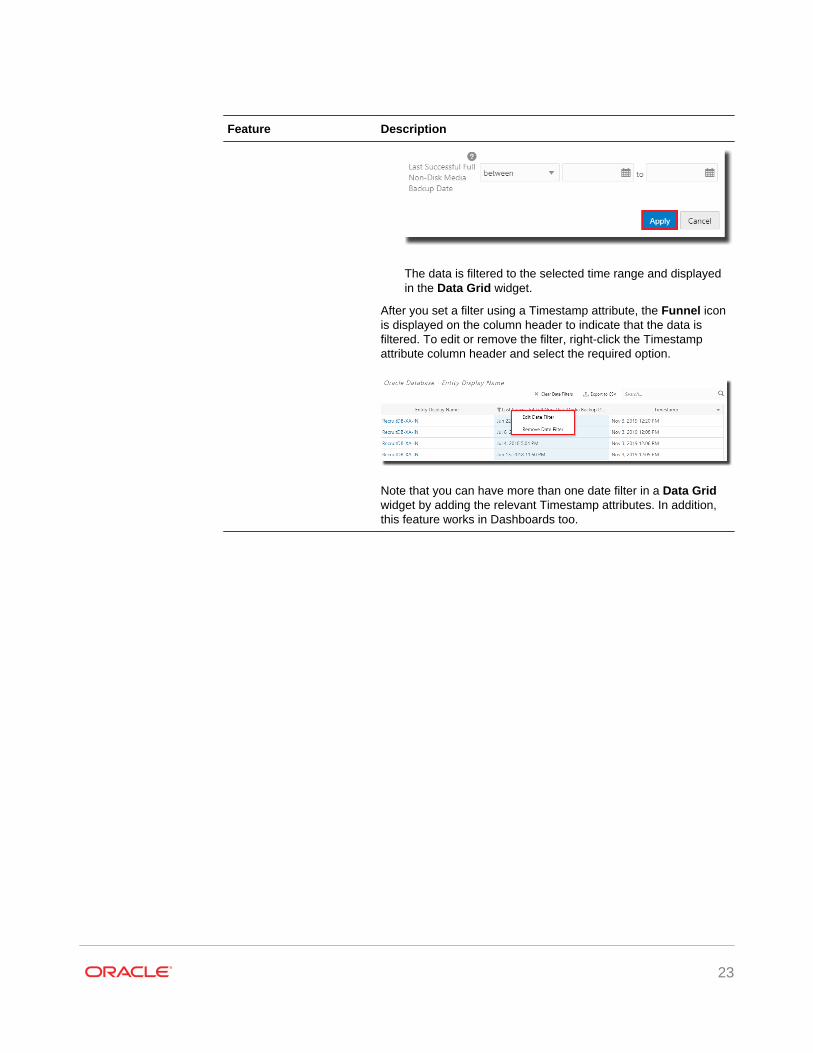
The data is filtered to the selected time range and displayedin the Data Grid widget.
After you set a filter using a Timestamp attribute, the Funnel iconis displayed on the column header to indicate that the data isfiltered. To edit or remove the filter, right-click the Timestampattribute column header and select the required option.
Note that you can have more than one date filter in a Data Gridwidget by adding the relevant Timestamp attributes. In addition,this feature works in Dashboards too.
23
Feature Description
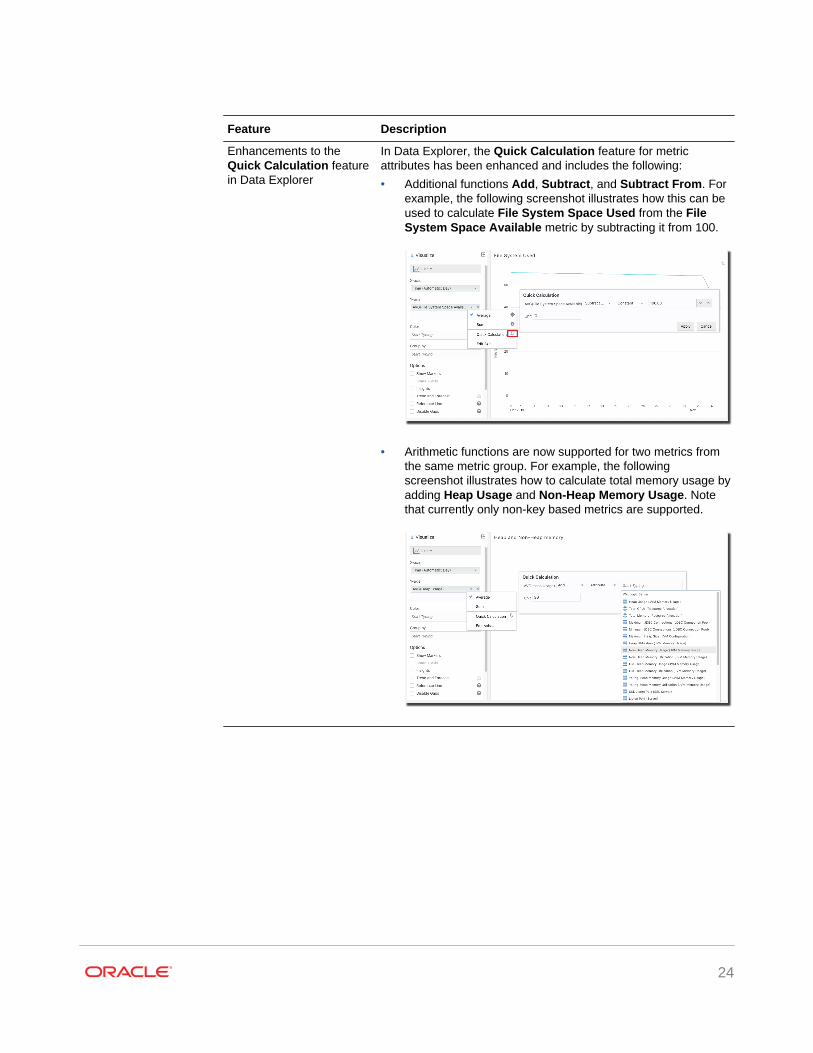
Enhancements to theQuick Calculation featurein Data Explorer
In Data Explorer, the Quick Calculation feature for metricattributes has been enhanced and includes the following:
• Additional functions Add, Subtract, and Subtract From. Forexample, the following screenshot illustrates how this can beused to calculate File System Space Used from the FileSystem Space Available metric by subtracting it from 100.
• Arithmetic functions are now supported for two metrics from
the same metric group. For example, the followingscreenshot illustrates how to calculate total memory usage byadding Heap Usage and Non-Heap Memory Usage. Notethat currently only non-key based metrics are supported.
24
Feature Description
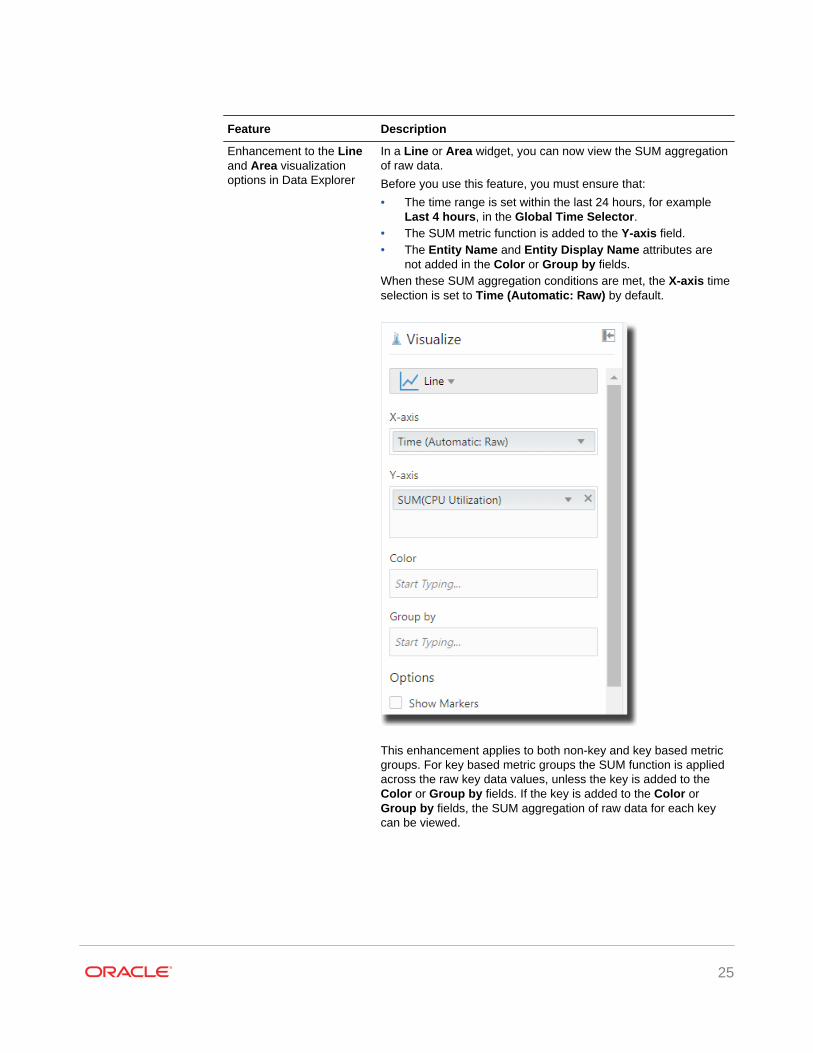
Enhancement to the Lineand Area visualizationoptions in Data Explorer
In a Line or Area widget, you can now view the SUM aggregationof raw data.
Before you use this feature, you must ensure that:
• The time range is set within the last 24 hours, for exampleLast 4 hours, in the Global Time Selector.
• The SUM metric function is added to the Y-axis field.• The Entity Name and Entity Display Name attributes are
not added in the Color or Group by fields.When these SUM aggregation conditions are met, the X-axis timeselection is set to Time (Automatic: Raw) by default.
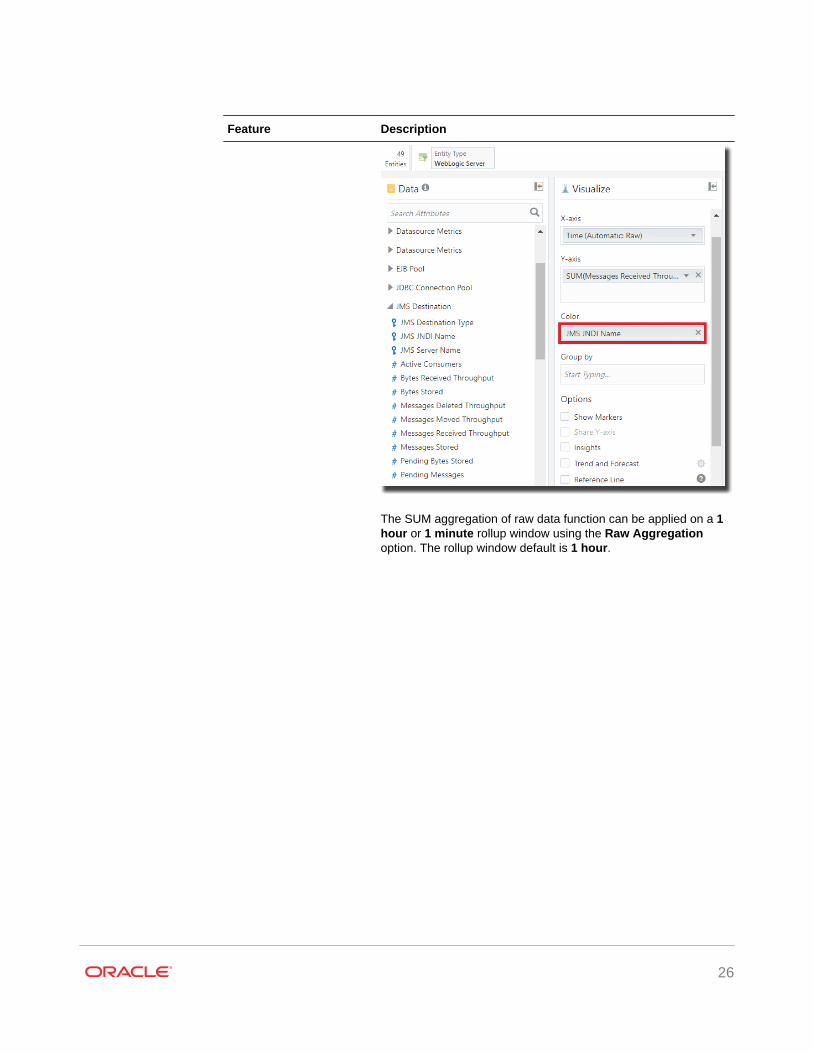
This enhancement applies to both non-key and key based metricgroups. For key based metric groups the SUM function is appliedacross the raw key data values, unless the key is added to theColor or Group by fields. If the key is added to the Color orGroup by fields, the SUM aggregation of raw data for each keycan be viewed.
25
Feature Description
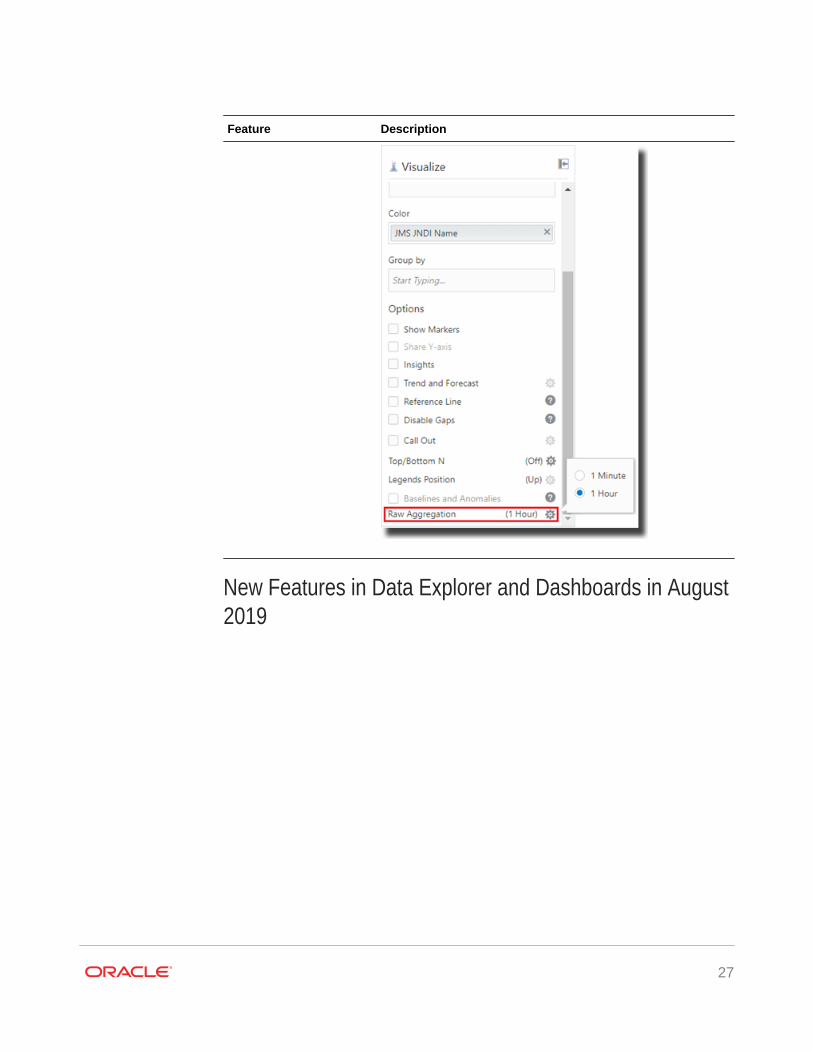
The SUM aggregation of raw data function can be applied on a 1hour or 1 minute rollup window using the Raw Aggregationoption. The rollup window default is 1 hour.
26
Feature Description
New Features in Data Explorer and Dashboards in August2019
27
Feature Description
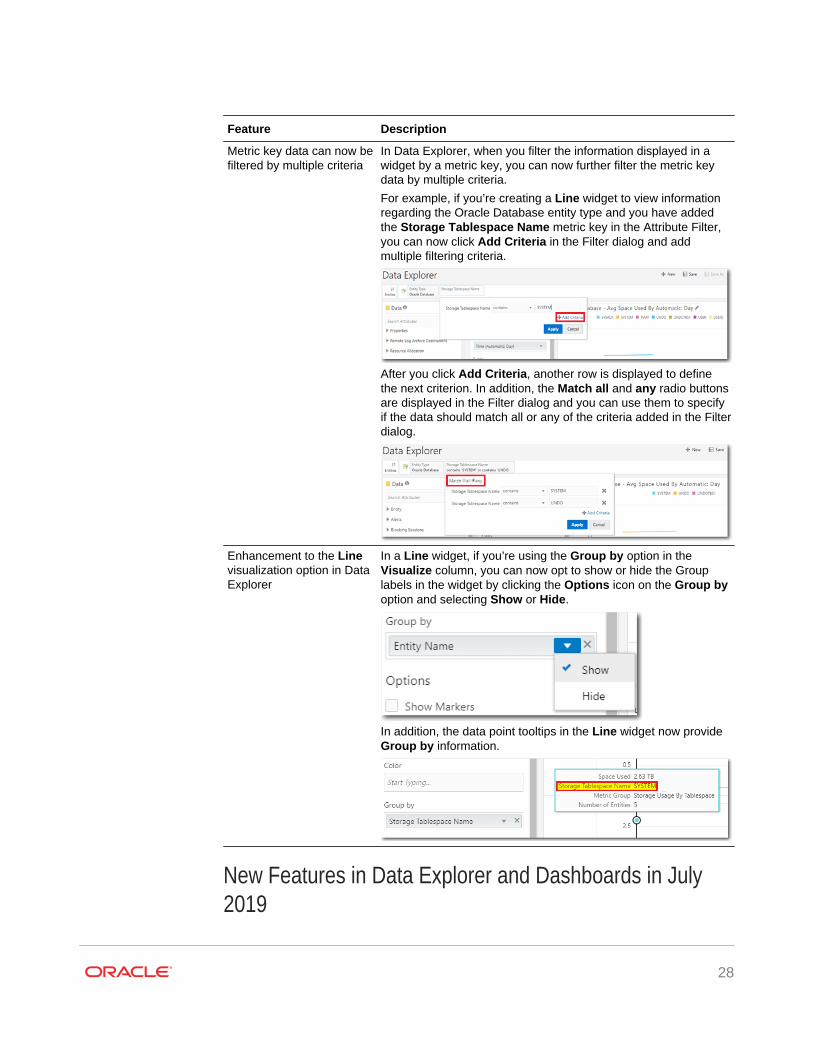
Metric key data can now befiltered by multiple criteria
In Data Explorer, when you filter the information displayed in awidget by a metric key, you can now further filter the metric keydata by multiple criteria.
For example, if you’re creating a Line widget to view informationregarding the Oracle Database entity type and you have addedthe Storage Tablespace Name metric key in the Attribute Filter,you can now click Add Criteria in the Filter dialog and addmultiple filtering criteria.
After you click Add Criteria, another row is displayed to definethe next criterion. In addition, the Match all and any radio buttonsare displayed in the Filter dialog and you can use them to specifyif the data should match all or any of the criteria added in the Filterdialog.
Enhancement to the Linevisualization option in DataExplorer
In a Line widget, if you’re using the Group by option in theVisualize column, you can now opt to show or hide the Grouplabels in the widget by clicking the Options icon on the Group byoption and selecting Show or Hide.
In addition, the data point tooltips in the Line widget now provideGroup by information.
New Features in Data Explorer and Dashboards in July2019
28
Feature Description
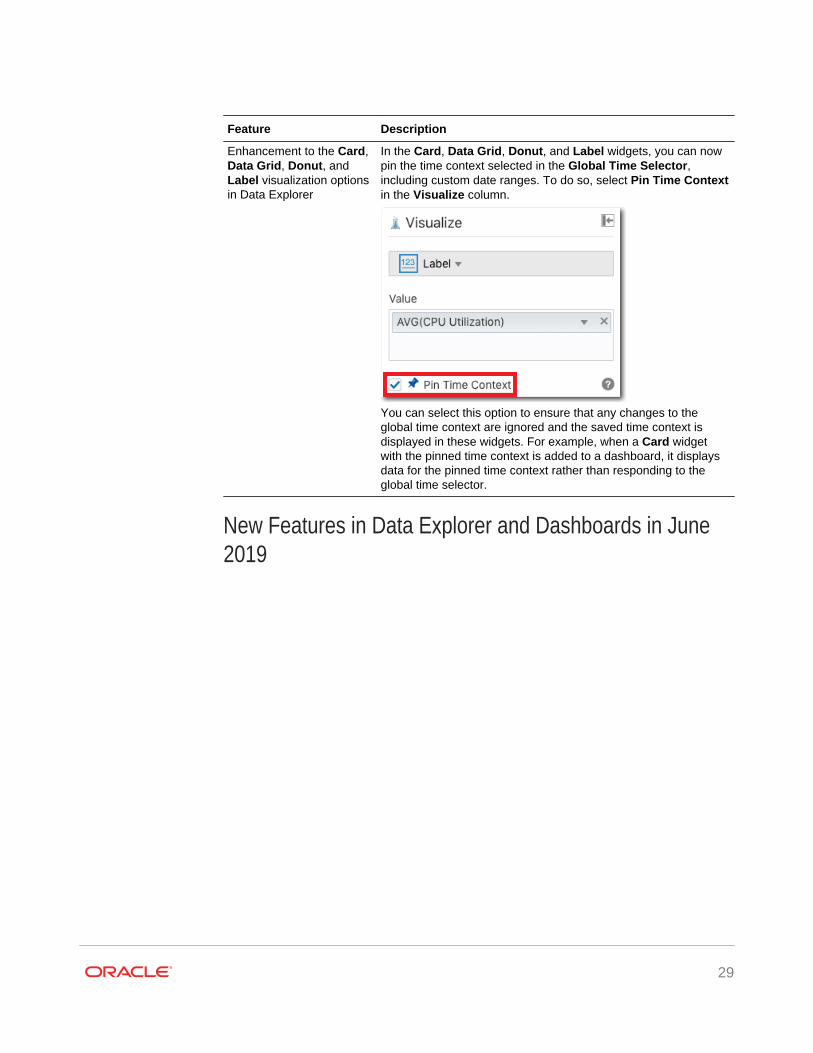
Enhancement to the Card,Data Grid, Donut, andLabel visualization optionsin Data Explorer
In the Card, Data Grid, Donut, and Label widgets, you can nowpin the time context selected in the Global Time Selector,including custom date ranges. To do so, select Pin Time Contextin the Visualize column.
You can select this option to ensure that any changes to theglobal time context are ignored and the saved time context isdisplayed in these widgets. For example, when a Card widgetwith the pinned time context is added to a dashboard, it displaysdata for the pinned time context rather than responding to theglobal time selector.
New Features in Data Explorer and Dashboards in June2019
29
Feature Description
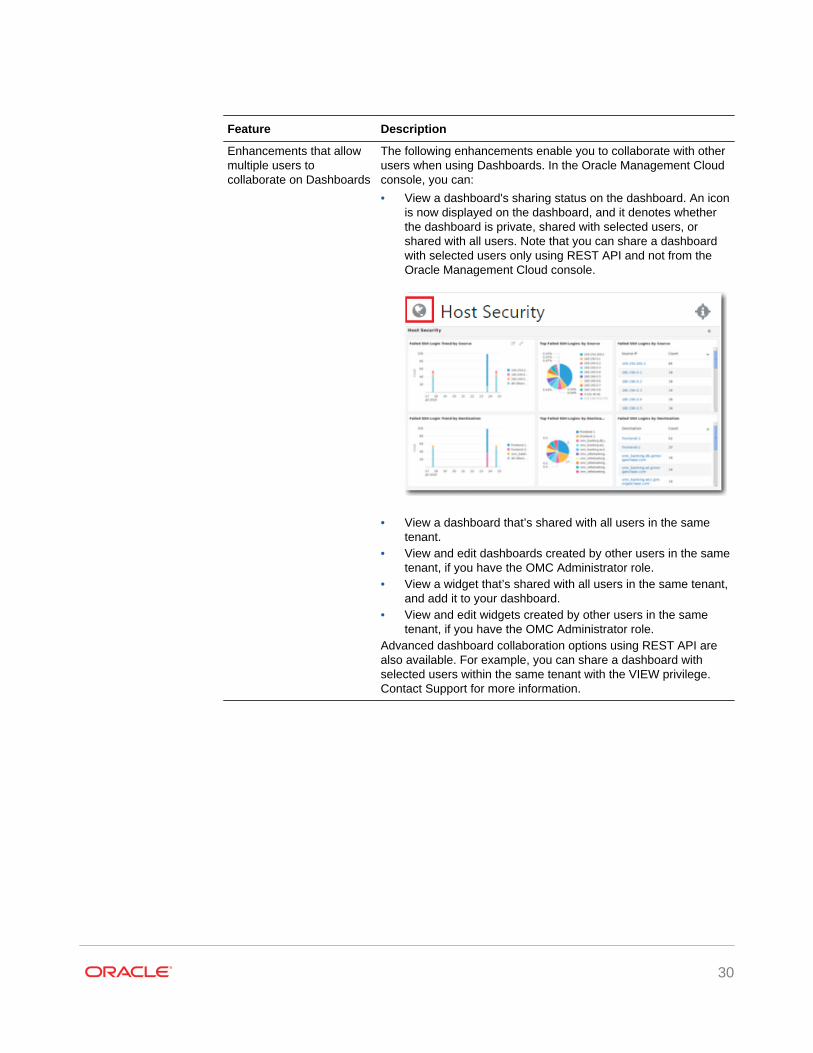
Enhancements that allowmultiple users tocollaborate on Dashboards
The following enhancements enable you to collaborate with otherusers when using Dashboards. In the Oracle Management Cloudconsole, you can:
• View a dashboard's sharing status on the dashboard. An iconis now displayed on the dashboard, and it denotes whetherthe dashboard is private, shared with selected users, orshared with all users. Note that you can share a dashboardwith selected users only using REST API and not from theOracle Management Cloud console.
• View a dashboard that’s shared with all users in the same
tenant.• View and edit dashboards created by other users in the same
tenant, if you have the OMC Administrator role.• View a widget that’s shared with all users in the same tenant,
and add it to your dashboard.• View and edit widgets created by other users in the same
tenant, if you have the OMC Administrator role.Advanced dashboard collaboration options using REST API arealso available. For example, you can share a dashboard withselected users within the same tenant with the VIEW privilege.Contact Support for more information.
30
Feature Description
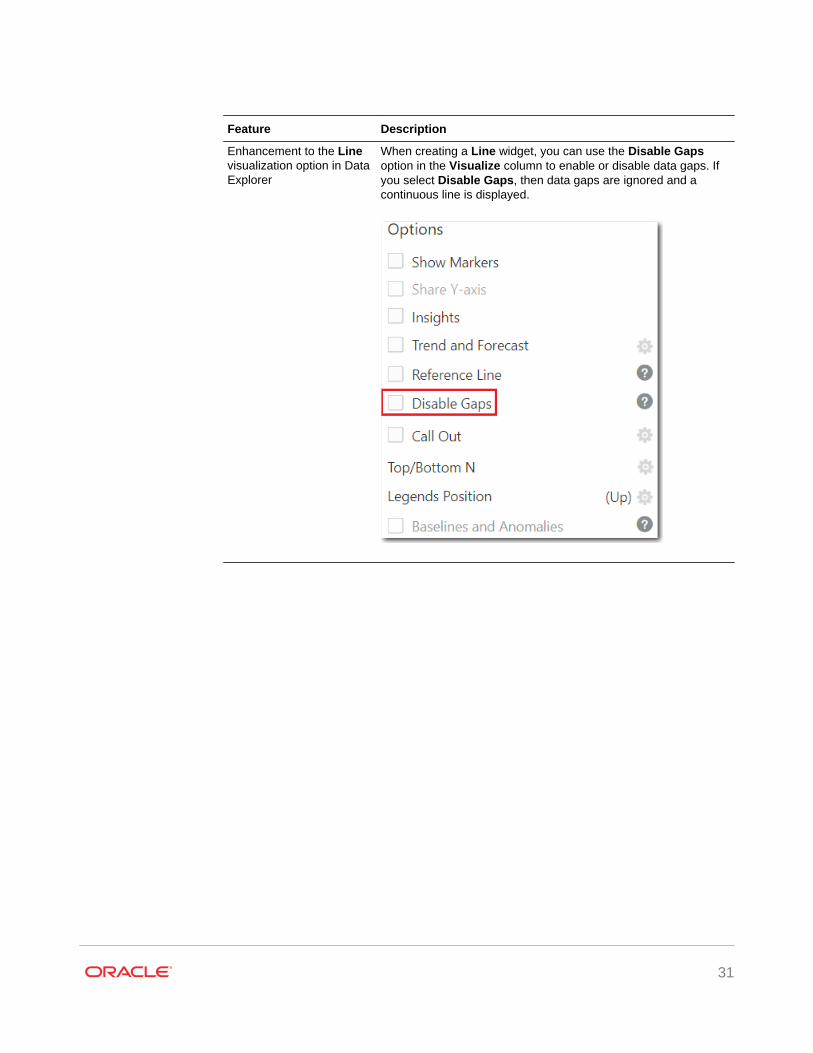
Enhancement to the Linevisualization option in DataExplorer
When creating a Line widget, you can use the Disable Gapsoption in the Visualize column to enable or disable data gaps. Ifyou select Disable Gaps, then data gaps are ignored and acontinuous line is displayed.
31
Feature Description
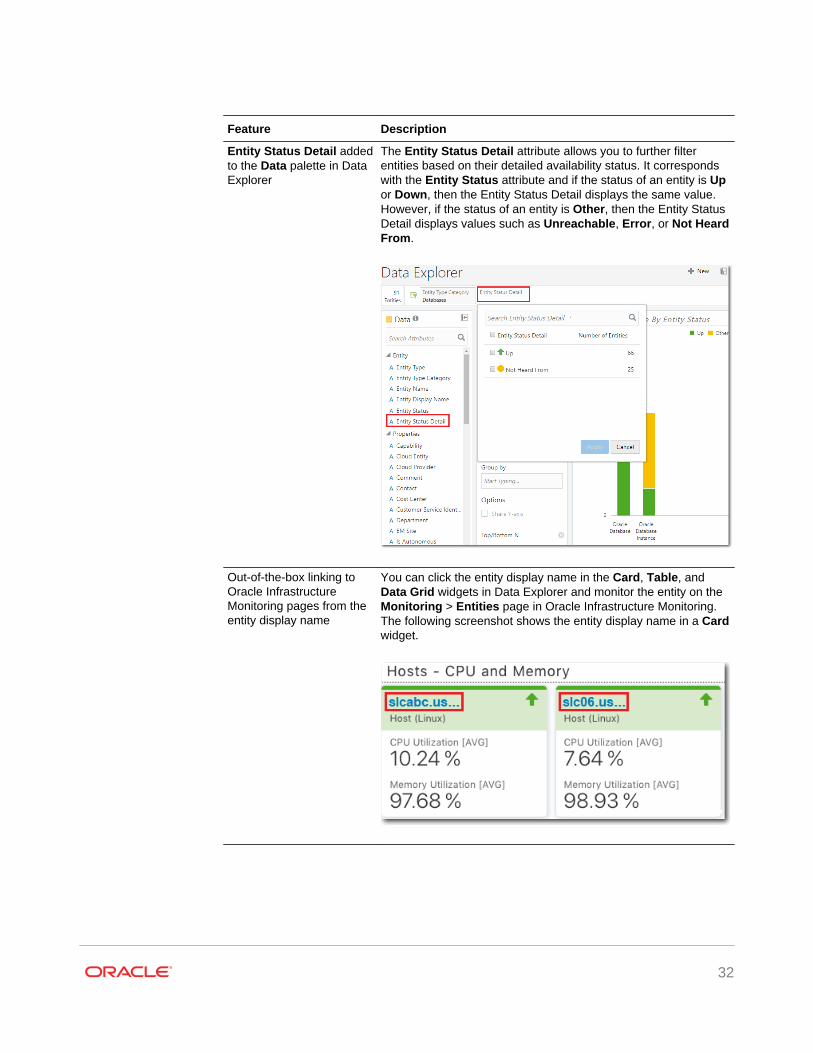
Entity Status Detail addedto the Data palette in DataExplorer
The Entity Status Detail attribute allows you to further filterentities based on their detailed availability status. It correspondswith the Entity Status attribute and if the status of an entity is Upor Down, then the Entity Status Detail displays the same value.However, if the status of an entity is Other, then the Entity StatusDetail displays values such as Unreachable, Error, or Not HeardFrom.
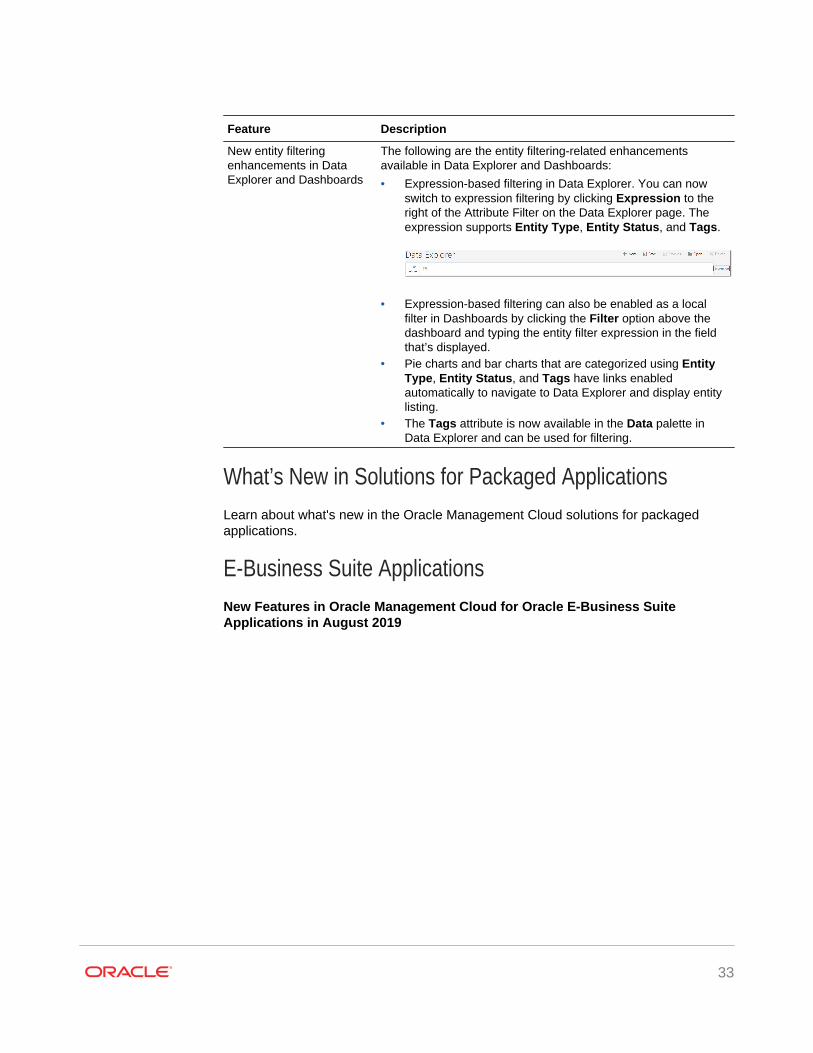
Out-of-the-box linking toOracle InfrastructureMonitoring pages from theentity display name
You can click the entity display name in the Card, Table, andData Grid widgets in Data Explorer and monitor the entity on theMonitoring > Entities page in Oracle Infrastructure Monitoring.The following screenshot shows the entity display name in a Cardwidget.
32
Feature Description
New entity filteringenhancements in DataExplorer and Dashboards
The following are the entity filtering-related enhancementsavailable in Data Explorer and Dashboards:
• Expression-based filtering in Data Explorer. You can nowswitch to expression filtering by clicking Expression to theright of the Attribute Filter on the Data Explorer page. Theexpression supports Entity Type, Entity Status, and Tags.
• Expression-based filtering can also be enabled as a local
filter in Dashboards by clicking the Filter option above thedashboard and typing the entity filter expression in the fieldthat’s displayed.
• Pie charts and bar charts that are categorized using EntityType, Entity Status, and Tags have links enabledautomatically to navigate to Data Explorer and display entitylisting.
• The Tags attribute is now available in the Data palette inData Explorer and can be used for filtering.
What’s New in Solutions for Packaged ApplicationsLearn about what's new in the Oracle Management Cloud solutions for packagedapplications.
E-Business Suite ApplicationsNew Features in Oracle Management Cloud for Oracle E-Business SuiteApplications in August 2019
33
Feature Description
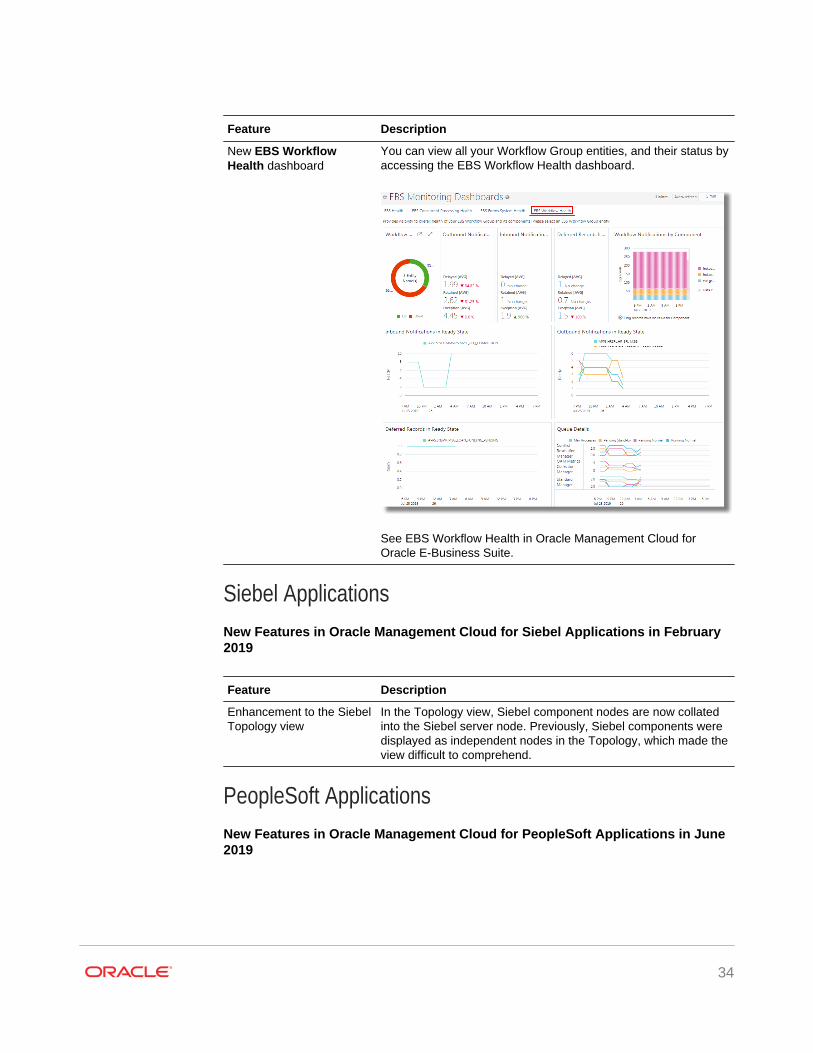
New EBS WorkflowHealth dashboard
You can view all your Workflow Group entities, and their status byaccessing the EBS Workflow Health dashboard.
See EBS Workflow Health in Oracle Management Cloud forOracle E-Business Suite.
Siebel ApplicationsNew Features in Oracle Management Cloud for Siebel Applications in February2019
Feature Description
Enhancement to the SiebelTopology view
In the Topology view, Siebel component nodes are now collatedinto the Siebel server node. Previously, Siebel components weredisplayed as independent nodes in the Topology, which made theview difficult to comprehend.
PeopleSoft ApplicationsNew Features in Oracle Management Cloud for PeopleSoft Applications in June2019
34
Feature Description
Elasticsearch discovery isintegrated with PeopleSoft
You can now choose to discover Elasticsearch entity withPeopleSoft by providing the user credentials. The discovery of thePeopleSoft composite entity can be performed through the userconsole or with omcli.
See step 8 in Discover a PeopleSoft Application with the Consoleand Discover a PeopleSoft Application with omcli in OracleManagement Cloud for PeopleSoft.
Upload custom SSLcertificate to the cloudagent trust store
If you're using a custom SSL certificate, then obtain the certificateand use omcli to add it to the cloud agent trust store.
In the releases prior to June 2019, the certificate was loaded tothe JRE trust store, and each time again after the agent update.As of June 2019, you can directly upload the certificate to theagent trust store. Since the agent trust store is maintained duringagent update, you will not be required to refresh the agent truststore with the certificate after the update.
See Enable Monitoring of the PeopleSoft Process Monitor inOracle Management Cloud for PeopleSoft.
What’s New in Oracle OrchestrationLearn about what's new in Oracle Orchestration.
New Features in Oracle Orchestration in August 2019
Feature Description
Remediation ActionWorkflow Creation andSubmission
With Oracle Orchestration you can automate remediation actionsusing workflows. This allows for your environment to automaticallyrespond to alerts or events, helping prevent or fix problems.
See Remediation Action Workflow Creation and Submission inUsing Oracle Orchestration.
New Features in Oracle Orchestration in April 2019
Feature Description
JSON Data Passing andData Extraction
Oracle Orchestration can now recover the output produced from aworkflow in variable form.
See Workflow Variables and Data Passing in Using OracleOrchestration.
Tracking for NestedWorkflows
You can now view specific metric and execution details for aNested Workflow in the Execution Details section.
See Monitor a Workflow Submission in Using OracleOrchestration.
New Features in Oracle Orchestration in March 2019
35
Feature Description
Nested Workflows A parent workflow can now call a child or nested workflow with itsown workers and steps, allowing for complex workflows to beexecuted.
See Author Workflows Using V2.0 Syntax in Using OracleOrchestration.
Documentation Accessibility
For information about Oracle's commitment to accessibility, visit the OracleAccessibility Program website at http://www.oracle.com/pls/topic/lookup?ctx=acc&id=docacc.
Access to Oracle SupportOracle customers that have purchased support have access to electronic supportthrough My Oracle Support. For information, visit http://www.oracle.com/pls/topic/lookup?ctx=acc&id=info or visit http://www.oracle.com/pls/topic/lookup?ctx=acc&id=trsif you are hearing impaired.
Oracle® Cloud What's New in Oracle Management Cloud,E72223-56
Copyright © 2016, 2020, Oracle and/or its affiliates. All rights reserved.
Documentation for Oracle Management Cloud users and administrators that describes the new and changed features in various services of Oracle Management Cloud.
This software and related documentation are provided under a license agreement containing restrictions on use and disclosure and are protected by intellectual property laws.Except as expressly permitted in your license agreement or allowed by law, you may not use, copy, reproduce, translate, broadcast, modify, license, transmit, distribute, exhibit,perform, publish, or display any part, in any form, or by any means. Reverse engineering, disassembly, or decompilation of this software, unless required by law forinteroperability, is prohibited.
The information contained herein is subject to change without notice and is not warranted to be error-free. If you find any errors, please report them to us in writing.
If this is software or related documentation that is delivered to the U.S. Government or anyone licensing it on behalf of the U.S. Government, then the following notice isapplicable:
U.S. GOVERNMENT END USERS: Oracle programs (including any operating system, integrated software, any programs embedded, installed or activated on deliveredhardware, and modifications of such programs) and Oracle computer documentation or other Oracle data delivered to or accessed by U.S. Government end users are"commercial computer software" or “commercial computer software documentation” pursuant to the applicable Federal Acquisition Regulation and agency-specific supplementalregulations. As such, the use, reproduction, duplication, release, display, disclosure, modification, preparation of derivative works, and/or adaptation of i) Oracle programs(including any operating system, integrated software, any programs embedded, installed or activated on delivered hardware, and modifications of such programs), ii) Oraclecomputer documentation and/or iii) other Oracle data, is subject to the rights and limitations specified in the license contained in the applicable contract. The terms governing theU.S. Government’s use of Oracle cloud services are defined by the applicable contract for such services. No other rights are granted to the U.S. Government.
This software or hardware is developed for general use in a variety of information management applications. It is not developed or intended for use in any inherently dangerousapplications, including applications that may create a risk of personal injury. If you use this software or hardware in dangerous applications, then you shall be responsible to takeall appropriate fail-safe, backup, redundancy, and other measures to ensure its safe use. Oracle Corporation and its affiliates disclaim any liability for any damages caused byuse of this software or hardware in dangerous applications.
Oracle and Java are registered trademarks of Oracle and/or its affiliates. Other names may be trademarks of their respective owners.
Intel and Intel Inside are trademarks or registered trademarks of Intel Corporation. All SPARC trademarks are used under license and are trademarks or registered trademarksof SPARC International, Inc. AMD, Epyc, and the AMD logo are trademarks or registered trademarks of Advanced Micro Devices. UNIX is a registered trademark of The OpenGroup.
This software or hardware and documentation may provide access to or information about content, products, and services from third parties. Oracle Corporation and its affiliatesare not responsible for and expressly disclaim all warranties of any kind with respect to third-party content, products, and services unless otherwise set forth in an applicableagreement between you and Oracle. Oracle Corporation and its affiliates will not be responsible for any loss, costs, or damages incurred due to your access to or use of third-party content, products, or services, except as set forth in an applicable agreement between you and Oracle.
36