Embed Size (px)
Citation preview

What’s Happening in FSA – What’s Happening in FSA – An UpdateAn Update
Claire “Micki” RoemerGeneral Manager, School Services and Training Channel
Dallas, TexasMarch 6, 2005
2
What’s HappeningWhat’s Happening
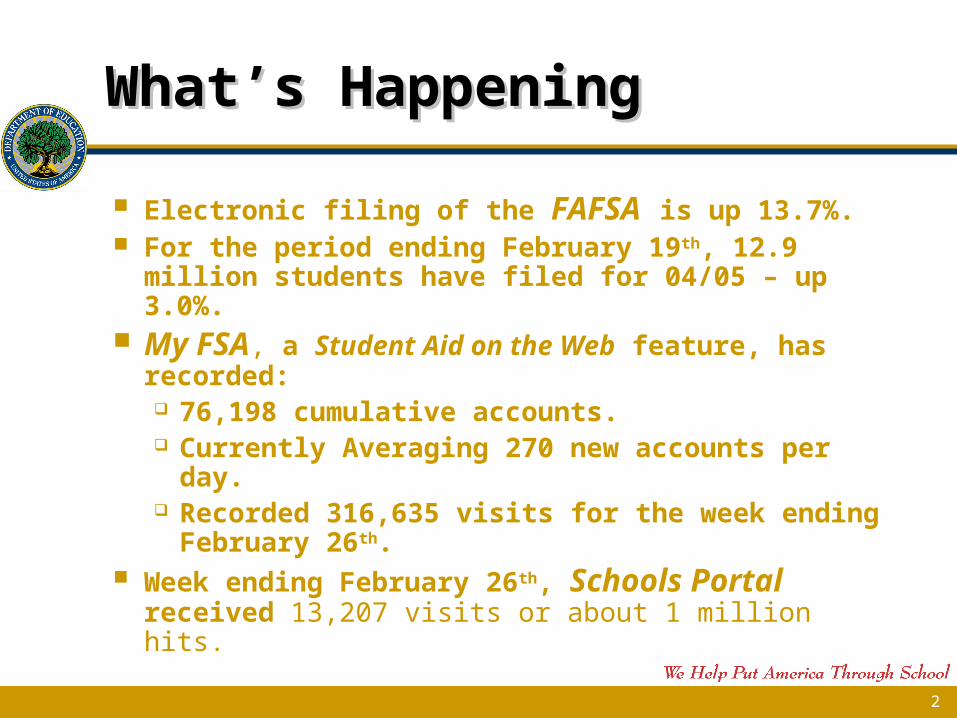
Electronic filing of the FAFSA is up 13.7%. For the period ending February 19th, 12.9 million
students have filed for 04/05 – up 3.0%. My FSA, a Student Aid on the Web feature, has
recorded: 76,198 cumulative accounts. Currently Averaging 270 new accounts per
day. Recorded 316,635 visits for the week ending
February 26th. Week ending February 26th, Schools Portal
received 13,207 visits or about 1 million hits.
3
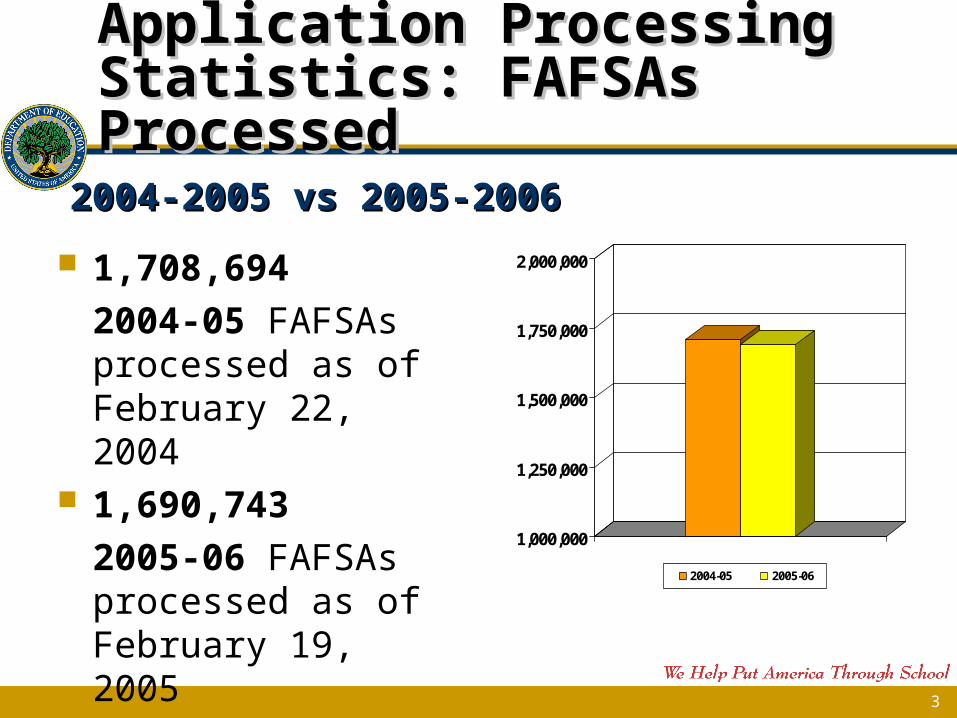
1,708,694
2004-05 FAFSAs processed as of February 22, 2004
1,690,743
2005-06 FAFSAs processed as of February 19, 2005
1,000,000
1,250,000
1,500,000
1,750,000
2,000,000
2004-05 2005-06
Application Processing Application Processing Statistics: FAFSAs ProcessedStatistics: FAFSAs Processed
2004-2005 vs 2005-20062004-2005 vs 2005-2006
4
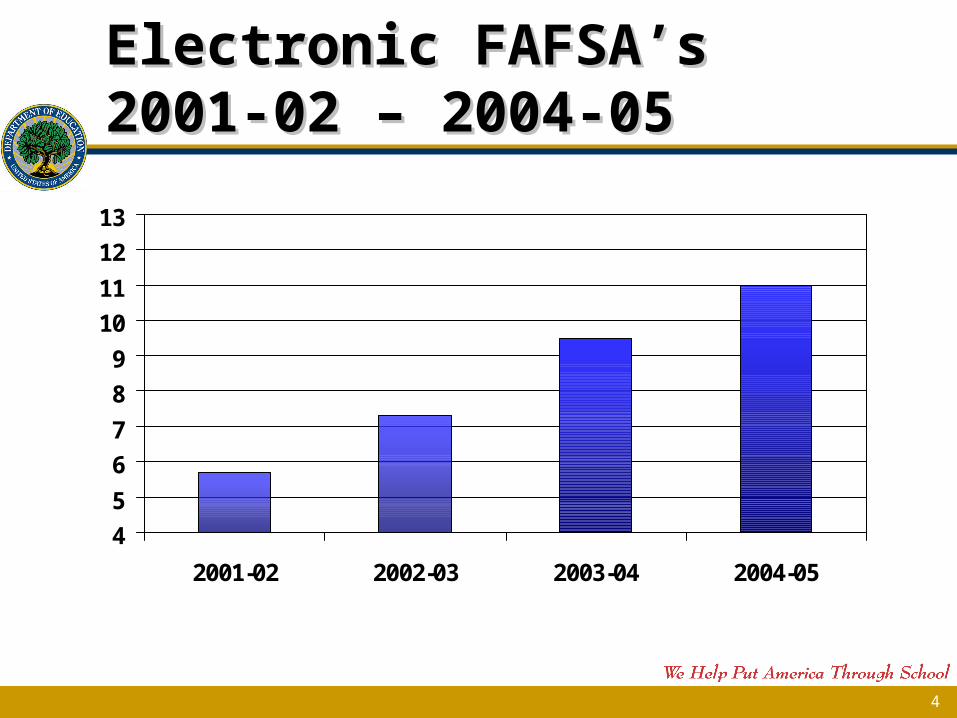
Electronic FAFSA’sElectronic FAFSA’s2001-02 – 2004-052001-02 – 2004-05
4
5
6
7
8
9
10
11
12
13
2001-02 2002-03 2003-04 2004-05
5
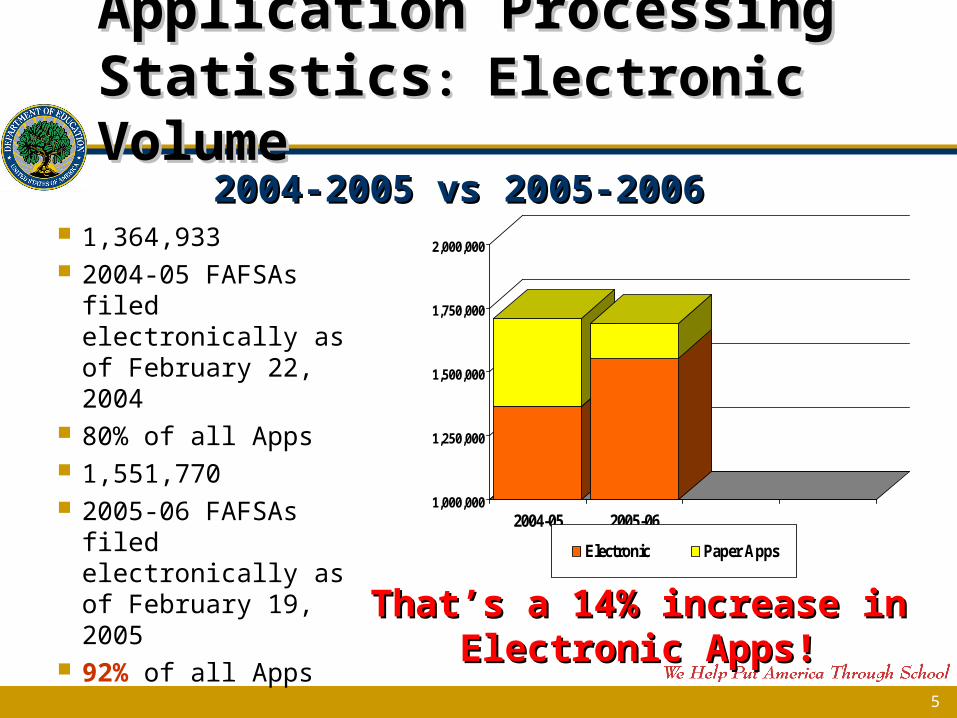
Application Processing Application Processing StatisticsStatistics: : Electronic VolumeElectronic Volume
1,364,933 2004-05 FAFSAs
filed electronically as of February 22, 2004
80% of all Apps 1,551,770 2005-06 FAFSAs
filed electronically as of February 19, 2005
92% of all AppsThat’s a 14% increase in That’s a 14% increase in
Electronic Apps!Electronic Apps!
1,000,000
1,250,000
1,500,000
1,750,000
2,000,000
2004-05 2005-06
Electronic Paper Apps
2004-2005 vs 2005-20062004-2005 vs 2005-2006
6
The Funds Continue to FlowThe Funds Continue to Flow
For the 04-05 year through mid-February:
Pell and Direct Loan disbursements reached $10.5 billion and $9.9 billion respectively.
FFEL disbursements reached $23.7 billion.

7
Pell Volume by Academic YearPell Volume by Academic Year
$7.2 B
$12.7 B
0
2
4
6
8
10
12
$ B
illio
n
1999-00 2000-01 2001-02 2002-03 2003-04
14

8
Pell Volume by School Type Pell Volume by School Type Academic Year 2003-04Academic Year 2003-04
Private$2.1 B17%
Proprietary$2.1 B16%
Public$8.5 B67%
Total = $12.7 Billion
9
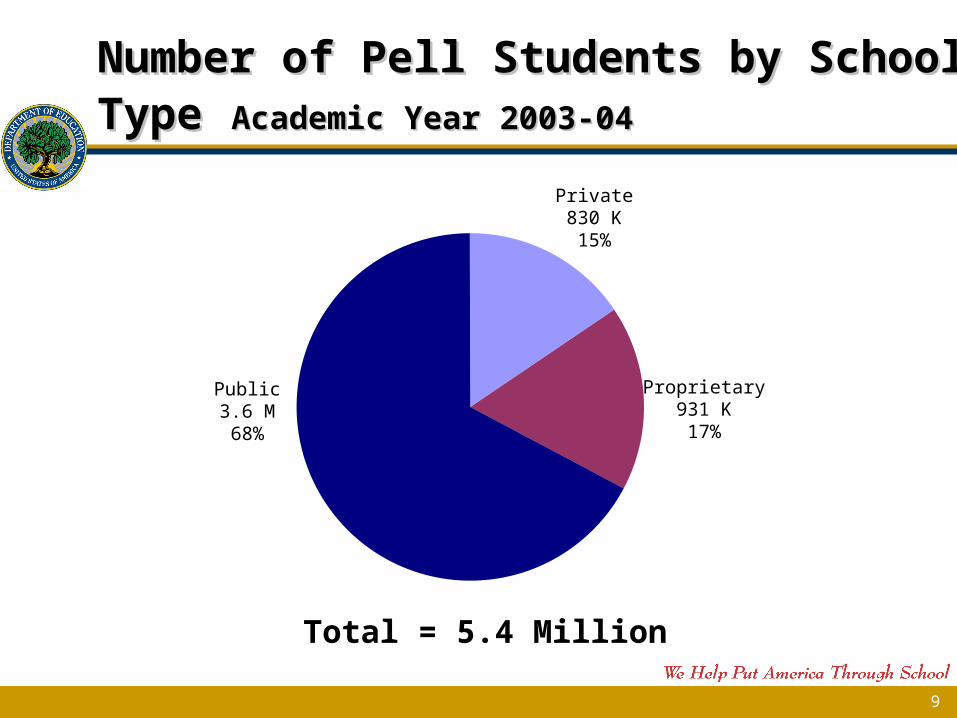
Number of Pell Students by School TypeNumber of Pell Students by School Type Academic Year 2003-04Academic Year 2003-04
Private830 K15%
Proprietary931 K17%
Public3.6 M68%
Total = 5.4 Million

10
Number of Pell Schools by School TypeNumber of Pell Schools by School Type Academic Year 2003-2004Academic Year 2003-2004
Private1,52930%
Proprietary1,84435%
Public1,77935%
Total = 5,152 Schools

11
Pell Proprietary Volume by StatePell Proprietary Volume by State Academic Year 2003-04Academic Year 2003-04
All Other States$1.9 B91%
TX$140.5 M
7%
OK$19.3 M
1%
LA$25.6 M1%
AR$4.9 M
0%
NM$2.4 M
0%
Total = $2.1 Billion

12
Number of Pell Proprietary Schools by StateNumber of Pell Proprietary Schools by State Academic Year 2003-04Academic Year 2003-04
All Other States1,57786%
TX1408%
OK352%
NM8
0%
LA603%
AR241%
Total = 1,844 Schools

13
Loan Volume by Academic YearLoan Volume by Academic Year
$35.9 B$55.9 B
*Based on gross commitments.
0
10
20
30
40
50
$ B
illio
n
1999-00 2000-01 2001-02 2002-03 2003-04
60
14
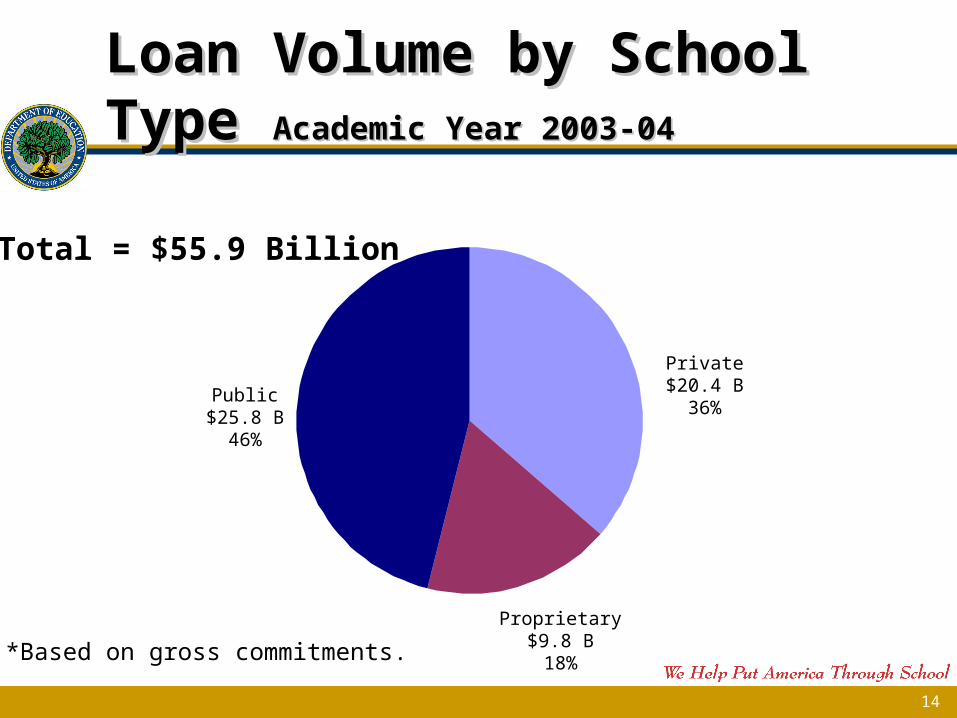
Loan Volume by School Type Loan Volume by School Type Academic Year 2003-04Academic Year 2003-04
Private$20.4 B
36%
Proprietary$9.8 B18%
Public$25.8 B
46%
Total = $55.9 Billion
*Based on gross commitments.

15
Number of Student Borrowers by School TypeNumber of Student Borrowers by School Type Academic Year 2003-04Academic Year 2003-04
Total = 6.9 Million
Private2.0 M29%
Proprietary1.4 M20%
Public3.5 M51%
*Based on gross commitments.

16
Number of DL and FFEL Schools by School Type Number of DL and FFEL Schools by School Type Academic Year 2003-04Academic Year 2003-04
Private1,74533%
Proprietary1,58130%
Public1,90137%
Total = 5,227 Schools*Based on gross commitments.

17
Proprietary Loan Volume by StateProprietary Loan Volume by State Academic Year 2003-04Academic Year 2003-04
NM$13.1
M0%
LA$45.9
M0%
TX$362.3
M4%
All Other States$9.3 B95%
Total = $9.8 Billion
AR$3.5 M0%
OK$52.6
M1%
*Based on gross commitments.

18
Number of DL and FFEL Proprietary Schools by StateNumber of DL and FFEL Proprietary Schools by State Academic Year 2003-04Academic Year 2003-04
All Other States1,40289%
TX1016%
OK282%
NM7
0%
LA342%
AR9
1%
Total = 1,581 Schools*Based on gross commitments.

19
Campus-Based Volume by Campus-Based Volume by Academic YearAcademic Year
$2.9 B$3.8 B
0
0.5
1
1.5
2
2.5
3
3.5
4
$ B
illio
n
1999-00 2000-01 2001-02 2002-03 2003-04

20
Campus-Based Volume by School Type Campus-Based Volume by School Type Academic Year 2003-04Academic Year 2003-04
Total = $3.8 Billion
Private$1.8 B46%
Proprietary$214 M
6%
Public$1.8 B48%

21
Number of Students Receiving Campus-Number of Students Receiving Campus-Based Funds by School TypeBased Funds by School TypeAcademic Year 2003-04
Private1.1 M37%
Proprietary329 K11%
Public1.5 M52%
Total = 2.9 Million

22
Number of Campus-Based Schools by Number of Campus-Based Schools by School Type School Type Academic Year 2003-04Academic Year 2003-04
Private1,40436%
Proprietary97025%
Public1,51739%
Total = 3,891 Schools
Proprietary97025%

23
Campus-Based Proprietary Volume by State Academic Year 2003-04
All Other States
$201.9 M94%
TX$9.0 M
4%
OK$1.4
M1%
LA$2.1
M1%
AR$33 K
0%
NM$27 K
0%
Total = $214 Million

24
Number of Campus-Based Proprietary Number of Campus-Based Proprietary Schools by StateSchools by StateAcademic Year 2003-04Academic Year 2003-04
All Other States
86089%
TX677%
OK9
1%
LA293%
AR3
0%
NM2
0%
Total = 970 Schools

25
How to be Better at What You DoHow to be Better at What You Do
Provide Training Opportunities for Staff Keep up with Changes
Subscribe to IFAP Read COD Daily update
www.cod.ed.gov Talk to Colleagues

26
Online TrainingOnline Training
EDExpress Basics Web-based Training FAA Assessments
Under “Tools for Schools” www.ifap.ed.gov/IFAPWebApp/index.jsp
COD Computer Based Training www.cod.ed.gov
FSA COACH www.ed.gov/fsacoach
27
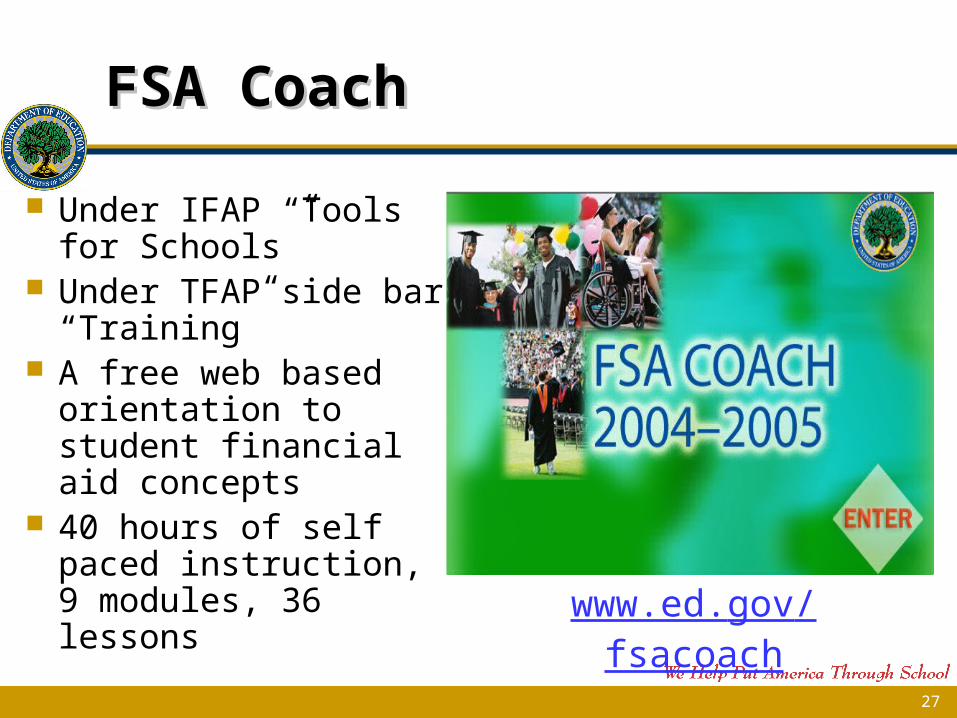
FSA CoachFSA Coach
Under IFAP “Tools for Schools”
Under TFAP side bar “Training”
A free web based orientation to student financial aid concepts
40 hours of self paced instruction, 9 modules, 36 lessons www.ed.gov/fsacoach

28
Training OpportunitiesTraining Opportunities
Electronic Applications training: March-April 2005
Career College Day: March 21, 2005 Spring Conference 2005: March 22-24 Spring Conference 2006: April 5 - 7 Fundamentals of Title IV Administration To Register, Go to: http://www.ed.gov
/offices/OSFAP/training/
newfaps.html - fundamentals

29
Training OpportunitiesTraining Opportunities
Fundamentals of Title IV Administration
To register, go to: www.ed.gov/offices/OSFAP/training/newfaps.html#fundamentals
30
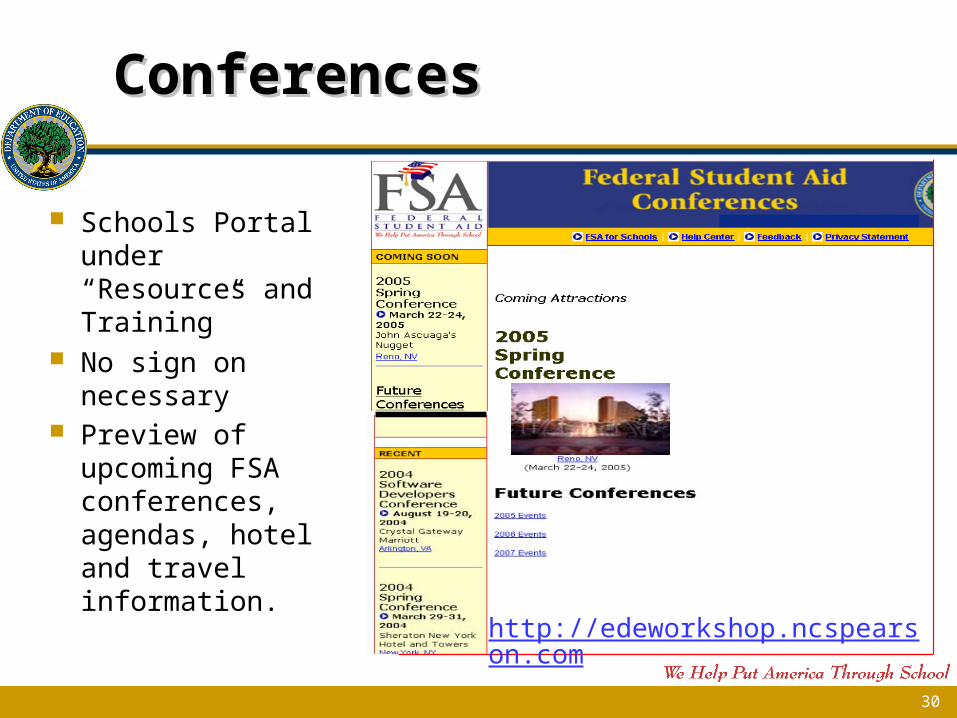
ConferencesConferences
Schools Portal under “Resources and Training”
No sign on necessary
Preview of upcoming FSA conferences, agendas, hotel and travel information. http://edeworkshop.ncspearson.com

31
Future TrainingFuture Training
Spring 2005: Getting It Right! Topics identified from audits and Program review findings
Fall 2005: Fiscal Officer Training EAC Conferences:
San Diego,CA: October 30-November 2, 2005 Atlanta, GA: November 29-December 2, 2005

32
COD Update – Frequent COD Update – Frequent ConcernConcern
Password Maintenance
–Security administrator
»Who is the right person?
»How many should you have?

33
COD Password UpdateCOD Password Update
Why you need a Password Reset You received a temporary password as the system
administrator and you failed to change the temporary password within 24 hours.
You did not access the COD website for 6 consecutive months after your first visit.
You did not access the COD website for over 3 consecutive months following the last visit and you have been in the website more than one other previous time.

34
School User Access

35
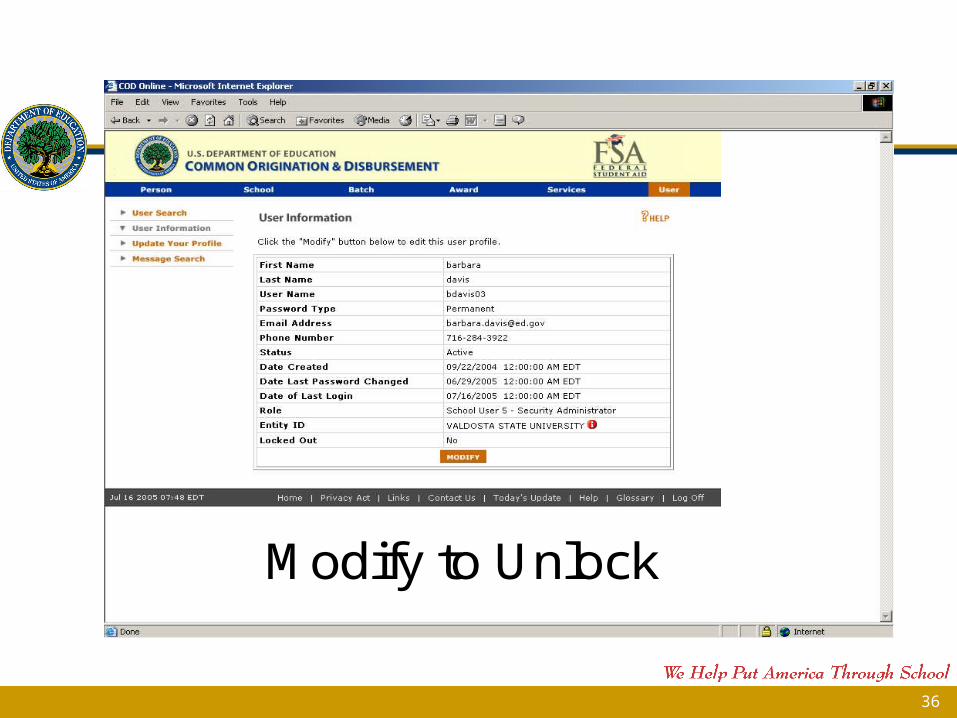
Unlocking a User as the System Administrator
36
Modify to Unlock

37
Bulletin to FollowBulletin to Follow
It will address: Resetting the Password Password Security Deactivating/Reactivating a User

38
QuestionsQuestions
Contact Information:
Claire M. Roemer
Email: [email protected]
Phone: (202) 377-3452


![[John E. Roemer] Theories of Distributive Justice(BookZZ.org)](https://img.pdfslide.us/doc/110x75/55cf8ed0550346703b95e1c2/john-e-roemer-theories-of-distributive-justicebookzzorg.jpg)