Embed Size (px)
DESCRIPTION
- Cover crop interseeding research in New York - Estimating Fall N Uptake by Winter Cereals Seeded as Cover or Double Crops after Corn Silage Harvest - Why Did Organic Compared with Conventional Corn Yield ~30% Lower During the First Transition Year? - No-Till Organic Wheat Continues to Have Low Weed Densities in Early Spring (March 31) at the Tillering Stage (GS 2-3) - Water Quality Impacts Reduced with Adapt-N Recommendations
Citation preview
What's Cropping Up?A NEWSLETTER FOR NEW YORK FIELD CROPS & SOILS VOLUME 26, NUMBER 2 Mar./Apr. 2016
Cover Crop Interseeding Research in New York
Brian Caldwell, Chris Pelzer, and Matthew RyanSoil and Crop Sciences Section – School of Integrated Plant Science, Cornell University
Cover CropsCover Crop I nterseeding R esearch in New York ... . . . . . . . . . . . . . . . . . . . . . . . . . . . . . . . . . . . . . . . . . . . . . . . . . . . . . . 15 - 19
Nutrient ManagementEstimating Fal l N Uptake by Winter Cereals S e e d e d a s C o v e r o r D o u b l e C r o p s a f t e r Corn Silage Harvest .................................... 20 - 22
Water Quality Impacts Reduced with Adapt-N Recommendations .................................... 29 - 31
Crop ManagementWhy Did Organic Compared with Conventional Co r n Yi e l d ~ 3 0 % Lo we r D u r i n g t h e Fi r s t Transition Year? .. . . . . . . . . . . . . . . . . . . . . . . . . . . . . . . . . . . 23 - 26
N o -Ti l l O rg a n i c Wh e at Co nt i n u e s to H ave Low Weed Densities in Early Spring (March 31) at the Tillering Stage (GS 2-3) ................. 27 - 28
of nitrogen in the soil, protecting soil from erosion, and adding organic matter.
Previous research was done in New York State using other methods of interseeding into corn (Scott et al. 1987) and soybeans (Hively and Cox 2001). See also http://mysare.sare.org/wp-content/uploads/917698final.pdf. Results were promising, but problems remained with inconsistent cover crop establishment (Jane Mt. Pleasant, personal communication). Although drilling cover crops with the InterSeeder has potential to increase consistency of establishment so that cover crop benefits are achieved, there are a number of questions about the best way to implement this practice. Optimal seeding dates, cover crop species, varieties, mixtures, and soil nutrient levels have yet to
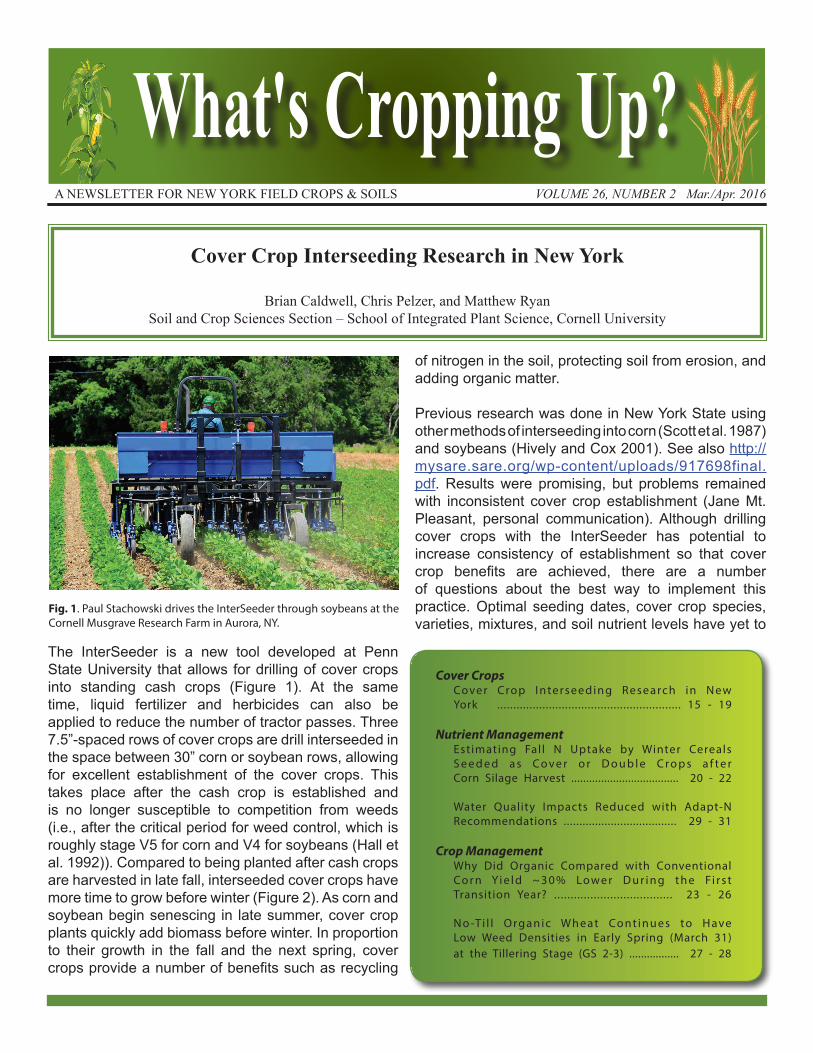
The InterSeeder is a new tool developed at Penn State University that allows for drilling of cover crops into standing cash crops (Figure 1). At the same time, liquid fertilizer and herbicides can also be applied to reduce the number of tractor passes. Three 7.5”-spaced rows of cover crops are drill interseeded in the space between 30” corn or soybean rows, allowing for excellent establishment of the cover crops. This takes place after the cash crop is established and is no longer susceptible to competition from weeds (i.e., after the critical period for weed control, which is roughly stage V5 for corn and V4 for soybeans (Hall et al. 1992)). Compared to being planted after cash crops are harvested in late fall, interseeded cover crops have more time to grow before winter (Figure 2). As corn and soybean begin senescing in late summer, cover crop plants quickly add biomass before winter. In proportion to their growth in the fall and the next spring, cover crops provide a number of benefits such as recycling
Fig. 1. Paul Stachowski drives the InterSeeder through soybeans at the Cornell Musgrave Research Farm in Aurora, NY.
What’s Cropping Up? Vol. 26. No. 2 Pg. 16
be determined. Here we report on field experiments in NYS over the past two years.
On-farm cover crop interseeding trialsIn 2013 and 2014, several trials were conducted in at four on-farm sites and at the Cornell Musgrave Research Farm. Five treatments consisting of two annual ryegrass varieties, tillage radish, a legume mix (hairy vetch, red clover, and crimson clover), and ryegrass + legume mix were interseeded into corn. Roundup Ready corn was used at all locations and glyphosate was applied to control weeds prior to interseeding.
Interseeded tillage radish was grown in two trials only. It produced 100-500 dry lb/acre of biomass in the fall and was killed over the winter. Performance of annual ryegrass and mixes was variable. In general, fall cover crop dry biomass was less than 700 lb/acre. In the following spring, legumes and legume mixes often produced the most biomass. Spring biomass of winter hardy species was influenced by cover crop termination date. Overwintered cover crops in New York typically grow rapidly after May 1 until they begin to reproduce in late May to mid-June. Thus early May termination can result in much lower biomass than that of cover crops terminated in late May or early June. Biomass in the fall reflects the ability of a cover crop to reduce erosion and protect soil over the winter, whereas its biomass in the spring affects soil nutrient levels. For example, depending on management practices and weather conditions, a legume cover crop biomass of
1,000 lb/a in the spring can typically provide 15 lbs/acre of nitrogen to the following crop.
In our trials, yield of the “host” crop (a cash grain crop into which the cover crops were interseeded) was not affected by the presence of an interseeded cover crop, except in one case when the interseeding was done too late and a soybean crop was damaged by equipment. However, the host crop strongly affected the interseeded cover crop. At the Cornell Musgrave Research Farm, legumes produced over 1,500 lb/acre of biomass by May 22, 2014. In contrast, at the Reed Farm in northern New York, all cover crops produced less than 250 lb/acre of biomass by May 13, 2014. Temperatures were cooler at the Reed Farm and cover crop termination was earlier, partially explaining the lower biomass levels. In addition to climate differences, the 2013 Musgrave Farm host corn crop produced less than 100 bu/acre (due to excessive spring rain and poor drainage), whereas the Reed Farm host corn crop yielded twice as much. Cover crop growth at Musgrave Farm in spring 2014 was likely more vigorous because it established under the weaker-growing 2013 host corn. Dense, tall corn such as in the Reed Farm trial, and closed-canopy soybean stands will shade and suppress cover crops interseeded into them, especially under dry conditions.
In 2013, cover crops also performed very well at the Evanick Farm, a dairy where corn was grown for silage instead of grain. Corn was planted on May 4, 2013 and cover crops were interseeded on July 2, 2013. At this site, ‘KB Royal’ annual ryegrass produced over 2,000 lb/acre of fall biomass, sampled on October 30, 2013, and the annual ryegrass + legume mix produced 1,850 lb/acre. The next spring KB Royal, legumes, and the ryegrass/legume mixture each produced about 750 lb/acre by May 1, 2014. On dairy farms such as the Evanick Farm, manure applications may result in relatively large amounts of nitrogen mineralization after silage harvest in mid-September. This, plus the early date of corn silage removal, can allow for high cover crop biomass levels in the fall, and impressive growth in spring before an early termination. Silage yield was moderate and was not affected by the interseeded cover crops.
CoverCrops
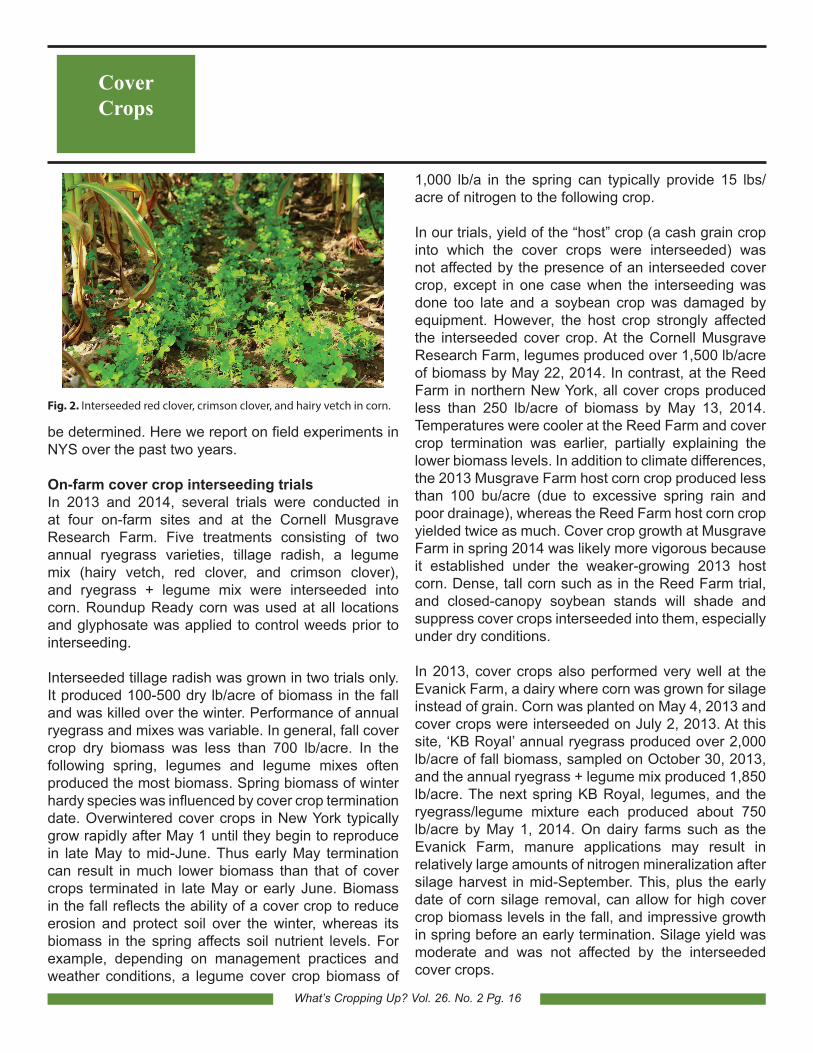
Fig. 2. Interseeded red clover, crimson clover, and hairy vetch in corn.
What’s Cropping Up? Vol. 26. No. 2 Pg. 17
CoverCrops
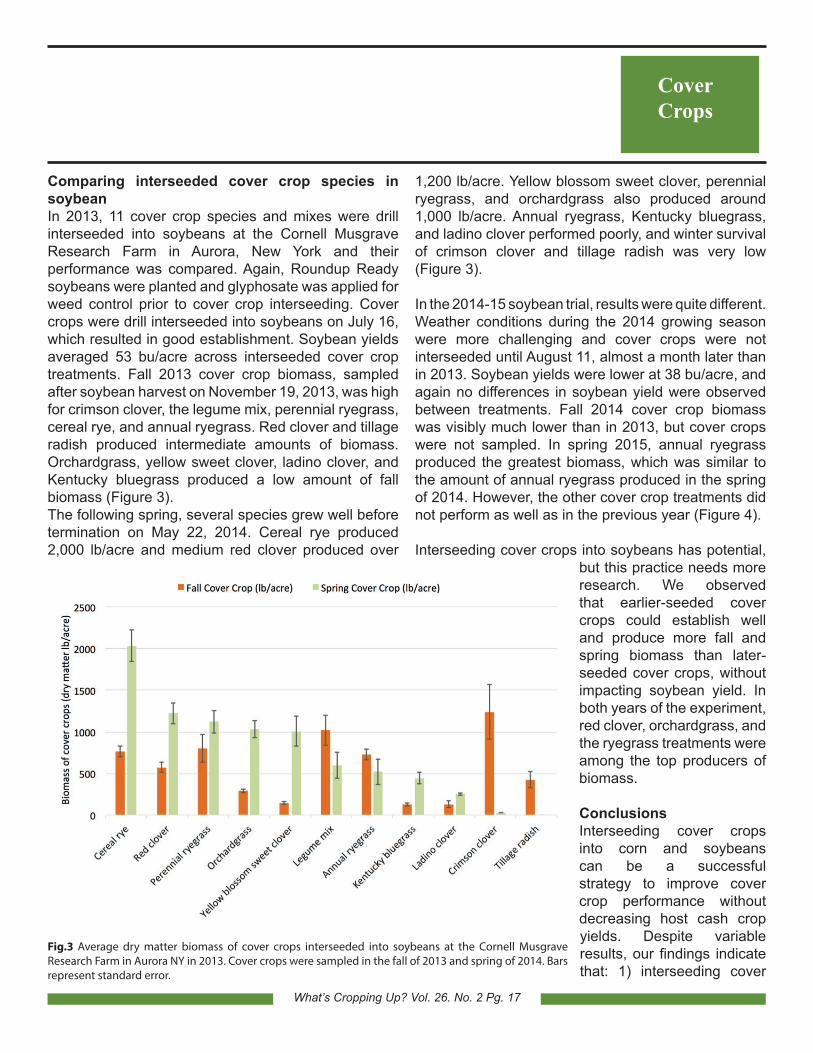
Comparing interseeded cover crop species in soybeanIn 2013, 11 cover crop species and mixes were drill interseeded into soybeans at the Cornell Musgrave Research Farm in Aurora, New York and their performance was compared. Again, Roundup Ready soybeans were planted and glyphosate was applied for weed control prior to cover crop interseeding. Cover crops were drill interseeded into soybeans on July 16, which resulted in good establishment. Soybean yields averaged 53 bu/acre across interseeded cover crop treatments. Fall 2013 cover crop biomass, sampled after soybean harvest on November 19, 2013, was high for crimson clover, the legume mix, perennial ryegrass, cereal rye, and annual ryegrass. Red clover and tillage radish produced intermediate amounts of biomass. Orchardgrass, yellow sweet clover, ladino clover, and Kentucky bluegrass produced a low amount of fall biomass (Figure 3).The following spring, several species grew well before termination on May 22, 2014. Cereal rye produced 2,000 lb/acre and medium red clover produced over
1,200 lb/acre. Yellow blossom sweet clover, perennial ryegrass, and orchardgrass also produced around 1,000 lb/acre. Annual ryegrass, Kentucky bluegrass, and ladino clover performed poorly, and winter survival of crimson clover and tillage radish was very low (Figure 3).
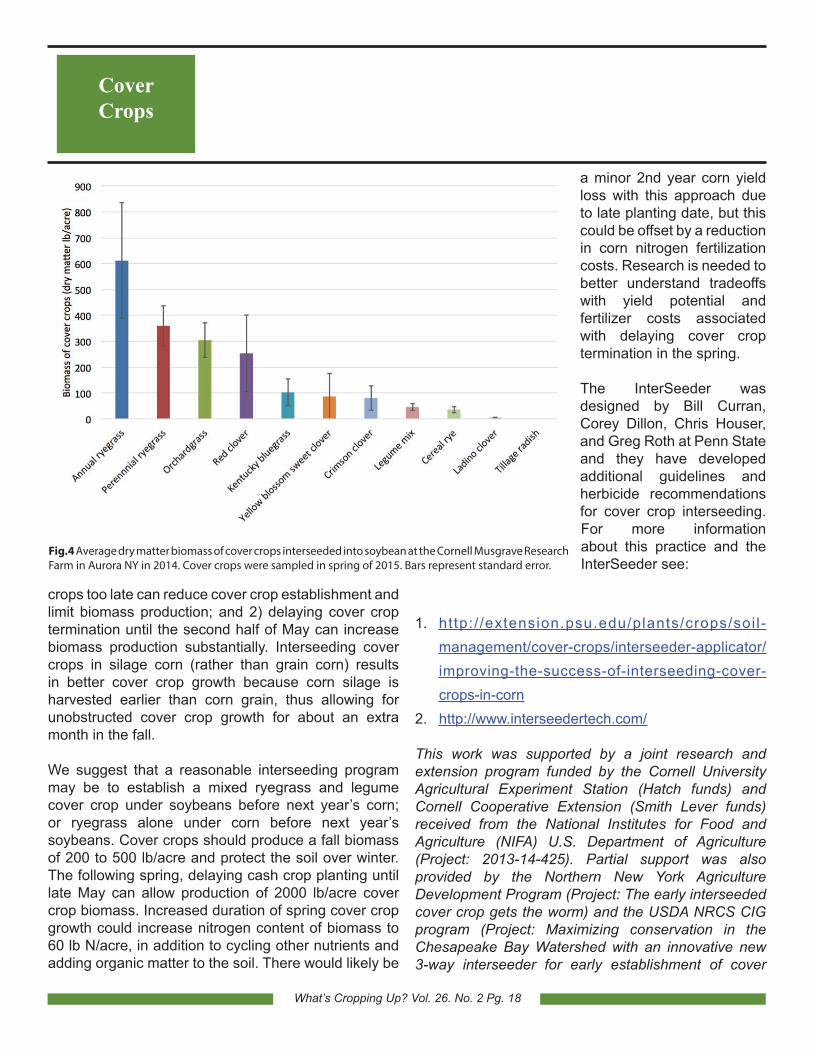
In the 2014-15 soybean trial, results were quite different. Weather conditions during the 2014 growing season were more challenging and cover crops were not interseeded until August 11, almost a month later than in 2013. Soybean yields were lower at 38 bu/acre, and again no differences in soybean yield were observed between treatments. Fall 2014 cover crop biomass was visibly much lower than in 2013, but cover crops were not sampled. In spring 2015, annual ryegrass produced the greatest biomass, which was similar to the amount of annual ryegrass produced in the spring of 2014. However, the other cover crop treatments did not perform as well as in the previous year (Figure 4).
Interseeding cover crops into soybeans has potential, but this practice needs more research. We observed that earlier-seeded cover crops could establish well and produce more fall and spring biomass than later-seeded cover crops, without impacting soybean yield. In both years of the experiment, red clover, orchardgrass, and the ryegrass treatments were among the top producers of biomass.
ConclusionsInterseeding cover crops into corn and soybeans can be a successful strategy to improve cover crop performance without decreasing host cash crop yields. Despite variable results, our findings indicate that: 1) interseeding cover
Fig.3 Average dry matter biomass of cover crops interseeded into soybeans at the Cornell Musgrave Research Farm in Aurora NY in 2013. Cover crops were sampled in the fall of 2013 and spring of 2014. Bars represent standard error.
What’s Cropping Up? Vol. 26. No. 2 Pg. 18
crops too late can reduce cover crop establishment and limit biomass production; and 2) delaying cover crop termination until the second half of May can increase biomass production substantially. Interseeding cover crops in silage corn (rather than grain corn) results in better cover crop growth because corn silage is harvested earlier than corn grain, thus allowing for unobstructed cover crop growth for about an extra month in the fall.
We suggest that a reasonable interseeding program may be to establish a mixed ryegrass and legume cover crop under soybeans before next year’s corn; or ryegrass alone under corn before next year’s soybeans. Cover crops should produce a fall biomass of 200 to 500 lb/acre and protect the soil over winter. The following spring, delaying cash crop planting until late May can allow production of 2000 lb/acre cover crop biomass. Increased duration of spring cover crop growth could increase nitrogen content of biomass to 60 lb N/acre, in addition to cycling other nutrients and adding organic matter to the soil. There would likely be
CoverCrops
a minor 2nd year corn yield loss with this approach due to late planting date, but this could be offset by a reduction in corn nitrogen fertilization costs. Research is needed to better understand tradeoffs with yield potential and fertilizer costs associated with delaying cover crop termination in the spring.
The InterSeeder was designed by Bill Curran, Corey Dillon, Chris Houser, and Greg Roth at Penn State and they have developed additional guidelines and herbicide recommendations for cover crop interseeding. For more information about this practice and the InterSeeder see:
1. http:/ /extension.psu.edu/plants/crops/soi l -management/cover-crops/interseeder-applicator/improving-the-success-of-interseeding-cover-crops-in-corn
2. http://www.interseedertech.com/
This work was supported by a joint research and extension program funded by the Cornell University Agricultural Experiment Station (Hatch funds) and Cornell Cooperative Extension (Smith Lever funds) received from the National Institutes for Food and Agriculture (NIFA) U.S. Department of Agriculture (Project: 2013-14-425). Partial support was also provided by the Northern New York Agriculture Development Program (Project: The early interseeded cover crop gets the worm) and the USDA NRCS CIG program (Project: Maximizing conservation in the Chesapeake Bay Watershed with an innovative new 3-way interseeder for early establishment of cover
Fig.4 Average dry matter biomass of cover crops interseeded into soybean at the Cornell Musgrave Research Farm in Aurora NY in 2014. Cover crops were sampled in spring of 2015. Bars represent standard error.
What’s Cropping Up? Vol. 26. No. 2 Pg. 19
CoverCrops
crops in no-till corn and soybean). Any opinions, findings, conclusions, or recommendations expressed in this publication are those of the authors and do not necessarily reflect the view of the U.S. Department of Agriculture.
ReferencesHall, M.R., C.J. Swanton, and G.W. Anderson. 1992.
The Critical Period of Weed Control in Grain Corn. Weed Science. 40:441-447.
Hively, W. D. and W. J. Cox. 2001. Interseeding Cover Crops into Soybean and Subsequent Corn Yields. Agron. J. 93:308–313.
Scott, T. W., J. Mt. Pleasant, R. F. Burt, and D. J. Otis. 1987. Contributions of Ground Cover, Dry Matter, and Nitrogen from Intercrops and Cover Crops in a Corn Polyculture System. Agron. J. 79:792-798.
What’s Cropping Up? Vol. 26. No. 2 Pg. 20
Nutrient Management
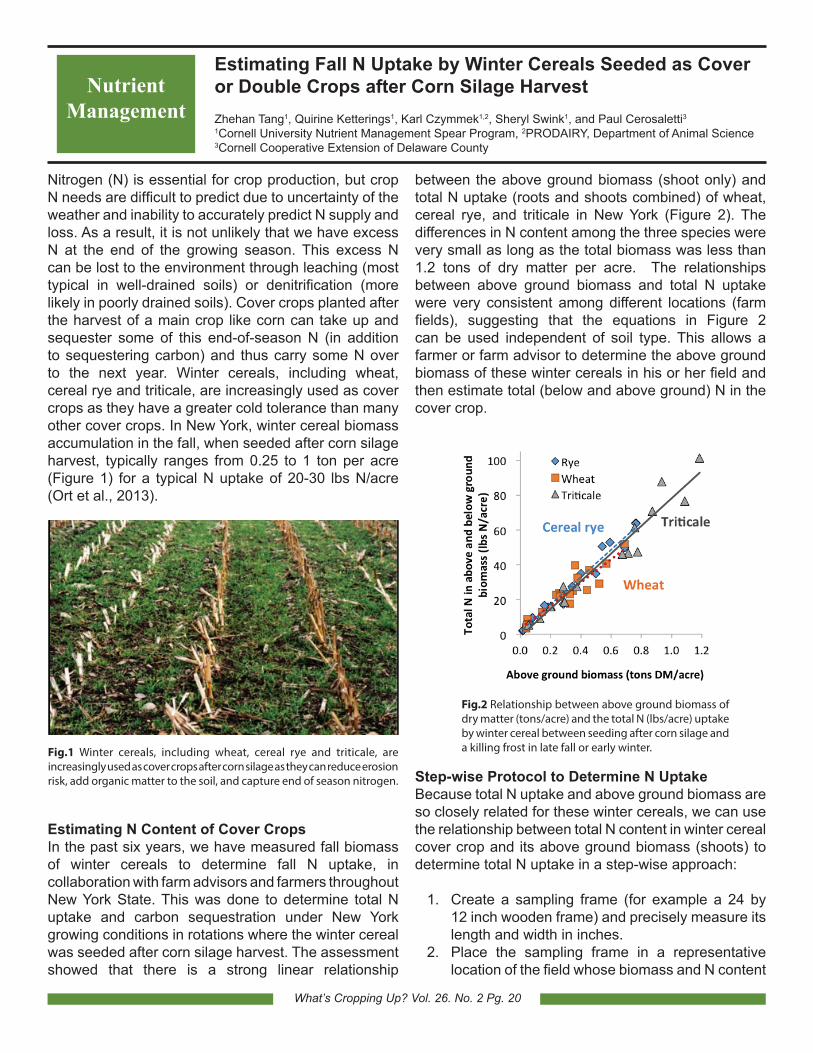
Nitrogen (N) is essential for crop production, but crop N needs are difficult to predict due to uncertainty of the weather and inability to accurately predict N supply and loss. As a result, it is not unlikely that we have excess N at the end of the growing season. This excess N can be lost to the environment through leaching (most typical in well-drained soils) or denitrification (more likely in poorly drained soils). Cover crops planted after the harvest of a main crop like corn can take up and sequester some of this end-of-season N (in addition to sequestering carbon) and thus carry some N over to the next year. Winter cereals, including wheat, cereal rye and triticale, are increasingly used as cover crops as they have a greater cold tolerance than many other cover crops. In New York, winter cereal biomass accumulation in the fall, when seeded after corn silage harvest, typically ranges from 0.25 to 1 ton per acre (Figure 1) for a typical N uptake of 20-30 lbs N/acre (Ort et al., 2013).
Estimating N Content of Cover CropsIn the past six years, we have measured fall biomass of winter cereals to determine fall N uptake, in collaboration with farm advisors and farmers throughout New York State. This was done to determine total N uptake and carbon sequestration under New York growing conditions in rotations where the winter cereal was seeded after corn silage harvest. The assessment showed that there is a strong linear relationship
between the above ground biomass (shoot only) and total N uptake (roots and shoots combined) of wheat, cereal rye, and triticale in New York (Figure 2). The differences in N content among the three species were very small as long as the total biomass was less than 1.2 tons of dry matter per acre. The relationships between above ground biomass and total N uptake were very consistent among different locations (farm fields), suggesting that the equations in Figure 2 can be used independent of soil type. This allows a farmer or farm advisor to determine the above ground biomass of these winter cereals in his or her field and then estimate total (below and above ground) N in the cover crop.
Step-wise Protocol to Determine N UptakeBecause total N uptake and above ground biomass are so closely related for these winter cereals, we can use the relationship between total N content in winter cereal cover crop and its above ground biomass (shoots) to determine total N uptake in a step-wise approach:
1. Create a sampling frame (for example a 24 by 12 inch wooden frame) and precisely measure its length and width in inches.
2. Place the sampling frame in a representative location of the field whose biomass and N content
Fig.1 Winter cereals, including wheat, cereal rye and triticale, are increasingly used as cover crops after corn silage as they can reduce erosion risk, add organic matter to the soil, and capture end of season nitrogen.
Fig.2 Relationship between above ground biomass of dry matter (tons/acre) and the total N (lbs/acre) uptake by winter cereal between seeding after corn silage and a killing frost in late fall or early winter.
Estimating Fall N Uptake by Winter Cereals Seeded as Cover or Double Crops after Corn Silage Harvest Zhehan Tang1, Quirine Ketterings1, Karl Czymmek1,2, Sheryl Swink1, and Paul Cerosaletti31Cornell University Nutrient Management Spear Program, 2PRODAIRY, Department of Animal Science 3Cornell Cooperative Extension of Delaware County
What’s Cropping Up? Vol. 26. No. 2 Pg. 21
Nutrient Management
you want to estimate. Clip all above ground biomass of the winter cereal that is within the frame, as close to the soil surface as possible, while avoiding soil contamination, and place the sample within a bag large enough for samples from 3 frames. Sample when the plants are dry (avoid sampling when there is dew, rain, or snow).
3. Repeat the sampling process at two more representative sites in the field, collecting samples from all three locations in the same bag.
4. Measure the total weight of the sample collected in pounds (lbs). Make sure to subtract the bag weight itself so that only plant weight is included in the total.
5. If your sample does not have much external moisture, you can assume it has about 18% dry matter, then skip step 6 and continue with step 7. If you want to estimate total biomass and N content more precisely, continue with step 6.
6. After carefully mixing the sample in the sampling bag, take a subsample of approximately 0.25 lbs from the harvested biomass, and determine the weight of the subsample in pounds (if the weight of the total sample is 0.25 lbs or less, skip the step of taking a subsample). Dry the subsample with a microwave until it has obtained a stable weight. Use short drying periods of 30-60 seconds and place an 8-oz glass of water in the corner to avoid burning of the sample. More detailed instructions for drying of plant biomass with a microwave can be found at http://extension.psu.edu/publications/i-106. Once the weight has stabilized, measure the final dry weight. The dry weight divided by the initial weight is the percent dry matter. If you have a scale that measures in grams, you can also weigh 100 grams of freshly
harvested biomass, dry it following the same procedure, and weigh the dry weight at the end of the drying process; the dry weight will be the dry matter percent.
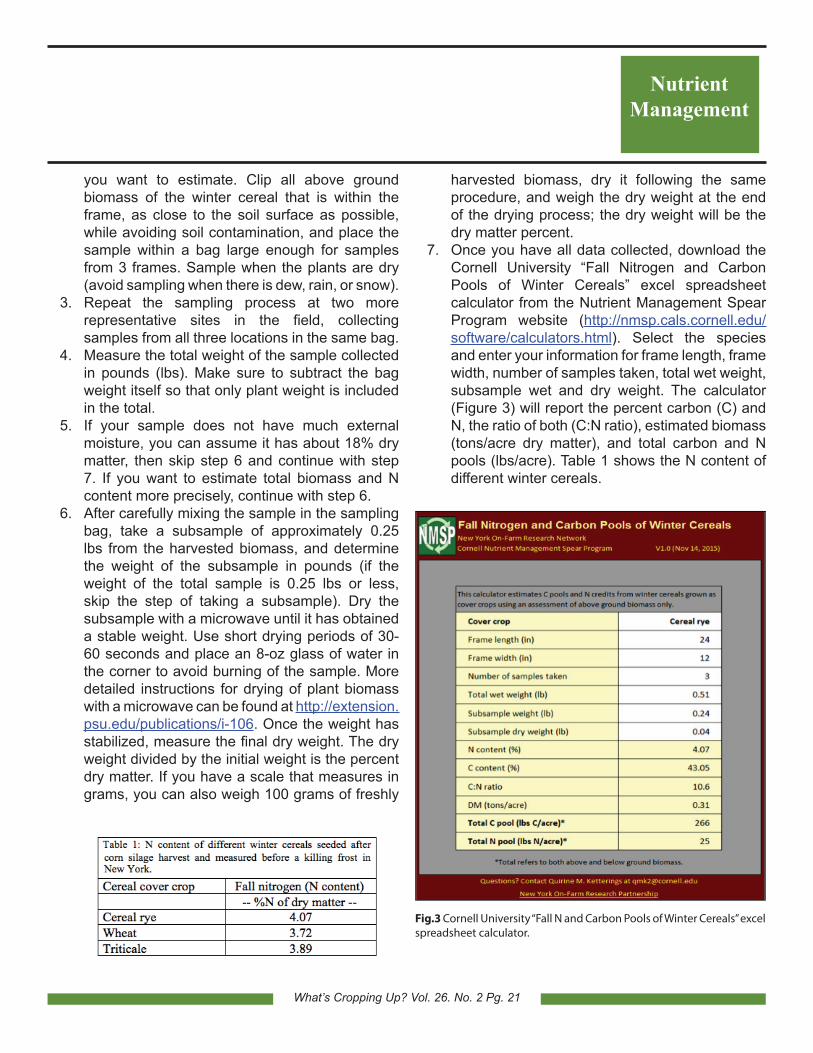
7. Once you have all data collected, download the Cornell University “Fall Nitrogen and Carbon Pools of Winter Cereals” excel spreadsheet calculator from the Nutrient Management Spear Program website (http://nmsp.cals.cornell.edu/software/calculators.html). Select the species and enter your information for frame length, frame width, number of samples taken, total wet weight, subsample wet and dry weight. The calculator (Figure 3) will report the percent carbon (C) and N, the ratio of both (C:N ratio), estimated biomass (tons/acre dry matter), and total carbon and N pools (lbs/acre). Table 1 shows the N content of different winter cereals.
Fig.3 Cornell University “Fall N and Carbon Pools of Winter Cereals” excel spreadsheet calculator.
What’s Cropping Up? Vol. 26. No. 2 Pg. 22
Nutrient Management
In SummaryCover crops are important for erosion control and soil health. In addition, winter cereals are effective in taking up N in the fall. We developed a calculator to estimate how much N is accumulated by the onset of the winter in winter cereals planted as cover crops (biomass less than 1.2 tons of dry matter per acre; winter cereals seeded after corn silage or soybean harvest only). This calculator converts estimates of the above ground biomass to total N uptake and carbon sequestration by the winter cereal (roots and shoot combined).
Web-Based Resources and ReferencesCornell University “Fall N and Carbon Pools of
Winter Cereals” excel spreadsheet calculator: http://nmsp.cals.cornell.edu/software/calculators.html.
Ort, S.B., Q.M. Ketterings, K.J. Czymmek, G.S. Godwin, S.N. Swink and S.K. Gami (2013). Carbon and nitrogen uptake of cereal cover crops following corn silage. What’s Cropping Up? 23(2): 5-6.
Penn State University “Determining Forage Moisture Content with a Microwave Oven”: http://extension.psu.edu/publications/i-106.
AcknowledgmentsFunding sources included the Northern New York Agriculture Development Program (NNYADP), a USDA-NRCS Conservation Innovation Grant, Northeast Region Sustainable Agriculture Research and Education, and Federal Formula Funds. We thank the many Cornell Cooperative Extension field crop educators, Soil and Water Conservation District staff and participating farmers, and our past and current NMSP team members Greg Godwin, Sanjay Gami, Diego Gris, Gordana Jacimovski, Emma Long, Shona Ort, and Patty Ristow. For questions about these results contact Quirine M. Ketterings at 607-255-3061 or [email protected]. Cornell Nutrient Management Spear Program website: http://nmsp.cals.cornell.edu/.
What’s Cropping Up? Vol. 26. No. 2 Pg. 23
Crop Management
Why Did Organic Compared with Conventional Corn Yield ~30% Lower During the First Transition Year?Bill Cox and Eric Sandsted Soil and Crop Sciences Section - School of Integrated Plant Science, Cornell University
We initiated a 3-year study at the Aurora Research Farm in 2015 to compare the corn, soybean, and wheat/red clover rotation under conventional and organic cropping systems during the 3-year transition period (2015-2017) to an organic cropping system. We used three entry points or previous crops from 2014 to initiate the 2015-2017 study: 1) grain corn, 2) small grain, and 3) soybean. Three of the many objectives of the study are 1) to determine the best previous crop (2014) for the transition, 2) the best crop to plant in the first year (2015) during the transition and 3) do corn, soybean, and wheat respond similarly to management inputs (high and recommended) under conventional and organic cropping systems? We reported in a previous article corn management inputs (hybrid selection, planting date, seeding and N rates, and weed control) under both cropping systems (http://blogs.cornell.edu/whatscroppingup/2015/11/09/corn-yield-under-conventional-and-organic-cropping-systems-with-recommended-and-high-inputs-during-the-transition-year-to-organic/). Likewise, we reported in the same article that corn yielded ~30% lower in the organic compared with the conventional cropping system. Furthermore, management inputs did not impact corn yields under either cropping system. This article will examine the yield component responses of conventional and organic corn averaged across the three previous crops and both management treatments to partially explain why organic corn yielded so much lower in 2015.
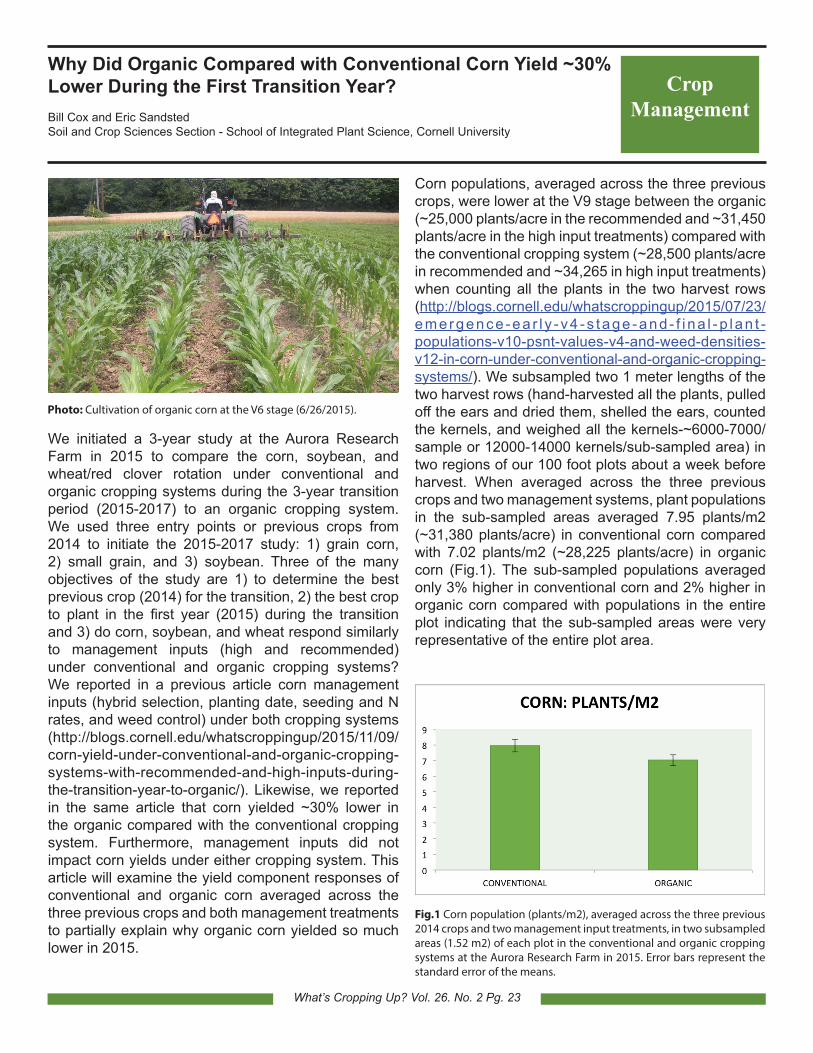
Corn populations, averaged across the three previous crops, were lower at the V9 stage between the organic (~25,000 plants/acre in the recommended and ~31,450 plants/acre in the high input treatments) compared with the conventional cropping system (~28,500 plants/acre in recommended and ~34,265 in high input treatments) when counting all the plants in the two harvest rows (http://blogs.cornell.edu/whatscroppingup/2015/07/23/emergence -ea r l y - v4 -s tage -and - f i na l -p lan t -populations-v10-psnt-values-v4-and-weed-densities-v12-in-corn-under-conventional-and-organic-cropping-systems/). We subsampled two 1 meter lengths of the two harvest rows (hand-harvested all the plants, pulled off the ears and dried them, shelled the ears, counted the kernels, and weighed all the kernels-~6000-7000/sample or 12000-14000 kernels/sub-sampled area) in two regions of our 100 foot plots about a week before harvest. When averaged across the three previous crops and two management systems, plant populations in the sub-sampled areas averaged 7.95 plants/m2 (~31,380 plants/acre) in conventional corn compared with 7.02 plants/m2 (~28,225 plants/acre) in organic corn (Fig.1). The sub-sampled populations averaged only 3% higher in conventional corn and 2% higher in organic corn compared with populations in the entire plot indicating that the sub-sampled areas were very representative of the entire plot area.
Fig.1 Corn population (plants/m2), averaged across the three previous 2014 crops and two management input treatments, in two subsampled areas (1.52 m2) of each plot in the conventional and organic cropping systems at the Aurora Research Farm in 2015. Error bars represent the standard error of the means.
Photo: Cultivation of organic corn at the V6 stage (6/26/2015).
What’s Cropping Up? Vol. 26. No. 2 Pg. 24
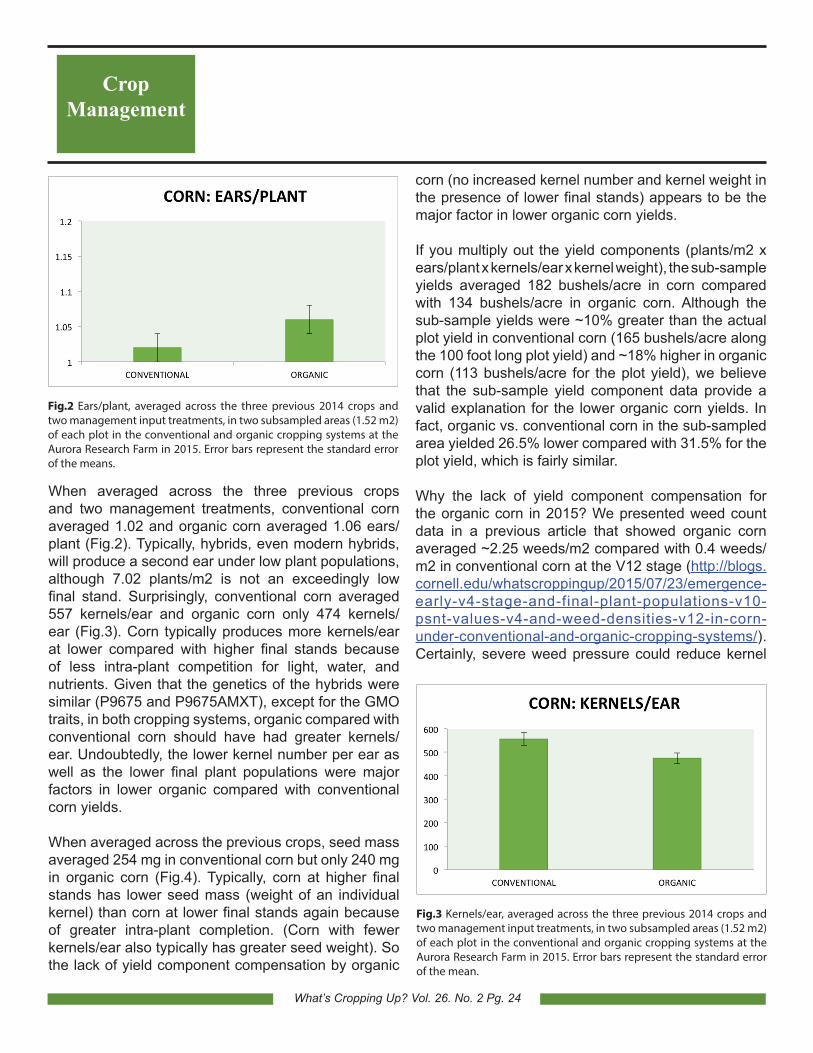
When averaged across the three previous crops and two management treatments, conventional corn averaged 1.02 and organic corn averaged 1.06 ears/plant (Fig.2). Typically, hybrids, even modern hybrids, will produce a second ear under low plant populations, although 7.02 plants/m2 is not an exceedingly low final stand. Surprisingly, conventional corn averaged 557 kernels/ear and organic corn only 474 kernels/ear (Fig.3). Corn typically produces more kernels/ear at lower compared with higher final stands because of less intra-plant competition for light, water, and nutrients. Given that the genetics of the hybrids were similar (P9675 and P9675AMXT), except for the GMO traits, in both cropping systems, organic compared with conventional corn should have had greater kernels/ear. Undoubtedly, the lower kernel number per ear as well as the lower final plant populations were major factors in lower organic compared with conventional corn yields.
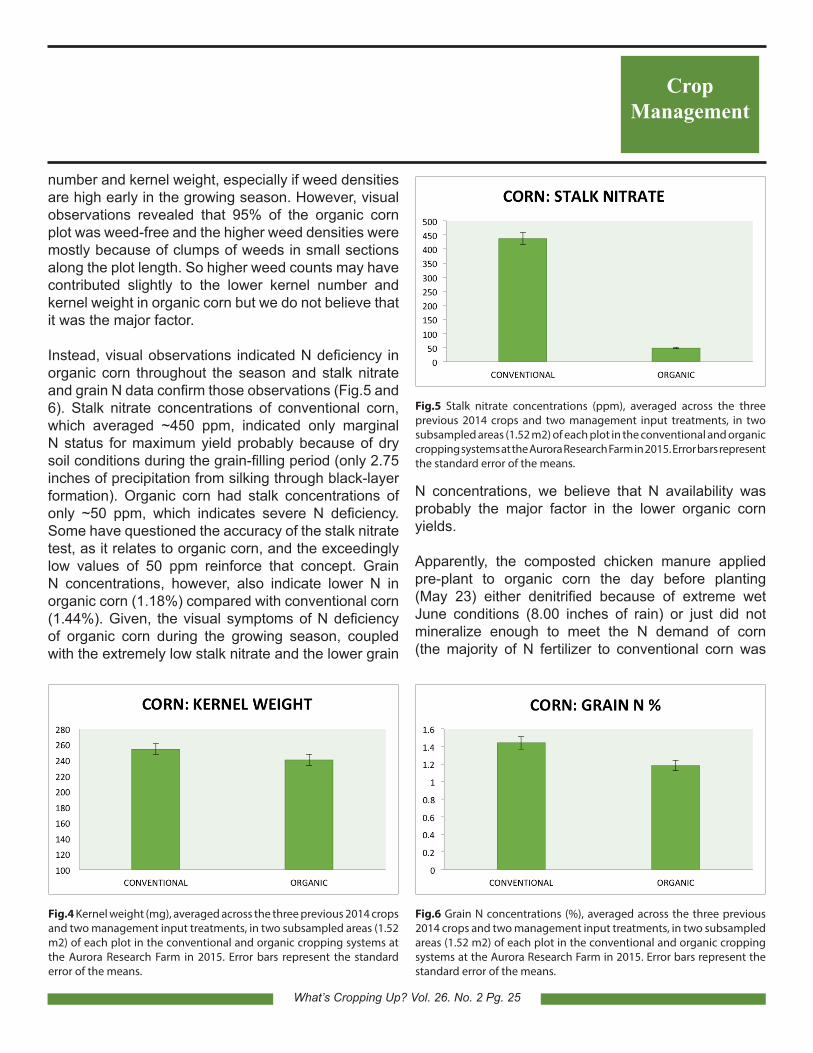
When averaged across the previous crops, seed mass averaged 254 mg in conventional corn but only 240 mg in organic corn (Fig.4). Typically, corn at higher final stands has lower seed mass (weight of an individual kernel) than corn at lower final stands again because of greater intra-plant completion. (Corn with fewer kernels/ear also typically has greater seed weight). So the lack of yield component compensation by organic
corn (no increased kernel number and kernel weight in the presence of lower final stands) appears to be the major factor in lower organic corn yields.
If you multiply out the yield components (plants/m2 x ears/plant x kernels/ear x kernel weight), the sub-sample yields averaged 182 bushels/acre in corn compared with 134 bushels/acre in organic corn. Although the sub-sample yields were ~10% greater than the actual plot yield in conventional corn (165 bushels/acre along the 100 foot long plot yield) and ~18% higher in organic corn (113 bushels/acre for the plot yield), we believe that the sub-sample yield component data provide a valid explanation for the lower organic corn yields. In fact, organic vs. conventional corn in the sub-sampled area yielded 26.5% lower compared with 31.5% for the plot yield, which is fairly similar.
Why the lack of yield component compensation for the organic corn in 2015? We presented weed count data in a previous article that showed organic corn averaged ~2.25 weeds/m2 compared with 0.4 weeds/m2 in conventional corn at the V12 stage (http://blogs.cornell.edu/whatscroppingup/2015/07/23/emergence-early-v4-stage-and-final-plant-populations-v10-psnt-values-v4-and-weed-densities-v12-in-corn-under-conventional-and-organic-cropping-systems/). Certainly, severe weed pressure could reduce kernel
Crop Management
Fig.3 Kernels/ear, averaged across the three previous 2014 crops and two management input treatments, in two subsampled areas (1.52 m2) of each plot in the conventional and organic cropping systems at the Aurora Research Farm in 2015. Error bars represent the standard error of the mean.
Fig.2 Ears/plant, averaged across the three previous 2014 crops and two management input treatments, in two subsampled areas (1.52 m2) of each plot in the conventional and organic cropping systems at the Aurora Research Farm in 2015. Error bars represent the standard error of the means.
What’s Cropping Up? Vol. 26. No. 2 Pg. 25
number and kernel weight, especially if weed densities are high early in the growing season. However, visual observations revealed that 95% of the organic corn plot was weed-free and the higher weed densities were mostly because of clumps of weeds in small sections along the plot length. So higher weed counts may have contributed slightly to the lower kernel number and kernel weight in organic corn but we do not believe that it was the major factor.
Instead, visual observations indicated N deficiency in organic corn throughout the season and stalk nitrate and grain N data confirm those observations (Fig.5 and 6). Stalk nitrate concentrations of conventional corn, which averaged ~450 ppm, indicated only marginal N status for maximum yield probably because of dry soil conditions during the grain-filling period (only 2.75 inches of precipitation from silking through black-layer formation). Organic corn had stalk concentrations of only ~50 ppm, which indicates severe N deficiency. Some have questioned the accuracy of the stalk nitrate test, as it relates to organic corn, and the exceedingly low values of 50 ppm reinforce that concept. Grain N concentrations, however, also indicate lower N in organic corn (1.18%) compared with conventional corn (1.44%). Given, the visual symptoms of N deficiency of organic corn during the growing season, coupled with the extremely low stalk nitrate and the lower grain
N concentrations, we believe that N availability was probably the major factor in the lower organic corn yields.
Apparently, the composted chicken manure applied pre-plant to organic corn the day before planting (May 23) either denitrified because of extreme wet June conditions (8.00 inches of rain) or just did not mineralize enough to meet the N demand of corn (the majority of N fertilizer to conventional corn was
Crop Management
Fig.4 Kernel weight (mg), averaged across the three previous 2014 crops and two management input treatments, in two subsampled areas (1.52 m2) of each plot in the conventional and organic cropping systems at the Aurora Research Farm in 2015. Error bars represent the standard error of the means.
Fig.5 Stalk nitrate concentrations (ppm), averaged across the three previous 2014 crops and two management input treatments, in two subsampled areas (1.52 m2) of each plot in the conventional and organic cropping systems at the Aurora Research Farm in 2015. Error bars represent the standard error of the means.
Fig.6 Grain N concentrations (%), averaged across the three previous 2014 crops and two management input treatments, in two subsampled areas (1.52 m2) of each plot in the conventional and organic cropping systems at the Aurora Research Farm in 2015. Error bars represent the standard error of the means.
What’s Cropping Up? Vol. 26. No. 2 Pg. 26
side-dressed in late June so did not experience this problem). This would result in N deficiency in the 2 week period before and after silking (~July 15-August 10), the growth period when final kernel number in corn is determined. Likewise, a lack of N from 2 weeks after silking to a week before black layer formation (~August 10-September 10) would result in lower kernel weight. So low N availability probably contributed the most to lack of yield component compensation of organic corn (15% fewer kernels/ear and 5.5% lower seed weight for organic corn), in the presence of lower final stands (~12% fewer plants/m2), which contributed to 31.5% lower yields for organic compared with conventional corn.
In defense of organic corn, we did not know about funding for this research until mid-April of 2015 so the typical green manure crop or animal manure was not used on organic corn. Consequently, organic corn was not given the best N management practices during the first transition year. If corn is selected as the first year transition crop, a small grain crop with a red clover inter-seeding or a field with recent animal manure applications would be the best management strategy. The green manure crop or animal manure would provide the majority of the N requirement of organic corn and composted chicken manure could be used as a supplemental N source. Fortunately, we have a robust red clover crop in place so we expect organic corn to perform much better relative to conventional corn in 2016.
Crop Management
What’s Cropping Up? Vol. 26. No. 2 Pg. 27
Crop Management
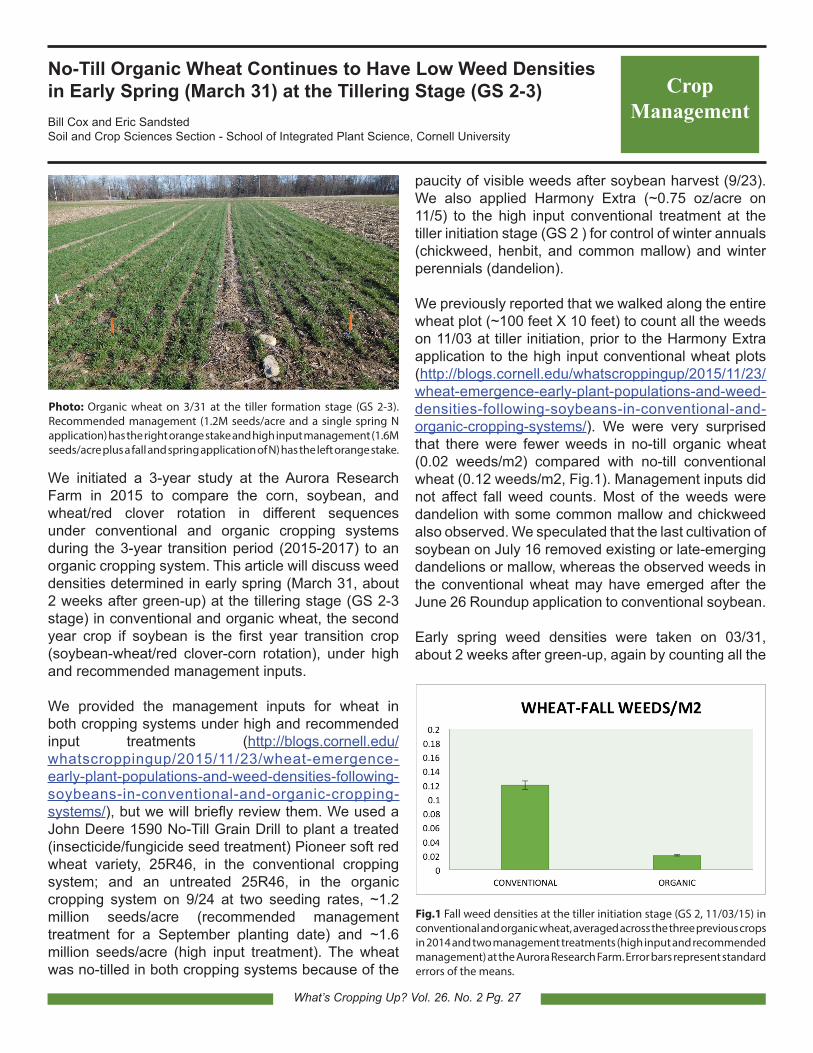
No-Till Organic Wheat Continues to Have Low Weed Densities in Early Spring (March 31) at the Tillering Stage (GS 2-3) Bill Cox and Eric Sandsted Soil and Crop Sciences Section - School of Integrated Plant Science, Cornell University
We initiated a 3-year study at the Aurora Research Farm in 2015 to compare the corn, soybean, and wheat/red clover rotation in different sequences under conventional and organic cropping systems during the 3-year transition period (2015-2017) to an organic cropping system. This article will discuss weed densities determined in early spring (March 31, about 2 weeks after green-up) at the tillering stage (GS 2-3 stage) in conventional and organic wheat, the second year crop if soybean is the first year transition crop (soybean-wheat/red clover-corn rotation), under high and recommended management inputs.
We provided the management inputs for wheat in both cropping systems under high and recommended input treatments (http://blogs.cornell.edu/whatscroppingup/2015/11/23/wheat-emergence-early-plant-populations-and-weed-densities-following-soybeans-in-conventional-and-organic-cropping-systems/), but we will briefly review them. We used a John Deere 1590 No-Till Grain Drill to plant a treated (insecticide/fungicide seed treatment) Pioneer soft red wheat variety, 25R46, in the conventional cropping system; and an untreated 25R46, in the organic cropping system on 9/24 at two seeding rates, ~1.2 million seeds/acre (recommended management treatment for a September planting date) and ~1.6 million seeds/acre (high input treatment). The wheat was no-tilled in both cropping systems because of the
paucity of visible weeds after soybean harvest (9/23). We also applied Harmony Extra (~0.75 oz/acre on 11/5) to the high input conventional treatment at the tiller initiation stage (GS 2 ) for control of winter annuals (chickweed, henbit, and common mallow) and winter perennials (dandelion).
We previously reported that we walked along the entire wheat plot (~100 feet X 10 feet) to count all the weeds on 11/03 at tiller initiation, prior to the Harmony Extra application to the high input conventional wheat plots (http://blogs.cornell.edu/whatscroppingup/2015/11/23/wheat-emergence-early-plant-populations-and-weed-densities-following-soybeans-in-conventional-and-organic-cropping-systems/). We were very surprised that there were fewer weeds in no-till organic wheat (0.02 weeds/m2) compared with no-till conventional wheat (0.12 weeds/m2, Fig.1). Management inputs did not affect fall weed counts. Most of the weeds were dandelion with some common mallow and chickweed also observed. We speculated that the last cultivation of soybean on July 16 removed existing or late-emerging dandelions or mallow, whereas the observed weeds in the conventional wheat may have emerged after the June 26 Roundup application to conventional soybean.
Early spring weed densities were taken on 03/31, about 2 weeks after green-up, again by counting all the
Fig.1 Fall weed densities at the tiller initiation stage (GS 2, 11/03/15) in conventional and organic wheat, averaged across the three previous crops in 2014 and two management treatments (high input and recommended management) at the Aurora Research Farm. Error bars represent standard errors of the means.
Photo: Organic wheat on 3/31 at the tiller formation stage (GS 2-3). Recommended management (1.2M seeds/acre and a single spring N application) has the right orange stake and high input management (1.6M seeds/acre plus a fall and spring application of N) has the left orange stake.
What’s Cropping Up? Vol. 26. No. 2 Pg. 28
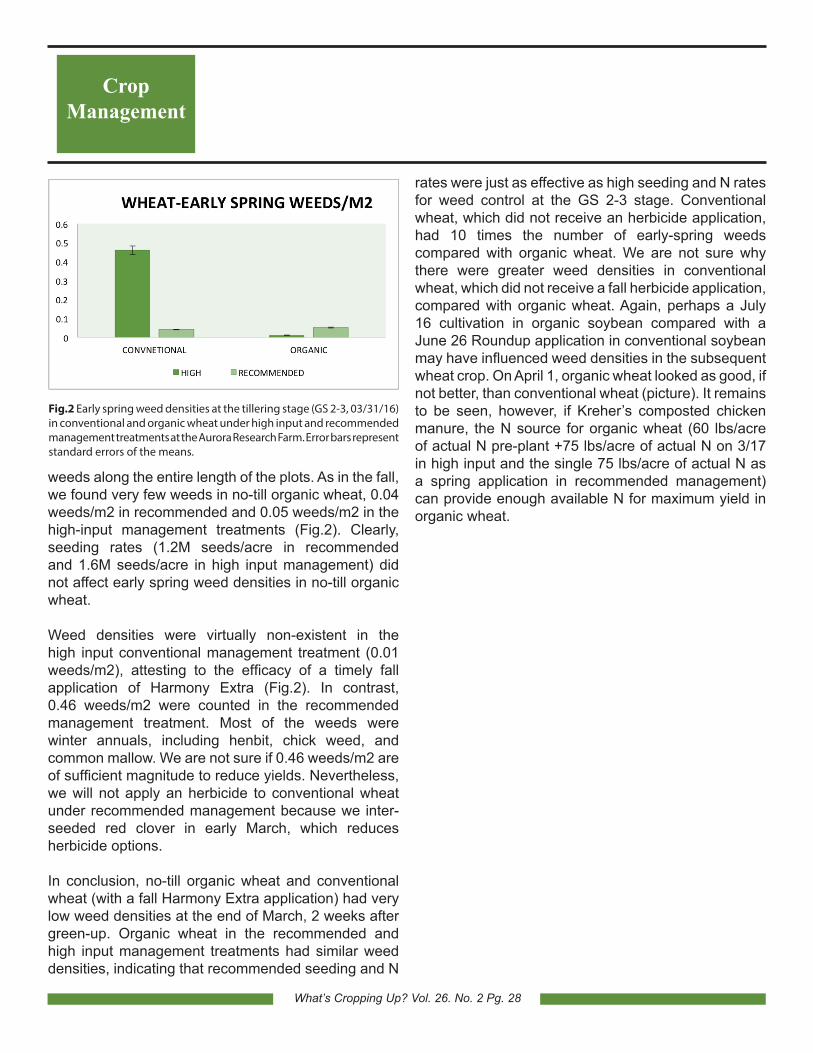
weeds along the entire length of the plots. As in the fall, we found very few weeds in no-till organic wheat, 0.04 weeds/m2 in recommended and 0.05 weeds/m2 in the high-input management treatments (Fig.2). Clearly, seeding rates (1.2M seeds/acre in recommended and 1.6M seeds/acre in high input management) did not affect early spring weed densities in no-till organic wheat.
Weed densities were virtually non-existent in the high input conventional management treatment (0.01 weeds/m2), attesting to the efficacy of a timely fall application of Harmony Extra (Fig.2). In contrast, 0.46 weeds/m2 were counted in the recommended management treatment. Most of the weeds were winter annuals, including henbit, chick weed, and common mallow. We are not sure if 0.46 weeds/m2 are of sufficient magnitude to reduce yields. Nevertheless, we will not apply an herbicide to conventional wheat under recommended management because we inter-seeded red clover in early March, which reduces herbicide options.
In conclusion, no-till organic wheat and conventional wheat (with a fall Harmony Extra application) had very low weed densities at the end of March, 2 weeks after green-up. Organic wheat in the recommended and high input management treatments had similar weed densities, indicating that recommended seeding and N
rates were just as effective as high seeding and N rates for weed control at the GS 2-3 stage. Conventional wheat, which did not receive an herbicide application, had 10 times the number of early-spring weeds compared with organic wheat. We are not sure why there were greater weed densities in conventional wheat, which did not receive a fall herbicide application, compared with organic wheat. Again, perhaps a July 16 cultivation in organic soybean compared with a June 26 Roundup application in conventional soybean may have influenced weed densities in the subsequent wheat crop. On April 1, organic wheat looked as good, if not better, than conventional wheat (picture). It remains to be seen, however, if Kreher’s composted chicken manure, the N source for organic wheat (60 lbs/acre of actual N pre-plant +75 lbs/acre of actual N on 3/17 in high input and the single 75 lbs/acre of actual N as a spring application in recommended management) can provide enough available N for maximum yield in organic wheat.
Fig.2 Early spring weed densities at the tillering stage (GS 2-3, 03/31/16) in conventional and organic wheat under high input and recommended management treatments at the Aurora Research Farm. Error bars represent standard errors of the means.
Crop Management
What’s Cropping Up? Vol. 26. No. 2 Pg. 29
Water Quality Impacts Reduced with Adapt-N Recommendations Aaron Ristow1, Shai Sela1, Mike Davis2, Lindsay Fennell1, and Harold van Es1
1Soil and Crop Sciences Section - School of Integrative Plant Science - Cornell University, 2Cornell University Agricultural Experiment Station
Nutrient Management
Soil nitrogen (N) is both spatially and temporally variable, challenging farmers to meet optimal nitrogen (N) needs and minimize N deficiency risk. N typically is a large monetary input for corn production in part due to farmer tendency to over-apply N fertilizer and/or manure to maximize their returns to N applications in the presence of high uncertainty around the optimum N rate. This excessive N maybe be readily lost to the environment through volatilization, runoff and leaching. Not only do N losses negatively impact yield, we know a significant percentage of total N load is carried by ground water or discharged to streams, causing environmental costs. Therefore, a top priority should be the estimation of the optimum N rate that meets crop production needs while minimizing environmental impacts.
The optimum N rate depends on numerous factors including the timing and amounts of early season precipitation events, previous organic and inorganic N applications, soil organic matter, carry-over N from previous cropping seasons, soil texture, rotations, etc. There are several approaches to optimizing N rates and minimize N losses. These can be generally categorized as (i) static and (ii) adaptive. Static tools offer generalized recommendations that do not consider seasonal conditions of weather and soil/crop management, while adaptive approaches account for the variable and site-specific nature of soil N dynamics, including the effects of weather. Using data from two seasons of corn silage grown at the Cornell University research farm at Willsboro, NY, we compared the economic and environmental impacts of N rate recommendations from a conventional static approach (the Cornell Corn Nitrogen Calculator; CNC) with the adaptive Adapt-N approach (adapt-n.com).
Adapt-N and the Cornell Corn Nitrogen Calculator The Cornell University Corn Nitrogen Calculator (CNC) is a static approach that includes a basic mass balance calculation of N demand (yield-driven crop uptake) and N supply (soil organic matter, manure, previous crops), combined with efficiency factors. The CNC approach has been the established corn N recommendation approach for several decades, and estimates can be derived from a spreadsheet downloaded from http://
nmsp.cals.cornell.edu/software/calculators.html.
Adapt-N is a dynamic simulation tool that combines soil, crop and management information with weather data to estimate optimum N application rates for corn. Originally developed at Cornell University, the tool has been licensed for commercial use and is currently calibrated for use on about 95% of the US corn production area. When using the tool to inform in-season N application rates, early season weather effects and site-specific attainable yield can be incorporated into the recommendation, allowing N management precision to be improved.
The Adapt-N tool was compared to CNC recommendations in a spatially-balanced complete block design (4 replications) on two paired experimental sites for the 2014 and 2015 growing seasons. In each trial, the treatments were defined by the total amount of N applied, where the rates were:
(i) the total N rate based on Adapt-N recommendations (including a 15 lbs/ac starter) for the date of sidedress, and (ii) the total recommended rate of the Cornell Corn Nitrogen Calculator (including a 15 lbs/ac starter), using realistic yield goals (rather than the database yield goals, which would have underestimated real yields for these sites).
The treatments were implemented on 16 plots, each on a Cosad loamy fine sand and a Muskellunge clay loam, in continuous corn (silage), under no-till and plow-till management. Drainage water samples were collected from the lysimeters at key time points in the spring (April 7th and April 23rd) and fall (October 1st, October 29th, and December 3rd). The lysimeters include drainage lines routed to a utility hole to allow for drain water samples to be collected. Nitrate (NO3) and Nitrite (NO2) concentration was quantified from the samples to allow us to assess differences in water quality in Adapt-N vs CNC plots. In this article, we will refer to NO3+NO2 concentrations simply as NO3 or “nitrate”, as the NO2 fraction is typically very small.
At the end of the 2014 and 2015 seasons, we measured
What’s Cropping Up? Vol. 26. No. 2 Pg. 30
corn yields and calculated associated partial profit differences for the two treatments. Corn yields were assessed by representative sampling (four 15 ft long row sections per plot). Partial profit differences between the Adapt-N and CNC practices were estimated using prices of $0.50/lb N and $50/T silage.
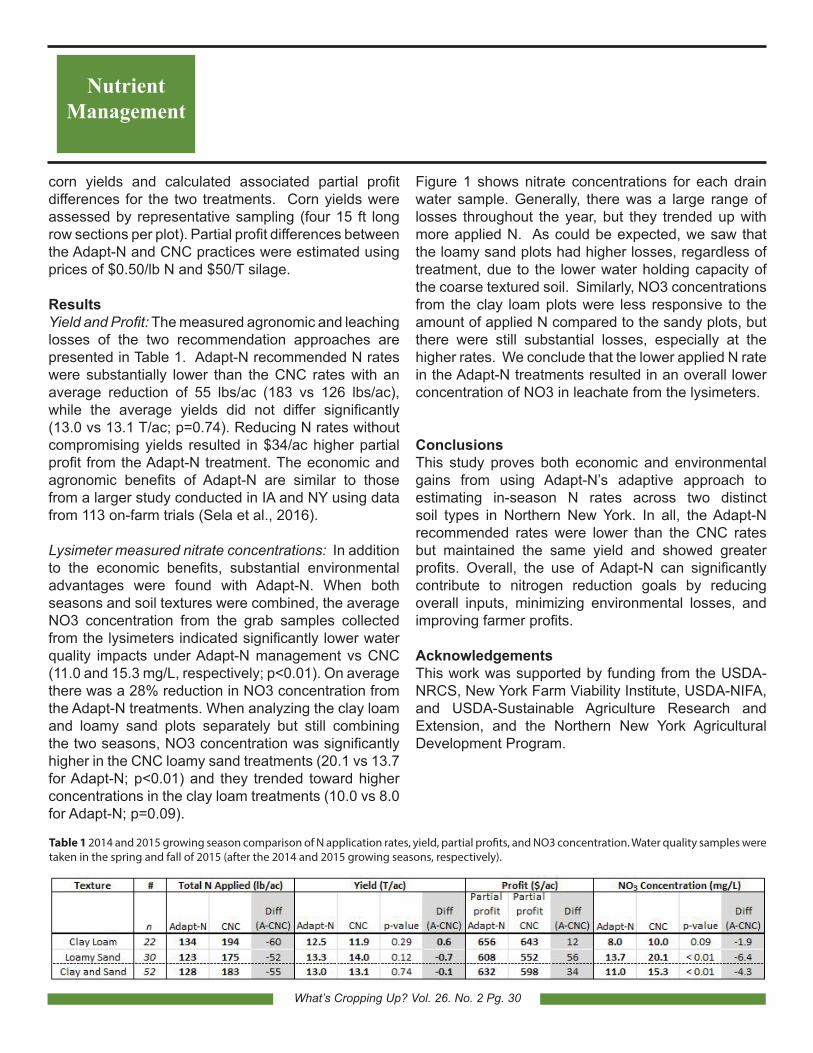
Results Yield and Profit: The measured agronomic and leaching losses of the two recommendation approaches are presented in Table 1. Adapt-N recommended N rates were substantially lower than the CNC rates with an average reduction of 55 lbs/ac (183 vs 126 lbs/ac), while the average yields did not differ significantly (13.0 vs 13.1 T/ac; p=0.74). Reducing N rates without compromising yields resulted in $34/ac higher partial profit from the Adapt-N treatment. The economic and agronomic benefits of Adapt-N are similar to those from a larger study conducted in IA and NY using data from 113 on-farm trials (Sela et al., 2016).
Lysimeter measured nitrate concentrations: In addition to the economic benefits, substantial environmental advantages were found with Adapt-N. When both seasons and soil textures were combined, the average NO3 concentration from the grab samples collected from the lysimeters indicated significantly lower water quality impacts under Adapt-N management vs CNC (11.0 and 15.3 mg/L, respectively; p<0.01). On average there was a 28% reduction in NO3 concentration from the Adapt-N treatments. When analyzing the clay loam and loamy sand plots separately but still combining the two seasons, NO3 concentration was significantly higher in the CNC loamy sand treatments (20.1 vs 13.7 for Adapt-N; p<0.01) and they trended toward higher concentrations in the clay loam treatments (10.0 vs 8.0 for Adapt-N; p=0.09).
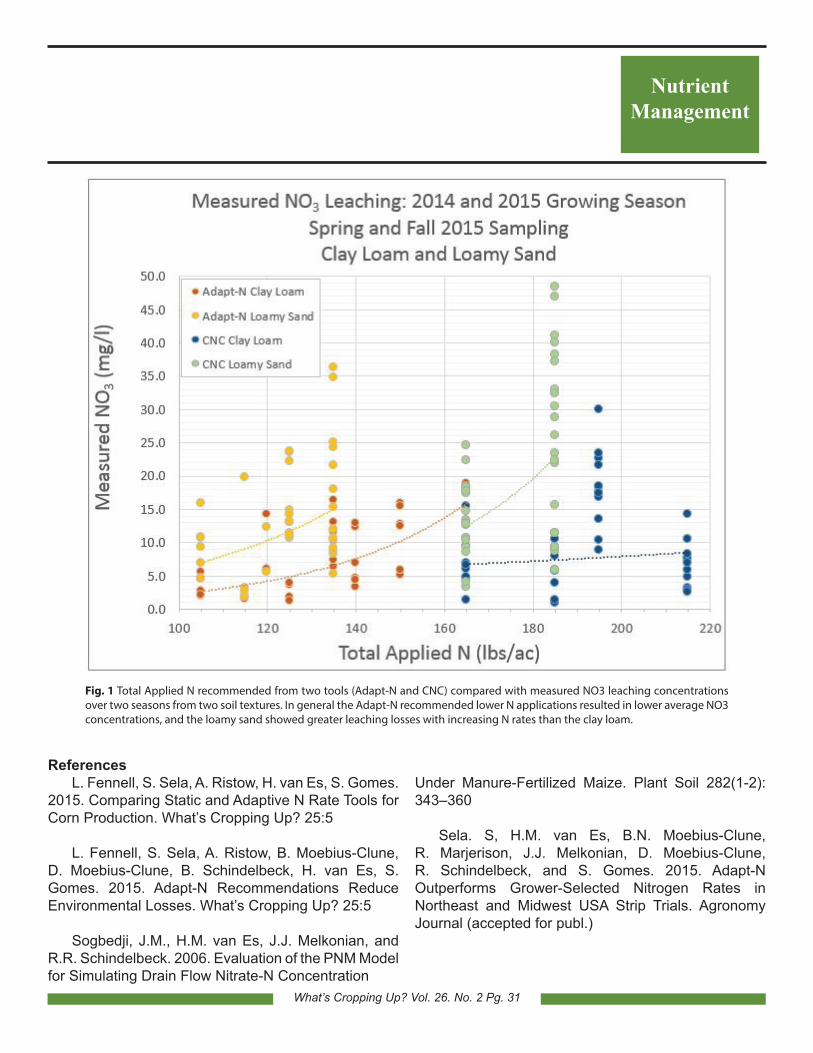
Figure 1 shows nitrate concentrations for each drain water sample. Generally, there was a large range of losses throughout the year, but they trended up with more applied N. As could be expected, we saw that the loamy sand plots had higher losses, regardless of treatment, due to the lower water holding capacity of the coarse textured soil. Similarly, NO3 concentrations from the clay loam plots were less responsive to the amount of applied N compared to the sandy plots, but there were still substantial losses, especially at the higher rates. We conclude that the lower applied N rate in the Adapt-N treatments resulted in an overall lower concentration of NO3 in leachate from the lysimeters.
ConclusionsThis study proves both economic and environmental gains from using Adapt-N’s adaptive approach to estimating in-season N rates across two distinct soil types in Northern New York. In all, the Adapt-N recommended rates were lower than the CNC rates but maintained the same yield and showed greater profits. Overall, the use of Adapt-N can significantly contribute to nitrogen reduction goals by reducing overall inputs, minimizing environmental losses, and improving farmer profits.
AcknowledgementsThis work was supported by funding from the USDA-NRCS, New York Farm Viability Institute, USDA-NIFA, and USDA-Sustainable Agriculture Research and Extension, and the Northern New York Agricultural Development Program.
Nutrient Management
Table 1 2014 and 2015 growing season comparison of N application rates, yield, partial profits, and NO3 concentration. Water quality samples were taken in the spring and fall of 2015 (after the 2014 and 2015 growing seasons, respectively).
What’s Cropping Up? Vol. 26. No. 2 Pg. 31
ReferencesL. Fennell, S. Sela, A. Ristow, H. van Es, S. Gomes.
2015. Comparing Static and Adaptive N Rate Tools for Corn Production. What’s Cropping Up? 25:5
L. Fennell, S. Sela, A. Ristow, B. Moebius-Clune, D. Moebius-Clune, B. Schindelbeck, H. van Es, S. Gomes. 2015. Adapt-N Recommendations Reduce Environmental Losses. What’s Cropping Up? 25:5
Sogbedji, J.M., H.M. van Es, J.J. Melkonian, and R.R. Schindelbeck. 2006. Evaluation of the PNM Model for Simulating Drain Flow Nitrate-N Concentration
Under Manure-Fertilized Maize. Plant Soil 282(1-2): 343–360
Sela. S, H.M. van Es, B.N. Moebius-Clune, R. Marjerison, J.J. Melkonian, D. Moebius-Clune, R. Schindelbeck, and S. Gomes. 2015. Adapt-N Outperforms Grower-Selected Nitrogen Rates in Northeast and Midwest USA Strip Trials. Agronomy Journal (accepted for publ.)
Nutrient Management
Fig. 1 Total Applied N recommended from two tools (Adapt-N and CNC) compared with measured NO3 leaching concentrations over two seasons from two soil textures. In general the Adapt-N recommended lower N applications resulted in lower average NO3 concentrations, and the loamy sand showed greater leaching losses with increasing N rates than the clay loam.
What’s Cropping Up? Vol. 26. No. 2
JUN 2 Small Grains Management Field Day - Aurora, NYJUL 7 Seed Growers Field Day - Ithaca, NY JUL 8 Hudson Valley Small Grains Field Day - NY
What's Cropping Up? is a bimonthly electronic newsletter distributed by the Soil and Crop Sciences Section at Cornell University. The purpose of the newsletter is to provide timely information on field crop production and environmental issues as it relates to New York agriculture. Articles are regularly contributed by the following Departments/Sections at Cornell University: Soil and Crop Sciences, Plant Breeding, Plant Pathology, and Entomology. To get on the email list, send your name and address to Jenn Thomas-Murphy, 237 Emerson Hall, Cornell University, Ithaca, NY 14853 or [email protected].
Calendar of Events
Soil and Crop Sciences Section237 Emerson HallCornell UniversityIthaca, NY 14853
Stay Connected!