Embed Size (px)
Citation preview

Annual Report Ending March 31, 2014
WHATEVER IT TAKES

Taiga’s success is due to entrepreneurial employees going the extra mile for the customer.
TABLE OF CONTENTS Page
Financial Highlights 1
Letter to Shareholders 2
Branded Products 4
Distribution Network 5
Management’s Discussion And Analysis 6
Independent Auditors’ Report 16
Page
Consolidated Balance Sheets 18
Consolidated Statements of Earnings and Comprehensive Income 19
Consolidated Statements of Changes in Shareholders’ Deficiency 20
Consolidated Statements of Cash Flows 21
Notes to the Consolidated Financial Statements 22
Corporate Information IBC
1TAIGA BUILDING PRODUCTS LTD., ANNUAL REPORT ENDING MARCH 31, 2014
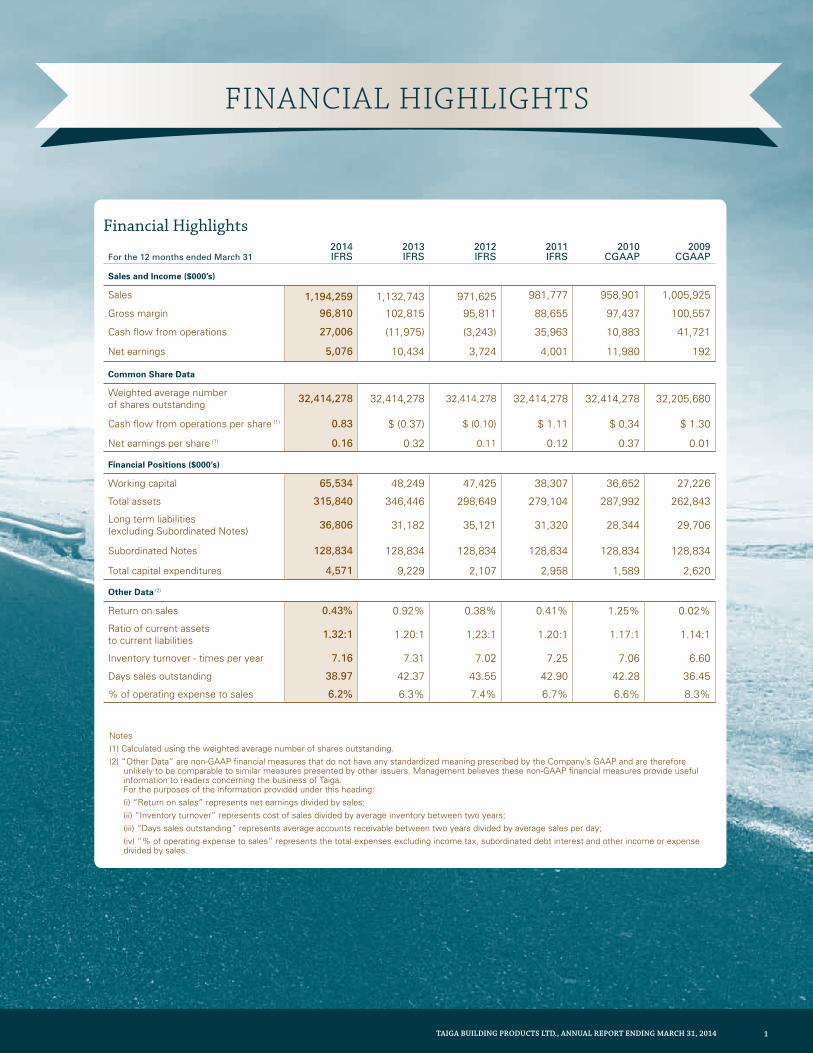
Financial Highlights
For the 12 months ended March 312014 IFRS
2013 IFRS
2012 IFRS
2011 IFRS
2010 CGAAP
2009 CGAAP
Sales and Income ($000’s)
Sales 1,194,259 1,132,743 971,625 981,777 958,901 1,005,925
Gross margin 96,810 102,815 95,811 88,655 97,437 100,557
Cash flow from operations 27,006 (11,975) (3,243) 35,963 10,883 41,721
Net earnings 5,076 10,434 3,724 4,001 11,980 192
Common Share Data
Weighted average number of shares outstanding 32,414,278 32,414,278 32,414,278 32,414,278 32,414,278 32,205,680
Cash flow from operations per share (1) 0.83 $ (0.37) $ (0.10) $ 1.11 $ 0.34 $ 1.30
Net earnings per share (1) 0.16 0.32 0.11 0.12 0.37 0.01
Financial Positions ($000’s)
Working capital 65,534 48,249 47,425 38,307 36,652 27,226
Total assets 315,840 346,446 298,649 279,104 287,992 262,843
Long term liabilities (excluding Subordinated Notes) 36,806 31,182 35,121 31,320 28,344 29,706
Subordinated Notes 128,834 128,834 128,834 128,834 128,834 128,834
Total capital expenditures 4,571 9,229 2,107 2,958 1,589 2,620
Other Data (2)
Return on sales 0.43% 0.92% 0.38% 0.41% 1.25% 0.02%
Ratio of current assets to current liabilities 1.32:1 1.20:1 1.23:1 1.20:1 1.17:1 1.14:1
Inventory turnover - times per year 7.16 7.31 7.02 7.25 7.06 6.60
Days sales outstanding 38.97 42.37 43.55 42.90 42.28 36.45
% of operating expense to sales 6.2% 6.3% 7.4% 6.7% 6.6% 8.3%
Notes(1) Calculated using the weighted average number of shares outstanding. (2) “Other Data” are non-GAAP financial measures that do not have any standardized meaning prescribed by the Company’s GAAP and are therefore
unlikely to be comparable to similar measures presented by other issuers. Management believes these non-GAAP financial measures provide useful information to readers concerning the business of Taiga. For the purposes of the information provided under this heading:
(i) “Return on sales” represents net earnings divided by sales; (ii) “Inventory turnover” represents cost of sales divided by average inventory between two years; (iii) “Days sales outstanding” represents average accounts receivable between two years divided by average sales per day; (iv) “% of operating expense to sales” represents the total expenses excluding income tax, subordinated debt interest and other income or expense
divided by sales.
FINANCIAL HIGHLIGHTS
2 TAIGA BUILDING PRODUCTS LTD., ANNUAL REPORT ENDING MARCH 31, 2014
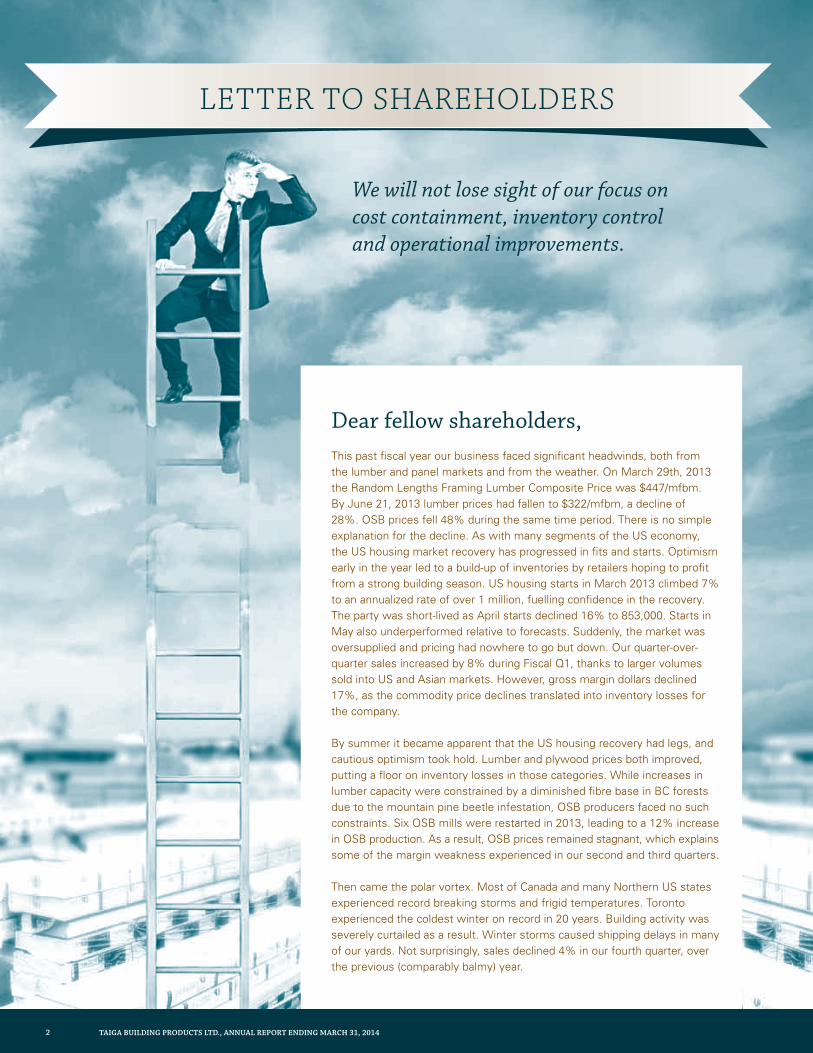
Dear fellow shareholders, This past fiscal year our business faced significant headwinds, both from the lumber and panel markets and from the weather. On March 29th, 2013 the Random Lengths Framing Lumber Composite Price was $447/mfbm. By June 21, 2013 lumber prices had fallen to $322/mfbm, a decline of 28%. OSB prices fell 48% during the same time period. There is no simple explanation for the decline. As with many segments of the US economy, the US housing market recovery has progressed in fits and starts. Optimism early in the year led to a build-up of inventories by retailers hoping to profit from a strong building season. US housing starts in March 2013 climbed 7% to an annualized rate of over 1 million, fuelling confidence in the recovery. The party was short-lived as April starts declined 16% to 853,000. Starts in May also underperformed relative to forecasts. Suddenly, the market was oversupplied and pricing had nowhere to go but down. Our quarter-over-quarter sales increased by 8% during Fiscal Q1, thanks to larger volumes sold into US and Asian markets. However, gross margin dollars declined 17%, as the commodity price declines translated into inventory losses for the company.
By summer it became apparent that the US housing recovery had legs, and cautious optimism took hold. Lumber and plywood prices both improved, putting a floor on inventory losses in those categories. While increases in lumber capacity were constrained by a diminished fibre base in BC forests due to the mountain pine beetle infestation, OSB producers faced no such constraints. Six OSB mills were restarted in 2013, leading to a 12% increase in OSB production. As a result, OSB prices remained stagnant, which explains some of the margin weakness experienced in our second and third quarters.
Then came the polar vortex. Most of Canada and many Northern US states experienced record breaking storms and frigid temperatures. Toronto experienced the coldest winter on record in 20 years. Building activity was severely curtailed as a result. Winter storms caused shipping delays in many of our yards. Not surprisingly, sales declined 4% in our fourth quarter, over the previous (comparably balmy) year.
LETTER To SHAREHoLdERS
We will not lose sight of our focus on cost containment, inventory control and operational improvements.
3TAIGA BUILDING PRODUCTS LTD., ANNUAL REPORT ENDING MARCH 31, 2014
Looking ForwardThe coming year will bring continued softness in the Canadian housing market as eroding affordability curbs demand. Some of this weakness should be mitigated by growth in the US housing market. The US housing recovery benefits our US operations. However, the US recovery should also bolster commodity prices, increasing profits across every Taiga division. If the past fiscal year taught us anything, it is that markets are unpredictable, and optimism should always be tempered with risk planning. We will not lose sight of our focus on cost containment, inventory control and operational improvements. We will drive out non-value added costs. We will continue to refresh our product mix with innovative products that generate excitement with our customers and drive profit margins for our shareholders.
In 2013 we celebrated Taiga’s 40th anniversary. We rolled out a new mission and vision statement, hosted customer appreciation barbeques, partied with our staff, and reminisced about the many challenges overcome, and accomplishments achieved since Taiga first opened its doors in 1973. Our first annual report, released just after our 1993 IPO, credited Taiga’s success to dedicated, entrepreneurial employees going the extra mile for the customer. That “whatever it takes” attitude is still alive and well in every one of our locations. We believe it’s what sets us apart from the competition. It’s a competitive advantage that’s not easily copied because it is deeply rooted in our corporate culture. It’s the reason why distribution will still be a vital part of the supply chain 40 years from now. From the grassroots up, your company is in good hands.
Finally, a warm thanks to all of our employees, suppliers, customers and other stakeholders for the exceptional efforts through some tough markets and brutal weather conditions.
Commodity prices and weather will always be external threats to our results. Part of doing “whatever it takes” for Taiga is actively managing the drivers of our business that we do control. We continued to manage costs, maintaining our operating expense ratio at 6.2% of sales. We monitored investments in inventory, increasing inventory turnover and reducing inventory carrying costs. The design of Taiga’s performance based bonus scheme also guards against cost creep. Bonuses are tied directly to results, which reduces the impact of revenue declines on Taiga’s bottom line, while ensuring employees’ interests are aligned with shareholders.
Our Results in DetailsSales of lumber, panels, treated and engineered wood products increased by 5% over the previous year. Strength in lumber products was offset by weakness in plywood and OSB sales. Gross margins on these product lines decreased 8.7% for reasons mentioned above. We continue to face significant competition in the treated market as the industry consolidates. Sales and gross margin on allied products grew 5% over the prior year. Trex decking made further advances in market share this year and our flooring business continued to grow as new products, such as Easystreet vinyl flooring, gained traction in the marketplace.
Sales at our Western Canadian branches improved over the prior year. Our Eastern Canadian branches were negatively impacted by the severe winter weather, with Quebec and the Maritimes particularly badly hit. Sales at our California operations benefited from the housing recovery in that market, but saw margins erode significantly due to commodity price declines. Our biggest year-over-year increase in sales came from our export division, with growth driven by the growing market for wood products in China.
In November 2013 we renewed our senior credit facility, upsizing it to $225 million and reducing our borrowing costs. In February 2014, we completed a sale and leaseback of five properties. The proceeds from this transaction strengthen our cash availability, and help position us to take advantage of growth opportunities.
Cam White President and CEO
Kooi Ong Tong Chairman of the Board

4 TAIGA BUILDING PRODUCTS LTD., ANNUAL REPORT ENDING MARCH 31, 2014
BRANdEd PRodUCTS
6) Edmonton, Alberta 85,000 sq.ft. building
on 14.0 acres Distribution Centre
7) Edmonton, Alberta 54,000 sq.ft. building
on 8.5 acres Wood Preservation Plant
8) Saskatoon, Saskatchewan 14,400 sq.ft. building
on 4.0 acres Distribution Centre
Flooring Late in 2011 we introduced Easystreet, Taiga Synergy’s entry into the LVT (Luxury Vinyl Tile and Planks) flooring market. Vinyl tiles have had a good reputation for quality and value so with the addition of wood decors and a glueless locking click system it has become a major contender in the DIY
flooring market. Many laminate flooring manufacturers have already installed equipment to produce LVT. The launch of Easystreet is in keeping with our philosophy, to continually evolve our flooring program to the benefit of our channel partners. For a complete view of our flooring products, visit www.taigaselectflooring.com and www.easyinstall.ca.
Preserved Wood Taiga produces preserved lumber at three pressure-treating plants strategically located to service the Canadian market. Preserved Wood is an environmentally friendly and economical product designed for use in outdoor applications such as Permanent Wood Foundations for houses, fencing, landscaping and decking.
Pressure-treated with a non-leaching chemical solution that protects from decay and insects, “Taiga Select” brand of appearance preserved wood products come with a limited lifetime guarantee. Taiga has augmented it’s offering of standard treated products with two coloured product options – Taiga Select “Cedarlast”, is stained with a long-lasting cedar coloured stain for use in decks and fencing and DesignWood is a one-step pigment and dye combination colourant that is added to our chemical solution that produces a natural looking brown finished board.
Mouldings
Taiga Select Mouldings offer builders and homeowners the ability to add their own unique sense of style to their home. From simple baseboards,
casings, and stylish crowns ,Taiga Select Mouldings add elegance to any room.Taiga distributes a wide range of moulding profiles sourced from North America, SouthAmerica and Asia. Mouldings are available at most branches throughout Canada.
That “whatever it takes” attitude is still alive and well in every one of our locations. We believe it’s what sets us apart from the competition.

5TAIGA BUILDING PRODUCTS LTD., ANNUAL REPORT ENDING MARCH 31, 2014
1) Nanaimo, British Columbia 10,500 sq.ft. building
on 2.0 acres Distribution Centre
2) Langley, British Columbia 105,000 sq.ft. building
on 10.0 acres Distribution Centre
3) Langley, British Columbia 42,000 sq.ft. building
on 12.4 acres Wood Preservation Plant
4) Kelowna, British Columbia 14,500 sq.ft. building
on 2.5 acres Distribution Centre
5) Calgary, Alberta 50,000 sq.ft. building
on 15.0 acres Distribution Centre
6) Edmonton, Alberta 85,000 sq.ft. building
on 14.0 acres Distribution Centre
7) Edmonton, Alberta 54,000 sq.ft. building
on 8.5 acres Wood Preservation Plant
8) Saskatoon, Saskatchewan 14,400 sq.ft. building
on 4.0 acres Distribution Centre
9) Regina, Saskatchewan 21,000 sq.ft. building
on 4.2 acres Distribution Centre
10) Winnipeg, Manitoba 14,000 sq.ft. building
on 4.0 acres Distribution Centre
11) Sudbury, Ontario 14,000 sq.ft. building on 5.0 acres Distribution Centre
12) Monetville, Ontario 20,924 sq.ft. building on 10.8 acresWood Preservation Plant
13) Milton, Ontario 68,000 sq.ft. building on 11.5 acres Distribution Centre
14) Boucherville, Quebec 52,923 sq.ft building on 12.0 acres Distribution Centre
15) St. Augustin, Quebec 36,000 sq.ft. building on 7.0 acres Distribution Centre
19) Rocklin, California 100,000 sq.ft. building on 15.0 acres Distribution Centre
20) Sanger, California 109,250 sq.ft. building on 12.6 acres Distribution Centre
17) Moncton, New Brunswick 20,000 sq.ft. building on 2 acres Distribution Centre
16) Dartmouth, Nova Scotia 58,000 sq.ft. building on 6.5 acres Distribution Centre
18) Paradise, Newfoundland 11,000 sq.ft. building on 1.5 acres Distribution Centre
DISTRIBUTION CENTRES
WOOD PRESERVATION AND REMANUFACTURING PLANTS
RELOAD CENTRES
1 2 3 4 5
6 78
1011 12
13
1415
1617
18
1920
9
6 TAIGA BUILDING PRODUCTS LTD., ANNUAL REPORT ENDING MARCH 31, 2014
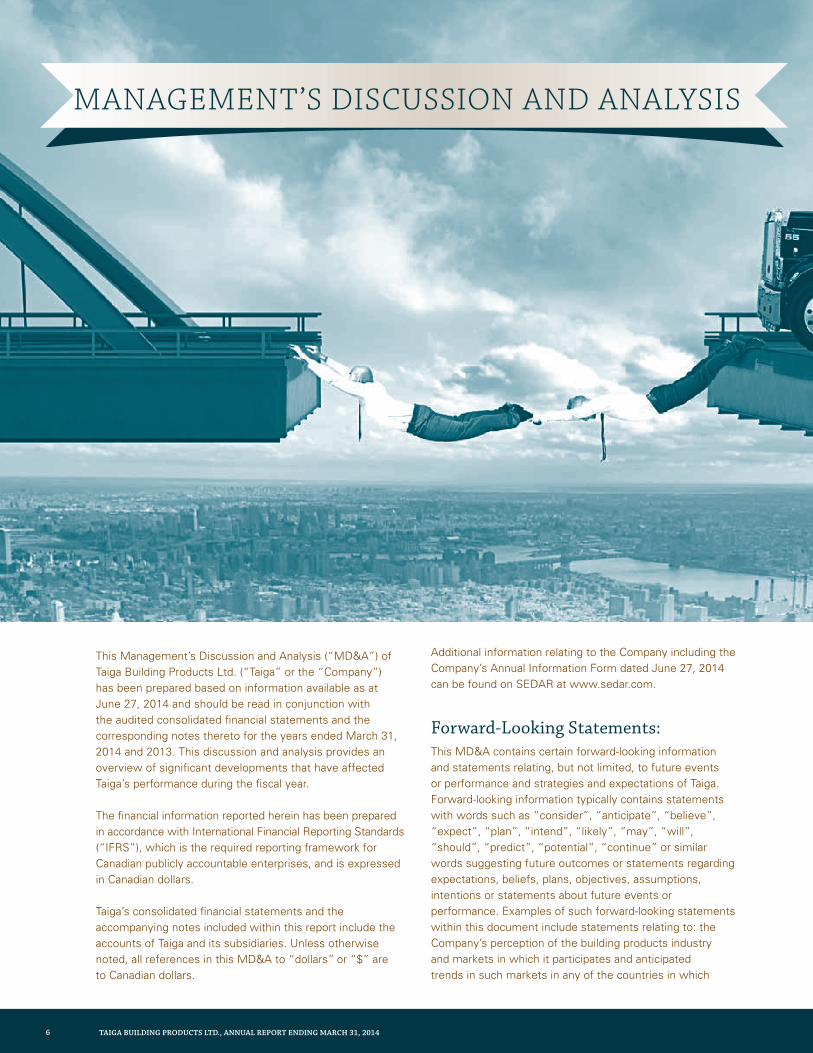
This Management’s Discussion and Analysis (“MD&A”) of Taiga Building Products Ltd. (“Taiga” or the “Company”) has been prepared based on information available as at June 27, 2014 and should be read in conjunction with the audited consolidated financial statements and the corresponding notes thereto for the years ended March 31, 2014 and 2013. This discussion and analysis provides an overview of significant developments that have affected Taiga’s performance during the fiscal year.
The financial information reported herein has been prepared in accordance with International Financial Reporting Standards (“IFRS”), which is the required reporting framework for Canadian publicly accountable enterprises, and is expressed in Canadian dollars.
Taiga’s consolidated financial statements and the accompanying notes included within this report include the accounts of Taiga and its subsidiaries. Unless otherwise noted, all references in this MD&A to “dollars” or “$” are to Canadian dollars.
Additional information relating to the Company including the Company’s Annual Information Form dated June 27, 2014 can be found on SEDAR at www.sedar.com.
Forward-Looking Statements: This MD&A contains certain forward-looking information and statements relating, but not limited, to future events or performance and strategies and expectations of Taiga. Forward-looking information typically contains statements with words such as “consider”, “anticipate”, “believe”, “expect”, “plan”, “intend”, “likely”, “may”, “will”, “should”, “predict”, “potential”, “continue” or similar words suggesting future outcomes or statements regarding expectations, beliefs, plans, objectives, assumptions, intentions or statements about future events or performance. Examples of such forward-looking statements within this document include statements relating to: the Company’s perception of the building products industry and markets in which it participates and anticipated trends in such markets in any of the countries in which
MANAGEMENT’S dISCUSSIoN ANd ANALYSIS
7TAIGA BUILDING PRODUCTS LTD., ANNUAL REPORT ENDING MARCH 31, 2014
the Company does business; the Company’s anticipated business operations, inventory levels and ability to meet order demand; the Company’s anticipated ability to procure products and its relationship with suppliers; sufficiency of cash flows; and outcome of litigation. Readers should be aware that these statements are subject to known and unknown risks, uncertainties and other factors that could cause actual results to differ materially from those suggested by the forward-looking statements. These forward-looking statements reflect management’s current expectations or beliefs and are based on information currently available to Taiga and although Taiga believes it has a reasonable basis for making the forward-looking statements included in this document, readers are cautioned not to place undue reliance on such forward-looking information. By its nature, the forward-looking information of Taiga involves numerous assumptions and inherent risks and uncertainties, both general and specific, that contribute to the possibility that the predictions, forecasts and other forward-looking statements will not occur. These factors include, but are not limited to: changes in business strategies; the effects of litigation,
competition and pricing pressures; changes in operational costs; changes in laws and regulations, including tax, environmental, employment, competition, anti-terrorism and trade laws and Taiga’s anticipation of and success in managing the risks associated with the foregoing; and other risks detailed in this MD&A and Taiga’s filings with the Canadian securities regulatory authorities available at www.sedar.com. These forward-looking statements speak only as of the date of this discussion and analysis. Taiga does not undertake, and specifically disclaims, any obligation to update or revise any forward looking information, whether as a result of new information, future developments or otherwise, except as required by applicable law.
Non-IFRS Financial Measure: In this MD&A, reference is made to EBITDA, which represents earnings before interest, taxes, and amortization. As there is no generally accepted method of calculating EBITDA, the measure as calculated by Taiga might not be comparable to similarly titled measures reported by other issuers. EBITDA is presented as management believes it is a useful indicator of a company’s ability to meet debt service and capital expenditure requirements and because management interprets trends in EBITDA as an indicator of relative operating performance. EBITDA should not be considered by an investor as an alternative to net income or cash flows as determined in accordance with IFRS. Reconciliations of EBITDA to net earnings reported in accordance with IFRS are included in this MD&A.
Market and Industry Data: Unless otherwise indicated, the market and industry data contained in this MD&A is based upon information of independent industry and government publications and management’s knowledge of, and experience in, the markets in which the Company operates. While management believes this data to be reliable, market and industry data is subject to variation and cannot be verified with complete certainty due to limits on the availability and reliability of raw data, the voluntary nature of the data gathering process and other limitations and uncertainties inherent in any statistical survey. The Company has not independently verified any of the data from third party sources referred to in this MD&A and no representation is given as to the accuracy of any of the data referred to in this MD&A obtained from third party sources.
8 TAIGA BUILDING PRODUCTS LTD., ANNUAL REPORT ENDING MARCH 31, 2014
MANAGEMENT’S DISCUSSION AND ANALySIS
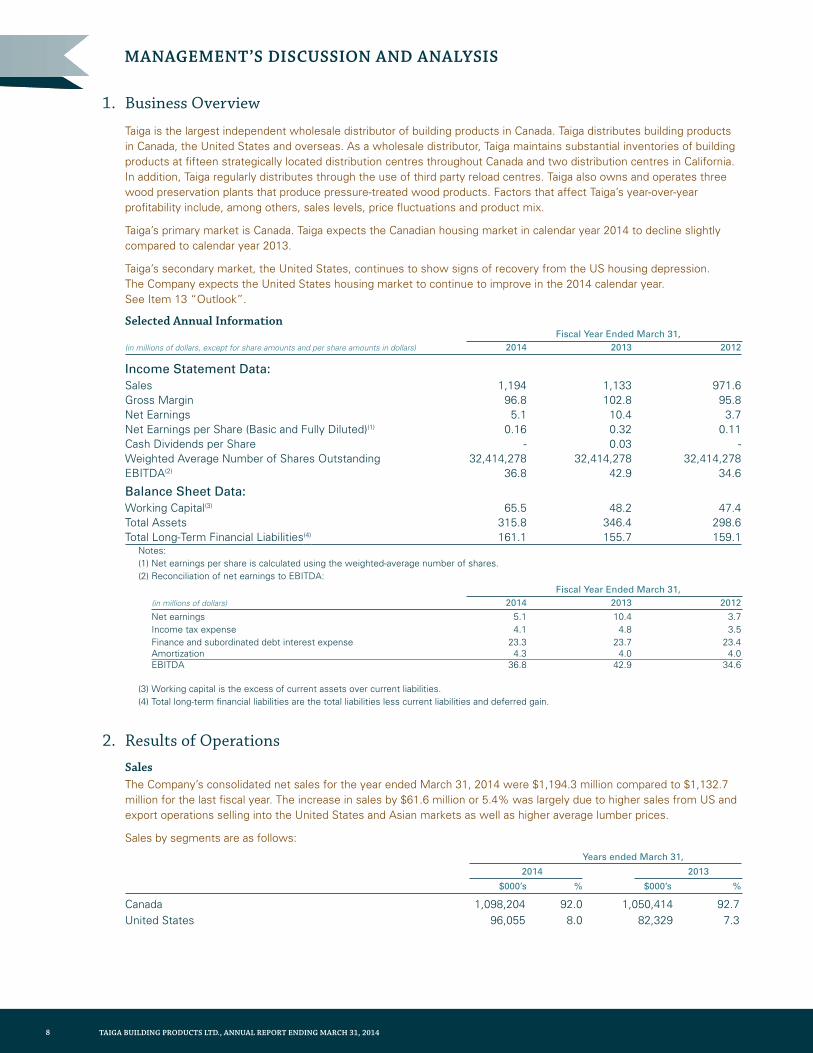
1. Business Overview
Taiga is the largest independent wholesale distributor of building products in Canada. Taiga distributes building products in Canada, the United States and overseas. As a wholesale distributor, Taiga maintains substantial inventories of building products at fifteen strategically located distribution centres throughout Canada and two distribution centres in California. In addition, Taiga regularly distributes through the use of third party reload centres. Taiga also owns and operates three wood preservation plants that produce pressure-treated wood products. Factors that affect Taiga’s year-over-year profitability include, among others, sales levels, price fluctuations and product mix.
Taiga’s primary market is Canada. Taiga expects the Canadian housing market in calendar year 2014 to decline slightly compared to calendar year 2013.
Taiga’s secondary market, the United States, continues to show signs of recovery from the US housing depression. The Company expects the United States housing market to continue to improve in the 2014 calendar year. See Item 13 “Outlook”.
Selected Annual Information Fiscal Year Ended March 31, (in millions of dollars, except for share amounts and per share amounts in dollars) 2014 2013 2012
Income Statement Data:Sales 1,194 1,133 971.6 Gross Margin 96.8 102.8 95.8 Net Earnings 5.1 10.4 3.7 Net Earnings per Share (Basic and Fully Diluted)(1) 0.16 0.32 0.11 Cash Dividends per Share - 0.03 - Weighted Average Number of Shares Outstanding 32,414,278 32,414,278 32,414,278 EBITDA(2) 36.8 42.9 34.6
Balance Sheet Data: Working Capital(3) 65.5 48.2 47.4 Total Assets 315.8 346.4 298.6 Total Long-Term Financial Liabilities(4) 161.1 155.7 159.1
Notes: (1) Net earnings per share is calculated using the weighted-average number of shares.(2) Reconciliation of net earnings to EBITDA:
Fiscal Year Ended March 31, (in millions of dollars) 2014 2013 2012
Net earnings 5.1 10.4 3.7Income tax expense 4.1 4.8 3.5Finance and subordinated debt interest expense 23.3 23.7 23.4 Amortization 4.3 4.0 4.0 EBITDA 36.8 42.9 34.6
(3) Working capital is the excess of current assets over current liabilities.(4) Total long-term financial liabilities are the total liabilities less current liabilities and deferred gain.
2. Results of Operations Sales
The Company’s consolidated net sales for the year ended March 31, 2014 were $1,194.3 million compared to $1,132.7 million for the last fiscal year. The increase in sales by $61.6 million or 5.4% was largely due to higher sales from US and export operations selling into the United States and Asian markets as well as higher average lumber prices.
Sales by segments are as follows:
Years ended March 31, 2014 2013
$000’s % $000’s %
Canada 1,098,204 92.0 1,050,414 92.7United States 96,055 8.0 82,329 7.3
9TAIGA BUILDING PRODUCTS LTD., ANNUAL REPORT ENDING MARCH 31, 2014
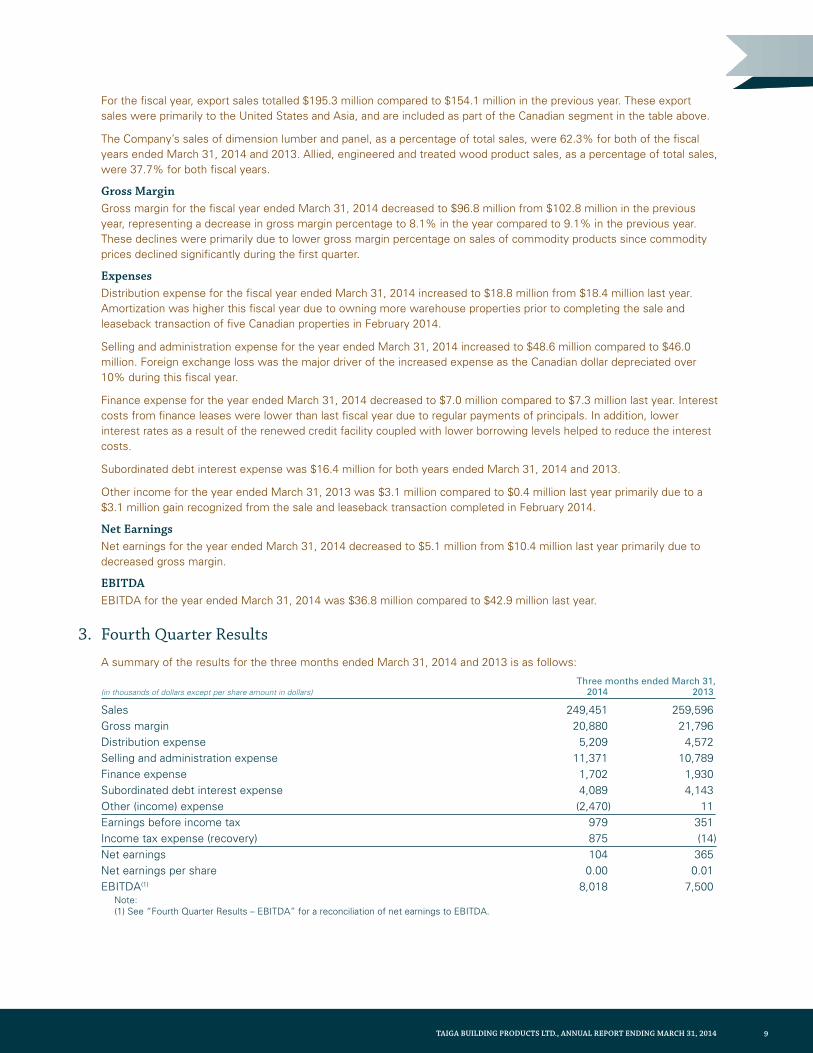
For the fiscal year, export sales totalled $195.3 million compared to $154.1 million in the previous year. These export sales were primarily to the United States and Asia, and are included as part of the Canadian segment in the table above.
The Company’s sales of dimension lumber and panel, as a percentage of total sales, were 62.3% for both of the fiscal years ended March 31, 2014 and 2013. Allied, engineered and treated wood product sales, as a percentage of total sales, were 37.7% for both fiscal years.
Gross MarginGross margin for the fiscal year ended March 31, 2014 decreased to $96.8 million from $102.8 million in the previous year, representing a decrease in gross margin percentage to 8.1% in the year compared to 9.1% in the previous year. These declines were primarily due to lower gross margin percentage on sales of commodity products since commodity prices declined significantly during the first quarter.
ExpensesDistribution expense for the fiscal year ended March 31, 2014 increased to $18.8 million from $18.4 million last year. Amortization was higher this fiscal year due to owning more warehouse properties prior to completing the sale and leaseback transaction of five Canadian properties in February 2014.
Selling and administration expense for the year ended March 31, 2014 increased to $48.6 million compared to $46.0 million. Foreign exchange loss was the major driver of the increased expense as the Canadian dollar depreciated over 10% during this fiscal year.
Finance expense for the year ended March 31, 2014 decreased to $7.0 million compared to $7.3 million last year. Interest costs from finance leases were lower than last fiscal year due to regular payments of principals. In addition, lower interest rates as a result of the renewed credit facility coupled with lower borrowing levels helped to reduce the interest costs.
Subordinated debt interest expense was $16.4 million for both years ended March 31, 2014 and 2013.
Other income for the year ended March 31, 2013 was $3.1 million compared to $0.4 million last year primarily due to a $3.1 million gain recognized from the sale and leaseback transaction completed in February 2014.
Net Earnings Net earnings for the year ended March 31, 2014 decreased to $5.1 million from $10.4 million last year primarily due to decreased gross margin.
EBITDAEBITDA for the year ended March 31, 2014 was $36.8 million compared to $42.9 million last year.
3. Fourth Quarter Results
A summary of the results for the three months ended March 31, 2014 and 2013 is as follows:
Three months ended March 31,(in thousands of dollars except per share amount in dollars) 2014 2013
Sales 249,451 259,596Gross margin 20,880 21,796Distribution expense 5,209 4,572Selling and administration expense 11,371 10,789Finance expense 1,702 1,930Subordinated debt interest expense 4,089 4,143Other (income) expense (2,470) 11 Earnings before income tax 979 351Income tax expense (recovery) 875 (14)Net earnings 104 365Net earnings per share 0.00 0.01EBITDA(1) 8,018 7,500
Note: (1) See “Fourth Quarter Results – EBITDA” for a reconciliation of net earnings to EBITDA.
10 TAIGA BUILDING PRODUCTS LTD., ANNUAL REPORT ENDING MARCH 31, 2014
MANAGEMENT’S DISCUSSION AND ANALySIS
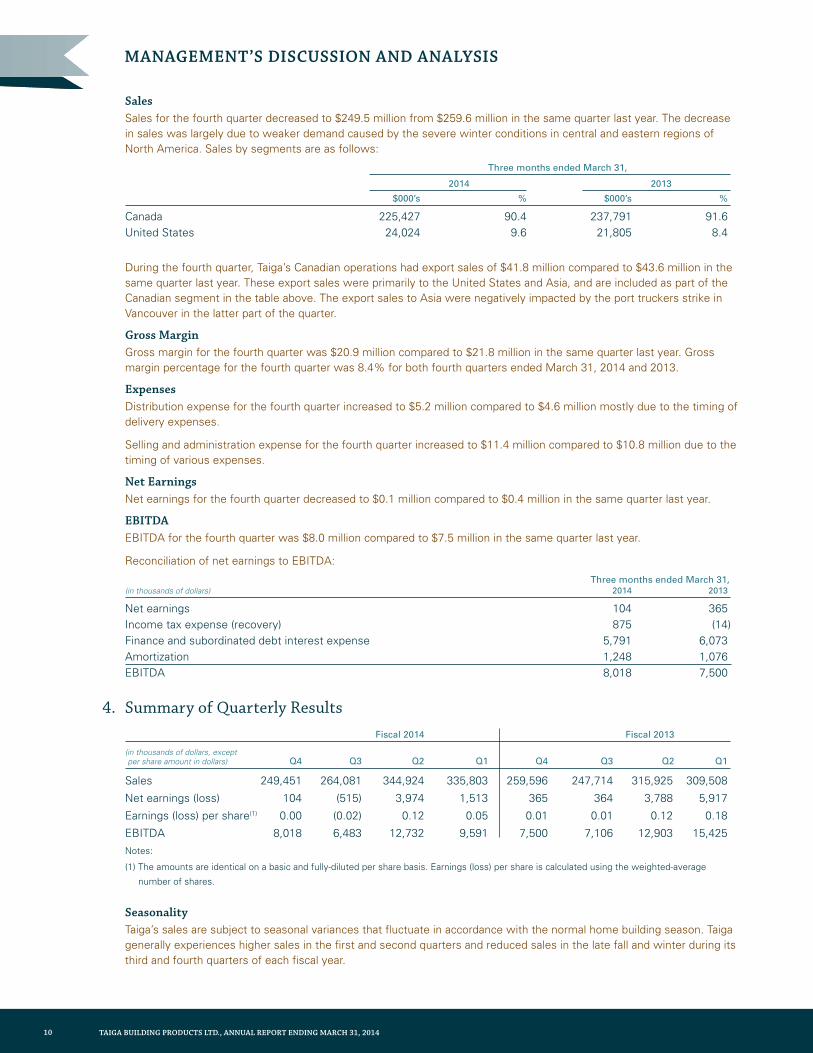
Sales Sales for the fourth quarter decreased to $249.5 million from $259.6 million in the same quarter last year. The decrease in sales was largely due to weaker demand caused by the severe winter conditions in central and eastern regions of North America. Sales by segments are as follows:
Three months ended March 31,
2014 2013
$000’s % $000’s %
Canada 225,427 90.4 237,791 91.6United States 24,024 9.6 21,805 8.4
During the fourth quarter, Taiga’s Canadian operations had export sales of $41.8 million compared to $43.6 million in the same quarter last year. These export sales were primarily to the United States and Asia, and are included as part of the Canadian segment in the table above. The export sales to Asia were negatively impacted by the port truckers strike in Vancouver in the latter part of the quarter.
Gross MarginGross margin for the fourth quarter was $20.9 million compared to $21.8 million in the same quarter last year. Gross margin percentage for the fourth quarter was 8.4% for both fourth quarters ended March 31, 2014 and 2013.
ExpensesDistribution expense for the fourth quarter increased to $5.2 million compared to $4.6 million mostly due to the timing of delivery expenses.
Selling and administration expense for the fourth quarter increased to $11.4 million compared to $10.8 million due to the timing of various expenses.
Net EarningsNet earnings for the fourth quarter decreased to $0.1 million compared to $0.4 million in the same quarter last year.
EBITDAEBITDA for the fourth quarter was $8.0 million compared to $7.5 million in the same quarter last year.
Reconciliation of net earnings to EBITDA:
Three months ended March 31,(in thousands of dollars) 2014 2013
Net earnings 104 365Income tax expense (recovery) 875 (14)Finance and subordinated debt interest expense 5,791 6,073Amortization 1,248 1,076 EBITDA 8,018 7,500
4. Summary of Quarterly Results Fiscal 2014 Fiscal 2013
(in thousands of dollars, except per share amount in dollars) Q4 Q3 Q2 Q1 Q4 Q3 Q2 Q1
Sales 249,451 264,081 344,924 335,803 259,596 247,714 315,925 309,508
Net earnings (loss) 104 (515) 3,974 1,513 365 364 3,788 5,917
Earnings (loss) per share(1) 0.00 (0.02) 0.12 0.05 0.01 0.01 0.12 0.18
EBITDA 8,018 6,483 12,732 9,591 7,500 7,106 12,903 15,425Notes:
(1) The amounts are identical on a basic and fully-diluted per share basis. Earnings (loss) per share is calculated using the weighted-average
number of shares.
SeasonalityTaiga’s sales are subject to seasonal variances that fluctuate in accordance with the normal home building season. Taiga generally experiences higher sales in the first and second quarters and reduced sales in the late fall and winter during its third and fourth quarters of each fiscal year.
11TAIGA BUILDING PRODUCTS LTD., ANNUAL REPORT ENDING MARCH 31, 2014
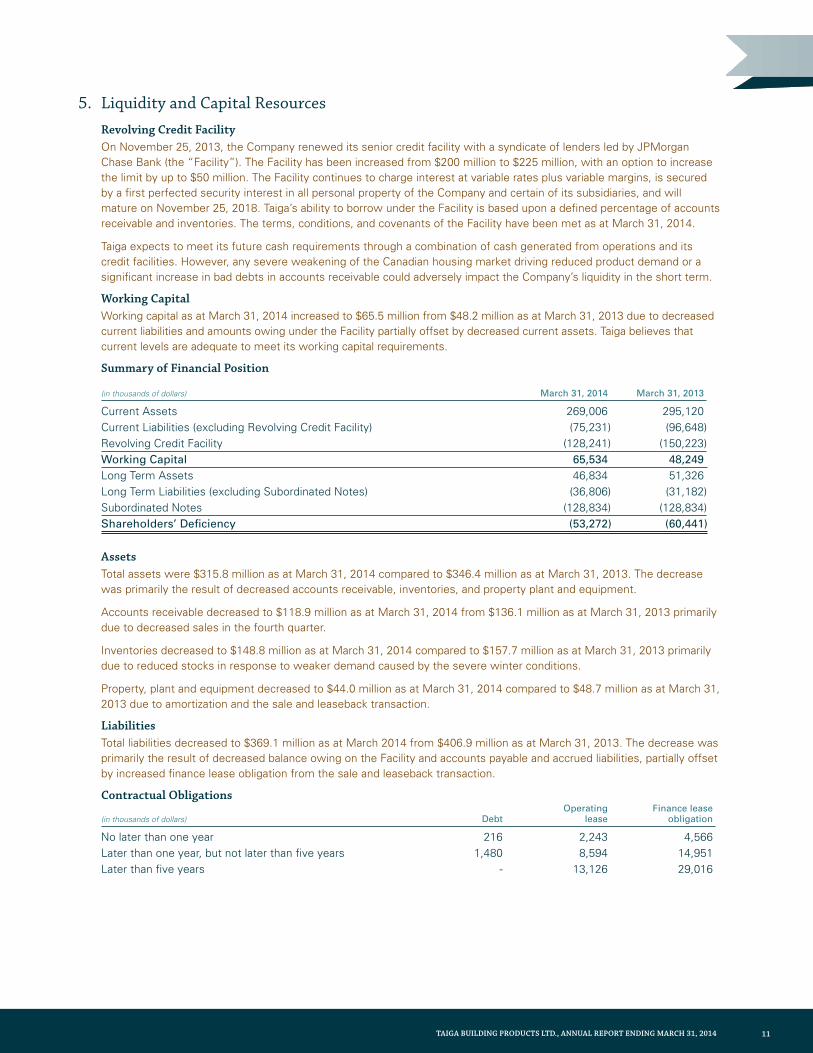
5. Liquidity and Capital Resources Revolving Credit Facility
On November 25, 2013, the Company renewed its senior credit facility with a syndicate of lenders led by JPMorgan Chase Bank (the “Facility”). The Facility has been increased from $200 million to $225 million, with an option to increase the limit by up to $50 million. The Facility continues to charge interest at variable rates plus variable margins, is secured by a first perfected security interest in all personal property of the Company and certain of its subsidiaries, and will mature on November 25, 2018. Taiga’s ability to borrow under the Facility is based upon a defined percentage of accounts receivable and inventories. The terms, conditions, and covenants of the Facility have been met as at March 31, 2014.
Taiga expects to meet its future cash requirements through a combination of cash generated from operations and its credit facilities. However, any severe weakening of the Canadian housing market driving reduced product demand or a significant increase in bad debts in accounts receivable could adversely impact the Company’s liquidity in the short term.
Working Capital Working capital as at March 31, 2014 increased to $65.5 million from $48.2 million as at March 31, 2013 due to decreased current liabilities and amounts owing under the Facility partially offset by decreased current assets. Taiga believes that current levels are adequate to meet its working capital requirements.
Summary of Financial Position
(in thousands of dollars) March 31, 2014 March 31, 2013
Current Assets 269,006 295,120Current Liabilities (excluding Revolving Credit Facility) (75,231) (96,648)Revolving Credit Facility (128,241) (150,223)Working Capital 65,534 48,249 Long Term Assets 46,834 51,326Long Term Liabilities (excluding Subordinated Notes) (36,806) (31,182)Subordinated Notes (128,834) (128,834)Shareholders’ Deficiency (53,272) (60,441)
AssetsTotal assets were $315.8 million as at March 31, 2014 compared to $346.4 million as at March 31, 2013. The decrease was primarily the result of decreased accounts receivable, inventories, and property plant and equipment.
Accounts receivable decreased to $118.9 million as at March 31, 2014 from $136.1 million as at March 31, 2013 primarily due to decreased sales in the fourth quarter.
Inventories decreased to $148.8 million as at March 31, 2014 compared to $157.7 million as at March 31, 2013 primarily due to reduced stocks in response to weaker demand caused by the severe winter conditions.
Property, plant and equipment decreased to $44.0 million as at March 31, 2014 compared to $48.7 million as at March 31, 2013 due to amortization and the sale and leaseback transaction.
Liabilities Total liabilities decreased to $369.1 million as at March 2014 from $406.9 million as at March 31, 2013. The decrease was primarily the result of decreased balance owing on the Facility and accounts payable and accrued liabilities, partially offset by increased finance lease obligation from the sale and leaseback transaction.
Contractual Obligations Operating Finance lease (in thousands of dollars) Debt lease obligation
No later than one year 216 2,243 4,566Later than one year, but not later than five years 1,480 8,594 14,951Later than five years - 13,126 29,016
12 TAIGA BUILDING PRODUCTS LTD., ANNUAL REPORT ENDING MARCH 31, 2014
MANAGEMENT’S DISCUSSION AND ANALySIS
Outstanding Share DataThe Company has only one class of shares outstanding, its common shares without par value. On June 27, 2014, there were 32,414,278 common shares outstanding.
Dividend Policy In accordance with Taiga’s dividend policy set on October 15, 2008 the Company generally intends to pay dividends each year on its common shares equal to 25% of the prior fiscal year’s net earnings. These dividends will be in two instal-ments of 12.5% on each July 15 (or first business day thereafter) and each January 15 (or first business day thereafter) and are to be paid to the shareholders of record on June 30 and December 31 (or first business day thereafter). The payment of any dividends by the Company is subject to the discretion of its board of directors and subject to its determi-nation of the Company’s capital and operational requirements, adequacy of reserves and compliance with contractual and legal requirements.
The board of directors have decided not to declare and pay the first instalment of dividend in respect of the 2014 fiscal year’s net earnings. The decision to pay the second instalment dividend in respect of the 2014 fiscal year’s net earnings will be addressed by the board of directors prior to the next scheduled dividend payment date of January 15, 2015.
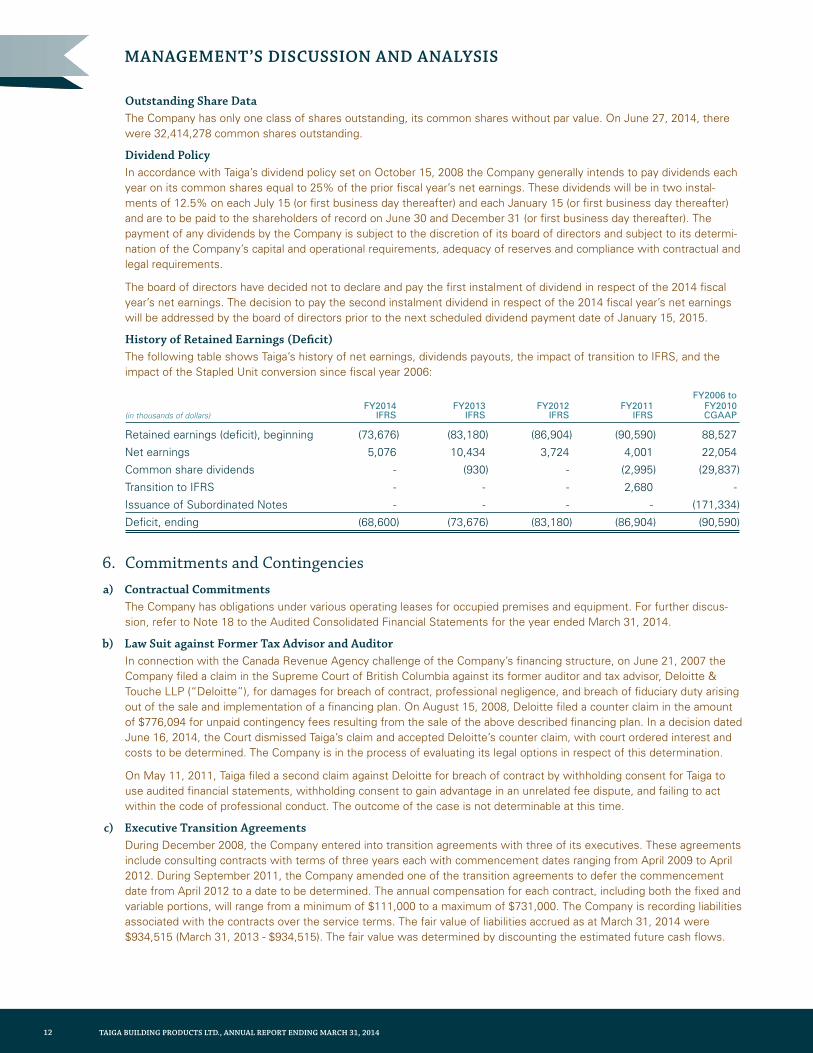
History of Retained Earnings (Deficit)The following table shows Taiga’s history of net earnings, dividends payouts, the impact of transition to IFRS, and the impact of the Stapled Unit conversion since fiscal year 2006:
FY2006 to FY2014 FY2013 FY2012 FY2011 FY2010 (in thousands of dollars) IFRS IFRS IFRS IFRS CGAAP
Retained earnings (deficit), beginning (73,676) (83,180) (86,904) (90,590) 88,527
Net earnings 5,076 10,434 3,724 4,001 22,054
Common share dividends - (930) - (2,995) (29,837)
Transition to IFRS - - - 2,680 -
Issuance of Subordinated Notes - - - - (171,334)
Deficit, ending (68,600) (73,676) (83,180) (86,904) (90,590)
6. Commitments and Contingenciesa) Contractual Commitments
The Company has obligations under various operating leases for occupied premises and equipment. For further discus-sion, refer to Note 18 to the Audited Consolidated Financial Statements for the year ended March 31, 2014.
b) Law Suit against Former Tax Advisor and AuditorIn connection with the Canada Revenue Agency challenge of the Company’s financing structure, on June 21, 2007 the Company filed a claim in the Supreme Court of British Columbia against its former auditor and tax advisor, Deloitte & Touche LLP (“Deloitte”), for damages for breach of contract, professional negligence, and breach of fiduciary duty arising out of the sale and implementation of a financing plan. On August 15, 2008, Deloitte filed a counter claim in the amount of $776,094 for unpaid contingency fees resulting from the sale of the above described financing plan. In a decision dated June 16, 2014, the Court dismissed Taiga’s claim and accepted Deloitte’s counter claim, with court ordered interest and costs to be determined. The Company is in the process of evaluating its legal options in respect of this determination.
On May 11, 2011, Taiga filed a second claim against Deloitte for breach of contract by withholding consent for Taiga to use audited financial statements, withholding consent to gain advantage in an unrelated fee dispute, and failing to act within the code of professional conduct. The outcome of the case is not determinable at this time.
c) Executive Transition AgreementsDuring December 2008, the Company entered into transition agreements with three of its executives. These agreements include consulting contracts with terms of three years each with commencement dates ranging from April 2009 to April 2012. During September 2011, the Company amended one of the transition agreements to defer the commencement date from April 2012 to a date to be determined. The annual compensation for each contract, including both the fixed and variable portions, will range from a minimum of $111,000 to a maximum of $731,000. The Company is recording liabilities associated with the contracts over the service terms. The fair value of liabilities accrued as at March 31, 2014 were $934,515 (March 31, 2013 - $934,515). The fair value was determined by discounting the estimated future cash flows.
13TAIGA BUILDING PRODUCTS LTD., ANNUAL REPORT ENDING MARCH 31, 2014
7. Risks and Uncertainties
The results of operations, business prospects and financial conditions of Taiga are subject to a number of risks and uncertainties, and are affected by a number of factors outside Taiga’s control. Any of these risks and uncertainties could have a material adverse effect on the Company’s operations, financial conditions and cash flow and, accordingly, should be carefully considered in evaluating Taiga’s business. A comprehensive discussion of risk factors is included in Taiga’s Annual Information Form dated June 27, 2014, available on SEDAR at www.sedar.com.
8. Critical Accounting Policies and Estimates
The significant accounting policies of Taiga are described in Note 3 to the Consolidated Financial Statements for the year ended March 31, 2014.
In preparing these consolidated financial statements, Taiga’s management was required to make estimates and assump-tions that affect the amounts recorded. Financial results as determined by actual events could differ from such estimates. The estimates and assumptions of the Company’s management are based on historical experience and other factors management considers to be reasonable, including expectations of future events. The estimates and assumptions that could result in a material impact to the carrying amounts of assets and liabilities are outlined below.
Allowance for doubtful accountsWhile significant bad debts have not been experienced in prior years the provision is based on the Company’s knowledge of the financial condition of its customers, the aging of the receivables, the current business environment and historical experience. A change in one or more of these factors could impact the estimated allowance and provision for bad debts. Taiga’s allowance for doubtful accounts as at March 31, 2014 was $0.3 million (2013 – $0.1 million).
Valuation of InventoriesInventories are valued at the lower of average cost and net realizable value. Taiga evaluates inventory balances at each balance sheet date and records a provision as necessary for slow moving or obsolete inventory. Additionally, Taiga records a provision if the cost of inventories exceeds net realizable value based on commodity prices. Inventory provision as at March 31, 2014 was $0.3 million (2013 – $0.8 million).
Valuation and estimated life of long-lived assetsAn impairment test is performed by comparing the carrying amount of the asset or its cash generating unit to the recoverable amount, which is calculated as the higher of an asset’s or cash-generating unit’s fair value less costs to sell and its value in use. Value in use is calculated based upon a discounted cash flow analysis, which requires management to make a number of significant assumptions including assumptions relating to future operating plans, discount rates and future growth rates.
The estimated useful lives and recoverable amounts of long-lived assets are based on the judgement of management and the best currently available information. Changes in circumstances can result in the actual useful lives differing from management’s estimates.
Customer rebatesCustomer rebates are commonly offered as industry practice and are generally based on achievement of specified volume sales levels. Taiga accrues for the payment of customer rebates as a reduction of revenue based on manage-ment’s estimates.
Valuation of warranty provisionsA provision for future potential warranty costs is calculated using historical trends and future expectations of future claims. Adjustments to the warranty provision are included in cost of sales. Actual future warranty costs may differ from those estimates.
Executive transition agreementThe provision is based on management’s estimates of factors such as discount rates, expected date of each transition and variable compensation tied to the Company’s future performance.
Current and deferred taxesThe Company calculates current and deferred tax provisions for each of the jurisdictions in which it operates. Actual amounts of income tax expense are not final until tax returns are filed and accepted by the relevant authorities. This occurs subsequent to the issuance of financial statements. Therefore, results in subsequent periods will be affected by the amount that estimates differ from the final tax return.
14 TAIGA BUILDING PRODUCTS LTD., ANNUAL REPORT ENDING MARCH 31, 2014
MANAGEMENT’S DISCUSSION AND ANALySIS
Judgment is required in assessing whether deferred tax assets and certain deferred tax liabilities are recognized on the balance sheet. Taiga also evaluates the recoverability of deferred tax assets based on an assessment of the likelihood of using the underlying future tax deductions against future taxable income before they expire. Deferred tax liabilities arising from temporary differences on investments in subsidiaries, joint ventures and associates are recognized unless the rever-sal of the temporary differences is not expected to occur in the foreseeable future and can be controlled. Assumptions about the generation of future taxable profits and repatriation of retained earnings depend on management’s estimates of future sales volumes and housing starts, commodity prices, operating costs, capital expenditures, dividends and other capital transactions. Judgment is also required about the application of income tax legislation. These estimates and judgments are subject to risk and uncertainty and could result in an adjustment to the deferred tax provision and a corresponding credit or charge to income.
9. Changes in Accounting Standards Financial instruments
IFRS 9, Financial Instruments (“IFRS 9”) was issued by the International Accounting Standards Board (“IASB”) on November 12, 2009 and will replace IAS 39, Financial Instruments: Recognition and Measurement (“IAS 39”). IFRS 9 uses a single approach to determine whether a financial asset is measured at amortized cost or fair value, replacing the multiple rules in IAS 39. The approach in IFRS 9 is based on how an entity manages its financial instruments in the context of its business model and the contractual cash flow characteristics of the financial assets. The new standard also requires a single impairment method to be used, replacing the multiple impairment methods in IAS 39. Effective date has been tentatively set at January 1, 2018. The Company is evaluating the impact of the adoption of this standard on its consolidated financial statements.
IAS 32, Financial Instruments: Presentation was amended to address inconsistencies when applying the offsetting requirements, and is effective for annual periods beginning on or after January 1, 2014. The Company does not expect the adoption of this amendment to have a significant impact on its consolidated financial statements.
10. Related Party Transactions
In accordance with IFRS requirements, related party transactions consist of remuneration of directors and other key management personnel with whom Taiga has entered into employment agreements. Further information is contained in our Management Information Circular dated July 3, 2013, which is available on SEDAR at www.sedar.com. The remuneration for key management, which includes the Company’s directors and officers, were as follows:
Year ended Year ended(in thousands of dollars) March 31, 2014 March 31, 2013
Salaries and other benefits 3,419 1,953
11. Off-Balance Sheet Arrangements
Taiga does not have off-balance sheet arrangements except for commitments under operating leases as discussed under “Commitments and Contingencies” in this Management’s Discussion and Analysis.
For a detailed description of financial instruments and their associated risks, see Note 20 to the Company’s audited consolidated financial statements for the fiscal year ended March 31, 2014.
12. Disclosure Controls and Procedures and Internal Controls over Financial Reporting
Taiga’s management is responsible for establishing and maintaining adequate disclosure controls and procedures and internal controls over financial reporting to provide reasonable assurance regarding the reliability of financial reporting and the preparation of financial statements for external reporting purposes in accordance with IFRS.
In accordance with the requirements of National Instrument 52-109 Certification of Disclosure in Issuers’ Annual and Interim Filings, Taiga’s management, including the Chief Executive Officer and Chief Financial Officer, evaluated the Company’s disclosure controls and procedures and internal controls over financial reporting. Based on the evaluation, Taiga’s CEO and CFO concluded that these controls were effective for the fiscal year ended March 31, 2014.
The CEO and CFO of Taiga acknowledge responsibility for the design of internal controls over financial reporting and confirm that there were no changes in these controls that occurred during the fiscal year ended March 31, 2014 which materially affected, or are reasonably likely to materially affect, the Company’s ICFR.
15TAIGA BUILDING PRODUCTS LTD., ANNUAL REPORT ENDING MARCH 31, 2014
13. Outlook
Taiga’s Taiga’s financial performance is primarily dependent on the residential construction, renovation and repairs markets. These markets are affected by the strength or weakness in the general economy and as such are influenced by interest rates and other general market indicators.
In Canada, according to the Canada Mortgage and Housing Corporation (“CMHC”) Housing Market Outlook, Canadian Edition for the second quarter 2014, housing starts are forecasted to total 181,100 in the 2014 calendar year. CMHC is reporting that housing starts will increase to 182,100 in the 2015 calendar year.
In the United States, the National Association of Home Builders reported in June 2014 that housing starts are forecasted to total 1,041,000 units in the 2014 calendar year compared to 930,000 units in calendar year 2013.

INdEPENdENT AUdIToR’S REPoRT
16 TAIGA BUILDING PRODUCTS LTD., ANNUAL REPORT ENDING MARCH 31, 2014
17TAIGA BUILDING PRODUCTS LTD., ANNUAL REPORT ENDING MARCH 31, 2014
To the Shareholders of Taiga Building Products Ltd.
We have audited the accompanying consolidated financial statements of Taiga Building Products Ltd., which comprise the consolidated balance sheets as at March 31, 2014 and 2013, and the consolidated statements of earnings and comprehensive income, changes in shareholders’ deficiency and cash flows for the years then ended, and a summary of significant accounting policies and other explanatory information.
Management’s Responsibility for the Consolidated Financial StatementsManagement is responsible for the preparation and fair presentation of these consolidated financial statements in accordance with International Financial Reporting Standards, and for such internal control as management determines is necessary to enable the preparation of consolidated financial statements that are free from material misstatement, whether due to fraud or error.
Auditor’s ResponsibilityOur responsibility is to express an opinion on these consolidated financial statements based on our audits. We conducted our audits in accordance with Canadian generally accepted auditing standards. Those standards require that we comply with ethical requirements and plan and perform the audit to obtain reasonable assurance about whether the consolidated financial statements are free from material misstatement.
An audit involves performing procedures to obtain audit evidence about the amounts and disclosures in the consolidated financial statements. The procedures selected depend on the auditor’s judgment, including the assessment of the risks of material misstatement of the consolidated financial statements, whether due to fraud or error. In making those risk assessments, the auditor considers internal control relevant to the entity’s preparation and fair presentation of the consolidated financial statements in order to design audit procedures that are appropriate in the circumstances, but not for the purpose of expressing an opinion on the effectiveness of the entity’s internal control. An audit also includes evaluating the appropriateness of accounting policies used and the reasonableness of accounting estimates made by management, as well as evaluating the overall presentation of the consolidated financial statements.
We believe that the audit evidence that we have obtained in our audits is sufficient and appropriate to provide a basis for our audit opinion.
OpinionIn our opinion, the consolidated financial statements present fairly, in all material respects, the financial position of Taiga Building Products Ltd. as at March 31, 2014 and 2013, and its financial performance and its cash flows for the years then ended in accordance with International Financial Reporting Standards.
DALE MATHESON CARR-HILTON LABONTE LLP CHARTERED ACCOUNTANTS Vancouver, Canada June 27, 2014
18 TAIGA BUILDING PRODUCTS LTD., ANNUAL REPORT ENDING MARCH 31, 2014
Taiga Building Products Ltd. Consolidated Balance Sheets
March 31, March 31, (in thousands of Canadian dollars) 2014 2013
Assets Current:
Accounts receivable (Note 5) $ 118,934 $ 136,102
Inventories (Note 6) 148,843 157,716
Prepaid expenses 1,229 1,302
269,006 295,120
Property, plant and equipment (Note 7) 44,045 48,664
Long-term receivable (Note 5) 814 918
Deferred tax assets (Note 10) 1,975 1,744
$ 315,840 $ 346,446
Liabilities and Shareholders’ Deficiency
Current: Revolving credit facility (Note 8) $ 128,241 $ 150,223
Accounts payable and accrued liabilities (Note 9) 66,652 89,201
Income taxes payable 5,866 5,082
Current portion of long-term debt (Note 11) 216 198
Current portion of finance lease obligation (Note 12) 2,497 2,167
203,472 246,871
Long-term debt (Note 11) 1,480 1,535
Finance lease obligation (Note 12) 28,721 21,506
Deferred gain 4,537 4,279
Deferred tax liabilities (Note 10) - 1,726
Provisions (Note 13) 2,068 2,136
Subordinated notes (Note 14) 128,834 128,834
369,112 406,887
Shareholders’ Deficiency: Share capital (Note 15) 13,229 13,229
Accumulated other comprehensive income (Note 15) 2,099 6
15,328 13,235
Deficit (68,600) (73,676)
(53,272) (60,441)
$ 315,840 $ 346,446 Commitments and contingencies (Note 12 and 18) Subsequent event (Note 18) The accompanying notes are an integral part of these consolidated financial statements.
CONSOLIDATED BALANCE SHEETS
Approved by the Directors
Kooi Ong Tong Chairman
Peter Buecking Director
19TAIGA BUILDING PRODUCTS LTD., ANNUAL REPORT ENDING MARCH 31, 2014
Fina
ncia
l Sta
tem
ents
Taiga Building Products Ltd. Consolidated Statements of Earnings and Comprehensive Income
For the years ended March 31,(in thousands of Canadian dollars, except per share amounts) 2014 2013
Sales $ 1,194,259 $ 1,132,743 Cost of sales (Note 16) 1,097,449 1,029,928
Gross margin 96,810 102,815
Expenses:
Distribution (Note 16) 18,773 18,393
Selling and administration (Note 16) 48,594 45,962
Finance (Note 17) 7,003 7,302
Subordinated debt interest (Note 14) 16,356 16,356
Other income (Note 25) (3,081) (429)
87,645 87,584
Earnings before income tax 9,165 15,231
Income tax expense (Note 10) 4,089 4,797
Net earnings for the year $ 5,076 $ 10,434
Other comprehensive income for the year
(Item that may be reclassified to net earnings)
Exchange differences on translating foreign controlled entities $ 2,093 $ 398
Total comprehensive income for the year $ 7,196 $ 10,832
Basic and diluted net earnings per common share $ 0.16 $ 0.32
Weighted average number of common shares outstanding 32,414 32,414 The accompanying notes are an integral part of these consolidated financial statements.
CONSOLIDATED STATEMENTS OF EARNINGS AND COMPREHENSIVE INCOME
20 TAIGA BUILDING PRODUCTS LTD., ANNUAL REPORT ENDING MARCH 31, 2014
Taiga Building Products Ltd. Consolidated Statements of Changes in Shareholders’ Deficiency For the year ended March 31, 2013 Accumulated Other Comprehensive (in thousands of Canadian dollars) Share Capital Deficit Income (Loss) Total
Balance at March 31, 2012 $ 13,229 $ (83,180) $ (392) $ (70,343)
Net earnings - 10,434 - 10,434
Dividends, 3 cents per share - (930) - (930)
Other comprehensive income - - 398 398
Balance at March 31, 2013 $ 13,229 $ (73,676) $ 6 $ (60,441)
For the year ended March 31, 2014 Accumulated Other Comprehensive (in thousands of Canadian dollars) Share Capital Deficit Income Total
Balance at March 31, 2013 $ 13,229 $ (73,676) $ 6 $ (60,441)
Net earnings - 5,076 - 5,076
Other comprehensive income - - 2,093 2,093
Balance at March 31, 2014 $ 13,229 $ (68,600) $ 2,099 $ (53,272) The accompanying notes are an integral part of these consolidated financial statements.
CONSOLIDATED STATEMENTS OF CHANGES IN SHAREHOLDERS’ DEFICIENCy
21TAIGA BUILDING PRODUCTS LTD., ANNUAL REPORT ENDING MARCH 31, 2014
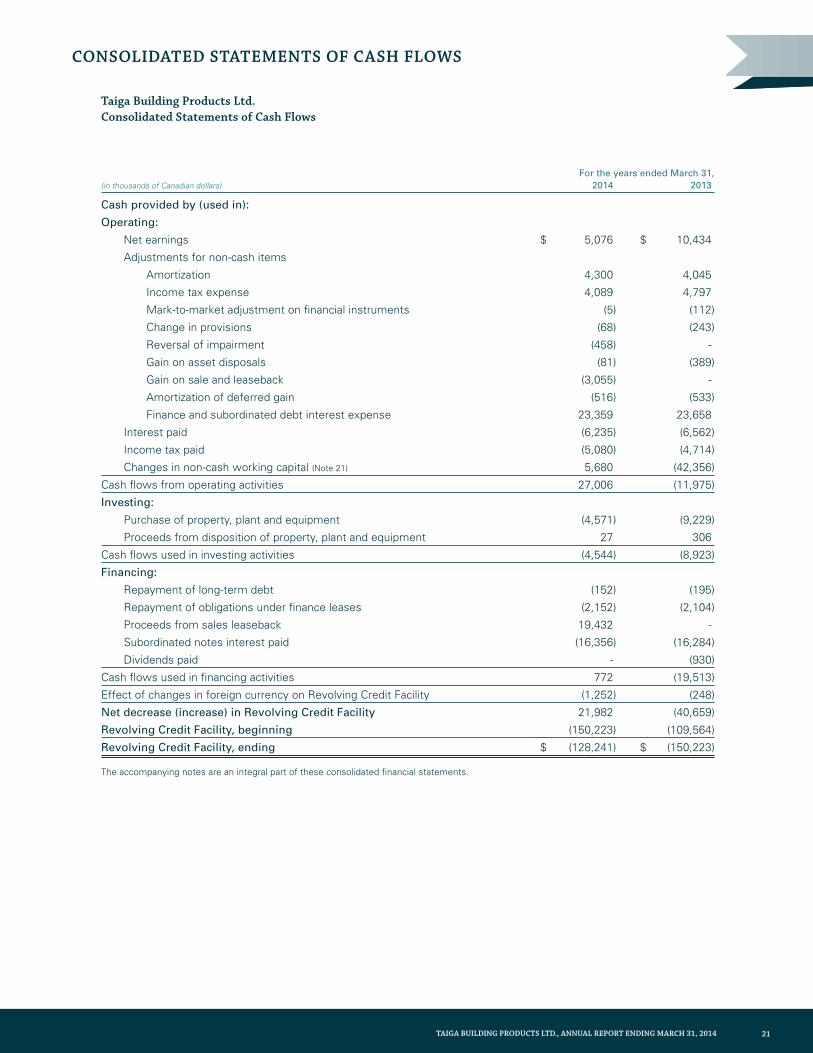
Taiga Building Products Ltd. Consolidated Statements of Cash Flows
For the years ended March 31,(in thousands of Canadian dollars) 2014 2013
Cash provided by (used in):
Operating:
Net earnings $ 5,076 $ 10,434
Adjustments for non-cash items
Amortization 4,300 4,045
Income tax expense 4,089 4,797
Mark-to-market adjustment on financial instruments (5) (112)
Change in provisions (68) (243)
Reversal of impairment (458) -
Gain on asset disposals (81) (389)
Gain on sale and leaseback (3,055) -
Amortization of deferred gain (516) (533)
Finance and subordinated debt interest expense 23,359 23,658
Interest paid (6,235) (6,562)
Income tax paid (5,080) (4,714)
Changes in non-cash working capital (Note 21) 5,680 (42,356)
Cash flows from operating activities 27,006 (11,975)
Investing:
Purchase of property, plant and equipment (4,571) (9,229)
Proceeds from disposition of property, plant and equipment 27 306
Cash flows used in investing activities (4,544) (8,923)
Financing:
Repayment of long-term debt (152) (195)
Repayment of obligations under finance leases (2,152) (2,104)
Proceeds from sales leaseback 19,432 -
Subordinated notes interest paid (16,356) (16,284)
Dividends paid - (930)
Cash flows used in financing activities 772 (19,513)
Effect of changes in foreign currency on Revolving Credit Facility (1,252) (248)
Net decrease (increase) in Revolving Credit Facility 21,982 (40,659)
Revolving Credit Facility, beginning (150,223) (109,564)
Revolving Credit Facility, ending $ (128,241) $ (150,223) The accompanying notes are an integral part of these consolidated financial statements.
CONSOLIDATED STATEMENTS OF CASH FLOWS CONSOLIDATED STATEMENTS OF CHANGES IN SHAREHOLDERS’ DEFICIENCy
22 TAIGA BUILDING PRODUCTS LTD., ANNUAL REPORT ENDING MARCH 31, 2014
NOTES TO THE CONSOLIDATED FINANCIAL STATEMENTS FOR THE yEaRs EndEd MaRcH 31, 2014 and 2013 (in canadian dOllaRs)
1. Nature of Operations
Taiga Building Products Ltd. (“Taiga” or the “Company”) is an independent wholesale distributor of building products in Canada and the United States. Taiga operates within two reportable geographic areas, Canada and the United States. The Company’s shares and subordinated notes (the “Notes”) are listed for trading on the Toronto Stock Exchange.
Taiga is a Canadian corporation and its registered and records office is located at 800 – 4710 Kingsway, Burnaby, British Columbia, V5H 4M2.
2. Basis of Preparationa) Statement of compliance
These consolidated financial statements are prepared in accordance with International Financial Reporting Standards (“IFRS”) as issued by the International Accounting Standards Board.
These consolidated financial statements were authorized for issue on June 27, 2014 by the board of directors of the Company.
b) Basis of ConsolidationThese consolidated financial statements include the accounts of Taiga Building Products Ltd. and its subsidiaries. Subsidiaries are those entities which the Company controls by having the power to govern the financial and operational policies of the entity. Inter-company transactions and balances have been eliminated.
c) Basis of MeasurementThese consolidated financial statements have been prepared on an accrual basis and are based on historical costs, modified where applicable.
d) Revolving Credit FacilityRevolving credit facility consists of cash on hand less cheques issued and the Company’s outstanding revolving credit facility balance. Taiga’s cash flow statement reflects the net change in its revolving credit facility. The revolving credit facility forms an integral part of Taiga’s cash management and fluctuates directly as a result of cash flows from operating, investing and financing activities.
3. Significant Accounting Policies a) Inventories
Inventories consist of allied building products, lumber products, panel products and production consumables. Inventories include other costs, such as transportation and processing, that are directly incurred to bring the inventories to their present location and condition. The cost of treated wood includes the cost of lumber, direct labour and an allocation of fixed and variable overhead expenses. Inventories are stated at the lower of average cost and net realizable value, except for produc-tion consumables which are recorded at the lower of cost and replacement cost which approximates net realizable value.
b) Property, Plant and EquipmentThe following assets are recorded at cost and amortization is provided using the following methods and annual rates:
Declining Balance Method Buildings 4% - 10% Furniture and office equipment 8% - 30% Warehouse and manufacturing equipment 10% - 30%
Straight-line Method Leasehold improvements Over term of leaseTreating equipment 20 - 25 Years Computer system and license 3 - 10 Years
The carrying values of the buildings and equipment are reviewed for indications of impairment on a regular basis by reference to their estimated recoverable amount. Assets that are not yet available for use are not being amortized.
c) Deferred GainDeferred gains on sale and leaseback transactions are amortized over the terms of the lease contracts (see Note 25).
23TAIGA BUILDING PRODUCTS LTD., ANNUAL REPORT ENDING MARCH 31, 2014
Notes to the CoNsolidated FiNaNCial statemeNts FOR THE yEaRs EndEd MaRcH 31, 2014 and 2013 (in canadian dOllaRs)
d) LeasesLeases of property, plant and equipment where substantially all the risks and benefits incidental to the ownership of the asset are transferred to the Company are classified as finance leases. Finance leases are capitalized by recording an asset and a liability at the lower of the fair value of the leased property, plant and equipment or the present value of the minimum lease payments, including any guaranteed residual values. Lease payments are allocated between the reduc-tion of the lease liability and the lease interest expense for the period. Leased assets are depreciated on a straight-line basis over the shorter of their estimated useful lives or the lease term. Lease payments for operating leases, where substantially all the risks and benefits remain with the lessor, are charged as expenses in the periods in which they are incurred. Lease incentives under operating leases are recognized as a liability and amortized on a straight-line basis over the life of the lease term.
e) Income TaxesCurrent income tax:Current income tax assets and liabilities for the current period are measured at the amount expected to be recovered from or paid to the relevant taxation authorities. The tax rates and tax laws used to compute the amount are those that are enacted or substantively enacted, at the reporting date in the jurisdictions where the Company operates and gener-ates taxable income. Current income taxes relating to items recognized directly in other comprehensive income or equity are recognized in other comprehensive income or equity and not in profit or loss. Management periodically evaluates positions taken in the tax returns with respect to situations in which applicable tax regulations are subject to interpreta-tion and establishes provisions where appropriate. The Company evaluates each uncertain tax position separately using a “two-step” approach, whereby a provision is only recognized when it is probable that an obligation exists that will result in an economic outflow. The obligation is then estimated by weighting the range of possible outcomes by their associ-ated probabilities.
Deferred income tax:Deferred income tax is provided using the balance sheet method on temporary differences at the reporting date between the tax bases of assets and liabilities and their carrying amounts for financial reporting purposes. The carrying amount of deferred income tax assets is reviewed at the end of each reporting period and recognized only to the extent that it is probable that sufficient taxable profit will be available to allow all or part of the deferred income tax asset to be utilized. Deferred income tax assets and liabilities are measured at the tax rates that are expected to apply to the year when the asset is realized or the liability is settled, based on tax rates (and tax laws) that have been enacted or substantively enacted by the end of the reporting period. Deferred income tax assets and deferred income tax liabilities are offset only if a legally enforceable right exists to set off current tax assets against current income tax liabilities and the deferred income taxes relate to the same taxable entity and the same taxation authority.
f) Foreign Currency TranslationThe functional currency of each of the Company’s entities is measured using the currency of the primary economic environment in which that entity operates. The consolidated financial statements are presented in Canadian dollars which is the parent company’s functional currency. The functional currency of controlled entities that have operations in the United States is the United States dollar.
Transactions and balances:Foreign currency transactions are translated into functional currency using the exchange rates prevailing at the date of the transaction. Foreign currency monetary items are translated at the period-end exchange rate. Non-monetary items measured at historical cost continue to be carried at the exchange rate at the date of the transaction. Non-monetary items measured at fair value are reported at the exchange rate at the date when fair values were determined.
Exchange differences arising on the translation of monetary items or on settlement of monetary items are recognized in profit or loss in the statement of earnings and comprehensive income in the period in which they arise, except where deferred in equity as a qualifying cash flow or net investment hedge.
Exchange differences arising on the translation of non-monetary items are recognized in other comprehensive income in the statement of earnings and comprehensive income to the extent that gains and losses arising on those non-monetary items are also recognized in other comprehensive income. Where the non-monetary gain or loss is recognized in profit or loss, the exchange component is also recognized in profit or loss.
The financial position and results of foreign operations whose functional currency is different from the Company’s presentation currency are translated as follows:
- assets and liabilities are translated at period-end exchange rates prevailing at the reporting date; and - income and expenses are translated at average exchange rates for the period.
24 TAIGA BUILDING PRODUCTS LTD., ANNUAL REPORT ENDING MARCH 31, 2014
NOTES TO THE CONSOLIDATED FINANCIAL STATEMENTS FOR THE yEaRs EndEd MaRcH 31, 2014 and 2013 (in canadian dOllaRs)
Exchange differences arising on translation of foreign operations are recorded in accumulated other comprehensive income (loss) in the statement of earnings and comprehensive income. These differences are recognized in profit or loss in the period in which the operation is disposed.
g) Revenue RecognitionRevenue is recognized, net of discounts and customer rebates, upon the transfer of significant risks and rewards of ownership, provided collectability is reasonably assured.
h) Earnings Per ShareEarnings per share is calculated using the weighted-average number of shares outstanding for the period. The weighted-average number of common shares is determined by relating the portion of time during the reporting period that the shares have been outstanding to the total time in the period.
Diluted earnings per share is calculated based on the weighted-average number of common shares outstanding during the period including, if applicable, the effects of potentially dilutive common share equivalents. Taiga’s basic and diluted earnings per share are equal as Taiga has no potentially dilutive instruments.
i) Accounting by a Customer for Certain Consideration Received from a VendorConsideration received from a vendor, that represents a reduction in the purchase price, is recorded as a reduction in cost of sales.
j) Financial InstrumentsThe Company classifies its financial instruments in the following categories: at fair value through profit or loss, loans and receivables, held-to-maturity investments, available-for-sale financial assets and financial liabilities. The classification depends on the purpose for which the financial instruments were acquired. Management determines the classification of its financial instruments at initial recognition.
Financial assets are classified at fair value through profit or loss when they are either held for trading for the purpose of short-term profit taking, derivatives not held for hedging purposes, or when they are designated as such to avoid an accounting mismatch or to enable performance evaluation where a group of financial assets is managed by key manage-ment personnel on a fair value basis in accordance with a documented risk management or investment strategy. Such assets are subsequently measured at fair value with changes in carrying value being included in profit or loss.
Loans and receivables are non-derivative financial assets with fixed or determinable payments that are not quoted in an active market and are subsequently measured at amortized cost. They are included in current assets, except for maturi-ties greater than 12 months after the end of the reporting period. These are classified as non-current assets.
Held-to-maturity investments are non-derivative financial assets that have fixed maturities and fixed or determinable payments, and it is the Company’s intention to hold these investments to maturity. They are subsequently measured at amortized cost. Held-to-maturity investments are included in non-current assets, except for where these are expected to mature within 12 months after the end of the reporting period.
Available-for-sale financial assets are non-derivative financial assets that are designated as available-for-sale or are not suitable to be classified as financial assets at fair value through profit or loss, loans and receivables or held-to-maturity investments and are subsequently measured at fair value. These are included in current assets. Unrealized gains and losses are recognized in other comprehensive income, except for impairment losses and foreign exchange gains and losses. Non-derivative financial liabilities (excluding financial guarantees) are subsequently measured at amortized cost.
Non-derivative financial liabilities (excluding financial guarantees) are subsequently measured at amortized cost.
Regular purchases and sales of financial assets are recognized on the date the Company becomes a party to the contractual provisions of the instrument. Financial assets are derecognized when the rights to receive cash flows from the investments have expired or have been transferred and the Company has transferred substantially all risks and rewards of ownership.
At each reporting date, the Company assesses whether there is objective evidence that a financial instrument has been impaired. In the case of available-for-sale financial instruments, a significant and prolonged decline in the value of the instrument is considered to be an indication of impairment.
k) Impairment of AssetsThe carrying amounts of the Company’s assets are reviewed at each reporting date to determine whether there is any indication of impairment. If such indication exists, the recoverable amount of the asset, or its cash generating unit, is estimated in order to determine the extent of impairment. An impairment loss is recognized whenever the carrying amount of an asset or its cash generating unit exceeds its recoverable amount. Impairment losses are recognized in the statement of earnings and comprehensive income.
25TAIGA BUILDING PRODUCTS LTD., ANNUAL REPORT ENDING MARCH 31, 2014
Notes to the CoNsolidated FiNaNCial statemeNts FOR THE yEaRs EndEd MaRcH 31, 2014 and 2013 (in canadian dOllaRs)
The recoverable amount of assets is the greater of an asset’s fair value less cost to sell and value in use. In assessing value in use, the estimated future cash flows are discounted to their present value using a pre-tax discount rate that reflects current market assessments of the time value of money and risks specific to the asset. For an asset that does not generate cash inflows largely independent of those from other assets, the recoverable amount is determined for the cash-generating unit to which the asset belongs.
An impairment loss is only reversed if there is an indication that the impairment may no longer exist and there has been a change in the estimates used to determine the recoverable amount. Reversal cannot increase the carrying value of an asset to an amount higher than the carrying amount that would have been determined had no impairment loss been recognized in previous years.
Assets that have an indefinite useful life are not subject to amortization and are tested annually for impairment.
l) ProvisionsProvisions are recognized when a present legal or constructive obligation exists, as a result of past events, and it is probable that an outflow of resources, that can be reliably estimated, will be required to settle the obligation. Where the effect is material, the provision is discounted using an appropriate current market-based pre-tax discount rate.
m) Accounting Standards issued not appliedFinancial instruments IFRS 9, Financial Instruments (“IFRS 9”) was issued by the International Accounting Standards Board (“IASB”) on November 12, 2009 and will replace IAS 39, Financial Instruments: Recognition and Measurement (“IAS 39”). IFRS 9 uses a single approach to determine whether a financial asset is measured at amortized cost or fair value, replacing the multiple rules in IAS 39. The approach in IFRS 9 is based on how an entity manages its financial instruments in the context of its business model and the contractual cash flow characteristics of the financial assets. The new standard also requires a single impairment method to be used, replacing the multiple impairment methods in IAS 39. Effective date has been tentatively set at January 1, 2018. The Company is evaluating the impact of the adoption of this standard on its consolidated financial statements.
IAS 32, Financial Instruments: Presentation was amended to address inconsistencies when applying the offsetting requirements, and is effective for annual periods beginning on or after January 1, 2014. The Company does not expect the adoption of this amendment to have a significant impact on its consolidated financial statements.
4. Critical Accounting Estimates, Assumptions and Judgementsa) Significant Estimates and Assumptions
In preparing these consolidated financial statements, the Company makes estimates and assumptions concerning the future that affect the amounts recorded. Actual results could differ from these estimates. Estimates and assumptions are based on historical experience, expectations of future events and other factors considered by management to be reasonable. The estimates and assumptions that could result in a material impact to the carrying amounts of assets and liabilities are outlined below.
Allowance for doubtful accountsWhile significant bad debts have not been experienced in prior years the provision is based on the Company’s knowledge of the financial condition of its customers, the aging of the receivables, the current business environment and historical experience. A change in one or more of these factors could impact the estimated allowance and provision for bad debts.
Valuation of inventoriesInventories are valued at the lower of average cost and net realizable value. Taiga evaluates inventory balances at each balance sheet date and records a provision as necessary for slow moving or obsolete inventory. Additionally, Taiga records provision if the cost of inventories exceeds net realizable value based on commodity prices.
Valuation and estimated life of long-lived assetsAn impairment test is performed by comparing the carrying amount of the asset or its cash generating unit to the recoverable amount, which is calculated as the higher of an asset’s or cash-generating unit’s fair value less costs to sell and its value in use. Value in use is calculated based upon a discounted cash flow analysis, which requires management to make a number of significant assumptions including assumptions relating to future operating plans, discount rates and future growth rates.
The estimated useful lives and recoverable amounts of long-lived assets are based on judgement and the best currently available information. Changes in circumstances can result in the actual useful lives differing from our estimates.
26 TAIGA BUILDING PRODUCTS LTD., ANNUAL REPORT ENDING MARCH 31, 2014
NOTES TO THE CONSOLIDATED FINANCIAL STATEMENTS FOR THE yEaRs EndEd MaRcH 31, 2014 and 2013 (in canadian dOllaRs)
Customer rebatesCustomer rebates are commonly offered as industry practice and are generally based on achievement of specified volume sales levels. Taiga accrues for the payment of customer rebates as a reduction of revenue based on management’s estimates.
Valuation of warranty provisionsA provision for future potential warranty costs is calculated using historical trends and future expectations of future claims. Adjustments to the warranty provision are included in cost of sales. Actual future warranty costs may differ from those estimates.
Executive transition agreementsThe provision is based on management’s estimates of factors such as discount rates, expected date of transitions and variable compensation tied to the Company’s future performance (Note 18d).
Sale and leaseback transactionsThe amount and the timing of recognition of gains and losses realized on sale and leaseback transactions are impacted by the classification of the resulting leases and by the allocation of the proceeds between the land and building components of the properties. In cases where losses are incurred on sale leaseback transactions and subsequently accounted for as finance leases, losses are capitalized to the extent that management has concluded that management determines impairment does not exist.
Current and deferred taxesThe Company calculates current and deferred tax provisions for each of the jurisdictions in which it operates. Actual amounts of income tax expense are not final until tax returns are filed and accepted by the relevant authorities and ultimately until they are statute barred from reassessment. This occurs subsequent to the issuance of financial statements. Therefore, results in subsequent periods will be affected by the amount that estimates differ from the final tax filings, resolution of uncertain tax positions, open years or tax disputes that may arise.
The Company must make estimates and assumptions when assessing whether deferred tax assets and certain deferred tax liabilities are recognized on the balance sheet. Taiga also evaluates the recoverability of deferred tax assets based on an assessment of the likelihood of using the underlying future tax deductions against future taxable income before they expire. Deferred tax liabilities arising from temporary differences on investments in subsidiaries are recognized unless the reversal of the temporary differences is not expected to occur in the foreseeable future and can be controlled. Assumptions about the generation of future taxable profits and repatriation of retained earnings depend on management’s estimates of future sales volumes and housing starts, commodity prices, operating costs, capital expenditures, dividends and other capital transactions. These estimates and judgments are subject to risk and uncertainty and could result in an adjustment to the deferred tax provision and a corresponding credit or charge to income.
b) Significant Judgements in Applying Accounting PoliciesThe preparation of financial statements in accordance with IFRS requires the Company to make judgments, apart from those involving estimates, in applying accounting policies. The most significant judgments in applying the Company’s consolidated financial statements include:
- the assessment of the Company’s ability to continue as a going concern and whether there are events or conditions that may give rise to significant uncertainty;
- the classification of leases as either operating or finance type leases;
- the determination of the functional currency of the parent company and its subsidiaries; and
- the assessment of continually changing tax interpretations, regulations and legislation, to ensure that deferred income tax assets and liabilities are complete and fairly stated.
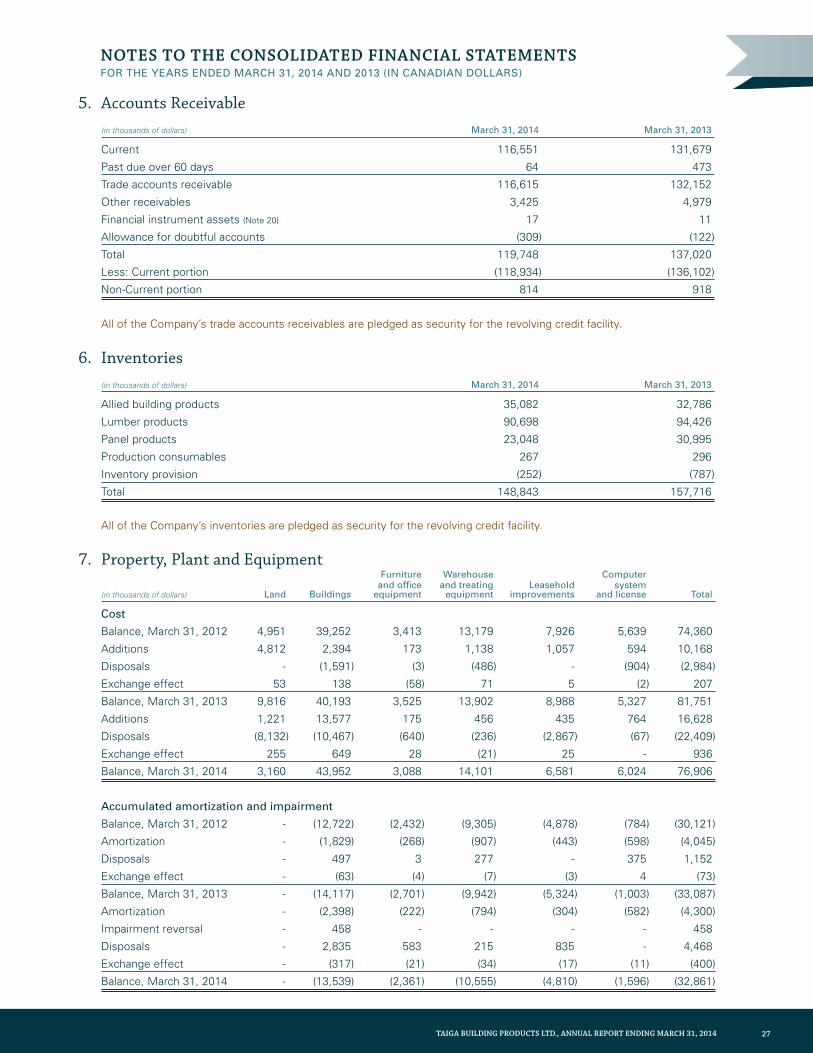
27TAIGA BUILDING PRODUCTS LTD., ANNUAL REPORT ENDING MARCH 31, 2014
Notes to the CoNsolidated FiNaNCial statemeNts FOR THE yEaRs EndEd MaRcH 31, 2014 and 2013 (in canadian dOllaRs)
5. Accounts Receivable
(in thousands of dollars) March 31, 2014 March 31, 2013
Current 116,551 131,679
Past due over 60 days 64 473
Trade accounts receivable 116,615 132,152
Other receivables 3,425 4,979
Financial instrument assets (Note 20) 17 11
Allowance for doubtful accounts (309) (122)
Total 119,748 137,020
Less: Current portion (118,934) (136,102)
Non-Current portion 814 918
All of the Company’s trade accounts receivables are pledged as security for the revolving credit facility.
6. Inventories
(in thousands of dollars) March 31, 2014 March 31, 2013
Allied building products 35,082 32,786
Lumber products 90,698 94,426
Panel products 23,048 30,995
Production consumables 267 296
Inventory provision (252) (787)
Total 148,843 157,716
All of the Company’s inventories are pledged as security for the revolving credit facility.
7. Property, Plant and Equipment Furniture Warehouse Computer and office and treating Leasehold system (in thousands of dollars) Land Buildings equipment equipment improvements and license Total
Cost
Balance, March 31, 2012 4,951 39,252 3,413 13,179 7,926 5,639 74,360
Additions 4,812 2,394 173 1,138 1,057 594 10,168
Disposals - (1,591) (3) (486) - (904) (2,984)
Exchange effect 53 138 (58) 71 5 (2) 207
Balance, March 31, 2013 9,816 40,193 3,525 13,902 8,988 5,327 81,751
Additions 1,221 13,577 175 456 435 764 16,628
Disposals (8,132) (10,467) (640) (236) (2,867) (67) (22,409)
Exchange effect 255 649 28 (21) 25 - 936
Balance, March 31, 2014 3,160 43,952 3,088 14,101 6,581 6,024 76,906
Accumulated amortization and impairment
Balance, March 31, 2012 - (12,722) (2,432) (9,305) (4,878) (784) (30,121)
Amortization - (1,829) (268) (907) (443) (598) (4,045)
Disposals - 497 3 277 - 375 1,152
Exchange effect - (63) (4) (7) (3) 4 (73)
Balance, March 31, 2013 - (14,117) (2,701) (9,942) (5,324) (1,003) (33,087)
Amortization - (2,398) (222) (794) (304) (582) (4,300)
Impairment reversal - 458 - - - - 458
Disposals - 2,835 583 215 835 - 4,468
Exchange effect - (317) (21) (34) (17) (11) (400)
Balance, March 31, 2014 - (13,539) (2,361) (10,555) (4,810) (1,596) (32,861)
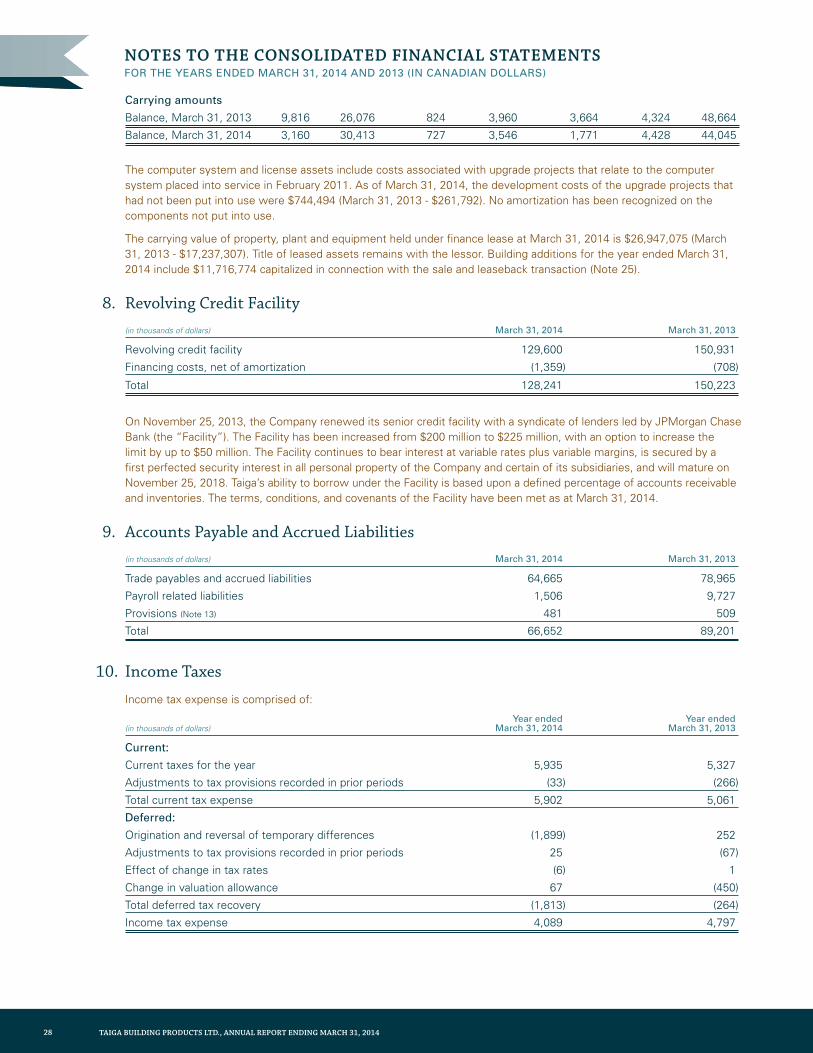
28 TAIGA BUILDING PRODUCTS LTD., ANNUAL REPORT ENDING MARCH 31, 2014
NOTES TO THE CONSOLIDATED FINANCIAL STATEMENTS FOR THE yEaRs EndEd MaRcH 31, 2014 and 2013 (in canadian dOllaRs)
Carrying amounts
Balance, March 31, 2013 9,816 26,076 824 3,960 3,664 4,324 48,664
Balance, March 31, 2014 3,160 30,413 727 3,546 1,771 4,428 44,045
The computer system and license assets include costs associated with upgrade projects that relate to the computer system placed into service in February 2011. As of March 31, 2014, the development costs of the upgrade projects that had not been put into use were $744,494 (March 31, 2013 - $261,792). No amortization has been recognized on the components not put into use.
The carrying value of property, plant and equipment held under finance lease at March 31, 2014 is $26,947,075 (March 31, 2013 - $17,237,307). Title of leased assets remains with the lessor. Building additions for the year ended March 31, 2014 include $11,716,774 capitalized in connection with the sale and leaseback transaction (Note 25).
8. Revolving Credit Facility
(in thousands of dollars) March 31, 2014 March 31, 2013
Revolving credit facility 129,600 150,931
Financing costs, net of amortization (1,359) (708)
Total 128,241 150,223
On November 25, 2013, the Company renewed its senior credit facility with a syndicate of lenders led by JPMorgan Chase Bank (the “Facility”). The Facility has been increased from $200 million to $225 million, with an option to increase the limit by up to $50 million. The Facility continues to bear interest at variable rates plus variable margins, is secured by a first perfected security interest in all personal property of the Company and certain of its subsidiaries, and will mature on November 25, 2018. Taiga’s ability to borrow under the Facility is based upon a defined percentage of accounts receivable and inventories. The terms, conditions, and covenants of the Facility have been met as at March 31, 2014.
9. Accounts Payable and Accrued Liabilities
(in thousands of dollars) March 31, 2014 March 31, 2013
Trade payables and accrued liabilities 64,665 78,965
Payroll related liabilities 1,506 9,727
Provisions (Note 13) 481 509
Total 66,652 89,201
10. Income Taxes
Income tax expense is comprised of:
Year ended Year ended (in thousands of dollars) March 31, 2014 March 31, 2013
Current:
Current taxes for the year 5,935 5,327
Adjustments to tax provisions recorded in prior periods (33) (266)
Total current tax expense 5,902 5,061
Deferred:
Origination and reversal of temporary differences (1,899) 252
Adjustments to tax provisions recorded in prior periods 25 (67)
Effect of change in tax rates (6) 1
Change in valuation allowance 67 (450)
Total deferred tax recovery (1,813) (264)
Income tax expense 4,089 4,797
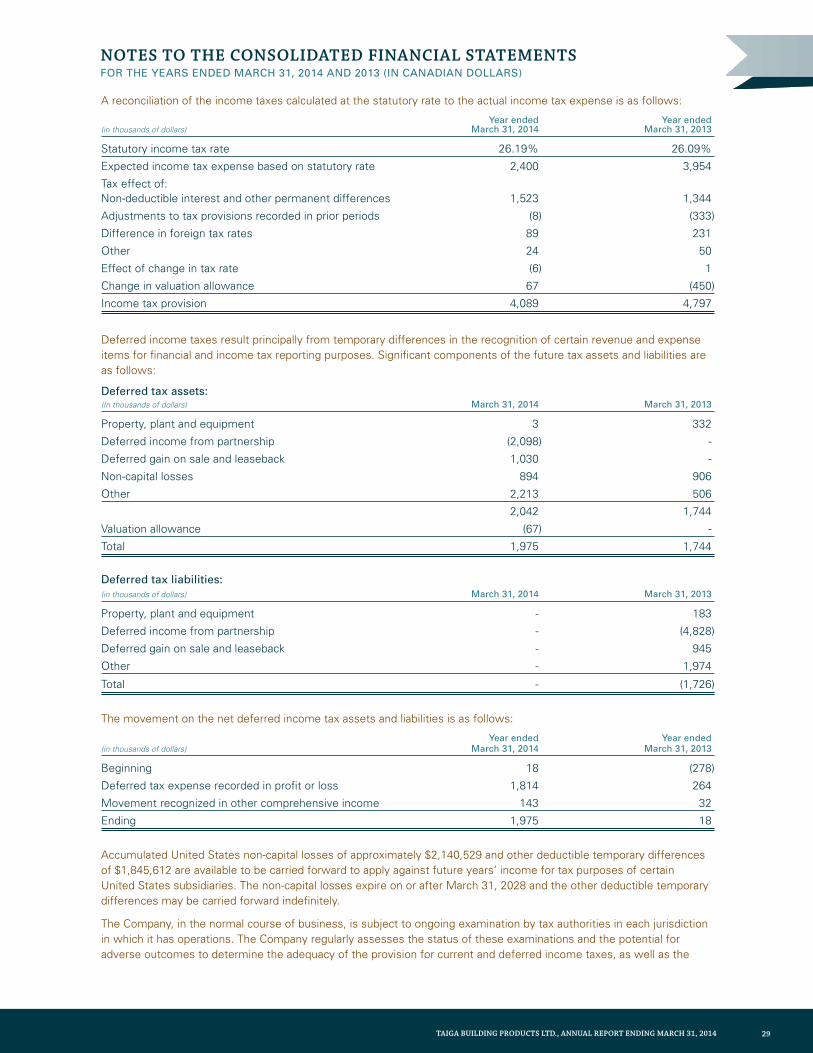
29TAIGA BUILDING PRODUCTS LTD., ANNUAL REPORT ENDING MARCH 31, 2014
Notes to the CoNsolidated FiNaNCial statemeNts FOR THE yEaRs EndEd MaRcH 31, 2014 and 2013 (in canadian dOllaRs)
A reconciliation of the income taxes calculated at the statutory rate to the actual income tax expense is as follows:
Year ended Year ended (in thousands of dollars) March 31, 2014 March 31, 2013
Statutory income tax rate 26.19% 26.09%
Expected income tax expense based on statutory rate 2,400 3,954
Tax effect of: Non-deductible interest and other permanent differences 1,523 1,344
Adjustments to tax provisions recorded in prior periods (8) (333)
Difference in foreign tax rates 89 231
Other 24 50
Effect of change in tax rate (6) 1
Change in valuation allowance 67 (450)
Income tax provision 4,089 4,797
Deferred income taxes result principally from temporary differences in the recognition of certain revenue and expense items for financial and income tax reporting purposes. Significant components of the future tax assets and liabilities are as follows:
Deferred tax assets:(In thousands of dollars) March 31, 2014 March 31, 2013
Property, plant and equipment 3 332
Deferred income from partnership (2,098) -
Deferred gain on sale and leaseback 1,030 -
Non-capital losses 894 906
Other 2,213 506
2,042 1,744
Valuation allowance (67) -
Total 1,975 1,744
Deferred tax liabilities:(in thousands of dollars) March 31, 2014 March 31, 2013
Property, plant and equipment - 183
Deferred income from partnership - (4,828)
Deferred gain on sale and leaseback - 945
Other - 1,974
Total - (1,726)
The movement on the net deferred income tax assets and liabilities is as follows:
Year ended Year ended (in thousands of dollars) March 31, 2014 March 31, 2013
Beginning 18 (278)
Deferred tax expense recorded in profit or loss 1,814 264
Movement recognized in other comprehensive income 143 32
Ending 1,975 18
Accumulated United States non-capital losses of approximately $2,140,529 and other deductible temporary differences of $1,845,612 are available to be carried forward to apply against future years’ income for tax purposes of certain United States subsidiaries. The non-capital losses expire on or after March 31, 2028 and the other deductible temporary differences may be carried forward indefinitely.
The Company, in the normal course of business, is subject to ongoing examination by tax authorities in each jurisdiction in which it has operations. The Company regularly assesses the status of these examinations and the potential for adverse outcomes to determine the adequacy of the provision for current and deferred income taxes, as well as the
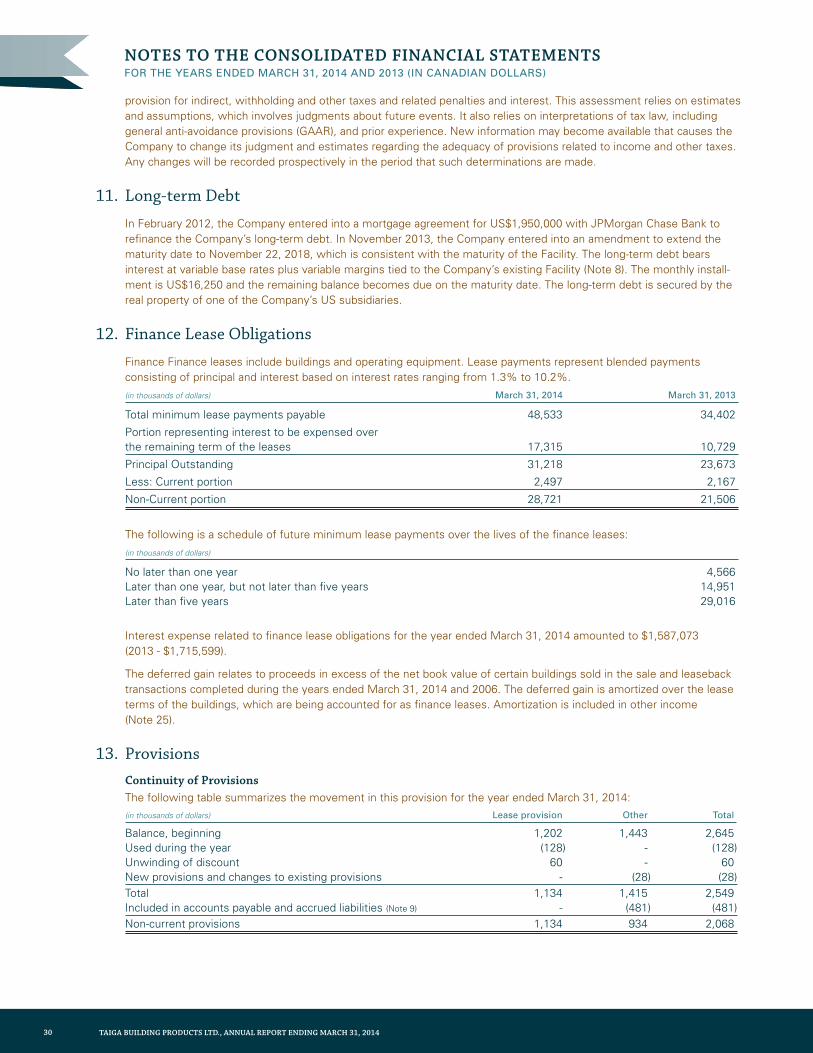
30 TAIGA BUILDING PRODUCTS LTD., ANNUAL REPORT ENDING MARCH 31, 2014
NOTES TO THE CONSOLIDATED FINANCIAL STATEMENTS FOR THE yEaRs EndEd MaRcH 31, 2014 and 2013 (in canadian dOllaRs)
provision for indirect, withholding and other taxes and related penalties and interest. This assessment relies on estimates and assumptions, which involves judgments about future events. It also relies on interpretations of tax law, including general anti-avoidance provisions (GAAR), and prior experience. New information may become available that causes the Company to change its judgment and estimates regarding the adequacy of provisions related to income and other taxes. Any changes will be recorded prospectively in the period that such determinations are made.
11. Long-term Debt
In February 2012, the Company entered into a mortgage agreement for US$1,950,000 with JPMorgan Chase Bank to refinance the Company’s long-term debt. In November 2013, the Company entered into an amendment to extend the maturity date to November 22, 2018, which is consistent with the maturity of the Facility. The long-term debt bears interest at variable base rates plus variable margins tied to the Company’s existing Facility (Note 8). The monthly install-ment is US$16,250 and the remaining balance becomes due on the maturity date. The long-term debt is secured by the real property of one of the Company’s US subsidiaries.
12. Finance Lease Obligations
Finance Finance leases include buildings and operating equipment. Lease payments represent blended payments consisting of principal and interest based on interest rates ranging from 1.3% to 10.2%.
(in thousands of dollars) March 31, 2014 March 31, 2013
Total minimum lease payments payable 48,533 34,402
Portion representing interest to be expensed over the remaining term of the leases 17,315 10,729
Principal Outstanding 31,218 23,673
Less: Current portion 2,497 2,167
Non-Current portion 28,721 21,506
The following is a schedule of future minimum lease payments over the lives of the finance leases:
(in thousands of dollars)
No later than one year 4,566 Later than one year, but not later than five years 14,951 Later than five years 29,016
Interest expense related to finance lease obligations for the year ended March 31, 2014 amounted to $1,587,073 (2013 - $1,715,599).
The deferred gain relates to proceeds in excess of the net book value of certain buildings sold in the sale and leaseback transactions completed during the years ended March 31, 2014 and 2006. The deferred gain is amortized over the lease terms of the buildings, which are being accounted for as finance leases. Amortization is included in other income (Note 25).
13. Provisions Continuity of Provisions
The following table summarizes the movement in this provision for the year ended March 31, 2014:(in thousands of dollars) Lease provision Other Total
Balance, beginning 1,202 1,443 2,645 Used during the year (128) - (128) Unwinding of discount 60 - 60 New provisions and changes to existing provisions - (28) (28)Total 1,134 1,415 2,549 Included in accounts payable and accrued liabilities (Note 9) - (481) (481)Non-current provisions 1,134 934 2,068
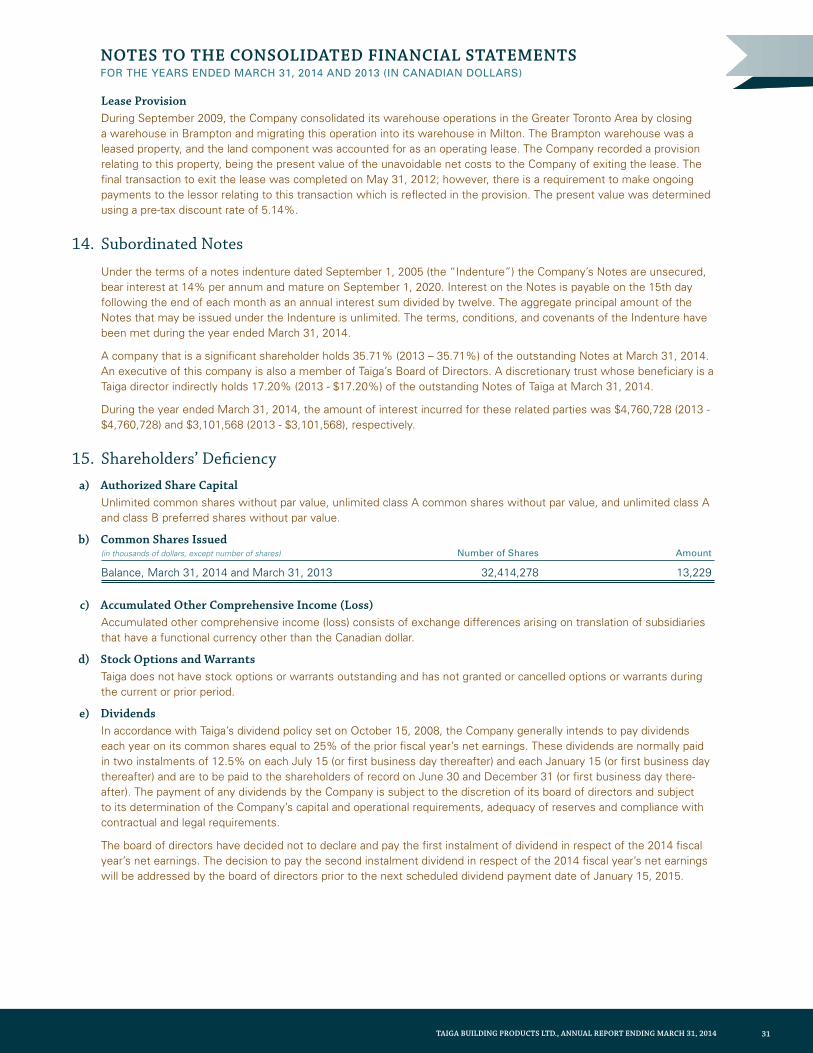
31TAIGA BUILDING PRODUCTS LTD., ANNUAL REPORT ENDING MARCH 31, 2014
Notes to the CoNsolidated FiNaNCial statemeNts FOR THE yEaRs EndEd MaRcH 31, 2014 and 2013 (in canadian dOllaRs)
Lease ProvisionDuring September 2009, the Company consolidated its warehouse operations in the Greater Toronto Area by closing a warehouse in Brampton and migrating this operation into its warehouse in Milton. The Brampton warehouse was a leased property, and the land component was accounted for as an operating lease. The Company recorded a provision relating to this property, being the present value of the unavoidable net costs to the Company of exiting the lease. The final transaction to exit the lease was completed on May 31, 2012; however, there is a requirement to make ongoing payments to the lessor relating to this transaction which is reflected in the provision. The present value was determined using a pre-tax discount rate of 5.14%.
14. Subordinated Notes
Under the terms of a notes indenture dated September 1, 2005 (the “Indenture”) the Company’s Notes are unsecured, bear interest at 14% per annum and mature on September 1, 2020. Interest on the Notes is payable on the 15th day following the end of each month as an annual interest sum divided by twelve. The aggregate principal amount of the Notes that may be issued under the Indenture is unlimited. The terms, conditions, and covenants of the Indenture have been met during the year ended March 31, 2014.
A company that is a significant shareholder holds 35.71% (2013 – 35.71%) of the outstanding Notes at March 31, 2014. An executive of this company is also a member of Taiga’s Board of Directors. A discretionary trust whose beneficiary is a Taiga director indirectly holds 17.20% (2013 - $17.20%) of the outstanding Notes of Taiga at March 31, 2014.
During the year ended March 31, 2014, the amount of interest incurred for these related parties was $4,760,728 (2013 - $4,760,728) and $3,101,568 (2013 - $3,101,568), respectively.
15. Shareholders’ Deficiencya) Authorized Share Capital
Unlimited common shares without par value, unlimited class A common shares without par value, and unlimited class A and class B preferred shares without par value.
b) Common Shares Issued(in thousands of dollars, except number of shares) Number of Shares Amount
Balance, March 31, 2014 and March 31, 2013 32,414,278 13,229
c) Accumulated Other Comprehensive Income (Loss)Accumulated other comprehensive income (loss) consists of exchange differences arising on translation of subsidiaries that have a functional currency other than the Canadian dollar.
d) Stock Options and WarrantsTaiga does not have stock options or warrants outstanding and has not granted or cancelled options or warrants during the current or prior period.
e) DividendsIn accordance with Taiga’s dividend policy set on October 15, 2008, the Company generally intends to pay dividends each year on its common shares equal to 25% of the prior fiscal year’s net earnings. These dividends are normally paid in two instalments of 12.5% on each July 15 (or first business day thereafter) and each January 15 (or first business day thereafter) and are to be paid to the shareholders of record on June 30 and December 31 (or first business day there-after). The payment of any dividends by the Company is subject to the discretion of its board of directors and subject to its determination of the Company’s capital and operational requirements, adequacy of reserves and compliance with contractual and legal requirements.
The board of directors have decided not to declare and pay the first instalment of dividend in respect of the 2014 fiscal year’s net earnings. The decision to pay the second instalment dividend in respect of the 2014 fiscal year’s net earnings will be addressed by the board of directors prior to the next scheduled dividend payment date of January 15, 2015.
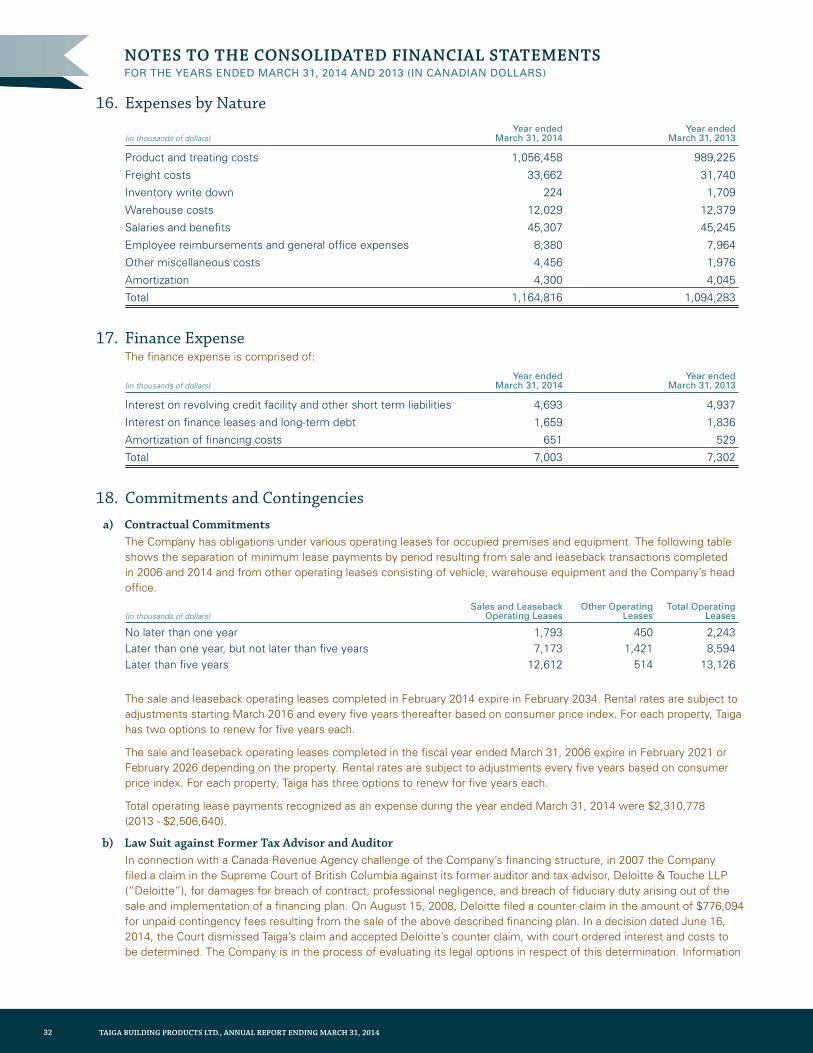
32 TAIGA BUILDING PRODUCTS LTD., ANNUAL REPORT ENDING MARCH 31, 2014
NOTES TO THE CONSOLIDATED FINANCIAL STATEMENTS FOR THE yEaRs EndEd MaRcH 31, 2014 and 2013 (in canadian dOllaRs)
16. Expenses by Nature Year ended Year ended (in thousands of dollars) March 31, 2014 March 31, 2013
Product and treating costs 1,056,458 989,225
Freight costs 33,662 31,740
Inventory write down 224 1,709
Warehouse costs 12,029 12,379
Salaries and benefits 45,307 45,245
Employee reimbursements and general office expenses 8,380 7,964
Other miscellaneous costs 4,456 1,976
Amortization 4,300 4,045
Total 1,164,816 1,094,283
17. Finance ExpenseThe finance expense is comprised of:
Year ended Year ended (in thousands of dollars) March 31, 2014 March 31, 2013
Interest on revolving credit facility and other short term liabilities 4,693 4,937
Interest on finance leases and long-term debt 1,659 1,836
Amortization of financing costs 651 529
Total 7,003 7,302
18. Commitments and Contingenciesa) Contractual Commitments
The Company has obligations under various operating leases for occupied premises and equipment. The following table shows the separation of minimum lease payments by period resulting from sale and leaseback transactions completed in 2006 and 2014 and from other operating leases consisting of vehicle, warehouse equipment and the Company’s head office.
Sales and Leaseback Other Operating Total Operating (in thousands of dollars) Operating Leases Leases Leases
No later than one year 1,793 450 2,243Later than one year, but not later than five years 7,173 1,421 8,594Later than five years 12,612 514 13,126
The sale and leaseback operating leases completed in February 2014 expire in February 2034. Rental rates are subject to adjustments starting March 2016 and every five years thereafter based on consumer price index. For each property, Taiga has two options to renew for five years each.
The sale and leaseback operating leases completed in the fiscal year ended March 31, 2006 expire in February 2021 or February 2026 depending on the property. Rental rates are subject to adjustments every five years based on consumer price index. For each property, Taiga has three options to renew for five years each.
Total operating lease payments recognized as an expense during the year ended March 31, 2014 were $2,310,778 (2013 - $2,506,640).
b) Law Suit against Former Tax Advisor and AuditorIn connection with a Canada Revenue Agency challenge of the Company’s financing structure, in 2007 the Company filed a claim in the Supreme Court of British Columbia against its former auditor and tax advisor, Deloitte & Touche LLP (“Deloitte”), for damages for breach of contract, professional negligence, and breach of fiduciary duty arising out of the sale and implementation of a financing plan. On August 15, 2008, Deloitte filed a counter claim in the amount of $776,094 for unpaid contingency fees resulting from the sale of the above described financing plan. In a decision dated June 16, 2014, the Court dismissed Taiga’s claim and accepted Deloitte’s counter claim, with court ordered interest and costs to be determined. The Company is in the process of evaluating its legal options in respect of this determination. Information
33TAIGA BUILDING PRODUCTS LTD., ANNUAL REPORT ENDING MARCH 31, 2014
Notes to the CoNsolidated FiNaNCial statemeNts FOR THE yEaRs EndEd MaRcH 31, 2014 and 2013 (in canadian dOllaRs)
usually required by International Accounting Standard 37, Provisions, Contingent Liabilities and Contingent Assets, has not been provided at this time, as it can be expected to seriously prejudice the ultimate outcome of the dispute.
On May 11, 2011, Taiga filed a second claim against Deloitte for breach of contract by withholding consent for Taiga to use audited financial statements, withholding consent to gain advantage in an unrelated fee dispute, and failing to act within the code of professional conduct. The outcome of the case is not determinable at this time.
c) Other Outstanding Legal MattersThe Company is involved in various non-material legal actions and claims arising in the course of its business. The financial impact individually or in aggregate resulting from these actions and claims is not expected to be significant. The individual and aggregate outcomes cannot be determined at this time.
d) Executive Transition AgreementsThe Company has a transition agreement with one executive, which includes consulting contract with terms of three years with an unspecified commencement date. The annual compensation for this contract, including both the fixed and variable portions, will range from a minimum of $111,000 to a maximum of $731,000. The Company is recording provisions associated with the contracts over the service terms. The accrued provision recorded as at March 31, 2014 was $934,515 (March 31, 2013 - $934,515). The fair value was determined by discounting the estimated future cash outflows arising after transition using a pre-tax discount rate of 4%.
19. Capital Disclosures
The Company’s objectives for managing capital are to safeguard Taiga’s ability to operate and grow its business, to provide a sufficient return to its shareholders, and to meet internal capital expenditure requirements and credit facility covenants. The revolving credit facilities and share capital are considered as the Company’s capital.
The Company manages the capital structure and makes adjustments to it in the light of changes in economic conditions and the risk characteristics of the underlying assets. In order to maintain or adjust the capital structure, the Company may adjust the amount of dividends paid to shareholders, issue new shares, or sell assets or consider other strategies to reduce debt.
The Company manages its capital by monitoring the balance between working capital and the revolving credit facility’s borrowing base, which is a combination of accounts receivable and inventories less certain provisions. The Company is required to maintain a certain interest coverage ratio, based on a percentage of the borrowing base, restricted by a maximum loan limit. At March 31, 2014, the Company was in compliance with this requirement.
20. Financial Instrumentsa) Accounting for financial instruments
The following table summarizes the carrying values of the Company’s financial instruments:
(in thousands of dollars) March 31, 2014 March 31, 2013
Held for trading 17 11
Loans and receivables 119,731 137,009
Other financial liabilities (356,641) (393,664)
The carrying amounts of accounts receivable and accounts payable approximate their fair values due to the short term to maturity of these instruments. The carrying amounts of the revolving credit facility and long-term debt approximate their fair values as these liabilities bear interest at variable market rates.
The carrying amount and fair values of finance lease obligations are as follows:
(in thousands of dollars) March 31, 2014 March 31, 2013
Carrying amount 31,218 23,673
Fair value 30,981 23,276
The fair value of the finance lease obligations was determined using current borrowing rates for similar debt instruments.
34 TAIGA BUILDING PRODUCTS LTD., ANNUAL REPORT ENDING MARCH 31, 2014
NOTES TO THE CONSOLIDATED FINANCIAL STATEMENTS FOR THE yEaRs EndEd MaRcH 31, 2014 and 2013 (in canadian dOllaRs)
The carrying amount and fair values of the subordinated notes are as follows:
(in thousands of dollars) March 31, 2014 March 31, 2013
Carrying amount 128,834 128,834
Fair value 137,852 136,564
The fair value of the subordinated notes was determined based on closing price of the notes which are traded on the Toronto Stock Exchange.
The carrying amount of derivative financial instrument assets and liabilities are equal to their fair values as these instru-ments are re-measured to their fair values at each reporting date as follows:
(in thousands of dollars) March 31, 2014 March 31, 2013
Lumber futures 17 11
Financial instruments measured at fair value are classified into one of three levels in the fair value hierarchy according to the relative reliability of the inputs used to estimate the fair values. The three levels of the fair value hierarchy are:
Level 1 – based on quoted prices in active markets for identical assets or liabilities;
Level 2 – based on inputs other than quoted prices that are observable for the asset or liability, either directly (as prices) or indirectly (derived from prices); or
Level 3 – applies to assets and liabilities for inputs that are not based on observable market data, which are unobservable inputs.
Derivative financial instrument assets and liabilities are classified as level 2.
b) Nature and extent of risks arising from financial instrumentsThe Company’s activities result in exposure to a variety of financial risks, including risks related to credit, market, interest, currency, liquidity, and commodity prices.
(i) Credit riskCredit risk refers to the risk that a counterparty will default on its contractual obligations resulting in financial loss to the Company. Taiga is exposed to credit risk on accounts receivable from customers. Taiga extends to its customers credit, which is generally unsecured. Taiga has credit management procedures in place to mitigate the risk of losses due to the insolvency or bankruptcy of customers. Taiga regularly reviews customer credit limits, monitors the financial status of customers and assesses the collectability of accounts receivable. However, risk exists that some customers may not be able to meet their obligations and the loss of a large receivable could have a significant negative impact on Taiga’s profitability.
The Company is also exposed to credit risk from the potential default by any of its counterparties on the interest swap ((ii) below) and lumber futures contracts ((iv) below). The Company mitigates this credit risk by dealing with counterpar-ties that are established major financial institutions. Taiga evaluates potential counterparties in advance of entering into such agreements and deals only with parties it anticipates will satisfy their obligations under the contracts.
(ii) Market riskMarket risk refers to the risk of loss that may arise from changes in market factors such as interest rates and foreign exchange rates.
Interest rate risk refers to the risk that the fair value or future cash flows of a financial instrument will fluctuate due to changes in market interest rates. Taiga utilizes significant leverage to finance day-to-day operations. The interest cost of Taiga’s revolving credit facility is predominately based on the prime rate. For the year ended March 31, 2014, if interest rates had been 100 basis points higher, based on the Company’s average borrowing level related to its Facility, interest expense would have increased by approximately $1.1 million.
Taiga monitors current interest rates and selectively utilizes interest rate swap agreements. Taiga had no interest rate swap agreements outstanding as at March 31, 2014.
35TAIGA BUILDING PRODUCTS LTD., ANNUAL REPORT ENDING MARCH 31, 2014
Notes to the CoNsolidated FiNaNCial statemeNts FOR THE yEaRs EndEd MaRcH 31, 2014 and 2013 (in canadian dOllaRs)
Foreign exchange risk refers to the risk that the fair value or future cash flow of a financial instrument denominated in a currency other than the functional currency in which they are measured will fluctuate because of changes in foreign exchange rates. Taiga does not hedge its foreign exchange risk. Financial instruments denominated in US dollars subject to foreign exchange risk are as follows:
(in thousands of dollars) March 31, 2014 March 31, 2013
Accounts Receivable 4,343 5,716
Accounts Payable (6,615) (8,282)
Revolving Credit Facility (3,134) (5,542)
Total (5,406) (8,108)
As at March 31, 2014, with other variables unchanged, a one percentage point decline in the year end value of the Canadian dollar would have increased the foreign exchange loss by $54,000 (2013 - $81,000).
(iii) Liquidity riskLiquidity risk arises through the excess of financial obligations over financial assets due at any point in time. Taiga’s ability to make scheduled payments or refinance its obligations depends on Taiga’s successful financial and operating performance, cash flows and capital resources, which in turn depend upon prevailing economic conditions and certain financial, business and other factors.
Taiga’s ability to maintain compliance with certain of its debt covenants under the Facility depends on meeting the required interest coverage ratio, which is subject to the Company’s future financial and operating performance. The Company’s ability to repay or refinance its indebtedness will also depend on its future financial and operating perfor-mance. The Company’s performance, in turn, will be subject to prevailing economic and competitive conditions, as well as financial, business, legislative, regulatory, industry and other factors, many of which are beyond Taiga’s control. The Company’s ability to meet its future debt service and other obligations may depend in significant part on the extent to which the Company can implement successfully its business growth and cost reduction strategies. The Company cannot provide any assurance that it will be able to implement its strategy fully or that the anticipated results of its strategy will be realized.
(iv) Commodity Price risk:Taiga does not generally hedge its commodity price risk through the purchase of lumber futures contracts. Substantially all purchases are made based on current orders and anticipated sales, and most sales are made from inventory or against product on order. Inventory levels are monitored in an attempt to achieve balance between maximum inventory turnover and anticipated customer demand. Although Taiga strives to reduce the risk associated with price changes by maximizing inventory turnover, Taiga maintains significant quantities of inventory, which is affected by fluctuating prices.
Taiga selectively utilizes Chicago Mercantile Exchange Random Length lumber futures contracts. Each contract calls for mill delivery of 110,000 board feet (plus or minus 5000 board feet) of random length 8-foot to 20-foot nominal 2-inch x 4-inch pieces. The contracts can be settled in cash or by delivery of a commodity. These positions are immaterial relative to the Company’s consolidated inventories.
21. Changes in Non-Cash Working Capital Year ended Year ended (in thousands of dollars) March 31, 2014 March 31, 2013
Decrease (Increase) in Accounts receivable 17,173 (9,213) Decrease (Increase) in Inventories 8,873 (33,483) Decrease (Increase) in Prepaid expenses and other 209 (131) Effect of foreign exchange on working capital 2,924 567 (Decrease) in Accounts payable and accrued liabilities (23,499) (96)
Total 5,680 42,356)
22. Seasonality
The Company operates in a seasonal industry that generally experiences higher sales in the first and second quarters and reduced sales in the late fall and winter during its third and fourth quarters of each fiscal year.
36 TAIGA BUILDING PRODUCTS LTD., ANNUAL REPORT ENDING MARCH 31, 2014
NOTES TO THE CONSOLIDATED FINANCIAL STATEMENTS FOR THE yEaRs EndEd MaRcH 31, 2014 and 2013 (in canadian dOllaRs)
23. Segmented Information
Taiga operates within one business segment and has two reportable geographic segments as follows:
2014(in thousands of dollars) Canada United States Total
Revenue 1,098,204 96,055 1,194,259Property, plant and equipment 36,217 7,828 44,045
2013(in thousands of dollars) Canada United States Total
Revenue 1,050,414 82,329 1,132,743Property, plant and equipment 41,639 7,025 48,664
During the year, Taiga’s Canadian operations had export sales of $195.3 million (2013 - $154.1 million). These export sales were primarily to the United States and Asia, and are included as part of the Canadian segment in the table above. For the year ended March 31, 2014, sales to a major customer represented 10.1% of sales (2013 - 10.7%).
24. Management Compensation
Compensation of key management is recorded on the accrual basis of accounting consistent with the amounts recognized in the consolidated statements of earnings and comprehensive income. Compensation expenses for key management, which includes the Company’s Board of Directors and Officers, were as follows:
Year ended Year ended (in thousands of dollars) March 31, 2014 March 31, 2013
Salaries and other benefits 3,419 1,953
25. Sale and Leaseback
In November 2013, Taiga entered into an agreement with Korite Capital Corporation for the sale and leaseback of five of Taiga’s distribution facilities for net proceeds of $19,431,910. The transaction was completed in February 2014 and resulted in an overall pre-tax gain of $2,061,038. The Company has recognized an immediate gain of $3,054,859 relating to the land components as they are now accounted for as operating leases. The gains and losses on the building compo-nents, now accounted for as finance leases, have either been deferred or capitalized, respectively, and will be amortized over the term of the lease.
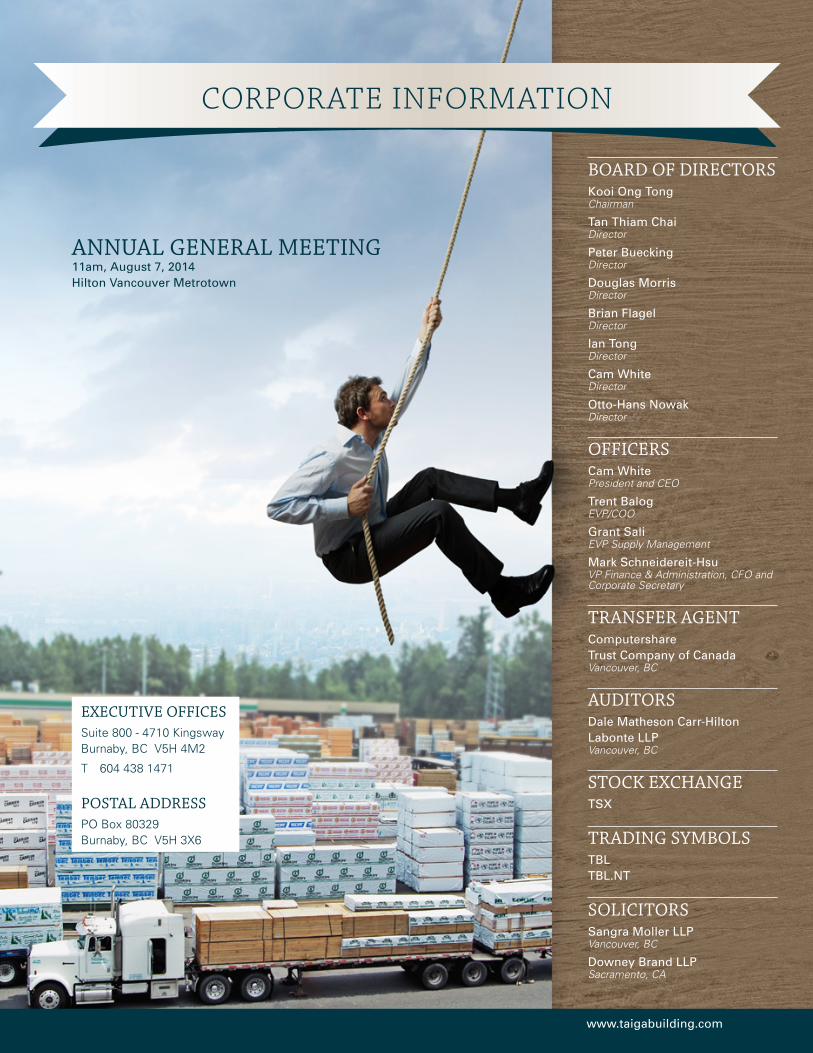
CoRPoRATE INFoRMATIoN
ANNUAL GENERAL MEETING11am, August 7, 2014 Hilton Vancouver Metrotown
BOARD OF DIRECTORSKooi Ong Tong Chairman
Tan Thiam Chai Director
Peter Buecking Director
Douglas Morris Director
Brian Flagel Director
Ian Tong Director
Cam White Director
Otto-Hans Nowak Director
OFFICERSCam White President and CEO
Trent Balog EVP/COO
Grant Sali EVP Supply Management
Mark Schneidereit-Hsu VP Finance & Administration, CFO and Corporate Secretary
TRANSFER AGENTComputershare Trust Company of Canada Vancouver, BC
AUDITORSDale Matheson Carr-Hilton Labonte LLP Vancouver, BC
STOCk ExCHANGETSX
TRADING SyMBOLSTBL TBL.NT
SOLICITORSSangra Moller LLP Vancouver, BC
Downey Brand LLP Sacramento, CA
ExECUTIvE OFFICESSuite 800 - 4710 Kingsway Burnaby, BC V5H 4M2
T 604 438 1471
POSTAL ADDRESSPO Box 80329 Burnaby, BC V5H 3X6
www.taigabuilding.com