Embed Size (px)
Citation preview


What’s Inside
Dear Shareholder
The Board of Directors is pleased to present the Annual Report of The Mauritius Chemical and Fertilizer Industry Limited (MCFI) for the year ended 31 December 2013, the contents of which are listed below.
This report was approved by the Board of Directors at its meeting held on 26 March 2014.
Vincent LabatDirector
Antoine L HarelChairman
Group Profile, Vision, Mission and Values
At a Glance
Corporate Information
Group Financial Highlights
Board of Directors
Senior Management Profile
Chairman’s Statement
General Manager’s Statement
Corporate Governance Report
Statutory Disclosures
Statement of Directors’ Responsibilities
Certificate by Secretary
Value Added Statement
Independent Auditors’ Report to the Members
Financial Statements
2
3
6
7
8
10
14
16
22
29
32
33
35
36
37
Annual Report 2013 1

4 Dedicated Employees
SpecialtyFertilizers
1%
Complex NPKFertilizers
31%
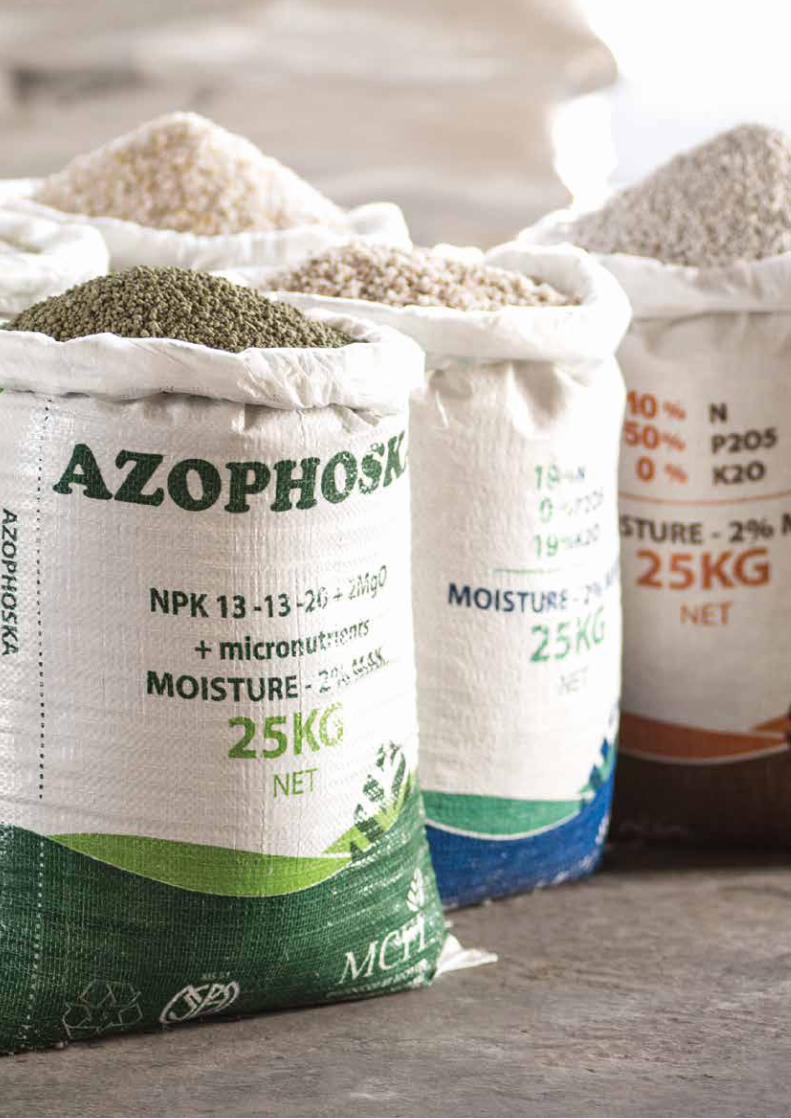
Straight Fertilizers:Urea, MAP, DAP, MOP, CAN, TSP,Ammonium SulphateBlended NPK:Urea-based, Nitrate-based
59%Blended andStraight Fertilizers
Complete Fertilizer Range for:Sugarcane, Flowers and Ornamentals,Vegetables and Fruit trees
Manufacturing and Formulation of Complex NPK fertilizers with Ureaic,Nitrate and Ammonical base as well as with organic growth promoters
Various NPK grades for local market and Export
Soluble NPK + micro, Liquid NPK + micro,Technical Grade Fertilizer, Organic Plant Nutrients, Organo Mineral Fertilizers,Soil Conditioners, Plant Growth Promoters
Complete Nutrition Solutions for plants:Vegetables, Flowers, Lawns, Turf, Fruit trees,Hydroponics, Ferti-irrigation, Nursery andHousehold plants
MechanicalApplication
9% Mechanical Application of complex fertilizers for sugarcane growers as per their crop requirements
Homogeneous and precise application of complex NPK in sugarcane field with tractor-mounted controlled applicators
Products End Uses
134
International Presence
Operating since 1975
sectors of activity
GROUP PROFILE
MISSION
The Mauritius Chemical and Fertilizer Industry Limited (MCFI) is a manufacturing company, operating a NPK complex fertilizer plant and a blending plant for fertilizers in the Port area. It is a public company and has been listed on the official market of The Stock Exchange of Mauritius since 1989 and is a subsidiary of Harel Mallac & Co. Ltd.
In addition to the production of fertilizers, MCFI has two trading arms through two fully owned subsidiary companies, MCFI (Freeport) Ltd. and MCFI International & Co. Ltd., which are involved in the trading of commodities in Africa.
Coolkote Enterprises Ltd. is a fully owned subsidiary of MCFI since 1 September 2008. Its main activities consist of waterproofing and specialty decorative coating applications.
MCFI has a contract to manage two companies, namely, Chemco Limited which trades in chemicals and general goods, and Bychemex Limited which specialises in textile chemicals.
MCFI holds 21.5 per cent of the equity capital of Rehm Grinaker Construction Co. Ltd. and Rehm Grinaker Properties Co. Ltd.
VISIONTo be the leader in the fertilizer and chemical business in the region and to diversify through new ventures
To foster a quality culture and sustainable development.To satisfy the requirements of all our stakeholders.To create an environment conducive to maximising the wealth of our Company. To promote the development and welfare of our staff, while applying best practices and high ethical standards.
At MCFI, we live our values with P.R.I.D.E. and endeavour to bring each one of these values
in everything we do
PASSION RELATIONSHIP DEVELOPMENT EXCELLENCEINTEGRITY
VALUES
The Mauritius Chemical and Fertilizer Industry Limited2

4 Dedicated Employees
SpecialtyFertilizers
1%
Complex NPKFertilizers
31%
Straight Fertilizers:Urea, MAP, DAP, MOP, CAN, TSP,Ammonium SulphateBlended NPK:Urea-based, Nitrate-based
59%Blended andStraight Fertilizers
Complete Fertilizer Range for:Sugarcane, Flowers and Ornamentals,Vegetables and Fruit trees
Manufacturing and Formulation of Complex NPK fertilizers with Ureaic,Nitrate and Ammonical base as well as with organic growth promoters
Various NPK grades for local market and Export
Soluble NPK + micro, Liquid NPK + micro,Technical Grade Fertilizer, Organic Plant Nutrients, Organo Mineral Fertilizers,Soil Conditioners, Plant Growth Promoters
Complete Nutrition Solutions for plants:Vegetables, Flowers, Lawns, Turf, Fruit trees,Hydroponics, Ferti-irrigation, Nursery andHousehold plants
MechanicalApplication
9% Mechanical Application of complex fertilizers for sugarcane growers as per their crop requirements
Homogeneous and precise application of complex NPK in sugarcane field with tractor-mounted controlled applicators
Products End Uses
134
International Presence
Operating since 1975
sectors of activity
At a Glance
Annual Report 2013 3

“Selected Products” means that we have decided to supply you with a carefully selected range of quality products and services that will meet all your needs and assure you of great returns.
Selected Products+200

Corporate Information
COMPANY SECRETARYHM Secretaries Ltd.18 Edith Cavell StreetPort Louis
AUDITORSBDO & Co
BANKERSBarclays Bank PLC.Baroda Bank Ltd.Habib Bank Ltd.Hong Kong & Shanghai Banking Corporation Ltd.State Bank of Mauritius Ltd.The Mauritius Commercial Bank Ltd.
LEGAL ADVISERSIvan Collendavelloo ChambersEtude Georges Robert
NOTARYMr Didier Maigrot, Notary Public
REGISTERED OFFICEChaussée TromelinFort George, Port [email protected]
REGISTRYMauritius Computing Services Ltd.18 Edith Cavell StreetPort Louis
BUSINESS REGISTRATION NUMBERC06001461
The Mauritius Chemical and Fertilizer Industry Limited6

+1.5%1.00 0.55 12,064
Revenue
Dividend per Share (Rs)
Dividend per Share (Rs)
Net Worth per Share Group (Rs)
Earnings per Share Group (Rs)
Closing Share Price (Rs)
Earnings per Share (Rs)
Profit after Taxation (Rs’000)
Group Financial Highlights
2013 2012OPERATING RESULTS
Turnover (Rs’000) 812,258 800,951 Profit before taxation (Rs’000) 21,306 25,466 Earnings per share (Rs) 0.55 0.83 Dividend per share (Rs) 1.00 1.00 Dividend cover (times) 0.55 0.83 Profit after taxation (Rs’000) 12,064 18,219
BALANCE SHEET AND CASH FLOW
Total assets (Rs’000) 994,243 929,125 Capital expenditure (Rs’000) 6,277 17,994 Cash available from operations (Rs’000) 152,329 (56,433)
FINANCIAL RATIOS
Net worth per share (Rs) 34.48 35.17 Profit before taxation to turnover (%) 2.62 3.18 Profit after taxation to shareholders’ interest (%) 1.59 2.35 Closing share price (Rs) 24.00 28.00
34.4
8
0.83
0.55
Annual Report 2013 7

Antoine L Harel (56)Chairman (Non-Executive)
Antoine L Harel is a Fellow Member of the Institute of Chartered Accountants in England and Wales and holds a BA (Hons) degree in Accounting and Computing. He joined Harel Mallac & Co. Ltd. in 1987. In 1997, he was appointed Group CEO and is Chairman of the Board since April 2005. He was President of the Mauritius Chamber of Commerce & Industry in 1992/1993 and is a Director of The Mauritius Chemical and Fertilizer Industry Limited since 2001 and Chairman since 1 September 2007.
Other Directorships (listed Companies):Compagnie des Magasins Populaires Limitée (Chairman), Harel Mallac & Co. Ltd. (Chairman), Chemco Limited (Chairman), Bychemex Limited (Chairman) and Les Gaz Industriels Ltd. (Chairman).
Vincent Labat (51)Independent Director
Vincent Labat graduated as a Chemical Engineer. From 1996 to 2009 he was the Managing Director of Les Gaz Industriels Ltd., a listed Company. In 2010, he joined Medine Ltd. as Project Development Executive. In July 2011, he was appointed as Managing Director of the Agriculture Cluster. He is a Director of The Mauritius Chemical and Fertilizer Industry Limited since 26 October 2006.
Other Directorships (listed Companies):Bychemex Limited and Chemco Limited.
Allain Doger de Spéville (61)Independent Director
Allain Doger de Spéville is a Notary Public and was first appointed to the Board of Directors of The Mauritius Chemical and Fertilizer on 12 July 2006.
Other Directorship (listed Companies):The Mauritius Oil Refineries Ltd (Chairman).
Board of Directors of The Mauritius Chemical and Fertilizer Industry Limited as at 31 December 2013
Charles Harel (46)Non-Executive Director
Charles Harel holds a National Diploma in Management and Finance from the Cape Technikon, South Africa, as well as a MBA from the University of Birmingham, UK. He joined the Harel Mallac Group in 1993 and is presently acting as the Chief Executive Officer. He was appointed to the Board of Directors of The Mauritius Chemical and Fertilizer Industry Limited on 17 March 2009.
Other Directorships (listed Companies): Harel Mallac & Co. Ltd., Compagnie des Magasins Populaires Limitée, Bychemex Limited and Chemco Limited.
The Mauritius Chemical and Fertilizer Industry Limited8

Jean Yves Corson (54)Independent Director
Jean Yves Corson is holder of a Maîtrise d’Economie d’Entreprise from Université de Paris I, Panthéon Sorbonne. He held various senior management positions in France from 1986 to1990 before returning to Mauritius where he joined Noblesse Cie Ltée. He joined the Groupe Union in 1992 as Financial Manager and was appointed Corporate Planning and Development Manager in 1999. He held the function of Land Development Manager of Compagnie de Beau Vallon Ltée from August 2010 to December 2011. Since then he is acting as a Financial & Project Management Consultant. He was appointed to the Board of Directors of The Mauritius Chemical and Fertilizer Industry Limited since 13 August 2010.
Other Directorships (listed Companies):Bychemex Limited and Chemco Limited.
Sébastien Lavoipierre (41)Executive DirectorIn office up to 12 August 2013.
Rajendrasingh Rathacharen (70)Independent DirectorIn office up to 12 August 2013.
Christopher Boland (62)Non-Executive DirectorIn office up to 31 December 2013.
Michel Rivalland G.O.S.K. (60)Non-Executive Director
Michel Rivalland G.O.S.K. is a Fellow Member of the Chartered Association of Certified Accountants. He joined the Board of Directors of The Mauritius Chemical and Fertilizer Industry Limited on 1 June 2006 and served as Managing Director from October 2006 to 30 June 2009. He is currently an Executive Director of Harel Mallac & Co. Ltd.
Other Directorships (listed Companies):Compagnie des Magasins Populaires Limitée, Harel Mallac & Co. Ltd., Bychemex Limited and Chemco Limited.
Guy Harel (65) Non-Executive Director
Guy Harel joined Harel Mallac Group in 1981 as Managing Director of Fapcom Ltd. In 1983 he created Henkel Chemical (Mauritius) Limited and became its Managing Director in 1996. He was, since the acquisition of the former by the Harel Mallac Group in 2007, the Managing Director of Archemics Ltd. up to 31 December 2012.
Other Directorships (listed companies): Bychemex Limited and Chemco Limited.
Harold Ng Kwing King (64)Non-Executive Director
Harold Ng Kwing King holds a BSc Hons degree in Chemical Engineering, University of Leeds and he is a Senior Member of the American Institute of Chemical Engineers. He joined The Mauritius Chemical and Fertilizer Industry Ltd. in 1974 as Shift Engineer and he subsequently assumed various positions as Assistant Production Manager (1976), Production Manager (1978), Plant Manager (1980), Deputy General Manager (1988) and Managing Director (2006 to 2010). He was also Managing Director and Board Director of several Harel Mallac Group subsidiaries, i.e., Chemco Ltd., Bychemex Ltd., Coolkote Enterprises Ltd., Harel Mallac Export Ltd., MCFI International (Zambia) Ltd., Harel Mallac (Tanzania) Ltd. He is presently a management, trade and logistics consultant in Hariseng Ltd.
Other Directorships (listed companies): None.
Annual Report 2013 9

Senior Management
Romesh Raja RaiFinance Manager
Ranjit JatooaSales Manager
Harold Lai Chuck ChooOperations Manager
Christna HosaneeGroup Accountant
Ashvinath GeerjananHuman Resources Manager
Bottom:Beas CheekhooreeGeneral Manager
Eric de MaroussemSales Manager
Ashok VarjangbhayManaging Director of MCFI International (Zambia) Ltd.
From left to right:
The Mauritius Chemical and Fertilizer Industry Limited10

Senior Management Profile
Beas CheekhooreeGeneral Manager
Beas Cheekhooree holds a Bachelors degree in Chemical Engineering from North East London Polytechnic, United Kingdom. He occupied various senior management positions in the textile industry locally and in India before joining the Harel Mallac Group in 2013 as Managing Director of Harel Mallac Export Ltd. He was appointed Managing Director of Harel Mallac Export Ltd. and General Manager of The Mauritius Chemical and Fertilizer Industry Limited, Bychemex Limited, Chemco Limited and Coolkote Enterprises Ltd. in October 2013.
Eric de MaroussemSales Manager
Eric de Maroussem holds a B.Com degree from the University of Natal, Pietermaritzburg, South Africa. He has worked for Phoenix Beverages Ltd as Sales Manager before joining Archemics Limited in 2007 as Head of Sales. In 2009, he joined the Company as Sales Manager.
Ranjit JatooaSales Manager
Ranjit Jatooa is a qualified Agronomist, holding a Bachelor’s degree in Agriculture and a Masters degree in Crop Science from the University of Mauritius. He joined Chemco Limited in 2005 as Sales Executive in the Agribusiness Department and was promoted Product Manager in 2007. He joined the Company in 2009 as Sales Manager.
Harold Lai Chuck ChooOperations Manager
Harold Lai Chuck Choo holds a BSc (Hons) degree in Chemical Engineering from Teesside University. He is the Operations Manager since October 2006 after serving as Technical Manager of the MCFI Group since May 1988. He was Acting Plant Manager at the Grays Refinery Ltd from 1981 to 1988. He is a Senior Member of the American Institute of Chemical Engineers and represents the Company in the technical sub-committee of the International Fertilizers Association.
Romesh Raja RaiFinance Manager
Romesh Raja Rai is an Associate Member of the Institute of Chartered Accountants in England and Wales (ACA). He was articled with Coopers & Lybrand (London) and after qualifying, he joined DCDM in 1983 and left in 1988 to join the MCFI Group as Finance Manager. He was also involved in the setting up of the Association of Mauritian Manufacturers (AMM) and was a council member representing MCFI.
Christna HosaneeGroup Accountant
Christna Hosanee started his career at MCFI Ltd in 1978. He was involved in the setting up of the computer department in the mid-1980s and has held various positions across the organisation amongst which, as IT Supervisor, and later, as the Accountant of sister companies Chemco Ltd and Bychemex Ltd. He is a member of the Association of Chartered Certified Accountants.
Ashok VarjangbhayManaging Director of MCFI International (Zambia) Ltd.
Ashok Varjangbhay holds a Bachelor’s degree in Chemical Engineering from IIT Bombay, India. He was the General Manager of Mauritius Jute and Textiles Ltd. from 1986 to 1995 and initially started Zebra Trading Ltd. in Zambia. He is the Managing Director of MCFI International (Zambia) Ltd. since the start of its operations in 1999. He is a member of the Engineering Institution of Zambia.
Ashvinath GeerjananHuman Resources Manager
Ashvinath Geerjanan, joined Harel Mallac Group in September 2012, when he joined the Management team of the Chemical Cluster, based at MCFI, and reports to the Managing Director. He has extensive experience in commercial and industrial human resources management. He manages the daily HR related operations of MCFI, Bychemex, Chemco, Coolkote, Suchem, and Archemics, as well as ensures smooth HR practice roll out to the overseas businesses of the chemical cluster. Ashvin also acts as an Harel Mallac Service Champion by driving change management and the service excellence programme across all the business units in his respective cluster, together with his other colleagues.
Annual Report 2013 11

“Loyal Customers” means that we have been able to attract and retain customers through our range of products and services. This has enabled us to grow our customer base and establish ourselves as a key player on the market.
Loyal Customers+150


“ The liquidity management of placing excess cash of Rs303M with the holding company has helped contributing Rs22M as interest income compared to Rs19M in 2012.”
The year 2013 was challenging for MCFI. Despite the fact that the economy remained subdued, the Company has succeeded in enhancing its operating performance and improving its liquidity management, resulting in improved profitability compared to the previous year.
2013 was characterised by sluggish growth as turnover grew by 1 per cent from Rs801M to Rs812M. However, the gross profit margin improved from 18 per cent to 19 per cent. The export business, especially the market in Reunion Island, suffered a decline. In 2012, exports accounted for 44 per cent compared to 38 per cent in 2013. 62 per cent of business was generated from Mauritius compared to last year when Mauritius generated 56 per cent of turnover. Our operations in Zambia contributed 30 per cent of the overall turnover even though growth was just 4 per cent over last year.
The slow growth in turnover has been attributed to stagnation in the fertilizer business. Whereas the trading business has shown reasonable growth, the contracting business has shrunk. However, the turnover in Mauritius has grown by 12 per cent to Rs501M from Rs447M in 2012 compared to the economy which grew at only 3.2 per cent.
The change in pricing and market strategy started to show positive results as fertilizers losses were reduced from Rs32M in 2012 to Rs14M in 2013. The remedial action taken last year is showing that the turnaround in operation is yielding improved results
The operating loss in 2013 was significantly reduced from Rs9M to Rs5M. The liquidity management of placing excess cash of Rs303M with the holding company has helped contributing Rs20M as interest income compared to Rs19M in 2012. This has contributed in bringing profit before finance costs to Rs30M from Rs31M previously. The profitability was enhanced by reduced losses from our associated company, Rehm Grinaker, bringing our share of loss down to Rs7M from Rs18M in 2012. This boosted the Group profit before tax from continuing operations to Rs21M compared to Rs15M in 2012.
This improvement in profitability has enabled the Board to maintain a dividend of Re1.00 per share. The Share price at 31 December 2013 was lower by 15 per cent (Rs24.00 against Rs28.00 in 2012) whereas the Net Asset Value per share was Rs34, trading at a discount of 29 per cent.
During the year, there has been a change at the helm of the Company. Mr Sébastien Lavoipierre resigned as Managing Director on 12 August 2013. The Board wishes to place on record its appreciation to Sebastien for his dedication and hard work over the last seven years.
Mr Beas Cheekhooree, in additional to his role of Managing Director of Harel Mallac Export Ltd, was appointed General Manager on 16 October 2013. His focus will be on growing the international business.
OUTLOOK We are confident that the fertilizer’s segment of the business will break even following the new pricing and marketing strategy adopted.
ACKNOWLEDGEMENTS I would like to express my special thanks to the staff of MCFI, Beas Cheekhooree and his team for their hard work, dedication and commitment to delivering returns to the shareholders, despite the challenging business environment. I am grateful to my fellow directors for their unflinching support in ensuring that the Board discharges its duties in line with our statutory duties and best practices of good governance. I am also thankful to our shareholders for their ongoing support to the Company’s vision, mission, values and objectives.
Dear Shareholders
Chairman’s Statement
Antoine L HarelChairman
Annual Report 2013 15

“ The MCFI group of companies registered a marginal increase in turnover in 2013 to Rs812M compared to Rs800M in 2012.”
General Manager’s Statement
The Mauritius Chemical and Fertilizer Industry Limited16

General Manager’s Statement
OVERVIEW OF THE GROUP’S PERFORMANCE
The MCFI group of companies registered a marginal increase in turnover in 2013 to Rs 812M compared to Rs 800M in 2012. Gross profit was better than in the previous year, driven by better margins across the Group’s fertilizer business. Improved purchasing strategies ensured a more competitive raw material price and this mitigated the impact of competition both locally and in our export markets.
The current downturn in the construction sector affected both our subsidiary Coolkote and our associate Rehm Grinaker Construction Ltd. These impacted the Group’s profit negatively in 2013 by 19M.
Our fellow subsidiaries also felt the effects of the slow down as their sector of activities struggled to regain meaningful growth. Both Chemco and Bychemex registered lower profits than in 2012.
Recognising the importance of human capital in developing dynamic strategies for the future, the Group initiated a Service Excellence Programme to improve service levels to its customers continuously. During its initial phase, the programme assessed the status of its workforce, felt their motivational pulse, sought their inspiration to develop its CVP (Customer Value Proposition) and in these ways shape its marketing strategy. This is an ongoing initiative that is expected to direct the Group towards a new era of enhanced service levels in all business segments. At the same time it is expected to instil a sense of belonging in all its employees and evoke a feeling of pride that comes from working for the Group.
Employees are very excited by this initiative as it cuts across all businesses and focuses energy on the important components of our businesses – towards our employees, towards our customers who need our assistance to add value to their own businesses, and to improve their bottom line.
In 2014 the Group plans to dedicate more time and attention to the regional and African countries. It hopes to transfer the expertise it has built up across its various activities to seek growth outside the local market place.
OPERATIONS
Fertilizer Business
In 2013, volume of granular fertilizers sold on the local market increased by 2.3 per cent compared to 2012. This was achieved against a shrinking sugar cane sector. Area under sugar cane plantation went down by 4 per cent equivalent to a reduction of 3 per cent in fertilizer usage. MCFI market share grew in real terms notably amongst small and medium planters where the sales action focused on value addition through technical assistance.
Our business of Supply and Apply, which involves supply of fertilizer and field application, dropped by 10.7 per cent from 2012 due to operational problems met by our contractor. This affected our business in 2013. The Company has initiated necessary remedial action to address this matter.
Exports of fertilizer to Africa and Madagascar picked up following a focused marketing strategy. Sales to Africa increased by 67 per cent from 2,000MT to 3,340MT in 2013 while we exported 1,464MT to Madagascar compared to 1,040MT in 2012. This mitigated our shortfall in Reunion Island (4,470MT down to 1,082MT in 2013) where our distributors carried high inventories from the previous year. The market for fertilizer in Africa is undergoing exponential growth as the Continent rolls out major agricultural reforms across various countries simultaneously. The Company wants to be part of this drive and has laid down its marketing action plan to increase penetration in sub-Saharan countries during the coming year. The NPK plant output grew by 13 per cent over 2012. Much emphasis was placed on further improving product quality to match the best international fertilizer standards. There is no substitute and no stronger sales argument than superior product quality. The Company expects to see improvement in 2014 on various actions undertaken during the year.
Furthermore, the Company signed an agreement with MCAF to invest in a pilot project to produce bio-fertilizers. The final technical details were validated in close collaboration with MCAF technical staff. The pilot plant will be housed on the MCFI site and its commissioning is planned in 2nd and 3rd quarter of 2014. This is an exciting project that will enable MCFI Ltd to bring another positive contribution to the local agricultural sector through this eco-friendly means of boosting soil productivity.
The Company did not have any major safety-related incidents to report during the year. There were a few instances where the dust levels inside the NPK plant was higher than expected. Necessary improvements to the equipment were made in 3rd and 4th quarter and major changes will be completed in first quarter of 2014 during the annual shutdown period.
Annual Report 2013 17

General Manager’s Statement
Subsidiaries
MCFI International & Co. Ltd.
The Company is a holder of a category 1 global business licence and is the holding company of MCFI International (Zambia) Ltd. Its main activity is the export of fertilizer to the Indian Ocean region and African markets.
The Company registered a growth of 46 per cent in turnover, from Rs70.6M to Rs103.4M with a profit after tax of Rs13.8M. With the marketing initiatives planned for next year, the Company is expected to further improve its performance.
MCFI International (Zambia) Ltd.
The Company is situated in Lusaka, Zambia, and is involved in the trade of industrial chemicals. It operates two warehouses – in Lusaka and in the town of Ndola near the copper belt. The Company met and delivered on its budget in 2013. It registered an increase in turnover of 5 per cent, while profit before tax increased by 3.3 per cent over 2012 to Rs18.5M.
The Zambian economy maintained its growth around 7 per cent in 2013. It successfully rebased its currency (Kwacha) from 5500 to 5.5 to the US Dollar. World wide copper prices did not perform well in the year and this impacted growth.
The Company will continue its diversification plan into new business sectors as well as continue to promote fertilizer sales during the course of 2014.
Coolkote Enterprises Ltd.
Coolkote Enterprises Ltd specialises in the application of waterproofing and coatings solutions for buildings. The performance of Coolkote Enterprises is determined by the state of the construction sector in Mauritius where it operates. Following the continued downturn in this sector, the Company ended the year with a drop in turnover of Rs4.9M down to Rs38M in 2013 followed by a loss of (Rs8.4M) against a profit of Rs3.5M in the previous year. The sector is expected to have bottomed out in 2013. The Company has laid out measures to mitigate the difficult outlook in 2014.
Associates
Rehm-Grinaker Construction Co. Ltd.
Although the current downturn in the construction industry is still being felt, there have been encouraging signs of improvement. For the financial year ended June 2013, the Company posted a loss of RS123.5M whereas for the 12 months ended 31 December 2013, the Company posted a profit of Rs22.1M on a turnover of Rs2.2 billion (Calendar 2012-Loss Rs124.5 million and turnover Rs1.79 billion). During the year, further capital amounting to Rs 60M was invested in the Company. Our share of Loss for the 12 months ended 31 December 2013 stands at Rs11.2M.
Rehm-Grinaker Properties Co. Ltd.
The Company realised a profit of Rs16.2M for the 12 months ending 31 December 2013 (against a loss of Rs6.0M a in 2012). Our share of profit for the corresponding period was Rs3.5M.
Compostage du Sud
The Company’s plans to start the pilot project in 2013 did not materialise. The design and execution of the pilot plant equipment met with considerable delays. Part of the equipment was manufactured in France while the remaining was being developed in South Africa. Components produced in France were ready in December 2013 and expected to be shipped in first quarter of 2014 while the components from South Africa are still at final design stage and are not expected to be ready before 2nd quarter of 2014.
The Group is currently reviewing its decision to be part of the project due to the considerable delays in procuring the equipment.
The Mauritius Chemical and Fertilizer Industry Limited18

Fellow Subsidiaries
Bychemex Ltd
The Company specialises in the distribution of specialty chemicals and auxiliaries to the textile sector in Mauritius. The performance of the company continued to be subdued as a result of the situation in the textile sector. Turnover was down by 6.7 per cent while profit before tax was down from Rs1.9M in 2012 to Rs1.6M in 2013. The outlook for the coming year is better and a slight upward trend has been noted during the last quarter of 2013. Madagascar’s textile sector is also expected to regain composure after the elections scheduled early next year. The technical sales staffs have started undertaking once again marketing trips to customers in Madagascar during the last quarter of 2013. Orders are expected in the first quarter of 2014.
Chemco Limited
Turnover was down by 5.5 per cent from 2012 while profits before tax dropped from Rs13.4M down to Rs9.4M in 2013. The drop in usage of caustic soda in some sectors in Mauritius, coupled with a fiercely competitive tyre business segment, accounted for the drop in turnover of the Company. There was little growth in the demand for industrial chemicals in Madagascar. The situation is expected to improve next year especially after the elections. With the much anticipated positive outlook in the textile sector, the Company expects to regain market share next year.
Laboratory services division performed well and this activity contributed positively to the Company’s bottom line in the course of the year. A wider range of services is being promoted. The outlook for next year is good. More qualified staff will be recruited to exploit this business sector.
Chemco’s division of Total Water Management Services registered encouraging results in 2013. The division met its objectives. Desalination projects and complete water management services are being finalised with the hospitality industry. This division is set to bring valuable and positive contributions to the Company’s bottom line next year.
ACKNOWLEDGEMENTS
I would like to thank the Board for having placed its trust and given me the opportunity to manage the operations of the MCFI Group. I am also grateful to the employees of the Group who have welcomed me in their midst.
We have had a difficult year in 2013. Most of our businesses have suffered from the economic downturn of recent years. The future remains bright. It requires us to develop dynamic strategies, re-invent ourselves, develop durable partnerships with our customers, and understand their needs and demands.
I intend to bring my long experience working in a very competitive textile sector, have a hands-on approach and stay in close communion with our customers. As a team, we intend to keep ahead of competition, seek growth through innovation and add value to both our customers’ businesses and our shareholders’ interests.
General Manager’s Statement
Beas CheekhooreeGeneral Manager
Annual Report 2013 19

“Trusted Employees” means that we trust our employees to meet your everyday needs with their dedication and expertise by living our values with ‘P.R.I.D.E.’
Trusted Employees134

Georges Flore

Corporate Governance Report
The Mauritius Chemical and Fertilizer Industry Limited is committed to the highest standard of business integrity, transparency and professionalism in all its activities to ensure that the Company and the Group are managed ethically and responsibly to enhance business value for all stakeholders.
THE BOARD OF DIRECTORS
The Board endeavours to exercise leadership, entrepreneurship, integrity and judgement in directing the Company, so as to achieve continuing prosperity for the organization whilst ensuring both performance and compliance.
The Board also ensures that the activities of the Company comply with all legal and regulatory requirements as well as its constitution from which the Board derives its authority to act.
The Board inter alia oversees the development and implementation of the Company’s corporate strategy and reviews performance objectives. It ensures the succession plans for key individuals and effective communication with the Company’s stakeholders, promotes the Company’s Code of Ethics and supervises financial and capital management. As such, it reviews and approves quarterly and annual financial reports, monitors financial results and approves major capital expenditure, major acquisitions, divestitures and material commitments. The Board also oversees compliance and risk management.
At 31 December 2013, the Board of Directors consisted of nine members, of whom three were independent directors. Mr. Sébastien Lavoipierre resigned as Managing Director on 12 August 2013 and Mr. Beas Cheekhooree was appointed General Manager of the Company in October 2013. The Board is of the view that having the General Manager and the Finance Manager attending Board meetings satisfies the need for executive presence on the Board as expressed in the Code of Corporate Governance. Non-executive Directors have free access to members of the senior management team. All Directors have access to the Company Secretary. The elected Directors hold office for one year but are eligible for re-appointment. Directors are elected or re-elected by separate resolutions. The Board has three committees (as described below), which meet regularly under the terms of reference set by the Board. The Board entrusts the day-to-day management of the Company to its Managing Director who ensures the smooth running of the organisation. The composition of the Board of Directors and other directorships held by the Directors in listed companies are given on pages 8 to 9.
BOARD MEETINGS
The Board meets regularly during the year and for the period under review the Board met six times. The Board meetings are conducted in accordance with the Company’s constitution and the Companies Act.
Board meetings are organised in such a way that Directors receive all the information important to their understanding of the business to be conducted at the Board meeting so that they can participate fully in the decision-making process.
At these Board meetings, the Company’s and Group’s budget, performance and forecast are reviewed and approved, reports from the General Manager and Committees’ Chairpersons are received, strategic issues discussed and statutory matters approved. The Board may invite management or external consultants to attend Board meetings whenever required.
BOARD COMMITTEES
Corporate Governance Committee
The Corporate Governance Committee consists of Mr Antoine L Harel (Chairman) and of Messrs Allain Doger de Spéville and Vincent Labat.
The terms of reference of the Committee include the key areas that are the remit of a nomination and remuneration committee as contained in the formal terms of reference approved by the Board of Directors. Its main responsibilities include establishing a formal and transparent procedure for developing policy on executive and senior management remuneration, as well as determining specific remuneration packages for the Executive Directors of the Company. The Committee fixes the fees of the Company’s non-executive and independent non-executive Directors. It oversees the process regarding recommendation of potential candidates, ensures that proposed Directors meet the required criteria and standards, and are not disqualified from being Directors. The Committee further monitors the balance and effectiveness of the Board. The Committee makes recommendations to the Board on the nomination and remuneration of the Company’s representatives on the Board of subsidiary companies. The Corporate Governance Committee makes recommendations for the election of Directors at the next Annual Meeting.
During the year under review the Committee met three times.
The Mauritius Chemical and Fertilizer Industry Limited22

Corporate Governance Report
ATTENDANCE AT BOARD AND COMMITTEE MEETINGS HELD IN 2013
Board of Directors
Corporate Governance Committee
Audit Committee
Strategic Committee
Antoine L Harel 6/6 3/3 - 2/2Christopher Boland 5/6 - 2/2Jean Yves Corson 4/6 - 2/4 -Allain Doger de Spéville 5/6 2/3 4/4 -Charles Harel 6/6 - - 1/2Guy Harel 3/4 - - -Vincent Labat 6/6 3/3 4/4 -Sébastien Lavoipierre 3/3 - - -Harold Ng Kwing King 5/6 - - -Rajendrasingh Rathacharen 1/2 - - -Michel Rivalland G.O.S.K. 6/6 - 3/4 2/2
Audit and Risk Committee
The Audit and Risk Committee is chaired by Mr Vincent Labat and consists of three other members, namely Messrs Allain Doger de Spéville, Michel Rivalland G.O.S.K and Jean Yves Corson. The Committee fulfilled its responsibilities for the year under review, in compliance with its formal terms of reference approved by the Board of Directors. The roles and responsibilities of the Audit Committee are to assist the Board in discharging its duties relating to the safeguarding of assets, the operation of adequate systems and control processes, and the preparation of accurate financial reports and statements, in compliance with all applicable legal requirements and accounting standards. The Committee also caters for issues relating to risk management and provides a forum for discussing business risks and control issues and for formulating relevant recommendations for consideration by the Board. The Board is satisfied that the Audit Committee has the required skills, knowledge and financial experience to discharge its duties effectively. During the period under review the Committee met five times and fulfilled its responsibilities in compliance with its terms of reference which were formally approved by the Board.
Strategic Committee
The Strategic Committee is chaired by Mr Antoine L Harel and at 31 December 2013, its other members were Messrs Michel Rivalland G.O.S.K., Christopher Boland and Charles Harel. The Committee examines investment prospects and other strategic issues and makes its recommendations to the Board. During the period under review the Committee met six times and performed its duties as per its terms of reference.
RISK MANAGEMENT
The Board regularly addresses and evaluates physical, human resources, business, financial, reputational, regulatory and compliance risks. During the course of 2013, the internal audit function examined and evaluated the adequacy and effectiveness of control systems in place within the Company and its subsidiaries, focusing on sales and account receivables, procurement and accounts payable, fixed assets, treasury management as well as stock management. Reports were subsequently produced and submitted to the Audit Committee which reviewed them and, when applicable, made relevant recommendations to the Board.
Since 2010, a risk management framework for the Company was adopted. This was followed by implementation of a continuous and dynamic system of risk assessment through compliance checks and discussions with the management for enhanced risk mitigation strategies. The following are some risks that were identified and control procedures that were implemented:
Physical and environmental risks
- Force majeure (riots, cyclones and other natural calamities): Cyclone and fire procedures were adopted, insurance cover was subscribed to, and business continuity and disaster recovery plans were identified.
- On site accidents relating to both employees and the general public: Health and safety as well as security procedures were adopted, the services of an occupational physician consultant retained, and a full-time health and safety officer employed.
- Stock losses, fraud and theft: Stock control, supervision and control procedures were set up.- Off site accidents by lorries carrying liquid chemicals or fertilizers: Drivers’ awareness on road safety measures was constantly
maintained, regular inspection of vehicles took place, and public liability insurance cover subscribed to.
Annual Report 2013 23

Corporate Governance Report
Human resources risks
- Loss of key personnel: Retention policies have been adopted as well as formal performance assessment and reward system implemented.- Reputation, image and business conduct: A Code of Ethics has been implemented and adequate reporting procedures have been set up.- High risk jobs: Regular health surveillance is performed on employees in high risk jobs and adequate medical insurance cover subscribed to.
Technology risks
- IT crash/breakdown: Back up procedures as well as adequate restriction procedures have been established.- Information theft: Users’ policies and control procedures have been introduced.
Internal Control
Internal control is a process designed to provide reasonable assurance regarding the achievement of organisational objectives with respect to:
- Effectiveness and efficiency of operations;- Safeguarding of assets and data of the organisation;- Reliability of financial and other reporting;- Prevention of fraud and irregularities;- Acceptance and management of risk;- Conformity with the codes of practice and ethics adopted by the organisation;- Compliance with applicable laws and regulations; and- Supporting business sustainability under normal as well as adverse operating conditions.
The Board has set appropriate policies to ensure that the above-mentioned control objectives are achieved.
Three reviews were performed by the Internal Audit during the year covering all significant areas of the Company’s internal control.
Internal Audit
Internal audit is an objective assurance function reporting to the Board of Directors and management. Internal audit provides assurance as to the adequacy and effectiveness of the risk management and internal control framework of an organisation. Internal audit assists the Board and management to maintain and improve the process by which risks are identified and managed and helps the Board discharge its responsibilities to maintain and strengthen the internal control framework. Internal Audit covers all significant areas of the Company’s internal control.
The Group Internal Auditor has examined the current control systems to check their suitability and effectiveness, and to ensure that they are being adhered to. The Group Internal Auditor has unrestricted access to the Company’s records, management and employees. The Internal Auditing department conducts its assignments based on a yearly plan, which is validated by the Audit Committee. Systems reviewed in 2013 at Company’s and subsidiaries levels include procurement and creditors cycles, stock, sales and debtors’ cycles, treasury and fixed assets management control and work in progress management and cover all significant areas of the Company’s internal control. In addition, an overall systems review of the Company’s subsidiary in Zambia was also carried out.
During the year under review the Harel Mallac Group Internal Auditor regularly submitted to the Audit Committee audit reports relating to the Company and its subsidiaries for discussion and follow-up of the implementation of recommended actions.
COMPOSITION OF SUBSIDIARY COMPANIES’ BOARDS
The composition of the Boards of subsidiary companies is given on page 29.
GROUP STRUCTURE
The Directors recognise that the parent entity is Harel Mallac & Co. Ltd. and that the ultimate parent entity is Société Pronema. The Directors common to the aforesaid entities are Mr Antoine L Harel who is ‘co-gérant’ of Société Pronema and director of Harel Mallac & Co. Ltd. Messrs Charles Harel and Michel Rivalland G.O.S.K. sit on the Board of Directors of Harel Mallac & Co. Ltd.
SHAREHOLDERS HOLDING MORE THAN 5 PER CENT OF THE COMPANY
Shareholders directly or indirectly interested in 5 per cent or more of the ordinary share capital of the Company are detailed on page 31.
The Mauritius Chemical and Fertilizer Industry Limited24

YearDividend Paid (Rs)
Dividend Cover (Times)
Dividend Yield (%)
2009 0.8 4.1 3.22010 1.0 3.8 2.62011 1.0 2.2 2.32012 1.0 0.8 3.52013 1.0 0.6 4.2
Corporate Governance Report
DAILY SHARE PRICE FROM JANUARY 2011 TO FEBRUARY 2014
DIRECTORS’ INTEREST IN SHARES
The direct and indirect interests of Directors in the ordinary shares of the Company and its subsidiaries are to be found on page 30.
DIRECTORS’ DEALING IN SHARES OF THE COMPANY
With regard to Directors’ dealings in the shares of the Company, the Directors confirm that they have followed the principles of the Model Code on Securities Transactions by Directors as detailed in Appendix 6 of the Mauritius Stock Exchange Listing Rules. During the year under review none of the Directors bought or sold any of the Company’s shares.
RELATED PARTY TRANSACTIONS
Related party transactions are detailed on pages 85 to 87.
SENIOR MANAGEMENT PROFILE
The profile of the senior management team is given on page 11.
DIVIDEND POLICY
Dividends are distributed after considering the Company’s performance and profitability, gearing, investment needs, capital expenditure requirements and growth opportunities.
MC
FI
Sh
are
Pri
ce (
Rs)
Months
SE
MD
EX
Jul-1
1
Jul-1
2
Jul-1
3
Jan-
11
Feb-
11
Mar
-11
Apr
-11
May
-11
Jun-
11
Aug
-11
Sep-
11
Oct
-11
Nov
-11
Dec
-11
Jan-
12
Feb-
12
Mar
-12
Apr
-12
May
-12
Jun-
12
Aug
-12
Sep-
12
Oct
-12
Nov
-12
Dec
-12
Jan-
13
Feb-
13
Jan-
14
Feb-
14
Mar
-13
Apr
-13
May
-13
Jun-
13
Aug
-13
Sep-
13
Oct
-13
Nov
-13
Dec
-13
20
25
30
35
40
45
50
1,500
1,600
1,700
1,800
1,900
2,000
2,100
2,200MCFI Share Price v/s Semdex from January 2011 to February 2014
Annual Report 2013 25

COMPANY’S CONSTITUTION
The constitution of the Company does not provide any ownership restrictions or pre-emption rights. It is in agreement with the Companies Act 2001 and the listing rules of the Stock Exchange of Mauritius and does not contain any material clause that needs to be disclosed.
SHAREHOLDERS AGREEMENT AFFECTING THE GOVERNANCE OF THE COMPANY BY THE BOARD
The Company is not aware of any such agreement during the period under review.
THIRD PARTY MANAGEMENT AGREEMENT
The Company has a management contract with Harel Mallac & Co. Ltd. for management support services including but not limited to financial, accounting, legal, internal audit and human resources fields. The agreement is renewable on a yearly basis.
DIRECTORS’ FEES
The directors, to the execption of two non-executive directors are paid directors’ fees and fees in relation to the Audit, Corporate Governance and Strategic Committees, and sittings on Boards of subsidiary companies.
DIRECTORS’ REMUNERATION
Directors’ remuneration is given on page 30. It has not been disclosed on an individual basis due to commercial sensitivity of the information.
REMUNERATION POLICY
The Company’s remuneration policy recommends that the Company provides competitive rewards for its senior executives and other senior management staff, taking into account the Company’s performance and external market data from independent sources, in particular, where available salary levels for similar positions in comparable companies.
The remuneration package consists of base salary, fringe benefits and an annual individual performance bonus. The remuneration package is determined by the Board of Directors upon recommendations of the Corporate Governance Committee.
Directors and members of Board Committees receive additional fees for their roles on such Committees. In addition to previous Accelerated Performance Schemes (APS), a further APS for a selected group of managers was introduced in 2011 for the period 2011 to 2013 to achieve significantly higher results.
EMPLOYEE SHARE OPTION PLAN
No employee share option plan is available within the Group.
CODE OF ETHICS
The Board has adopted a Code of Ethics reflecting the Group’s values and corporate culture. The employees are expected to abide by the set Code.
Corporate Governance Report
Size of Shareholding Number of Shareholders Number of Shares Owned % Holding
1 - 500 914 167,361 0.77501 - 1,000 150 117,812 0.541,001 - 5,000 318 767,437 3.495,001 - 10,000 59 413,885 1.8810,001 - 50,000 54 1,067,966 4.8550,001 - 100,000 12 852,585 3.87100,001 - 250,000 6 905,435 4.11250,001 - 500,000 5 1,664,573 7.56Over 500,000 2 16,049,364 72.93Total 1,520 22,006,418 100.00
PROFILE OF COMPANY’S SHAREHOLDERS AS AT 26 MARCH 2014
The Mauritius Chemical and Fertilizer Industry Limited26

Category of Shareholders Number of Shareholders Number of Shares Owned % Holding
Individual 1,394 2,307,317 10.49Insurance and assurance companies 5 1,201,826 5.46Pension and provident funds 6 354,951 1.61Investment and trust companies 4 134,877 0.61Other corporate bodies 111 18,007,447 81.83Total 1,520 22,006,418 100.00
SUMMARY BY SHAREHOLDING CATEGORY AS AT 26 MARCH 2014
Corporate Governance Report
SHAREHOLDER INFORMATION
Forthcoming Annual Meeting
A proxy form is enclosed for those shareholders unable to attend. Shareholders are requested to bring their ID cards or passports to the meeting, as these are required for registration.
Schedule of Events
Publication of condensed audited results for previous year March 2014Annual Meeting May / June 2014Publication of condensed results for 1st quarter May 2014Publication of condensed results for 2nd quarter August 2014Publication of condensed results for 3rd quarter November 2014Dividend declaration & payment December 2014 / January 2015
SHAREHOLDERS’ PRACTICAL GUIDE
Issues Action
Change of address Contact the Company’s secretariatIf shares are deposited with CDS Contact personal broker Change of name Contact the Company’s secretariatAcquisition or disposal of shares Contact personal broker Share transfers Contact the Company’s secretariatLost share certificate Contact the Company’s secretariatDirect dividend credit Forward the relevant form to the Company’s secretariat
SOCIAL, SAFETY, HEALTH AND ENVIRONMENT
The Company complies with the Occupational Safety and Health Act 2005 and other legislative and regulatory frameworks. It is committed to sustainable development and ensures that its operations are conducted in a way that is respectful of the environment and of the society at large.
The Company ensures that its recruitment and promotion policies are fair and that procedures adopted are both transparent and merit-based. We also promote conscientious business practices whereby we ensure that there is honesty and transparency in all our practices, and the provision of a healthy and safe environment for all employees.
Annual Report 2013 27

Corporate Governance Report
CORPORATE SOCIAL RESPONSIBILITY
Since its creation in November 2009, the philosophy and priority of ‘Fondation Harel Mallac’ is to help improving the lives of underprivileged and disabled children through educational projects.
In 2013, Fondation Harel Mallac was allocated a CSR fund whereby 50 per cent of the fund was spent on priority areas introduced by the government in January 2011. These were allocated to the Adolescent Non Formal Education Network (ANFEN) whose objective is to develop a non-formal pedagogy to sustain the inclusion of vulnerable out-of-school adolescents. Part of the amount was given to NEF for remedial classes at L’Agrément & La Valette.
Several other independent projects which address the education challenges of vulnerable children also benefited from the CSR Fund. The NGOs running these projects were: APDA, APEIM, Association d’Alphabetisation de Fatima, SOS Children’s Village Bambous. The fund also sponsored the project ‘Development of performing arts’ organised by ACSEA for underprivileged children of Ste Catherine and Almas, as well as projects of Atelier Mo’zar, Institut Cardinal Jean Margéot, Mauritian Wildlife Foundation and in line with our focus on education, the fund sponsored the training on ‘Sustainable use of our lagoons and Oceans’ organised by Oceanyka.
In the course of 2013, Fondation Harel Mallac has supported many Not-For-Profit, Non-Governmental Organisations, whose actions were aligned to the foundation’s philosophy. The aim, close to the heart of employees and stakeholders of Harel Mallac Group, remains above all a priority and a major step in the building of a better future for the children and citizens of Mauritius.
Donations for the year under review are detailed on page 31.
PROMOTING A BETTER ENVIRONMENT
We strive to improve the environmental impact of our activities by encouraging use of resources to ensure quality of life for future generations. The Group has taken significant measures to ensure the use of more environment-friendly products and services, as well as the reduction of electricity and other resources in the conduct of its business.
The Mauritius Chemical and Fertilizer Industry Limited28

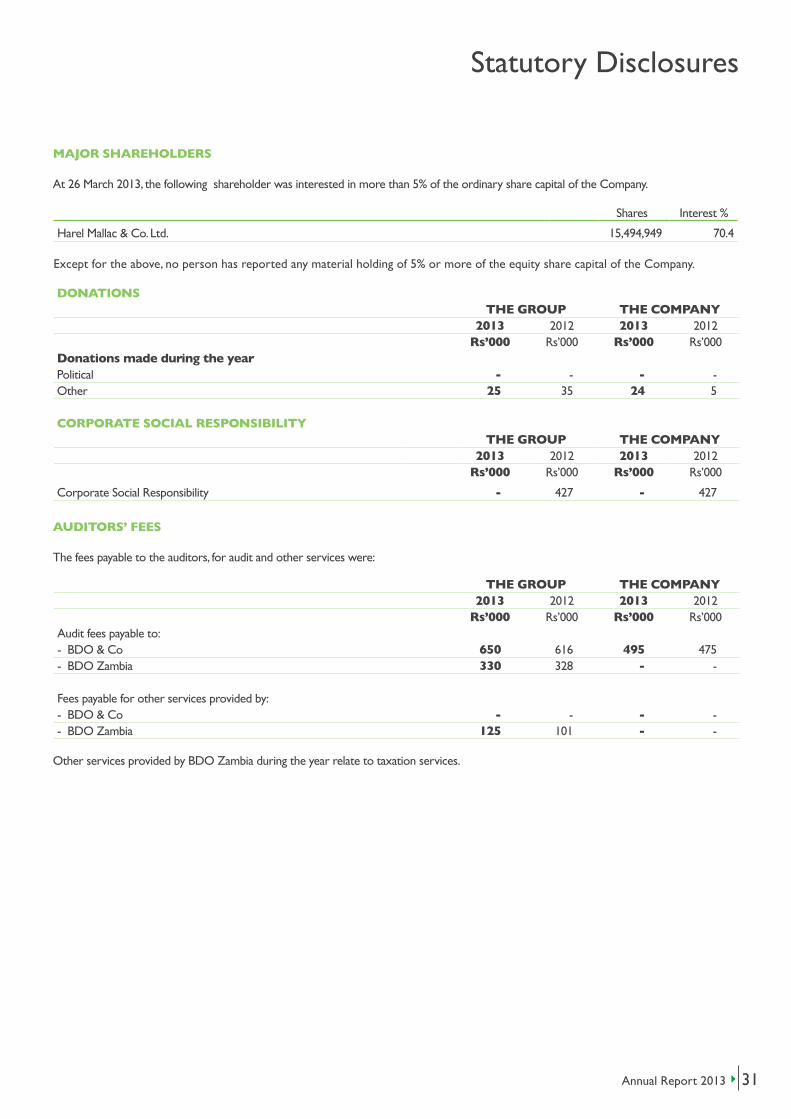
Statutory Disclosures
The Directors have the pleasure in submitting the Annual Report of The Mauritius Chemical and Fertilizer Industry Limited and its subsidiaries together with the audited financial statements for the year ended 31 December 2013.
PRINCIPAL ACTIVITIES
The principal activities of the Group and the Company during the year have remained unchanged.
The main activities of the Company and its subsidiaries are as follows:
DIRECTORS
The Directors of the Company and its subsidiaries as at 31 December 2013 were as follows:
The Company Activities
The Mauritius Chemical and Fertilizer Industry Limited (MCFI) Manufacturing of NPK complex, blending and trading of fertilizers
Subsidiaries
MCFI (Freeport) Ltd Trading as a Freeport companyMCFI International (Zambia) Ltd Trading of chemicals and general goods in ZambiaMCFI International & Co. Ltd - GBL 1 Trading companyCoolkote Enterprises Ltd Contracting of waterproofing works
DIRECTORS SERVICE CONTRACTS No Director of the Company and its subsidiaries has any service contract that needs to be disclosed under section 221(2) of the Companies Act 2001.
DIRECTORSMCFI LTD
MCFI (FREEPORT)
LTD
MCFI INTERNATIONAL
& CO LTD
MCFI INTERNATIONAL
ZAMBIA
COOLKOTE ENTERPRISES
LTD
Christopher BolandJean Yves CorsonAllain Doger de SpévilleAlfred L FrancisCharles HarelAntoine L HarelGuy HarelVincent LabatSébastien LavoipierreHarold Ng Kwing KingRajendrasingh RathacharenMichel Rivalland G.O.S.K.
Binhoy SahayAshok Varjangbhai
- Director at 31.12.2013 - Resigned during the year ended 31.12.2013
Annual Report 2013 29

Statutory Disclosures
DIRECTORS’ AND OTHER OFFICERS’ INTERESTS IN SHARES
The Directors’ and Other Officers’ interests in the Company’s shares at 31 December 2013 were:
Company Subsidiaries2013 2012 2013 2012
Rs’000 Rs’000 Rs’000 Rs’000The CompanyExecutive Director- Full-time - - - - - Part-time - - - - Non-executive Directors 2,441 2,438 - -
2,441 2,438 - -
Subsidiary companies(excluding the directors who are also directors of the Company 2 Executive Directors (2012: 2)- Full-time 3,858 6,056 - Part-time - - Non-executive Directors 200 90
The CompanyDirect Indirect
Directors Interest Interest
Antoine Harel - 819,282Harold Ng Kwing King 3,750 - Charles Harel - 800,251Allain Doger de Spéville 20,000 -
DIRECTORS’ REMUNERATION AND BENEFITS
Remuneration and benefits received, or due and receivable from the Company and its subsidiaries were:
The other directors have no shares either directly or indirectly in the Company.
None of the directors have a direct or indirect shareholding in the equity capital of the subsidiary companies.
CONTRACTS OF SIGNIFICANCE
There was no contract of significance to which the Company, or one of its subsidiaries has been a party and in which a director of the Company was materially interested be it directly or indirectly.
The CompanyDirect Indirect
Officers Interest Interest
Beas CheekhooreeHarold Lai Chuck Choo - - Romesh Raja Rai 150 - Ashok Varjangbhay - -
The Mauritius Chemical and Fertilizer Industry Limited30
Statutory Disclosures
MAJOR SHAREHOLDERS
At 26 March 2013, the following shareholder was interested in more than 5% of the ordinary share capital of the Company.
AUDITORS’ FEES
The fees payable to the auditors, for audit and other services were:
Other services provided by BDO Zambia during the year relate to taxation services.
Shares Interest %
Harel Mallac & Co. Ltd. 15,494,949 70.4
Except for the above, no person has reported any material holding of 5% or more of the equity share capital of the Company.
DONATIONSTHE GROUP THE COMPANY
2013 2012 2013 2012Rs’000 Rs’000 Rs’000 Rs’000
Donations made during the yearPolitical - - - - Other 25 35 24 5
CORPORATE SOCIAL RESPONSIBILITYTHE GROUP THE COMPANY
2013 2012 2013 2012Rs’000 Rs’000 Rs’000 Rs’000
Corporate Social Responsibility - 427 - 427
THE GROUP THE COMPANY2013 2012 2013 2012
Rs’000 Rs’000 Rs’000 Rs’000Audit fees payable to:- BDO & Co 650 616 495 475 - BDO Zambia 330 328 - -
Fees payable for other services provided by:- BDO & Co - - - - - BDO Zambia 125 101 - -
Annual Report 2013 31

Statement of Directors’ Responsibilities
Directors acknowledge their responsibilities for:
(i) adequate accounting records and maintenance of effective internal control systems;(ii) the preparation of financial statements which fairly present the state of affairs of the Company as at the end of the
financial year and the results of its operations and cash flows for that period and which comply with International Financial Reporting Standards (IFRS);
(iii) the selection of appropriate accounting policies supported by reasonable and prudent judgements.
The External Auditors are responsible for reporting on whether the Company’s financial statements are fairly presented.
The Directors report that:
(i) adequate accounting records and an effective system of internal controls and risk management have been maintained;(ii) appropriate accounting policies supported by reasonable and prudent judgements and estimates have been used
consistently;(iii) applicable accounting standards have been adhered to. Any departure in the interest in fair presentation has been
disclosed, explained and quantified.(iv) The Code of Corporate Governance has been adhered to. Reasons have been provided where there has not been
compliance.
Approved by the Board of Directors on 26 March 2014 and signed on its behalf by:
Vincent LabatDirector
Antoine L HarelChairman
The Mauritius Chemical and Fertilizer Industry Limited32

Certificate by Secretary
We certify that, to the best of our knowledge and belief, the Company has filed with the Registrar of Companies all such returns as are required of the Company under the Companies Act 2001.
For HM Secretaries Ltd.Secretary
26 March 2014
Annual Report 2013 33


2013 % 2012 %Rs’000 Rs’000
Turnover 812,258 800,951Paid to supplier for materials & services 733,266 722,763Value Added 78,992 78,188
Investment and other income 36,519 47,939Total wealth created 115,511 100 126,127 100
Distributed as follows:
Employees Remuneration & Service benefits 74,561 65 81,357 65
Providers of capitalDividends to shareholders 22,006 22,006Interest paid on borrowings 1,686 1,713
23,692 20 23,719 19Government taxes on earningsTaxation 9,242 8 7,247 5
Retained in group to ensure future growthDepreciation 17,958 17,591Retained surplus (9,942) (3,787)
8,016 7 13,804 11Total wealth distributed & retained 115,511 100 126,127 100
Value Added Statement
65%
Employees Remuneration& Service Benefits
Providers of capital
Government taxes on earnings
Retained in group to ensurefuture growth
20%
8%
7%
Annual Report 2013 35

This report is made solely to the members of The Mauritius Chemical and Fertilizer Industry Limited (the “Company”), as a body, in accordance with Section 205 of the Companies Act 2001. Our audit work has been undertaken so that we might state to the Company’s members those matters we are required to state to them in an auditors’ report and for no other purpose. To the fullest extent permitted by law, we do not accept or assume responsibility to anyone other than the Company and the Company’s members as a body, for our audit work, for this report, or for the opinions we have formed.
Report on the Financial Statements
We have audited the group financial statements of The Mauritius Chemical and Fertilizer Industry Limited and its subsidiaries (the “Group”) and the company’s separate financial statements on pages 38 to 90 which comprise the statements of financial position at 31 December 2013 and the statements of profit or loss, statements of profit or loss and other comprehensive income, statements of changes in equity and statements of cash flows for the year then ended, and a summary of significant accounting policies and other explanatory notes.
Directors’ Responsibility for the Financial Statements
The directors are responsible for the preparation and fair presentation of these financial statements in accordance with International Financial Reporting Standards and in compliance with the requirements of the Companies Act 2001, and for such internal control as the directors determine is necessary to enable the preparation of the financial statements that are free from material misstatement, whether due to fraud or error.
Auditors’ Responsibility
Our responsibility is to express an opinion on these financial statements based on our audit. We conducted our audit in accordance with International Standards on Auditing. Those Standards require that we comply with ethical requirements and plan and perform the audit to obtain reasonable assurance whether the financial statements are free from material misstatement.
An audit involves performing procedures to obtain audit evidence about the amounts and disclosures in the financial statements. The procedures selected depend on the auditors’ judgement, including the assessment of the risks of material misstatement of the financial statements, whether due to fraud or error. In making those risk assessments, the auditors consider internal control relevant to the company’s preparation and fair presentation of the financial statements in order to design audit procedures that are appropriate in the circumstances, but not for the purpose of expressing an opinion on the effectiveness of the company’s internal control. An audit also includes evaluating the appropriateness of accounting policies used and the reasonableness of accounting estimates made by the directors, as well as evaluating the overall presentation of the financial statements.
We believe that the audit evidence we have obtained is sufficient and appropriate to provide a basis for our audit opinion.
Opinion
In our opinion, the financial statements on pages 38 to 90 give a true and fair view of the financial position of the Group and of the Company at 31 December 2013, and their financial performance and their cash flows for the year then ended in accordance with International Financial Reporting Standards and comply with the Companies Act 2001.
Report on Other Legal and Regulatory Requirements
Companies Act 2001
We have no relationship with, or interests in, the Company or any of its subsidiaries, other than in our capacity as auditors, business advisers and dealings in the ordinary course of business.
We have obtained all information and explanations we have required.
In our opinion, proper accounting records have been kept by the Company as far as it appears from our examination of those records.
Financial Reporting Act 2004
The Directors are responsible for preparing the corporate governance report. Our responsibility is to report the extent of compliance with the Code of Corporate Governance as disclosed in the annual report and on whether the disclosure is consistent with the reuirements of the Code.
In our opinion, the disclosure in the annual report is consistent with the requirements of the Code.
BDO & CO Rookaya Ghanty, FCCAChartered Accountants Licensed by FRC
Port Louis, Mauritius.
26 March 2014
Independent Auditors’ Report to the Members
The Mauritius Chemical and Fertilizer Industry Limited36

Annual Report 2013 37
Statements of Financial Position
Statements of Profit or Loss
Statements of Profit or Loss and Other Comprehensive Income
Statements of Changes in Equity
Statements of Cash Flows
Notes to the Financial Statements
38
39
40
41
43
44
Financial Statements

The Mauritius Chemical and Fertilizer Industry Limited38
THE GROUP THE COMPANY
2012
As at 1 January
2012 2012
As at 1 January
2012Notes 2013 Restated Restated 2013 Restated Restated
Rs’000 Rs’000 Rs’000 Rs’000 Rs’000 Rs’000ASSETS Non-current assetsProperty, plant and equipment 5 132,460 145,069 144,596 118,311 130,068 131,312 Intangible assets 6 115 115 115 - - - Investments in subsidiary companies 7 - - - 14,268 14,268 14,268 Investments in associates 8 12,877 7,698 37,777 38,174 25,268 22,301 Investments in financial assets 9 16,120 17,319 24,341 16,120 17,319 24,341 Non-current receivables 10 304,026 - - 304,026 - -
465,598 170,201 206,829 490,899 186,923 192,222
Current assetsInventories 11 199,916 233,471 151,300 135,263 166,665 118,463 Trade and other receivables 12 271,910 316,989 266,649 224,874 294,987 207,866 Short term investments 13 - 191,970 243,000 - 191,970 243,000 Cash and cash equivalents 30(b) 56,819 16,494 26,608 38,464 1,026 18,422
528,645 758,924 687,557 398,601 654,648 587,751
TOTAL ASSETS 994,243 929,125 894,386 889,500 841,571 779,973
EQUITY AND LIABILITIESCapital and reservesShare capital 14 220,064 220,064 220,064 220,064 220,064 220,064 Revaluation and other reserves 40,145 45,397 48,809 31,333 33,041 40,013 Retained earnings 498,514 508,456 512,243 436,845 442,171 424,217 Owners’ interest 758,723 773,917 781,116 688,242 695,276 684,294
Non-current liabilitiesBorrowings 16 2,370 1,906 345 - - - Deferred tax liabilities 17 14,005 14,456 14,612 11,705 11,043 10,885 Retirement benefit obligations 18 8,158 4,696 4,019 6,465 3,561 3,065
24,533 21,058 18,976 18,170 14,604 13,950
Current liabilitiesTrade and other payables 19 143,541 57,952 64,880 128,077 65,886 59,723 Current tax liabilities 20(a) 6,518 9,794 7,076 - - - Borrowings 16 38,922 44,398 332 33,005 43,799 - Dividends 21 22,006 22,006 22,006 22,006 22,006 22,006
210,987 134,150 94,294 183,088 131,691 81,729
TOTAL LIABILITIES 235,520 155,208 113,270 201,258 146,295 95,679
TOTAL EQUITY & LIABILITIES 994,243 929,125 894,386 889,500 841,571 779,973
These financial statements have been approved for issue by the Board of Directors on 26 March 2014.
The notes on pages 44 to 90 form an integral part of these financial statements.Auditors’ report on page 36.
Statements of Financial Position At 31 December 2013
Vincent LabatDirector
Antoine L HarelChairman

Annual Report 2013 39
THE GROUP THE COMPANYNotes 2013 2012 2013 2012
Rs’000 Rs’000 Rs’000 Rs’000Continuing operationsRevenue 22 812,258 800,951 540,204 482,592 Cost of sales 25 (658,883) (658,546) (458,165) (414,691)Gross profit 153,375 142,405 82,039 67,901 Other operating income 23 8,431 11,757 11,276 14,189 Operating expenses 25 (166,902) (163,165) (118,721) (118,896)Operating loss 24 (5,096) (9,003) (25,406) (36,806)Other income 26 34,725 40,042 44,218 73,286
29,629 31,039 18,812 36,480 Net finance (costs)/income 27 (596) 2,008 (347) 3,650 Share of loss of associates 8 (7,727) (18,335) - - Profit before taxation 21,306 14,712 18,465 40,130 Income tax expense 20(b) (9,242) (7,247) (1,785) (170)Profit for the year from continuing operations 12,064 7,465 16,680 39,960
Discontinued operationsPost tax profit from discontinued operations 8 - 10,754 - -
Profit for the year 12,064 18,219 16,680 39,960
Profit attributable to:Owners of the parent 12,064 18,219 16,680 39,960
Earnings per share from continuing operations (Rs/share) 30(a) 0.55 0.34 0.76 1.82
Earnings per share from discontinued operations (Rs/share) 30(b) - 0.49 - -
The notes on pages 44 to 90 form an integral part of these financial statements.Auditors’ report on page 36.
Statements of Profit or Loss Year ended 31 December 2013

The Mauritius Chemical and Fertilizer Industry Limited40
THE GROUP THE COMPANYNote 2013 2012 2013 2012
Rs’000 Rs’000 Rs’000 Rs’000
Profit for the year 12,064 18,219 16,680 39,960
Other comprehensive income:Items that will not be reclassified subsequently to profit or loss:Remeasurements of post employment benefit obligations 15 (538) (31) (609) (68)
Items that may be reclassified subsequently to profit or loss:Currency translation differences 15 (3,615) 3,523 - - Change in value of available-for-sale financial assets 15 (1,099) (6,904) (1,099) (6,904)
Other comprehensive income for the year, net of tax (5,252) (3,412) (1,708) (6,972)Total comprehensive income for the year 6,812 14,807 14,972 32,988
Total comprehensive income attributable to:Owners of the parent 6,812 14,807 14,972 32,988
The notes on pages 44 to 90 form an integral part of these financial statements.Auditors’ report on page 36.
Statements of Profit or Loss and Other Comprehensive IncomeYear ended 31 December 2013

Annual Report 2013 41
TH
E G
RO
UP
(Att
rib
uta
ble
to
ow
ner
s o
f th
e p
are
nt)
No
tes
Sh
are
cap
ital
Re
val
uat
ion
re
serv
e
Avail
ab
le-
for-
sal
e
fair
val
ue
re
serv
eT
ran
slat
ion
re
serv
eR
eta
ine
d
earn
ings
Act
uari
al
gain
s/(l
oss
es)
To
tal
eq
uit
yR
s’0
00
Rs’
00
0R
s’0
00
Rs’
00
0R
s’0
00
Rs’
00
0R
s’0
00
Bala
nce
at 1
Janu
ary
2013
- as
pre
viou
sly
repo
rted
220
,064
2
4,60
9 1
1,93
9 6
,982
5
08,6
18
-
772
,212
-
effe
ct o
f ado
ptin
g IA
S 19
(R
evis
ed)
39 -
-
-
-
(
162)
1,8
67
1,7
05
- as
res
tate
d 2
20,0
64
24,
609
11,
939
6,9
82
508
,456
1
,867
7
73,9
17
Profi
t fo
r th
e ye
ar -
-
-
-
1
2,06
4 -
1
2,06
4 O
ther
com
preh
ensi
ve in
com
e fo
r th
e ye
ar15
-
-
(1,
099)
(3,
615)
-
(53
8) (
5,25
2)To
tal c
ompr
ehen
sive
inco
me
for
the
year
-
-
(1,
099)
(3,
615)
12,
064
(53
8) 6
,812
Div
iden
ds -
201
321
-
-
-
-
(22
,006
) -
(
22,0
06)
Tota
l tra
nsac
tions
with
ow
ners
of t
he p
aren
t -
-
-
-
(
22,0
06)
-
(22
,006
)
Bal
an
ce a
t 31 D
ece
mb
er
20
13
22
0,0
64
2
4,6
09
1
0,8
40
3
,36
7
49
8,5
14
1
,32
9
75
8,7
23
Bala
nce
at 1
Janu
ary
2012
- as
pre
viou
sly
repo
rted
220
,064
2
4,60
9 1
8,84
3 3
,459
5
12,2
43
-
779
,218
-
effe
ct o
f ado
ptin
g IA
S 19
(R
evis
ed)
39 -
-
-
-
-
1
,898
1
,898
-
as r
esta
ted
220
,064
2
4,60
9 1
8,84
3 3
,459
5
12,2
43
1,8
98
781
,116
Profi
t fo
r th
e ye
ar -
-
-
-
1
8,21
9 -
1
8,21
9 O
ther
com
preh
ensi
ve in
com
e fo
r th
e ye
ar15
-
-
(6,
904)
3,5
23
-
(31
) (
3,41
2)To
tal c
ompr
ehen
sive
inco
me
for
the
year
-
-
(6,
904)
3,5
23
18,
219
(31
) 1
4,80
7
Div
iden
ds -
201
221
-
-
-
-
(22
,006
) -
(
22,0
06)
Tota
l tra
nsac
tions
with
ow
ners
of t
he p
aren
t -
-
-
-
(
22,0
06)
-
(22
,006
)
Bal
an
ce a
t 31 D
ece
mb
er
20
12
(re
stat
ed
)2
20
,06
4
24
,60
9
11
,93
9
6,9
82
5
08
,45
6
1,8
67
7
73
,91
7
The
not
es o
n pa
ges
44 t
o 90
form
an
inte
gral
par
t of
the
se fi
nanc
ial s
tate
men
ts.
Aud
itors
’ rep
ort
on p
age
36.
Statements of Changes in Equity Year ended 31 December 2013

The Mauritius Chemical and Fertilizer Industry Limited42
TH
E C
OM
PA
NY
No
tes
Sh
are
cap
ital
Re
val
uat
ion
re
serv
e
Avail
ab
le-
for-
sal
e f
air
val
ue
re
serv
eR
eta
ine
d
earn
ings
Act
uari
al
gain
s/(l
oss
es)
To
tal
eq
uit
yR
s’0
00
Rs’
00
0R
s’0
00
Rs’
00
0R
s’0
00
Rs’
00
0Ba
lanc
e at
1 Ja
nuar
y 20
13-
as p
revi
ousl
y re
port
ed 2
20,0
64
19,
256
11,
938
442
,334
-
6
93,5
92
- ef
fect
of a
dopt
ing
IAS
19 (
Rev
ised
)39
-
-
-
(16
3) 1
,847
1
,684
-
as r
esta
ted
220
,064
1
9,25
6 1
1,93
8 4
42,1
71
1,8
47
695
,276
Profi
t fo
r th
e ye
ar -
-
-
1
6,68
0 -
1
6,68
0 O
ther
com
preh
ensi
ve in
com
e fo
r th
e ye
ar15
-
-
(1,
099)
-
(60
9) (
1,70
8)To
tal c
ompr
ehen
sive
inco
me
for
the
year
-
-
(1,
099)
16,
680
(60
9) 1
4,97
2
Div
iden
ds -
201
321
-
-
-
(22
,006
) -
(
22,0
06)
Tota
l tra
nsac
tions
with
ow
ners
of t
he p
aren
t -
-
-
(
22,0
06)
-
(22
,006
)
Bal
an
ce a
t 31 D
ece
mb
er
20
13
22
0,0
64
1
9,2
56
1
0,8
39
4
36
,84
5
1,2
38
6
88
,24
2
Bala
nce
at 1
Janu
ary
2012
- as
pre
viou
sly
repo
rted
220
,064
1
9,25
6 1
8,84
2 4
24,2
17
-
682
,379
-
effe
ct o
f ado
ptin
g IA
S 19
(R
evis
ed)
39 -
-
-
-
1
,915
1
,915
-
as r
esta
ted
220
,064
1
9,25
6 1
8,84
2 4
24,2
17
1,9
15
684
,294
Profi
t fo
r th
e ye
ar -
-
-
3
9,96
0 -
3
9,96
0 O
ther
com
preh
ensi
ve in
com
e fo
r th
e ye
ar15
-
-
(6,
904)
-
(68
) (
6,97
2)To
tal c
ompr
ehen
sive
inco
me
for
the
year
-
-
(6,
904)
39,
960
(68
) 3
2,98
8
Div
iden
ds -
201
221
-
-
-
(22
,006
) -
(
22,0
06)
Tota
l tra
nsac
tions
with
ow
ners
of t
he p
aren
t -
-
-
(
22,0
06)
-
(22
,006
)
Bal
an
ce a
t 31 D
ece
mb
er
20
12
(re
stat
ed
) 2
20
,06
4
19
,25
6
11
,93
8
44
2,1
71
1
,84
7
69
5,2
76
The
not
es o
n pa
ges
44 t
o 90
form
an
inte
gral
par
t of
the
se fi
nanc
ial s
tate
men
ts.
Aud
itors
’ rep
ort
on p
age
36.
Statements of Changes in Equity Year ended 31 December 2013
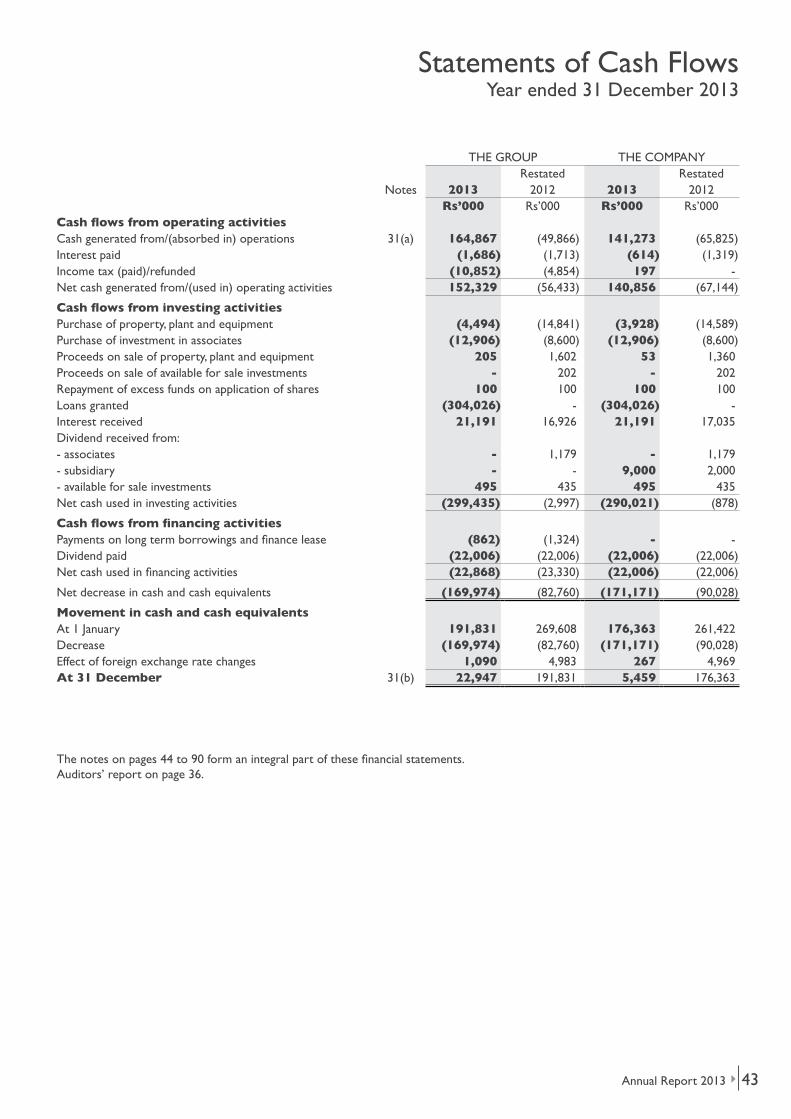
Annual Report 2013 43
THE GROUP THE COMPANYRestated Restated
Notes 2013 2012 2013 2012Rs’000 Rs’000 Rs’000 Rs’000
Cash flows from operating activitiesCash generated from/(absorbed in) operations 31(a) 164,867 (49,866) 141,273 (65,825)Interest paid (1,686) (1,713) (614) (1,319)Income tax (paid)/refunded (10,852) (4,854) 197 - Net cash generated from/(used in) operating activities 152,329 (56,433) 140,856 (67,144)
Cash flows from investing activitiesPurchase of property, plant and equipment (4,494) (14,841) (3,928) (14,589)Purchase of investment in associates (12,906) (8,600) (12,906) (8,600)Proceeds on sale of property, plant and equipment 205 1,602 53 1,360 Proceeds on sale of available for sale investments - 202 - 202 Repayment of excess funds on application of shares 100 100 100 100 Loans granted (304,026) - (304,026) - Interest received 21,191 16,926 21,191 17,035 Dividend received from:- associates - 1,179 - 1,179 - subsidiary - - 9,000 2,000 - available for sale investments 495 435 495 435 Net cash used in investing activities (299,435) (2,997) (290,021) (878)
Cash flows from financing activitiesPayments on long term borrowings and finance lease (862) (1,324) - - Dividend paid (22,006) (22,006) (22,006) (22,006)Net cash used in financing activities (22,868) (23,330) (22,006) (22,006)
Net decrease in cash and cash equivalents (169,974) (82,760) (171,171) (90,028)
Movement in cash and cash equivalentsAt 1 January 191,831 269,608 176,363 261,422 Decrease (169,974) (82,760) (171,171) (90,028)Effect of foreign exchange rate changes 1,090 4,983 267 4,969 At 31 December 31(b) 22,947 191,831 5,459 176,363
The notes on pages 44 to 90 form an integral part of these financial statements.Auditors’ report on page 36.
Statements of Cash Flows Year ended 31 December 2013

The Mauritius Chemical and Fertilizer Industry Limited44
1. GENERAL INFORMATION
The Mauritius Chemical and Fertilizer Industry Limited is a public company incorporated in Mauritius and listed on the Stock Exchange of Mauritius. Its registered office is situated at Chaussée Tromelin, Fort George, Port Louis, Mauritius. Its main activity consists of manufacturing of NPK complex, blending and trading of fertilisers.
These financial statements will be submitted for consideration and approval at the forthcoming Annual Meeting of Shareholders of the Company.
2. SIGNIFICANT ACCOUNTING POLICIES
The principal accounting policies adopted in the preparation of these financial statements are set out below. These policies have been consistently applied to all the years presented, unless otherwise stated.
2.1 Basis of preparation
The financial statements of The Mauritius Chemical and Fertilizer Industry Limited comply with the Companies Act 2001 and have been prepared in accordance with International Financial Reporting Standards (IFRS).
These financial statements include the consolidated financial statements of the parent company and its subsidiaries (the “Group”) and the separate financial statements of the parent company (the “Company”). The financial statements are presented in Mauritian Rupees and all values are rounded to the nearest thousand (Rs’000), except where otherwise indicated.
Where necessary, comparative figures have been amended to conform with change in presentation in the current year. The financial statements are prepared under the historical cost convention, except that relevant financial assets and liabilities are stated at their fair value.
(a) Standards, Amendments to published Standards and Interpretations effective in the reporting period
Amendment to IAS 1, ‘Financial statement presentation’ regarding other comprehensive income. The main change resulting from these amendments is a requirement for entities to group items presented in ‘other comprehensive income’ (OCI) on the basis of whether they are potentially reclassifiable to profit or loss subsequently (reclassification adjustments).
IFRS 10, ‘Consolidated financial statements’ builds on existing principles by identifying the concept of control as the determining factor in whether an entity should be included within the consolidated financial statements of the parent company. The standard provides additional guidance to assist in the determination of control where this is difficult to assess. The standard is not expected to have any impact on the Group’s financial statements.
IAS 27, ‘Separate Financial Statements’ deals solely with separate financial statements. The standard has no impact on the Group’s financial statements.
IFRS 11, ‘Joint arrangements’ focuses on the rights and obligations of the parties to the arrangement rather than its legal form. There are two types of joint arrangements: joint operations and joint ventures. Joint operations arise where the investors have rights to the assets and obligations for the liabilities of an arrangement. A joint operator accounts for its share of the assets, liabilities, revenue and expenses. Joint ventures arise where the investors have rights to the net assets of the arrangement; joint ventures are accounted for under the equity method. Proportional consolidation of joint arrangements is no longer permitted. The standard is not expected to have any impact on the Group’s financial statements.
IAS 28, ‘Investments in Associates and Joint Ventures’. The scope of the revised standard covers investments in joint ventures as well. IFRS 11 requires investments in joint ventures to be accounted for using the equity method of accounting. The standard has no impact on the Group’s financial statements.
IFRS 12, ‘Disclosures of interests in other entities’ includes the disclosure requirements for all forms of interests in other entities, including joint arrangements, associates, structured entities and other off balance sheet vehicles. The standard has no impact on the Group’s financial statements.
IFRS 13, ‘Fair value measurement’, aims to improve consistency and reduce complexity by providing a precise definition of fair value and a single source of fair value measurement and disclosure requirements for use across IFRSs. The requirements do not extend the use of fair value accounting but provide guidance on how it should be applied where its use is already required or permitted by other standards within IFRSs.
IAS 19, ‘Employee benefits’ was revised in June 2011. The changes on the group’s accounting policies has been as follows: to immediately recognise all past service costs; and to replace interest cost and expected return on plan assets with a net interest amount that is calculated by applying the discount rate to the net defined benefit liability (asset). See note 18 for the impact on the financial statements.
IFRIC 20, ‘Stripping costs in the production phase of a surface mine’, has no impact on the Group’s financial statements.
Amendment to IFRS 7, ‘Financial instruments: Disclosures’, on asset and liability offsetting. This amendment includes new disclosures and is not expected to have any impact on the Group’s financial statements.
Amendment to IFRS 1 (Government Loans) has no impact on the Group’s financial statements.
Notes to the Financial StatementsYear ended 31 December 2013

Annual Report 2013 45
2. SIGNIFICANT ACCOUNTING POLICIES (CONT’D)
2.1 Basis of preparation (cont’d)
(a) Standards, Amendments to published Standards and Interpretations effective in the reporting period (cont’d)
Annual Improvements to IFRSs 2009-2011 Cycle
IFRS 1 (Amendment), ‘First time adoption of IFRS’, has no impact on the Group’s operations.
IAS 1 (Amendment), ‘Presentation of financial statements’, clarifies the disclosure requirements for comparative information when an entity provides a third balance sheet either as required by IAS 8, ‘Accounting policies, changes in accounting estimates and errors’ or voluntarily.
IAS 16 (Amendment), ‘Property, plant and equipment’, clarifies that spare parts and servicing equipment are classified as property, plant and equipment rather than inventory when they meet the definition of property, plant and equipment. The amendment does not have an impact on the Group’s operations.
IAS 32 (Amendment), ‘Financial instruments: Presentation’, clarifies the treatment of income tax relating to distributions and transaction costs. The amendment does not have an impact on the Group’s operations.
IAS 34 (Amendment), ‘Interim financial reporting’, clarifies the disclosure requirements for segment assets and liabilities in interim financial statements.
(b) Standards, Amendments to published Standards and Interpretations issued but not yet effective
Certain standards, amendments to published standards and interpretations have been issued that are mandatory for accounting periods beginning on or after 1 January, 2014 or later periods, but which the Group has not early adopted.
At the reporting date of these financial statements, the following were in issue but not yet effective:
IFRS 9 Financial InstrumentsIAS 32 Offsetting Financial Assets and Financial Liabilities (Amendments to IAS 32)Investment Entities (Amendments to IFRS 10, IFRS 12 and IAS 27)IFRIC 21: LeviesRecoverable Amount Disclosures for Non- financial Assets (Amendments to IAS 36) Novation of Derivatives and Continuation of Hedge Accounting (Amendments to IAS 39)IFRS 9 Financial instruments (Hedge Accounting and amendments to IFRS 9, IFRS 7 and IAS 39)Defined Benefit Plans: Employee Contributions (Amendments to IAS 19)Annual Improvements to IFRSs 2010-2012 cycleAnnual Improvements to IFRSs 2011-2013 cycle
Where relevant, the Group is still evaluating the effect of these Standards, amendments to published Standards and Interpretations issued but not yet effective, on the presentation of its financial statements.
The preparation of financial statements in conformity with IFRS requires the use of certain critical accounting estimates. It also requires management to exercise its judgement in the process of applying the Group’s accounting policies. The areas involving a higher degree of judgement or complexity, or areas where assumptions and estimates are significant to the financial statements, are disclosed in Note 4.
2.2 Investments in subsidiaries
Separate financial statements of the investorIn the separate financial statements of the investor, investments in subsidiary companies are carried at cost. The carrying amount is reduced to recognise any impairment in the value of individual investments.
Consolidated financial statementsSubsidiaries are all entities (including structured entities) over which the Group has control. The Group controls an entity when the Group is exposed to, or has rights to, variable returns from its involvement with the entity and has the ability to affect those returns through its power over the entity.
Subsidiaries are fully consolidated from the date on which control is transferred to the Group. They are de-consolidated from the date that control ceases.
The acquisition method of accounting is used to account for business combinations by the Group. The consideration transferred for the acquisition of a subsidiary is the fair values of the assets transferred, the liabilities incurred and the equity interests issued by the Group. The consideration transferred includes the fair value of any assets or liability resulting from a contingent consideration arrangement. Acquisition-related costs are expensed as incurred. Identifiable assets acquired and liabilities and contingent liabilities assumed in a business combination are measured initially at their fair values at the acquisition date. On an acquisition-by-acquisition basis, the Group recognises any non-controlling interests in the acquiree at the non-controlling interest’s proportionate share of the acquiree’s net assets.
The excess of, the consideration transferred, the amount of any non-controlling interests in the acquiree and the acquisition-date fair value of any previous equity interest in the acquiree (if any), over the fair value of identifiable net assets acquired is recorded as goodwill. If this is less than the fair value of the net assets of the subsidiary acquired in the case of a bargain purchase, the difference is recognised directly in profit or loss as a bargain purchase gain.
Inter-company transactions, balances and unrealised gains on transactions between group companies are eliminated. Unrealised losses are also eliminated. Accounting policies of subsidiaries have been changed where necessary to ensure consistency with the policies adopted by the Group.
Notes to the Financial StatementsYear ended 31 December 2013

The Mauritius Chemical and Fertilizer Industry Limited46
2. SIGNIFICANT ACCOUNTING POLICIES (CONT’D)
2.2 Investments in subsidiaries (cont’d)
Consolidated financial statements (cont’d)
Transactions and non-controlling interestsThe Group treats transactions with non-controlling interests as transactions with equity owners of the Group.
For purchases from non-controlling interests, the difference between any consideration paid and the relevant share acquired of the carrying value of net assets of the subsidiary is recorded in equity. Gains or losses on disposals to non-controlling interests are also recorded in equity.
Disposal of subsidiariesWhen the Group ceases to have control or significant influence, any retained interest in the entity is remeasured to its fair value, with the change in carrying amount recognised in profit or loss. The fair value is the initial carrying amount for the purposes of subsequently accounting for the retained interest as an associate, joint venture or financial asset. In addition, any amounts previously recognised in other comprehensive income in respect of that entity are accounted for as if the Group had directly disposed of the related assets or liabilities. This may mean that amounts previously recognised in other comprehensive income are reclassified to profit or loss.
2.3 Investments in associates
Separate financial statements of the investorIn the separate financial statements of the investor, investments in associated companies are carried at cost.
The carrying amount is reduced to recognise any impairment in the value of individual investments.
Consolidated financial statementsAn associate is an entity over which the Group has significant influence but not control, or joint control, generally accompanying a shareholding between 20% and 50% of the voting rights.
Investments in associates are accounted for using the equity method. Investments in associates are initially recognised at cost as adjusted by post acquisition changes in the Group’s share of the net assets of the associate less any impairment in the value of individual investments.
Any excess of the cost of acquisition and the Group’s share of the net fair value of the associate’s identifiable assets and liabilities recognised at the date of acquisition is recognised as goodwill, which is included in the carrying amount of the investment. Any excess of the Group’s share of the net fair value of identifiable assets and liabilities over the cost of acquisition, after assessment, is included as income in the determination of the Group’s share of the associate’s profit or loss.
When the Group’s share of losses exceeds its interest in an associate, the Group discontinues recognising further losses, unless it has incurred legal or constructive obligation or made payments on behalf of the associate.
Unrealised profits and losses are eliminated to the extent of the Group’s interest in the associate. Unrealised losses are also eliminated unless the transaction provides evidence of an impairment of the asset transferred.
Where necessary, appropriate adjustments are made to the financial statements of associates to bring the accounting policies used in line with those adopted by the Group.
If the ownership interest in an associate is reduced but significant influence is retained, only a proportionate share of the amounts previously recognised in other comprehensive income are reclassified to profit or loss where appropriate.
Dilution gains and losses arising in investments in associates are recognised in profit or loss.
2.4 Property, plant and equipment
Property, plant and equipment is initially stated at historical cost/deemed cost less depreciation. Historical cost includes expenditure that is directly attributable to the acquisition of the items. Subsequent costs are included in the assets carrying amount or recognised as a separate asset as appropriate, only when it is probable that future economic benefits associated with the item will flow to the Group and the cost of the item can be measured reliably.
Increases in the carrying amount arising on revaluation are credited to other comprehensive income and shown as revaluation reserve in shareholders’ equity. Decreases that offset previous increases of the same asset are charged against the revaluation reserve; all other decreases are charged to profit or loss.
Depreciation is calculated on a straight line method to write off the cost of each asset, to their residual values over their estimated useful lives, as follows:
The assets’ residual values and useful lives are reviewed, and adjusted if appropriate, at the end of each reporting period.
Where the carrying amount of an asset is greater than its estimated recoverable amount, it is written down immediately to its recoverable amount.
Years
Buildings 30 - 50 Plant and Machinery 5 - 25 Furniture, Fittings and Office Equipment 3 - 10 Forklifts and payloaders 5 Motor Vehicles 5
Notes to the Financial StatementsYear ended 31 December 2013

Annual Report 2013 47
2. SIGNIFICANT ACCOUNTING POLICIES (CONT’D)
2.4 Property, plant and equipment (cont’d)
Gains and losses on disposal of property, plant and equipment are determined by reference to their carrying amount and are taken into account in determining operating profit. On disposal of revalued assets, amounts in revaluation and other reserves relating to those assets are transferred to retained earnings.
2.5 Inventories
Inventories are stated at the lower of cost and net realisable value. Cost is determined on a weighted average basis. The cost of finished goods and work in progress comprises purchase cost of raw materials, direct labour, other direct costs and related production overheads (based on normal operating capacity). Net realisable value is the estimated selling price in the ordinary course of business, less the costs of completion and applicable variable selling expenses.
2.6 Foreign currencies
(i) Functional and presentation currencyItems included in the financial statements are measured using Mauritian rupees, the currency of the primary economic environment in which the entity operates (“functional currency”). The consolidated financial statements are presented in Mauritian rupees, which is the Company’s functional and presentation currency.
(ii) Transactions and balancesForeign currency transactions are translated into the functional currency using the exchange rates prevailing on the dates of the transactions. Foreign exchange gains and losses resulting from the settlement of such transactions and from the translation at period-end exchange rates of monetary assets and liabilities denominated in foreign currencies are recognised in profit or loss.
Foreign exchange gains and losses that relate to borrowings and cash and cash equivalents are presented in profit or loss within ‘Net finance income’. Foreign exchange gain and losses that relate to purchases and trade payables are presented in in profit or loss in ‘Cost of sales’. All other foreign exchange gains and losses are presented in profit or loss within ‘Other income’.
Non-monetary items, that are measured at historical cost in a foreign currency, are translated using the exchange rate at the date of the transaction.
Non-monetary items, that are measured at fair value in a foreign currency, are translated using the exchange rates at the date the fair value was determined.
Translation differences on non-monetary items, such as equities classified as available-for-sale financial assets, are included in the fair value reserve in equity.
(iii) Group companiesThe results and financial position of all the Group entities (none of which has the currency of a hyperinflationary economy) that have a functional currency different from the presentation currency are translated into the presentation currency as follows: (a) assets and liabilities for each statement of financial position
presented are translated at the closing rate at the date of that statement of financial position;
(b) income and expenses for each statement representing profit or loss and other comprehensive income are translated at average exchange rates (unless this average is not a reasonable approximation of the cumulative effect of the rates prevailing on the transaction dates, in which case income and expenses are translated at the dates of the transactions); and
(c) all resulting exchange differences are recognised in other comprehensive income.
On consolidation, exchange differences arising from the translation of the net investment in foreign entities, and of borrowings are taken to shareholders’ equity. When a foreign operation is sold, such exchange differences are recognised in profit or loss as part of the gain or loss on sale.
Goodwill and fair value adjustments arising on the acquisition of a foreign entity are treated as assets and liabilities of the foreign entity and translated at the closing rate.
2.7 Deferred income tax
Deferred income tax is provided in full, using the liability method, for all temporary differences arising between the tax bases of assets and liabilities and their carrying amounts in the financial statements. However, if the deferred income tax arises from initial recognition of an asset or liability in a transaction, other than a business combination, that at the time of the transaction affects neither accounting nor taxable profit or loss, it is not accounted for.
Deferred income tax is determined using tax rates that have been enacted or substantively enacted at the reporting date and are expected to apply in the period when the related deferred income tax asset is realised or the deferred income tax liability is settled.
Deferred tax assets are recognised to the extent that it is probable that future taxable profits will be available against which deductible temporary differences can be utilised.
2.8 Intangible assets
GoodwillGoodwill arising on an acquisition of a business is carried at cost as established at the date of acquisition of the business (see note 2.2) less accumulated impairment losses, if any.
Goodwill is tested annually for impairment.
Goodwill is allocated to cash-generating units for the purpose of impairment testing.
Notes to the Financial StatementsYear ended 31 December 2013

The Mauritius Chemical and Fertilizer Industry Limited48
2. SIGNIFICANT ACCOUNTING POLICIES (CONT’D)
2.8 Intangible assets (cont’d)
On disposal of a subsidiary, the attributable amount of goodwill is included in the determination of the gains and losses on disposal.
2.9 Retirement benefit obligations
(i) Defined benefit plansA defined benefit plan is a pension plan that is not a defined contribution plan. Typically defined benefit plans define an amount of pension benefit that an employee will receive on retirement, usually dependent on one or more factors such as age, years of service and compensation.
The liability recognised in the statements of financial position in respect of defined benefit pension plans is the present value of the defined benefit obligation at the end of the reporting period less the fair value of plan assets. The defined benefit obligation is calculated annually by independent actuaries using the projected unit credit method.
Remeasurement of the net defined benefit liability, which comprise actuarial gains and losses arising from experience adjustments and changes in actuarial assumptions, the return on plan assets (excluding interest) and the effect of the asset ceiling (if any, excluding interest), is recognised immediately in other comprehensive income in the period in which they occur. Remeasurements recognised in other comprehensive income shall not be reclassified to profit or loss in subsequent period.
The Group determines the net interest expense/(income) on the defined benefit liability/(asset) for the period by applying the discount rate used to measure the defined benefit obligation at the beginning of the annual period to the net defined benefit liability/(assets), taking into account any changes in the net defined liability/(asset) during the period as a result of contributions and benefit payments. Net interest expense/(income) is recognised in profit or loss.
Service costs comprising current service cost, past service cost, as well as gains and losses on curtailments and settlements are recognised immediately in profit or loss.
(ii) Defined contribution plansA defined contribution plan is a pension plan under which the Group pays fixed contributions into a separate entity. The Group has no legal or constructive obligations to pay further contributions if the fund does not hold sufficient assets to pay all employees the benefits relating to employee service in the current and prior periods.
The Group operates a defined contribution retirement benefit plan for all qualifying employees. Payments to defined contribution retirement plans are charged when employees have rendered service that entitle them to the contributions.
(iii) Gratuity on retirementFor those employees who are not covered (or who are insufficiently covered) by the above pension plans, the net present
value of gratuity on retirement payable under the Employment Rights Act 2008 is calculated by a qualified actuary and provided for. The obligations arising under this item are not funded.
(iv) Profit sharing and bonus plansThe Group recognises a liability and an expense for bonuses and profit sharing, based on a formula that takes into consideration the profit attributable to the Group’s shareholders after certain adjustments. The Group recognises a provision where contractually obliged or where there is a past practice that has created a constructive obligation.
2.10 Impairment of non-financial assets
Assets that have an indefinite useful life are not subject to amortisation and are tested annually for impairment. Assets that are subject to amortisation are reviewed for impairment whenever events or changes in circumstances indicate that the carrying amount may not be recoverable. An impairment loss is recognised for the amount by which the carrying amount of the asset exceeds its recoverable amount. The recoverable amount is the higher of an asset’s fair value less costs to sell and value in use. For the purposes of assessing impairment, assets are grouped at the lowest levels for which there are separately identifiable cash flows (cash-generating units).
2.11 Leases
Leases are classified as finance leases where the terms of the lease transfer substantially all risks and rewards of ownership to the lessee. All other leases are classified as operating leases. Payments made under operating leases (net of any incentives received from the lessor) are charged to profit or loss on a straight-line basis over the period of the lease.
Finance leases are capitalised at the lease’s inception at the lower of the fair value of the leased property and the present value of the minimum lease payments. Each lease payment is allocated between the liability and finance charges so as to achieve a constant rate of interest on the remaining balance of the liability. Finance charges are charged to profit or loss.
2.12 Financial assets
(a) Categories of financial assets
The Group classifies its financial assets in the following categories: available-for-sale financial assets and loans and receivables. The classification depends on the purpose for which the investments were acquired. Management determines the classification of the financial assets at initial recognition.
(i) Available-for-sale financial assetsAvailable-for-sale financial assets are non-derivatives that are either designated in this category or not classified in any of the other categories. They are included in non-current assets unless management intends to dispose of the investment within twelve months of the end of the reporting period.
Notes to the Financial StatementsYear ended 31 December 2013

Annual Report 2013 49
2. SIGNIFICANT ACCOUNTING POLICIES (CONT’D)
2.12 Financial assets (cont’d)
(a) Categories of financial assets (cont’d)
(ii) Loans and receivablesLoans and receivables are non-derivative financial assets with fixed or determinable payments that are not quoted in an active market. They are recognised initially at fair value plus any directly attributable transaction costs. Subsequent to initial recognition, loans and receivables are measured at amortised cost less any impairment. They are included in current assets when maturity is within twelve months after the end of the reporting period or non-current assets for maturities greater than twelve months.The Group’s loans and receivables comprise cash and cash equivalents, and trade and other receivables.
(b) Recognition and measurementPurchases and sales of financial assets are recognised on trade-date (or settlement date), the date on which the Group commits to purchase or sell the asset. Investments are initially measured at fair value plus transaction costs.
Available-for-sale financial assets are subsequently carried at their fair values. Loans and receivables are carried at amortised cost using the effective interest method.
Investments in equity instruments that do not have a quoted market price in an active market and whose fair value cannot be reliably measured are measured at cost.
Unrealised gains and losses arising from changes in the fair value of financial assets classified as available-for-sale are recognised in other comprehensive income.
When financial assets classified as available-for-sale are sold or impaired, the accumulated fair value adjustments are included in profit or loss as gains and losses on financial assets.
The fair values of quoted investments are based on current bid prices. If the market for a financial asset is not active (and for unlisted securities), the Group establishes fair value by using valuation techniques. These include the use of recent arm’s length transactions, reference to other instruments that are substantially the same and discounted cash flows analysis.
(c) Impairment of financial assets
(i) Financial assets classified as available-for-saleThe Group assesses at the end of each reporting period whether there is objective evidence that a financial asset or a group of financial assets is impaired. In the case of equity investments classified as available-for-sale, a significant or prolonged decline in the fair value of the security below its cost is considered in determining whether the securities are impaired. If any such evidence exists for available-for-sale financial assets, the cumulative loss, measured as the difference between acquisition cost and the
current fair value, less any impairment loss on that financial asset previously recognised in profit or loss - is removed from equity and recognised in profit or loss.
If the fair value of a previously impaired debt security classified as available-for-sale increases and the increase can be objectively related to an event occuring after the impairment loss was recognised, the impairment loss is reversed and the reversal recognised in profit or loss.
Impairment losses recognised in profit or loss for an investment in an equity instrument classified as available-for-sale are not reversed through profit or loss.
(ii) Financial assets carried at amortised costFor loans and receivables category, the amount of the loss is measured as the difference between the asset’s carrying amount and the present value of estimated future cash flows (excluding future credit losses that have not been incurred) discounted at the financial asset’s original effective rate. The carrying amount of the asset is reduced and, the amount of the loss is recognised in profit or loss. If a loan has a variable interest rate, the discount rate for measuring any impairment loss is the current effective interest rate determined under the contract.
If in a subsequent period, the amount of the impairment loss decreases and the decrease can be related objectively to an event occurring after the impairment was recognised (such as an improvement in the debtor’s credit rating), the previously recognised impairment loss is reversed through profit or loss to the extent that the carrying amount of the financial asset at the date the impairment is reversed does not exceed what the amortised cost would have been had the impairment not been recognised.
2.13 Long term receivables
Long term receivables with fixed maturity terms are measured at amortised cost using the effective interest rate method, less provision for impairment. Long term receivables without fixed maturity terms are measured at cost. The carrying amount of the asset is reduced by the difference between the asset’s carrying amount and the present value of estimated cash flows discounted using the original effective interest rate. The amount of loss is recognised in profit or loss. If there is objective evidence that an impairment loss has been incurred, the amount of impairment loss is measured as the difference between the carrying amount of the asset and the present value (PV) of estimated cash flows discounted at the current market rate of return of similar financial assets.
2.14 Trade receivables
Trade receivables are recognised initially at fair value and subsequently measured at amortised cost less provision for impairment. A provision for impairment of trade receivables is established when there is objective evidence that the Group will not be able to collect all amounts due according to the original terms of receivables.
Notes to the Financial StatementsYear ended 31 December 2013

The Mauritius Chemical and Fertilizer Industry Limited50
2. SIGNIFICANT ACCOUNTING POLICIES (CONT’D)
2.14 Trade receivables (cont’d)
The amount of the provision is the difference between the asset’s carrying amount and the present value of estimated future cash flows. The amount of provision is recognised in profit or loss.
2.15 Borrowings
Borrowings are recognised initially at fair value being the issue proceeds received, net of transaction costs incurred. Borrowings are subsequently stated at amortised cost ; any difference between proceeds (net of transaction costs) and the redemption value is recognised in profit or loss over the period of the borrowings using the effective interest method.
Borrowings are classified as current liabilities unless the Group has an unconditional right to defer settlement of the liability for at least twelve months after the end of the reporting period.
2.16 Cash and cash equivalents
Cash and cash equivalents include cash in hand, short term investments and bank overdraft. Bank overdraft is shown within borrowings in current liabilities in the statements of financial position.
2.17 Trade and other payables
Trade and other payables are stated at fair value and subsequently measured at amortised cost using the effective interest method.
2.18 Share capital
Ordinary sharesOrdinary shares are classified as equity. Incremental costs directly attributable to the issue of new shares are shown in equity as deduction, net of tax, from proceeds.
2.19 Revenue recognition
Revenue is measured at the fair value of the consideration received or receivable, and represents amounts receivable for goods supplied, stated net of discounts, returns, value added taxes, rebates and other similar allowances and after eliminating sales within the Group.
(i) Sales of goodsSales of goods are recognised when the goods are delivered and titles have passed, at which time all of the following conditions are satisfied: - the Group has transferred to the buyer the significant risk and
rewards of ownership of the goods;- the Group retains neither continuing managerial involvement
to the degree usually associated with ownership nor effective control over the goods sold;
- the amount of revenue can be measured reliably;
- it is probable that the economic benefits associated with the transaction will flow to the Group; and
- the costs incurred or to be incurred in respect of the transaction can be measured reliably.
2.19 Revenue recognition (cont’d)
(ii) Rendering of servicesRevenue from rendering of services are recognised in the accounting year in which the services are rendered (by reference to completion of the specific transaction assessed on the basis of the actual service provided as a proportion of total services to be provided).
(iii) Other revenues are recognised as follows:- Rental income - on an accruals basis in accordance with the
substance of the relevant agreements;- Interest income - on a time-proportion basis using the effective
interest method;- Dividend income - when the shareholder’s right to receive
payment is established.
2.20 Dividend distribution
Dividend distribution to the Company’s shareholders is recognised as a liability in the Group’s financial statements in the period in which the dividends are declared.
2.21 Provisions
Provisions are recognised when the Company has a present or constructive obligation as a result of past events; it is probable that an outflow of resources that can be reliably estimated will be required to settle the obligation.
The amount recognised as a provision is the best estimate of the consideration required to settle the present obligation at the end of the reporting period, taking into account the risks and uncertainties surrounding the obligation. When a provision is measured using the cash flows estimated to settle the present obligation, its carrying amount is the present value of those cash flows (when the effect of the time value of money is material).
2.22 Segment reporting
Segment information presented relate to operating segments that engage in business activities for which revenues are earned and expenses incurred.
2.23 Alternative Minimum Tax (AMT)
Alternative Minimum Tax (AMT) is provided for, where a company which has a tax liability of less than 7.5% of its book profit pays a dividend. AMT is calculated as the lower of 10% of the dividend paid and 7.5% of book profit.
Notes to the Financial StatementsYear ended 31 December 2013

Annual Report 2013 51
THE GROUP THE COMPANYStrengthened Weakened Strengthened Weakened
By 5 % By 5 % By 5 % By 5 %2013 Rs’000 Rs’000 Rs’000 Rs’000
US Dollar 1,326 (1,326) 1,335 (1,335)
Euro (101) 101 (646) 646
2012
US Dollar (1,475) 1,475 (1,475) 1,475
Euro 1,139 (1,139) 888 (888)
3. FINANCIAL RISK MANAGEMENT
3.1 Financial Risk Factors
The Group’s activities expose it to a variety of financial risks: market risks (including currency risk, fair value interest risk, cash flow interest risk and price risk), credit risk and liquidity risk.
The Group’s overall risk management programme focuses on the unpredictability of financial markets and seeks to minimise potential adverse effects on the Group’s financial performance.
A description of the significant risk factors is given below together with the risk management policies applicable.
(a) Market risk
(i) Currency risk
The Group operates internationally and is exposed to foreign exchange risk arising from various currency exposures primarily with respect to US dollar and Euro. Foreign exchange risk arises from future commercial transactions, recognised assets and liabilities and net investments in foreign operations.
Management has set up a policy to require the Group to manage their foreign exchange risk exposure on treasury.
The Group has an investments in foreign subsidiary, whose net assets are exposed to currency translation risk. Currency exposure arising from the net assets of the Group’s foreign operations in Zambia is managed primarily through borrowings denominated in the relevant foreign currencies.
At 31 December 2013 and 2012, if the rupee had strengthened/(weakened) by 5% against the US Dollar and the Euro with all other variables held constant, the impact on post-tax profit would have been as follows:
Notes to the Financial StatementsYear ended 31 December 2013

The Mauritius Chemical and Fertilizer Industry Limited52
3. FINANCIAL RISK MANAGEMENT (CONT’D)
3.1 Financial Risk Factors (cont’d)
(ii) Price riskThe market prices of the Group’s available-for-sale quoted investment securities are susceptible to future fluctuations.
To manage its price risk arising from investments in equity securities, the Group diversifies its portfolio.
Sensitivity analysisThe impact of increases/(decreases) in the fair value of the investments on the Group’s equity, is summarised below based on the assumption that the fair value has increased/(decreased) by 5%.
THE COMPANY2013 2012
Rs’000 Rs’000
Available-for-sale 806 866
(b) Credit riskCredit risk is the risk of financial loss to the Group if a customer or counterparty to a financial instrument fails to meet its contractual obligations, and arises principally from the Group’s trade receivables. The amounts presented in the statements of financial position are net of allowances for doubtful receivables, estimated by the Group’s management based on prior experience and the current economic environment. The Group has policies in place to ensure that sales of products and services are made to customers with an appropriate credit history.
The Group has no significant concentration of credit risk, with exposure spread over a large number of counterparties and customers.
The Group has policies that limit the amount of credit exposure to any company.
(c) Liquidity risk Liquidity risk is the risk that the Group will encounter difficulty in meeting the obligations associated with its financial liabilities that are settled by delivery of cash or another financial asset.
Prudent liquidity risk management implies maintaining sufficient cash and marketable securities, the availability of funding through an adequate amount of committed credit facilities. The Group aims at maintaining flexibility in funding by keeping committed credit lines available.
Management monitors rolling forecasts of the Group’s and the Company’s liquidity reserve on the basis of expected cash flow.
GROUP COMPANYForecasted liquidity reserve is as follows: 2014 2014
Rs’000 Rs’000
Net cash flows from operating activities 83,617 34,281 Net cash flows used in investing activities (19,521) (13,636)Net cash flows used in financing activities (19,871) (22,006)Increase/(decrease) 44,225 (1,361)Opening balance 22,947 5,459 Closing balance 67,172 4,098
Notes to the Financial StatementsYear ended 31 December 2013
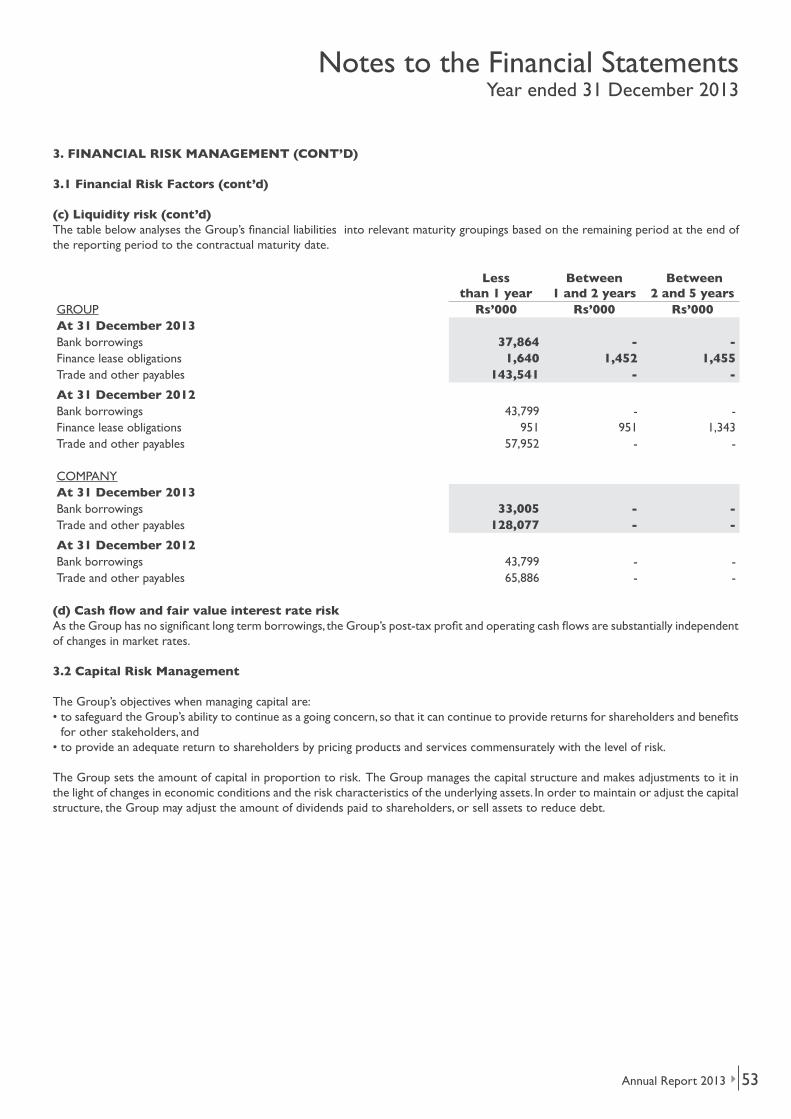
Annual Report 2013 53
3. FINANCIAL RISK MANAGEMENT (CONT’D)
3.1 Financial Risk Factors (cont’d)
(c) Liquidity risk (cont’d)The table below analyses the Group’s financial liabilities into relevant maturity groupings based on the remaining period at the end of the reporting period to the contractual maturity date.
Less than 1 year
Between 1 and 2 years
Between 2 and 5 years
GROUP Rs’000 Rs’000 Rs’000At 31 December 2013Bank borrowings 37,864 - - Finance lease obligations 1,640 1,452 1,455 Trade and other payables 143,541 - -
At 31 December 2012Bank borrowings 43,799 - - Finance lease obligations 951 951 1,343 Trade and other payables 57,952 - -
COMPANYAt 31 December 2013Bank borrowings 33,005 - - Trade and other payables 128,077 - -
At 31 December 2012Bank borrowings 43,799 - - Trade and other payables 65,886 - -
(d) Cash flow and fair value interest rate riskAs the Group has no significant long term borrowings, the Group’s post-tax profit and operating cash flows are substantially independent of changes in market rates.
3.2 Capital Risk Management
The Group’s objectives when managing capital are:• to safeguard the Group’s ability to continue as a going concern, so that it can continue to provide returns for shareholders and benefits
for other stakeholders, and• to provide an adequate return to shareholders by pricing products and services commensurately with the level of risk.
The Group sets the amount of capital in proportion to risk. The Group manages the capital structure and makes adjustments to it in the light of changes in economic conditions and the risk characteristics of the underlying assets. In order to maintain or adjust the capital structure, the Group may adjust the amount of dividends paid to shareholders, or sell assets to reduce debt.
Notes to the Financial StatementsYear ended 31 December 2013

The Mauritius Chemical and Fertilizer Industry Limited54
3. FINANCIAL RISK MANAGEMENT (CONT’D)
3.2 Capital Risk Management (cont’d)
Consistent with others in the industry, the Group monitors capital on the basis of the debt-to-adjusted capital ratio. This ratio is calculated as net debt adjusted capital. Net debt is calculated as total debt (as shown in the statement of financial position) less cash and cash equivalents. Adjusted capital comprises all components of equity (i.e., share capital, revaluation reserve, available-for-sale fair value reserve, translation reserve, actuarial reserve and retained earnings).
During the year, the Company’s strategy, which was unchanged from 2012, was to maintain the debt-to-adjusted capital ration at the lower end in order to secure access to finance at a reasonable cost. The debt-to-adjusted capital ratios at 31 December 2013 and at 31 December 2012 were as follows:
THE GROUP THE COMPANY2013 2012 2013 2012Rs Rs Rs Rs
Total debt (note 16) 41,292 46,304 33,005 43,799 Less: Cash and cash equivalents (note 31(b)) (56,819) (208,464) (38,464) (192,996)Net debt (15,527) (162,160) (5,459) (149,197)
Total equity/adjusted capital 758,723 773,917 688,242 695,276
Debt-to-adjusted capital ratio N/A N/A N/A N/A
There were no changes in the Group’s approach to capital risk management during the year.
3.3 Fair value estimation
The fair value of financial instruments traded in active markets is based on quoted market prices at the end of the reporting period. A market is regarded as active if quoted prices are readily and regularly available from an exchange, dealer, broker, industry group, pricing service, or regulatory agency, and those prices represent actual and regularly occurring market transactions on an arm’s length basis. The quoted market price used for financial assets held by the Group is the current bid price. These instruments are included in level 1. Instruments included in level 1 comprise primarily quoted equity investments classified as trading securities or available-for-sale.
The fair value of financial instruments that are not traded in an active market is determined by using valuation techniques. These valuation techniques maximise the use of observable market data where it is available and rely as little as possible on specific estimates.
If all significant inputs required to fair value an instrument are observable, the instrument is included in level 2.
If one or more of the significant inputs is not based on observable market data, the instrument is included in level 3.
Specific valuation techniques used to value financial instruments include:
- Quoted market prices or dealer quotes for similar instruments.- Other techniques such as net asset value are used to determine fair value for the remaining financial instruments.
Notes to the Financial StatementsYear ended 31 December 2013

Annual Report 2013 55
4. CRITICAL ACCOUNTING ESTIMATES AND JUDGEMENTS
Estimates and judgements are continuously evaluated and are based on historical experience and other factors, including expectations of future events that are believed to be reasonable under the circumstances.
4.1 Critical accounting estimates and assumptions
The Group makes estimates and assumptions concerning the future. The resulting accounting estimates will, by definition, seldom equal the related actual results. The estimates and assumptions, that have a significant risk of causing a material adjustment to the carrying amounts of assets and liabilities within the next financial year, are discussed below.
(a) Impairment of available-for-sale financial assetsThe Group follows the guidance of IAS 39 on determining when an investment is other- than-temporarily impaired. This determination requires significant judgement. In making this judgement, the Group evaluates, among other factors, the duration and extent to which the fair value of an investment is less than its cost, and the financial health of and near-term business outlook for the investee, including factors such as industry and sector performance and operational and financing cash flows.
(b) Pension benefitsThe present value of the pension obligations depend on a number of factors that are determined on an actuarial basis using a number of assumptions. The assumptions used in determining the net cost for pensions include the discount rate. Any changes in these assumptions will impact the carrying amount of pension obligations.
The Group determines the appropriate discount rate at the end of each year. This is the interest rate that should be used to determine the present value of estimated future cash outflows expected to be required to settle the pension obligations. In determining the appropriate discount rate, the Group considers the interest rates of long term government bonds that are denominated in the currency in which the benefits will be paid, and that have terms to maturity approximating the terms of the related pension obligation.
Other key assumptions for pension obligations are based in part on current market conditions. Additional information is disclosed in Note 18.
(c) Limitation of sensitivity analysisSensitivity analysis in respect of market risk demonstrates the effect of a change in a key assumption while other assumptions remain unchanged. In reality, there is a correlation between the assumptions and other factors. It should also be noted that these sensitivities are non-linear and larger or smaller impacts should not be interpolated or extrapolated from these results. Sensitivity analysis does not take into consideration that the Group’s assets and liabilities are managed. Other limitations include the use of hypothetical market movements to demonstrate potential risk that only represent the Group’s view of possible near-term market changes that cannot be predicted with any certainty.
(d) Asset lives and residual valuesProperty, plant and equipment are depreciated over its useful life taking into account residual values, where appropriate. The actual lives of the assets and residual values are assessed annually and may vary depending on a number of factors. In reassessing asset lives, factors such as technological innovation and maintenance programmes are taken into account. Residual value assessments consider issues such as future market conditions, the remaining life of the asset and projected disposal values. Consideration is also given to the extent of current profits and losses on the disposal of similar assets.
(e) Depreciation policiesProperty, plant and equipments are depreciated to their residual values over their estimated useful lives. The residual value of an asset is the estimated net amount that the Group would currently obtain from disposal of the asset, if the asset were already of the age and in condition expected at the end of its useful life.
The directors therefore make estimates based on historical experience and use best judgement to assess the useful lives of assets at the end of their expected useful lives.
(f) Revenue recognitionThe percentage completion method is utilised to recognise revenue on contracts. Management exercises judgement in assessing whether significant risks and rewards have been transferred to the customer to permit revenue to be recognised.
Notes to the Financial StatementsYear ended 31 December 2013

The Mauritius Chemical and Fertilizer Industry Limited56
5. P
RO
PE
RT
Y,
PL
AN
T A
ND
EQ
UIP
ME
NT
(a) T
HE
GRO
UP
Bu
ild
ings
Pla
nt
an
d
Mac
hin
ery
Fu
rnit
ure
an
d
Eq
uip
me
nt
Fo
rkli
fts
an
d
Pay
load
ers
Mo
tor
Ve
hic
les
Ass
ets
in
p
rog
ress
To
tal
Rs’
00
0R
s’0
00
Rs’
00
0R
s’0
00
Rs’
00
0R
s’0
00
Rs’
00
0C
OST
/DEE
MED
CO
ST A
t 1
Janu
ary
2013
1
85,4
71
143
,861
1
3,58
8 1
5,42
6 1
8,54
4 -
3
76,8
90
Add
ition
s -
1
,753
6
64
-
3,8
60
-
6,2
77
Dis
posa
ls
-
-
-
-
(76
0) -
(
760)
Exc
hang
e di
ffere
nces
(
779)
-
(16
4) -
(
403)
-
(1,
346)
At
31 D
ece
mb
er
20
13
18
4,6
92
1
45
,61
4
14
,08
8
15
,42
6
21
,24
1
-
38
1,0
61
DEP
REC
IAT
ION
At
1 Ja
nuar
y 20
13
127
,300
7
8,59
8 9
,643
6
,327
9
,953
-
2
31,8
21
Cha
rge
for
the
year
5
,488
5
,447
1
,137
2
,501
3
,385
-
1
7,95
8 D
ispo
sal a
djus
tmen
ts
-
-
-
-
(35
9) -
(
359)
Exc
hang
e di
ffere
nces
(
93)
-
(12
2) -
(
604)
-
(81
9)A
t 31 D
ece
mb
er
20
13
13
2,6
95
8
4,0
45
1
0,6
58
8
,82
8
12
,37
5
-
24
8,6
01
NET
BO
OK
VA
LUES
At
31 D
ece
mb
er
20
13
51
,99
7
61
,56
9
3,4
30
6
,59
8
8,8
66
-
1
32
,46
0
(b) T
HE
GRO
UP
CO
ST
/DE
EM
ED
CO
ST
At
1 Ja
nuar
y 20
12
185
,291
1
37,9
96
12,
847
8,0
99
22,
283
1,1
56
367
,672
A
dditi
ons
-
5,8
65
830
6
,171
5
,128
-
1
7,99
4 D
ispo
sals
-
-
(
125)
-
(8,
688)
-
(8,
813)
Tra
nsfe
r -
-
-
1
,156
-
(
1,15
6) -
E
xcha
nge
diffe
renc
es
180
-
3
6 -
(
179)
-
37
At
31 D
ecem
ber
2012
185
,471
1
43,8
61
13,
588
15,
426
18,
544
-
376
,890
DE
PR
EC
IAT
ION
At
1 Ja
nuar
y 20
12
121
,778
7
2,64
6 8
,539
4
,369
1
5,74
4 -
2
23,0
76
Cha
rge
for
the
year
5
,504
5
,952
1
,176
1
,958
3
,001
-
1
7,59
1 D
ispo
sal a
djus
tmen
ts
-
-
(96
) -
(
8,58
9) -
(
8,68
5) E
xcha
nge
diffe
renc
es
18
-
24
-
(20
3) -
(
161)
At
31 D
ecem
ber
2012
127
,300
7
8,59
8 9
,643
6
,327
9
,953
-
2
31,8
21
NE
T B
OO
K V
ALU
ES
At
31 D
ecem
ber
2012
58,
171
65,
263
3,9
45
9,0
99
8,5
91
-
145
,069
Notes to the Financial StatementsYear ended 31 December 2013

Annual Report 2013 57
(b) T
HE
GRO
UP
CO
ST
/DE
EM
ED
CO
ST
At
1 Ja
nuar
y 20
12
185
,291
1
37,9
96
12,
847
8,0
99
22,
283
1,1
56
367
,672
A
dditi
ons
-
5,8
65
830
6
,171
5
,128
-
1
7,99
4 D
ispo
sals
-
-
(
125)
-
(8,
688)
-
(8,
813)
Tra
nsfe
r -
-
-
1
,156
-
(
1,15
6) -
E
xcha
nge
diffe
renc
es
180
-
3
6 -
(
179)
-
37
At
31 D
ecem
ber
2012
185
,471
1
43,8
61
13,
588
15,
426
18,
544
-
376
,890
DE
PR
EC
IAT
ION
At
1 Ja
nuar
y 20
12
121
,778
7
2,64
6 8
,539
4
,369
1
5,74
4 -
2
23,0
76
Cha
rge
for
the
year
5
,504
5
,952
1
,176
1
,958
3
,001
-
1
7,59
1 D
ispo
sal a
djus
tmen
ts
-
-
(96
) -
(
8,58
9) -
(
8,68
5) E
xcha
nge
diffe
renc
es
18
-
24
-
(20
3) -
(
161)
At
31 D
ecem
ber
2012
127
,300
7
8,59
8 9
,643
6
,327
9
,953
-
2
31,8
21
NE
T B
OO
K V
ALU
ES
At
31 D
ecem
ber
2012
58,
171
65,
263
3,9
45
9,0
99
8,5
91
-
145
,069
5. P
RO
PE
RT
Y,
PL
AN
T A
ND
EQ
UIP
ME
NT
(C
ON
T’D
)
(c) T
HE
CO
MPA
NY
Bu
ild
ings
Pla
nt
an
d
Mac
hin
ery
Fu
rnit
ure
an
d
Eq
uip
me
nt
Fo
rkli
fts
an
d
Pay
load
ers
Mo
tor
Ve
hic
les
Ass
ets
in
p
rog
ress
To
tal
Rs’
000
Rs’
00
0R
s’0
00
Rs’
00
0R
s’0
00
Rs’
00
0R
s’0
00
CO
ST/D
EEM
ED C
OST
At
1 Ja
nuar
y 20
13
174
,898
1
43,2
84
10,
259
13,
448
10,
116
-
352
,005
A
dditi
ons
-
1,7
53
509
-
1
,666
-
3
,928
D
ispo
sals
-
-
-
-
(
369)
-
(36
9) A
t 31 D
ece
mb
er
20
13
1
74
,89
8
14
5,0
37
1
0,7
68
1
3,4
48
1
1,4
13
-
3
55
,56
4
DEP
REC
IAT
ION
A
t 1
Janu
ary
2013
1
26,0
32
78,
259
6,9
23
6,0
65
4,6
58
-
221
,937
C
harg
e fo
r th
e ye
ar
5,2
93
5,3
94
933
2
,105
1
,950
-
1
5,67
5 D
ispo
sal a
djus
tmen
ts
-
-
-
-
(35
9) -
(
359)
At
31 D
ece
mb
er
20
13
1
31
,32
5
83
,65
3
7,8
56
8
,17
0
6,2
49
-
2
37
,25
3
NET
BO
OK
VA
LUES
A
t 31 D
ece
mb
er
20
13
4
3,5
73
6
1,3
84
2
,91
2
5,2
78
5
,16
4
-
11
8,3
11
(d) T
HE
CO
MPA
NY
CO
ST
/DE
EM
ED
CO
ST
At
1 Ja
nuar
y 20
12
174
,898
1
37,4
62
9,7
37
8,0
98
13,
768
1,1
56
345
,119
A
dditi
ons
-
5,8
22
648
4
,194
3
,925
-
1
4,58
9 D
ispo
sals
-
-
(
126)
-
(7,
577)
-
(7,
703)
Tra
nsfe
r -
-
-
1
,156
-
(
1,15
6) -
A
t 31
Dec
embe
r 20
12
174
,898
1
43,2
84
10,
259
13,
448
10,
116
-
352
,005
DE
PR
EC
IAT
ION
A
t 1
Janu
ary
2012
1
20,7
39
72,
352
6,1
10
4,3
68
10,
238
-
213
,807
C
harg
e fo
r th
e ye
ar
5,2
93
5,9
07
909
1
,697
1
,898
-
1
5,70
4 D
ispo
sal a
djus
tmen
ts
-
-
(96
) -
(
7,47
8) -
(
7,57
4) A
t 31
Dec
embe
r 20
12
126
,032
7
8,25
9 6
,923
6
,065
4
,658
-
2
21,9
37
NE
T B
OO
K V
ALU
ES
A
t 31
Dec
embe
r 20
12
48,
866
65,
025
3,3
36
7,3
83
5,4
58
-
130
,068
Notes to the Financial StatementsYear ended 31 December 2013

The Mauritius Chemical and Fertilizer Industry Limited58
5. PROPERTY, PLANT AND EQUIPMENT ( CONT’D)
(c) Additions for the Group include Rs1.7m (2012: Rs3.1m) of assets leased under finance leases.
(d) Leased asset included above comprise of motor vehicles: THE GROUP THE COMPANY2013 2012 2013 2012
Rs’000 Rs’000 Rs’000 Rs’000
Cost - capitalised finance lease 4,777 4,256 - - Accumulated depreciation (1,204) (1,766) - - Net book value 3,573 2,490 - -
(e) Depreciation charge has been charged to operating expenses for the Group and the Company.
(f) Bank borrowings are secured by floating charges on the assets of the Group including property, plant and equipment.
6. INTANGIBLE ASSETSTHE GROUP
2013 2012Rs’000 Rs’000
GoodwillAt 1 January and 31 December 115 115
Impairment tests for goodwill: goodwill is allocated to the Group’s cash generating units identified according to the country of operation and business segment.
7. INVESTMENTS IN SUBSIDIARY COMPANIES - COSTTHE COMPANY
2013 2012Rs’000 Rs’000
At 1 January and 31 December 14,268 14,268
Notes to the Financial StatementsYear ended 31 December 2013

Annual Report 2013 59
7. I
NV
ES
TM
EN
TS
IN
SU
BS
IDIA
RY
CO
MP
AN
IES
(C
ON
T’D
)
(a) T
he fi
nanc
ial s
tate
men
ts o
f the
follo
win
g su
bsid
iary
com
pani
es h
ave
been
incl
uded
in t
he c
onso
lidat
ed fi
nanc
ial s
tate
men
ts.
Pro
po
rtio
n o
f vo
tin
g ri
ghts
he
ld
Nam
e of
com
pany
Cla
ss o
fsh
are
sh
eld
Ye
ar
en
dD
eno
min
ated
curr
en
cyS
tate
dca
pit
alD
ire
ct%
Ind
ire
ct
%
Co
un
try o
f o
pe
rati
on
&
inco
rpo
rati
on
Main
bu
sin
ess
31 D
ecem
ber
201
3 an
d 2
012
MC
FI (
Free
port
) Lt
d O
rdin
ary
31 D
ecem
ber
Rs
10,0
00,0
00
100
-
M
auri
tius
Trad
ing
free
port
com
pany
MC
FI In
tern
atio
nal (
Zam
bia)
Ltd
Ord
inar
y31
Dec
embe
r Z
K 5
,000
,000
-
1
00.0
0 Z
ambi
aTr
adin
g of
che
mic
als
and
gene
ral
good
sM
CFI
Inte
rnat
iona
l & C
o Lt
d O
rdin
ary
31 D
ecem
ber
Euro
451
,431
1
00
-
Mau
ritiu
sTr
adin
g co
mpa
nyC
oolk
ote
Ente
rpri
ses
Ltd
Ord
inar
y31
Dec
embe
r R
s 2
5,00
0 1
00
-
Mau
ritiu
sW
ater
proo
fing
Notes to the Financial StatementsYear ended 31 December 2013

The Mauritius Chemical and Fertilizer Industry Limited60
8. INVESTMENTS IN ASSOCIATES (COST)THE COMPANY
(a) (In separate financial statements of the investor) 2013 2012Rs’000 Rs’000
At 1 January 25,268 22,301 Additions 12,906 8,600 Disposal - (5,633)At 31 December 38,174 25,268
(b) The results of the following associated companies have been included in the consolidated financial statements:
THE GROUP2013 2012
Rs’000 Rs’000
At 1 January 7,698 37,777 Additions 12,906 8,600 Disposal - (29,629)Share of loss after tax - attributable to continuing operations (7,727) (18,335)Share of profit after tax - attributable to discontinued operations - 10,754 Exchange differences - (290)Dividend - (1,179)At 31 December 12,877 7,698
Made up as follows:Share of net assets 12,877 7,698 Goodwill on acquisition - -
12,877 7,698
(c) Details of each of the associates at the end of the reporting period are as follows:
NameNature of business Year end
Place of incorporation and operation
Proportion of ownership
interestDirect%
31 December 2013Rehm Grinaker Construction Co Ltd Construction 30 June Mauritius 21.50Rehm Grinaker Properties Co Ltd Property holding 30 June Mauritius 21.50Elcon System Technick (Mtius) Ltd Trading 30 June Mauritius 50.00
31 December 2012Rehm Grinaker Construction Co Ltd Construction 30 June Mauritius 21.50Rehm Grinaker Properties Co Ltd Property holding 30 June Mauritius 21.50Elcon System Technick (Mtius) Ltd Trading 30 June Mauritius 50.00
Note 1: Société d’Engrais et de Produits Chimiques de Madagascar has been disposed in 2012.
Notes to the Financial StatementsYear ended 31 December 2013

Annual Report 2013 61
8. I
NV
ES
TM
EN
TS
IN
AS
SO
CIA
TE
S (
CO
NT
’D)
(i) A
ll of
the
abo
ve a
ssoc
iate
s ar
e ac
coun
ted
for
usin
g th
e eq
uity
met
hod
with
the
exc
eptio
n of
Elc
on S
yste
m T
echn
ick
(Mtiu
s) L
td w
hich
has
bee
n ke
pt a
t co
st s
ince
the
latt
er is
a
dorm
ant
com
pany
.
(ii)
For
the
purp
oses
of a
pply
ing
the
equi
ty m
etho
d of
acc
ount
ing,
the
finan
cial
sta
tem
ents
of e
ach
asso
ciat
es, w
ith t
he e
xcep
tion
of E
lcon
Sys
tem
Tec
hnic
k (M
tius)
Ltd
whi
ch is
a
dorm
ant
com
pany
, for
the
yea
r en
ded
30 Ju
ne 2
013
have
bee
n us
ed, a
nd a
ppro
pria
te a
djus
tmen
ts h
ave
been
mad
e fo
r th
e ef
fect
s of
sig
nific
ant
tran
sact
ions
bet
wee
n th
at d
ate
and
31 D
ecem
ber
2013
.
(d)
Su
mm
ari
sed
fin
an
cial
in
form
atio
nSu
mm
aris
ed fi
nanc
ial i
nfor
mat
ion
in r
espe
ct o
f eac
h of
the
mat
eria
l ass
ocia
tes
is s
et o
ut b
elow
.
Nam
e
Cu
rre
nt
asse
tsN
on
-cu
ren
t as
sets
Cu
rre
nt
liab
ilit
ies
No
n-C
urr
ent
liab
ilit
ies
Rev
enu
esP
rofi
t/(l
oss
)
Oth
er
com
pre
hen
sive
in
com
e f
or
the
ye
ar
To
tal
com
pre
hen
sive
in
com
e f
or
the
ye
ar
Div
ide
nd
s re
ceiv
ed
d
uri
ng
the
ye
ar
Rs’
00
0R
s’0
00
Rs’
00
0R
s’0
00
Rs’
00
0R
s’0
00
Rs’
00
0R
s’0
00
Rs’
00
031 D
ece
mb
er
20
13
Reh
m G
rina
ker
Con
stru
ctio
n C
o Lt
d1
,05
5,5
57
2
2,1
78
1
,06
9,9
15
-
2
,24
3,4
56
2
2,1
74
-
2
2,1
74
-
R
ehm
Gri
nake
r Pr
oper
ties
Co
Ltd
7,2
66
1
61
,57
8
1,4
48
1
19
,06
0
11
,35
5
16
,24
0
-
16
,24
0
-
31 D
ece
mb
er
20
12
Reh
m G
rina
ker
Con
stru
ctio
n C
o Lt
d 9
56,8
20
22,
034
999
,349
5
3,85
9 1
,795
,408
(1
24,5
32)
-
(12
4,53
2) -
R
ehm
Gri
nake
r Pr
oper
ties
Co
Ltd
19,
552
144
,872
8
,003
1
24,3
25
10,
276
(6,
064)
-
(6,
064)
-
The
sum
mar
ised
fina
ncia
l inf
orm
atio
n ab
ove
repr
esen
ts a
mou
nts
show
n in
the
ass
ocia
tes’
fina
ncia
l sta
tem
ents
pre
pare
d in
acc
orda
nce
with
IFR
S.
Notes to the Financial StatementsYear ended 31 December 2013

The Mauritius Chemical and Fertilizer Industry Limited62
8. I
NV
ES
TM
EN
TS
IN
AS
SO
CIA
TE
S (
CO
NT
’D)
(e)
Rec
onci
liatio
n of
sum
mar
ised
fina
ncia
l inf
orm
atio
n
Nam
eO
peni
ng n
et
asse
ts
1 Ja
nuar
yIn
crea
se in
sh
are
capi
tal
Profi
t/(lo
ss)
or t
he y
ear
Oth
er
com
preh
en-
sive
inco
me
for
the
year
Clo
sing
net
as
sets
31
Dec
embe
rO
wne
rshi
p in
tere
stIn
tere
st in
as
soci
ates
Goo
dwill
Car
ryin
g va
lue
Rs’
000
Rs’
000
Rs’
000
Rs’
000
Rs’
000
Rs’
000
%R
s’00
0R
s’00
031 D
ece
mb
er
20
13
Reh
m G
rina
ker
Con
stru
ctio
n C
o Lt
d (
74,3
54)
60,
000
22,
174
-
7,8
20
1,6
87
21.
50
-
1,6
87
Reh
m G
rina
ker
Prop
ertie
s C
o Lt
d 3
2,09
6 -
1
6,24
0 -
4
8,33
6 1
0,39
2 2
1.50
-
1
0,39
2 To
tal
(42
,258
) 6
0,00
0 3
8,41
4 -
5
6,15
6 1
2,07
9 -
1
2,07
9
31 D
ece
mb
er
20
12
Reh
m G
rina
ker
Con
stru
ctio
n C
o Lt
d 5
0,17
8 -
(1
24,5
32)
-
(74
,354
) (
15,9
86)
21.
50
-
-
Reh
m G
rina
ker
Prop
ertie
s C
o Lt
d 3
8,16
0 -
(
6,06
4) -
3
2,09
6 6
,900
2
1.50
-
6
,900
To
tal
88,
338
-
(130
,596
) -
(
42,2
58)
(9,
086)
-
6,9
00
(f) A
ggre
gate
info
rmat
ion
of a
ssoc
iate
s th
at a
re n
ot in
divi
dual
ly m
ater
ial
Elco
n Sy
stem
Tec
hnic
k (M
tius)
Ltd
20
13
2012
Rs’
00
0R
s’00
0
Car
ryin
g am
ount
of i
nter
ests
79
8 7
98
Shar
e of
pro
fit/(
loss
) -
-
Sh
are
of o
ther
com
preh
ensi
ve in
com
e -
-
Sh
are
of t
otal
com
preh
ensi
ve in
com
e -
-
(g)
Loss
es n
ot r
ecog
nise
d am
ount
ed t
o R
sNil
(201
2: R
s10.
1m)
for
Reh
m G
rina
ker
Con
stru
ctio
n C
o Lt
d. T
he a
ccum
ulat
ed lo
sses
not
rec
ogni
sed
wer
e R
sNil
(201
2: R
s10.
1m).
Notes to the Financial StatementsYear ended 31 December 2013

Annual Report 2013 63
9. INVESTMENTS IN FINANCIAL ASSETS
The movement in investments in fiancial assets may be summarised as follows:THE GROUP ANDTHE COMPANY
2013 2012Available-for-sale financial assets Rs’000 Rs’000
At 1 January 17,319 24,341 Repayment of excess funds on application of shares (100) (100)Decrease in fair value (1,099) (6,904)Disposal - (18)At 31 December 16,120 17,319
(a) Equity securities at fair value:- DEM 14,113 15,212 - Unquoted 2,007 2,107 Total available-for-sale financial assets 16,120 17,319
Level 1 Level 2 Level 3 Total Rs’000 Rs’000 Rs’000 Rs’000
At 31 December 2013 14,113 - 2,007 16,120
At 31 December 2012 15,212 - 2,107 17,319
(b) All available-for-sale financial assets are denominated in Mauritian Rupee.
(c) Available-for-sale securities comprise principally of DEM listed and unquoted investments. The fair value of DEM listed securities is based on the stock exchange prices at the close of business at the reporting date. In assessing the fair value of unquoted available-for-sale securities, the Group uses a variety of methods and makes assumptions that are based on market conditions existing at end of each reporting date.
(d) The table below shows the changes in level 3 instruments 2013 2012Rs’000 Rs’000
At 1 January 2,107 2,207 Repayment of excess funds on application of shares (100) (100)Closing balance 2,007 2,107
10. NON-CURRENT RECEIVABLESTHE GROUP AND THE COM-
PANY2013 2012
Rs’000 Rs’000Loans to related parties:- Holding company 303,026 - - Directors and key management personnel 1,000 -
304,026 -
Loan to holding company are repayable in 18 months and bear interest in the range of 7% -7.5% p.a. The loan to directors and key management personnel is not repayable within one year and carries interest at 7.5% p.a.
Notes to the Financial StatementsYear ended 31 December 2013

The Mauritius Chemical and Fertilizer Industry Limited64
11. INVENTORIESTHE GROUP THE COMPANY
2013 2012 2013 2012Rs’000 Rs’000 Rs’000 Rs’000
Raw materials 92,246 133,329 85,467 106,523 Finished goods 93,315 86,708 35,441 46,708 Bags 8,718 6,644 8,718 6,644 Others 5,637 6,790 5,637 6,790
199,916 233,471 135,263 166,665
(a) The cost of inventories recognised as expense and included in cost of sales for the Group amounted to Rs646m (2012: Rs635m) and Rs450m (2012: Rs397m) for the Company.
(b) Bank borrowings of the Company and its subsidiaries are secured by floating charges on the assets of the relevant Company including inventories.
12. TRADE AND OTHER RECEIVABLESTHE GROUP THE COMPANY
2013 2012 2013 2012Rs’000 Rs’000 Rs’000 Rs’000
Trade receivables 232,638 235,143 149,939 131,997 Less provision for impairment (5,224) (4,037) (1,753) (1,753)
227,414 231,106 148,186 130,244 Receivable from disposal of associate - 34,581 - 34,581 Other receivables and prepayments 9,324 9,311 8,356 8,704 Due from customers for work performed but not yet invoiced - net 20,237 21,556 - - Amounts receivable from related companies 14,935 20,435 68,332 121,458
271,910 316,989 224,874 294,987
The carrying amount of trade and other receivables approximate their fair value.
At 31 December 2013, trade receivables and due from customers for work performed but not yet invoiced were impaired. The amount of provision was Rs8.8m as of 31 December 2013 (2012: Rs4.0m) for the Group and Rs1.8m (2012: Rs1.8m) for the Company. The individually impaired receivables mainly relate to independent customers, which are in unexpectedly difficult economic situations. It was assessed that a portion of the receivables is expected to be recovered. The ageing of these receivables is as follows:
THE GROUP THE COMPANY2013 2012 2013 2012
Rs’000 Rs’000 Rs’000 Rs’000
Over 6 months 8,852 4,037 1,753 1,753
At 31 December 2013, trade receivables of Rs55.4m (2012: Rs32.0m) for the Group and Rs23.8m (2011: Rs4.9m) for the Company were past due but not impaired. These relate to independent customers for whom there is no recent history of default. The ageing analysis of these trade receivables is as follows:
THE GROUP THE COMPANY2013 2012 2013 2012
Rs’000 Rs’000 Rs’000 Rs’000
3 to 6 months 21,030 26,139 20,944 4,072 Over 6 months 34,351 5,867 2,911 821
55,381 32,006 23,855 4,893
Notes to the Financial StatementsYear ended 31 December 2013
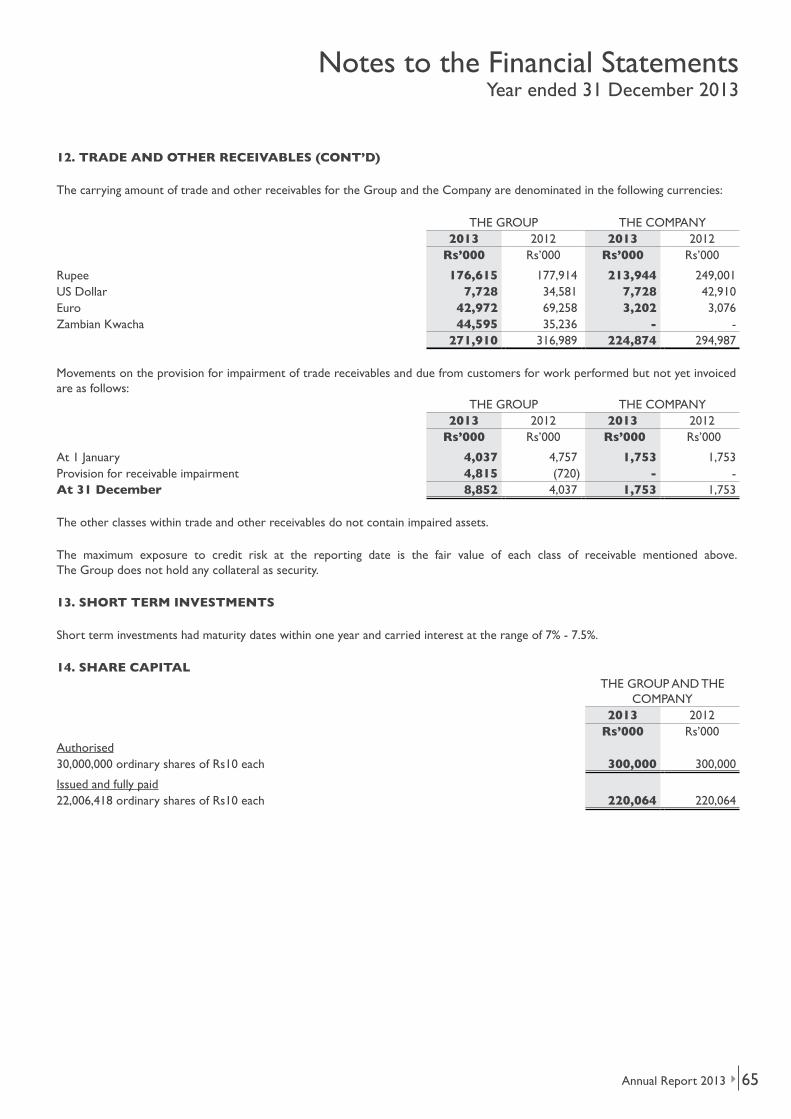
Annual Report 2013 65
12. TRADE AND OTHER RECEIVABLES (CONT’D)
The carrying amount of trade and other receivables for the Group and the Company are denominated in the following currencies:
THE GROUP THE COMPANY2013 2012 2013 2012
Rs’000 Rs’000 Rs’000 Rs’000
Rupee 176,615 177,914 213,944 249,001 US Dollar 7,728 34,581 7,728 42,910 Euro 42,972 69,258 3,202 3,076 Zambian Kwacha 44,595 35,236 - -
271,910 316,989 224,874 294,987
Movements on the provision for impairment of trade receivables and due from customers for work performed but not yet invoiced are as follows:
THE GROUP THE COMPANY2013 2012 2013 2012
Rs’000 Rs’000 Rs’000 Rs’000
At 1 January 4,037 4,757 1,753 1,753 Provision for receivable impairment 4,815 (720) - - At 31 December 8,852 4,037 1,753 1,753
The other classes within trade and other receivables do not contain impaired assets.
The maximum exposure to credit risk at the reporting date is the fair value of each class of receivable mentioned above. The Group does not hold any collateral as security.
13. SHORT TERM INVESTMENTS
Short term investments had maturity dates within one year and carried interest at the range of 7% - 7.5%.
14. SHARE CAPITALTHE GROUP AND THE
COMPANY2013 2012
Rs’000 Rs’000Authorised30,000,000 ordinary shares of Rs10 each 300,000 300,000
Issued and fully paid22,006,418 ordinary shares of Rs10 each 220,064 220,064
Notes to the Financial StatementsYear ended 31 December 2013

The Mauritius Chemical and Fertilizer Industry Limited66
15. OTHER COMPREHENSIVE INCOME
THE GROUP
Notes Revaluation
reserve
Available- for- sale fair value reserve
Translation Reserve
Actuarial (losses)/
gains2013 Rs’000 Rs’000 Rs’000 Rs’000Items that will not be reclassified to profit or loss:Actuarial losses on retirement benefit obligation 18 - - - (629)Deferred tax relating to actuarial losses on retirement benefit obligations 17 - - - 91
Items that may be reclassified subsequently to profit or loss:Currency translation differences - - (3,615) - Decrease in fair value of available-for-sale financial assets 9 - (1,099) - -
- (1,099) (3,615) (538)
2012Items that will not be reclassified to profit or loss:Actuarial losses on retirement benefit obligation 18 - - - (43)Deferred tax relating to actuarial losses on retirement benefit obligations 17 - - - 12
Items that may be reclassified subsequently to profit or loss:Currency translation differences - - 3,523 - Decrease in fair value of available-for-sale financial assets 9 - (6,904) - -
- (6,904) 3,523 (31)
THE COMPANY
Notes
Available- for- sale fair value reserve
Restated Actuarial (losses)/
gains2013 Rs’000 Rs’000
Items that will not be reclassified to profit or loss:Actuarial losses on retirement benefit obligation 18 - (716)Deferred tax relating to actuarial losses on retirement benefit obligations 17 - 107
Items that may be reclassified subsequently to profit or loss:Decrease in fair value of available-for-sale financial assets 9 (1,099) -
(1,099) (609)
Notes to the Financial StatementsYear ended 31 December 2013

Annual Report 2013 67
15. OTHER COMPREHENSIVE INCOME (CONT’D)
THE COMPANY (CONT’D)
Notes
Available- for- sale fair value reserve
Restated Actuarial (losses)/
gains2012 Rs’000 Rs’000Items that will not be reclassified to profit or loss:Actuarial losses on retirement benefit obligation 18 - (80)Deferred tax relating to actuarial losses on retirement benefit obligations 17 - 12
Items that may be reclassified subsequently to profit or loss:Decrease in fair value of available-for-sale financial assets 9 (6,904) -
(6,904) (68)
Revaluation reserveThe revaluation reserve relates to the revaluation of buildings.
Available-for-sale fair value reserveAvailable-for-sale fair value reserve comprises the cumulative net change in the fair value of available-for-sale financial assets that has been recognised in other comprehensive income until the investments are derecognised or impaired.
Translation reserveThe translation reserve comprises all foreign currency differences arising from the translation of the financial statements of foreign operations.
Actuarial (losses)/gainsThe actuarial (losses)/gains reserve represents the cumulative remeasurement of defined benefit obligation recognised.
16. BORROWINGSTHE GROUP THE COMPANY
2013 2012 2013 2012Rs’000 Rs’000 Rs’000 Rs’000
CurrentBank loans 3,992 27,166 - 27,166 Bank overdraft 33,872 16,633 33,005 16,633 Obligations under finance leases (note 16(b)) 1,058 599 - -
38,922 44,398 33,005 43,799 Non-currentObligations under finance leases (note 16(b)) 2,370 1,906 - -
Total borrowings 41,292 46,304 33,005 43,799
(a) The borrowings include secured liabilities for the Group (bank loans, bank overdraft and leases amounting to Rs41.2m (2012: Rs46.3mm)) and for the Company (bank loans, bank overdraft and leases amounting to Rs33.0m (2012: Rs43.8). The bank borrowings are secured over certain land and buildings, inventories and current assets of the Group. The rates of interest on these facilities vary between 7.15% and 26% (2012: 4% and 26%). Lease liabilities are effectively secured as the rights to the leased assets revert to the lessor in the event of default.
The leases have purchase options on termination. There are no restrictions imposed on the Company by lease arrangements.
Notes to the Financial StatementsYear ended 31 December 2013
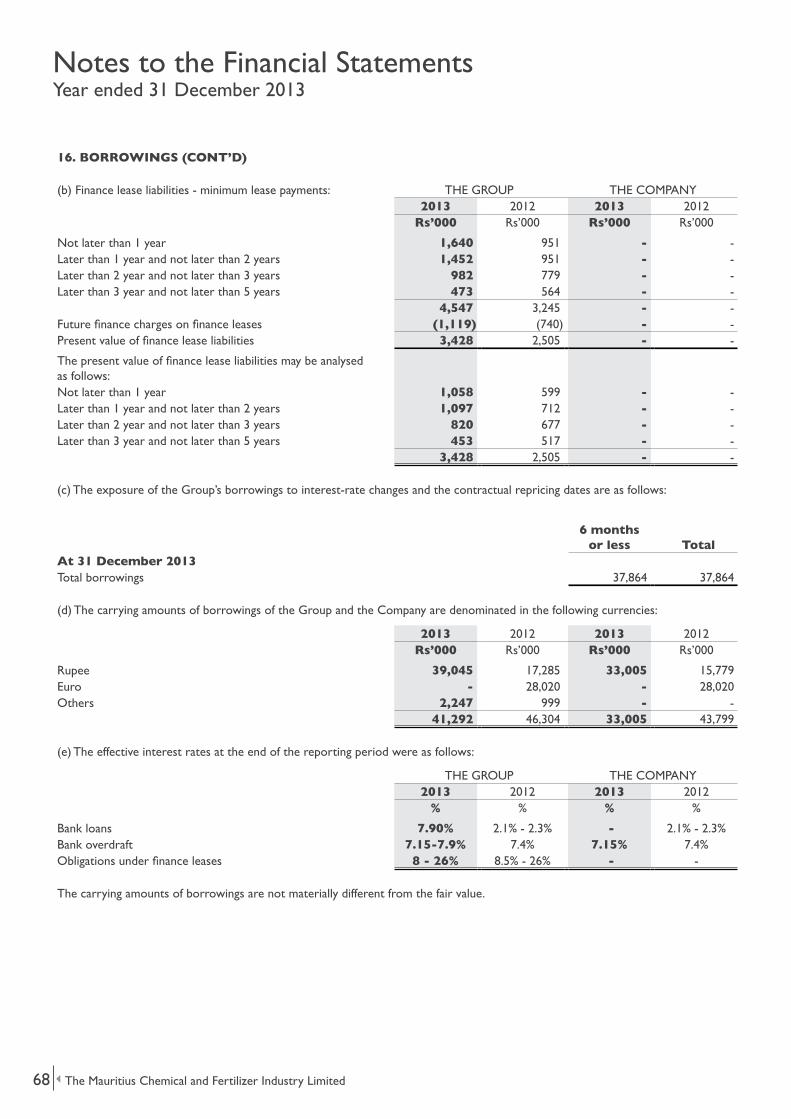
The Mauritius Chemical and Fertilizer Industry Limited68
16. BORROWINGS (CONT’D)
(b) Finance lease liabilities - minimum lease payments: THE GROUP THE COMPANY2013 2012 2013 2012
Rs’000 Rs’000 Rs’000 Rs’000
Not later than 1 year 1,640 951 - - Later than 1 year and not later than 2 years 1,452 951 - - Later than 2 year and not later than 3 years 982 779 - - Later than 3 year and not later than 5 years 473 564 - -
4,547 3,245 - - Future finance charges on finance leases (1,119) (740) - - Present value of finance lease liabilities 3,428 2,505 - -
The present value of finance lease liabilities may be analysed as follows:Not later than 1 year 1,058 599 - - Later than 1 year and not later than 2 years 1,097 712 - - Later than 2 year and not later than 3 years 820 677 - - Later than 3 year and not later than 5 years 453 517 - -
3,428 2,505 - -
(c) The exposure of the Group’s borrowings to interest-rate changes and the contractual repricing dates are as follows:
6 months or less Total
At 31 December 2013Total borrowings 37,864 37,864
(d) The carrying amounts of borrowings of the Group and the Company are denominated in the following currencies:
2013 2012 2013 2012Rs’000 Rs’000 Rs’000 Rs’000
Rupee 39,045 17,285 33,005 15,779 Euro - 28,020 - 28,020 Others 2,247 999 - -
41,292 46,304 33,005 43,799
(e) The effective interest rates at the end of the reporting period were as follows:
THE GROUP THE COMPANY2013 2012 2013 2012
% % % %
Bank loans 7.90% 2.1% - 2.3% - 2.1% - 2.3%Bank overdraft 7.15-7.9% 7.4% 7.15% 7.4%Obligations under finance leases 8 - 26% 8.5% - 26% - -
The carrying amounts of borrowings are not materially different from the fair value.
Notes to the Financial StatementsYear ended 31 December 2013

Annual Report 2013 69
17. DEFERRED INCOME TAX
Deferred income tax are calculated on all temporary differences under the liability method at 15% (2012: 15%).
There is a legally enforceable right to offset current tax assets against current tax liabilities and deferred income tax assets and liabilities when the deferred income taxes relate to the samefiscal authority on the same entity. The following amounts are shown in the statements of financial position:
THE GROUP THE COMPANYRestated Restated
2013 2012 2013 2012Rs’000 Rs’000 Rs’000 Rs’000
Deferred income tax liabilities 14,005 14,456 11,705 11,043
At the end of the reporting period, the Group and the Company had unused tax losses of Rs5.8m. (2012: Rs6.9m) available for offset against future profits. No deferred tax asset has been recognised in 2013 for these tax losses due to unpredictability of future profit streams. A deferred tax asset has been recognised in respect of the Rs6.9m tax losses in 2012. The tax losses expire on a rolling basis over 5 years.
The movement on the deferred income tax account is as follows:THE GROUP THE COMPANY
2013 2012 2013 2012Rs’000 Rs’000 Rs’000 Rs’000
At 1 January - as previously reported 14,159 14,274 10,746 10,548 - effect of adopting IAS 19 (Revised) 297 338 297 337 -as restated 14,456 14,612 11,043 10,885 Exchange differences (note 20(b)) (252) 113 - - Profit or loss (credit)/charge (note 20(b)) (108) (257) 769 170 Credited to other comprehensive income (91) (12) (107) (12)At 31 December 14,005 14,456 11,705 11,043
The movement in deferred tax assets and liabilities during the year, without taking into consideration the offsetting of balances within the same fiscal authority on the same entity, is as follows:
THE GROUP At 1 January 2013
2013
As Previously reported
Effect of adopting IAS 19
(Revised)As
restated
(Credited)/ charged to profit or
loss
(Credited)/ charged to
other comprehensive
income
At 31 December
2013Rs’000 Rs’000 Rs’000 Rs’000 Rs’000 Rs’000
Deferred income tax liabilitiesAccelerated tax depreciation 14,817 - 14,817 (12) - 14,805 Other temporary differences 1,216 - 1,216 (793) - 423
Deferred tax assetsRetirement benefit obligations (831) 297 (534) (598) (91) (1,223)Tax losses (1,043) - (1,043) 1,043 - - Net deferred income tax liabilities 14,159 297 14,456 (360) (91) 14,005
Notes to the Financial StatementsYear ended 31 December 2013

The Mauritius Chemical and Fertilizer Industry Limited70
17. DEFERRED INCOME TAX (CONT’D)
At 1 January 2012
2012
As Previously reported
Effect of adopting IAS 19
(Revised)As
restated
Charged/ (credited)
to profit orloss
Credited toother
comprehensive income
At 31 December
2012Rs’000 Rs’000 Rs’000 Rs’000 Rs’000 Rs’000
Deferred income tax liabilitiesAccelerated tax depreciation 13,481 - 13,481 1,336 - 14,817 Other temporary differences 1,590 - 1,590 (375) - 1,215
Deferred tax assetsRetirement benefit obligations (797) 338 (459) (62) (12) (533)Tax losses - - - (1,043) - (1,043)Net deferred income tax liabilities 14,274 338 14,612 (144) (12) 14,456
THE COMPANY At 1 January 2013
2013
As Previously reported
Effect of adopting IAS 19
(Revised)As
restated
Charged/ (credited) to profit or
loss
Credited to other
comprehensive income
At 31 December
2013Rs’000 Rs’000 Rs’000 Rs’000 Rs’000 Rs’000
Deferred income tax liabilitiesAccelerated tax depreciation 12,620 - 12,620 54 - 12,674
Deferred tax assetsRetirement benefit obligations (831) 297 (534) (328) (107) (969)Tax losses (1,043) - (1,043) 1,043 - - Net deferred income tax liabilities 10,746 297 11,043 769 (107) 11,705
At 1 January 2012
2012
As Previously reported
Effect of adopting IAS 19
(Revised)As
restated
Charged/ (credited)
to profit orloss
Credited to other
comprehensive income
At 31 December
2012Rs’000 Rs’000 Rs’000 Rs’000 Rs’000 Rs’000
Deferred income tax liabilitiesAccelerated tax depreciation 11,345 - 11,345 1,275 - 12,620
Deferred tax assetsRetirement benefit obligations (797) 337 (460) (62) (12) (534)Net deferred income tax liabilities - - - (1,043) - (1,043)
10,548 337 10,885 170 (12) 11,043
Notes to the Financial StatementsYear ended 31 December 2013

Annual Report 2013 71
18. RETIREMENT BENEFIT OBLIGATIONSTHE GROUP THE COMPANY
2013 2012 2013 2012Rs’000 Rs’000 Rs’000 Rs’000
Restated RestatedAmounts recognised in the statements of financial positionDefined pension benefits (note 18 (a) (ii)) 3,052 2,085 3,052 2,085 Other post retirement benefits (note 18 (b) (ii)) 5,106 2,611 3,413 1,476
8,158 4,696 6,465 3,561
Analysed as follows:Non current liabilities 8,158 4,696 6,465 3,561
THE GROUP THE COMPANY2013 2012 2013 2012
Rs’000 Rs’000 Rs’000 Rs’000Restated Restated
Amounts charged to profit or lossDefined pension benefits (note 18 (a)(vi)) 899 341 899 341 Other post retirement benefits (note 18 (b)(i)) 2,034 393 1,389 175
2,933 734 2,288 516
THE GROUP THE COMPANY2013 2012 2013 2012
Rs’000 Rs’000 Rs’000 Rs’000Restated Restated
Amounts charged/(credited) to other comprehensive incomeDefined pension benefits (note 18 (a)(ix)) 168 88 168 88 Other post retirement benefits (note 18 (b)(v)) 461 (45) 548 (8)
629 43 716 80
(a) Defined pension benefits
(i) The Group operates a defined benefit pension. The plan is a final salary plan, which provides benefits to members in the form of a guaranteed level of pension payables for life and a benefit on death or disablement in service before retirement. The level of benefits provided depends on members’ length of service and their salary in the final years leading to retirement.
The assets of the fund are held independently and administered by The Anglo Mauritius Assurance Society Ltd.
The most recent actuarial valuation of the plan assets and the present value of the defined benefit obligations were carried out at 31 December 2013 by The Anglo Mauritius Assurance Society Ltd (Actuarial Valuer). The present value of the defined benefit obligations, and the related current service cost and past service cost, were measured using the Projected Unit Credit Method.
Notes to the Financial StatementsYear ended 31 December 2013
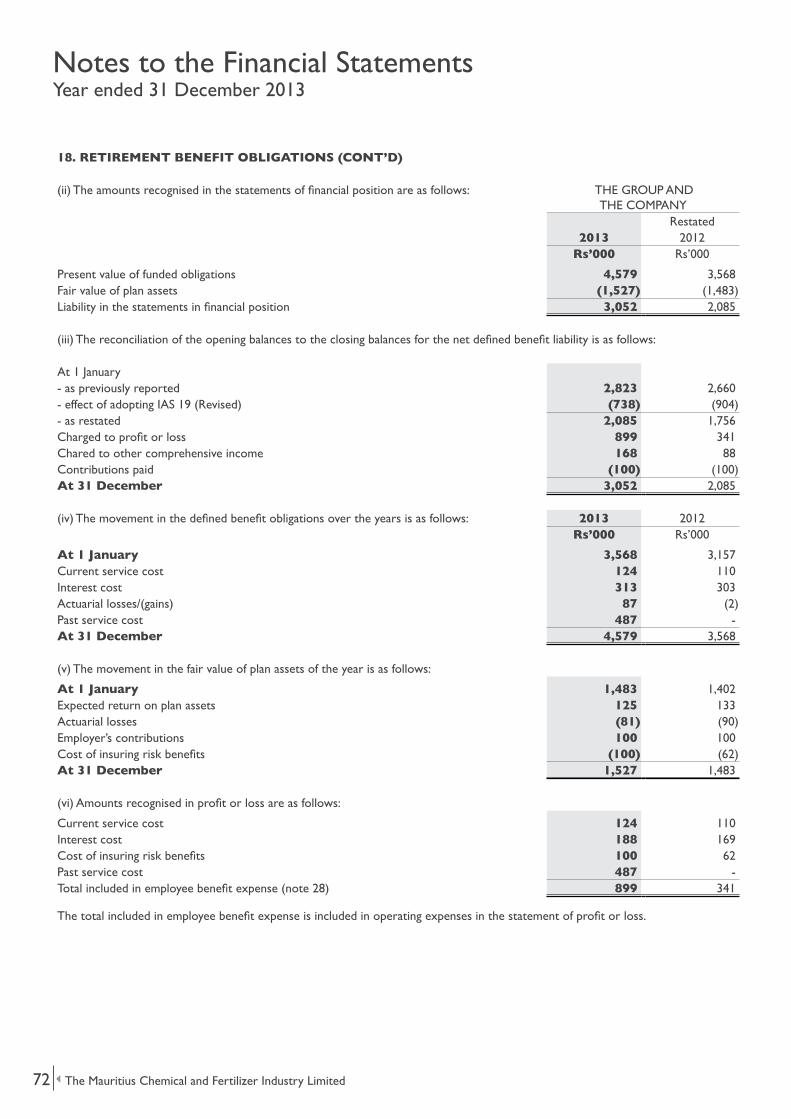
The Mauritius Chemical and Fertilizer Industry Limited72
18. RETIREMENT BENEFIT OBLIGATIONS (CONT’D)
(ii) The amounts recognised in the statements of financial position are as follows: THE GROUP ANDTHE COMPANY
Restated2013 2012
Rs’000 Rs’000
Present value of funded obligations 4,579 3,568 Fair value of plan assets (1,527) (1,483)Liability in the statements in financial position 3,052 2,085
(iii) The reconciliation of the opening balances to the closing balances for the net defined benefit liability is as follows:
At 1 January- as previously reported 2,823 2,660 - effect of adopting IAS 19 (Revised) (738) (904)- as restated 2,085 1,756 Charged to profit or loss 899 341 Chared to other comprehensive income 168 88 Contributions paid (100) (100)At 31 December 3,052 2,085
(iv) The movement in the defined benefit obligations over the years is as follows: 2013 2012Rs’000 Rs’000
At 1 January 3,568 3,157 Current service cost 124 110 Interest cost 313 303 Actuarial losses/(gains) 87 (2)Past service cost 487 - At 31 December 4,579 3,568
(v) The movement in the fair value of plan assets of the year is as follows:
At 1 January 1,483 1,402 Expected return on plan assets 125 133 Actuarial losses (81) (90)Employer’s contributions 100 100 Cost of insuring risk benefits (100) (62)At 31 December 1,527 1,483
(vi) Amounts recognised in profit or loss are as follows:
Current service cost 124 110 Interest cost 188 169 Cost of insuring risk benefits 100 62 Past service cost 487 - Total included in employee benefit expense (note 28) 899 341
The total included in employee benefit expense is included in operating expenses in the statement of profit or loss.
Notes to the Financial StatementsYear ended 31 December 2013

Annual Report 2013 73
18. RETIREMENT BENEFIT OBLIGATIONS (CONT’D)THE GROUP ANDTHE COMPANY
2013 2012Rs’000 Rs’000
(vii) Actual return on plan assets 44 43
(viii) The fair value of the plan assets at the end of the reporting period is as follows:
THE GROUP AND THE COMPANY2013 2013 2012 2012
Rs’000 % Rs’000 %
Insured contracts 1,483 100% 1,401 100%
(ix) The amounts recognised in other comprehensive income are as follows:THE GROUP ANDTHE COMPANY
Restated 2013 2012
Rs’000 Rs’000
Losses on pension scheme assets 81 90 Experience loss/(gain) on liabilities 69 (9)Changes in assumptions underlying the present value of the scheme 18 7
168 88
(x) Cumulative actuarial gains recognisedTHE GROUP ANDTHE COMPANY
Restated 2013 2012
Rs’000 Rs’000At 1 January- as previously reported - - - effect of adopting IAS 19 (Revised) 816 904 - as restated 816 904 Actuarial losses recognised for the year (168) (88)At 31 December 648 816
(xi) Principal actuarial assumptions used for accounting purposes were:THE GROUP ANDTHE COMPANY
2013 2012% %
Discount rate 7.00 8.50 Expected return on plan assets 7.00 8.50 Future salary increases 5.00 6.50 Future guaranteed pension increase 0.00 0.00
Notes to the Financial StatementsYear ended 31 December 2013

The Mauritius Chemical and Fertilizer Industry Limited74
18. RETIREMENT BENEFIT OBLIGATIONS (CONT’D)
Sensitivity analysis on defined benefit obligations at end of the reporting date:
31 December 2013 Increase Decrease Rs’000 Rs’000
Discount rate (1% increase) - 132 Future long term salary assumption (1% increase) 128 -
An increase/decrease of 1% in other principal actuarial assumptions would not have a material impact on defined benefit obligations at the end of the reporting period.
The sensitivity above have been determined based on a method that extrapolates the impact on net defined benefit obligation as a result of reasonable changes in key assumptions occurring at the end of the reporting period. The present value of the defined benefit obligation has been calculated using the projected unit credit method.
The sensitivity analysis may not be representative of the actual change in the defined benefit obligation as it is unlikely that the change in assumptions would occur in isolation of one another as some of the assumptions may be correlated.
There was no change in the methods and assumptions used in preparing the sensitivity analysis from prior years.
The defined benefit pension plan exposes the Group to actuarial risks, such as longevity risk, currency risk, interest rate risk and market (investment) risk.
The funding requirements are based on the pension fund’s actuarial measurement framework set out in the funding policies of the plan.
(xii) The assets of the plan is based on the reserves held for the Deferred Annuity policies for statutory purposes. This asset value is a notional value and assumes that the scheme is on a going concern.
(xiii) The Company is expected to contribute Rs138,459 to the pension scheme for the year ending 31 December 2014.
(xiv) Amount for the current and previous four years are as follows:
2013 2012 2011 2010 2009Rs’000 Rs’000 Rs’000 Rs’000 Rs’000
Present value of defined benefit obligation (4,579) (3,568) (3,157) (2,937) (2,512)Fair value of plan assets 1,527 1,483 1,401 1,334 1,205 Deficit (3,052) (2,085) (1,756) (1,603) (1,307)Experience losses/(gains) on plan liabilities (87) 2 193 (69) 512 Experience losses on plan assets (81) (90) (8) (67) (70)
Notes to the Financial StatementsYear ended 31 December 2013

Annual Report 2013 75
18. RETIREMENT BENEFIT OBLIGATIONS (CONT’D)
(b) Other post retirement benefitsOther post retirement benefits comprise gratuities payable under the Employment Rights Act 2008.
(i) Amounts recognised in profit or loss THE GROUP THE COMPANYRestated Restated
2013 2012 2013 2012Rs’000 Rs’000 Rs’000 Rs’000
Current service cost 171 169 46 50 Interest cost 222 224 115 125 Past service cost 1,641 - 1,228 - Total included in employee benefit expense (note 28) 2,034 393 1,389 175
(ii) Movement in the liability recognised in the statements of financial position
THE GROUP THE COMPANYRestated Restated
2013 2012 2013 2012Rs’000 Rs’000 Rs’000 Rs’000
At 1 January- as previously reported 3,875 3,595 2,719 2,657 - effect of adopting IAS 19 (Revised) (1,264) (1,332) (1,243) (1,348)- as restated 2,611 2,263 1,476 1,309 Total expense as above 2,034 393 1,389 175 Actuarial losses/(gains) recognised in other comprehensive income 461 (45) 548 (8)At 31 December 5,106 2,611 3,413 1,476
(iii) Amounts recognised in the statements of financial position THE GROUP THE COMPANY
2013 2012 2013 2012Rs’000 Rs’000 Rs’000 Rs’000
Restated Restated
Present value of plan liability 5,106 2,611 3,413 1,476
(iv) Movement in defined benefit obligations over the years is as follows
THE GROUP THE COMPANY2013 2012 2013 2012
Rs’000 Rs’000 Rs’000 Rs’000
At 1 January 2,611 2,263 1,476 1,309 Current service cost 171 169 46 50 Interest cost 222 224 115 125 Actuarial losses/(gains) 461 (45) 548 (8)Past service cost 1,641 - 1,228 - At 31 December 5,106 2,611 3,413 1,476
(v) Analysis of amount recognised in other comprehensive incomeTHE GROUP THE COMPANY
2013 2012 2013 2012Rs’000 Rs’000 Rs’000 Rs’000
Restated Restated
Experience losses/(gains) on liabilities 479 (45) 557 (8)Changes in assumptions underlying the present value of the scheme (18) - (9) -
461 (45) 548 (8)
Notes to the Financial StatementsYear ended 31 December 2013

The Mauritius Chemical and Fertilizer Industry Limited76
18. RETIREMENT BENEFIT OBLIGATIONS (CONT’D)
(vi) Cumulative actuarial gains recognised THE GROUP THE COMPANY Restated Restated
2013 2012 2013 2012Rs’000 Rs’000 Rs’000 Rs’000
At 1 January- as previously reported - - - - - effect of adopting IAS 19 (Revised) 1,376 1,332 1,356 1,348 - as restated 1,376 1,332 1,356 1,348 Actuarial (losses)/gains recognised for the year (461) 45 (548) 8 At 31 December 915 1,377 808 1,356
(vii) Amount for the current and previous years are as follows: THE GROUP THE COMPANY Restated Restated
THE GROUP 2013 2012 2011 2010Rs’000 Rs’000 Rs’000 Rs’000
Present value of defined benefit obligation (5,106) (2,611) (2,263) (2,979)Deficit (5,106) (2,611) (2,263) (2,979)Experience (losses)/gains on plan liabilities (461) 45 430 (146)
THE COMPANY 2013 2012 2011 2010Rs’000 Rs’000 Rs’000 Rs’000
Present value of defined benefit obligation (3,413) (1,476) (1,309) (1,485)Deficit (3,413) (1,476) (1,309) (1,485)Experience (losses)/gains on plan liabilities (548) 8 380 (59)
(viii) Principal actuarial assumptions used for accounting purposesTHE GROUP AND THE COMPANY
2013 2012% %
Discount rate 7.00 8.50 Future salary increases 5.00 6.50
(ix) Sensitivity analysis on other post retirement benefit obligations at end of the reporting date:
31 December 2013 Increase Decrease Rs’000 Rs’000
Discount rate (1% increase) - 578 Future long term salary assumption (1% increase) 698 -
19. TRADE AND OTHER PAYABLESTHE GROUP THE COMPANY
2013 2012 2013 2012Rs’000 Rs’000 Rs’000 Rs’000
Trade payables 98,951 22,445 73,437 15,134 Accruals 24,933 19,074 18,568 12,074 Other payables 554 2,475 554 2,235 Amounts payable to related companies 19,103 13,958 35,518 36,443
143,541 57,952 128,077 65,886
The carrying amounts of trade and other payables approximate their fair value.
Notes to the Financial StatementsYear ended 31 December 2013

Annual Report 2013 77
20. TAX LIABILITIES THE GROUP THE COMPANY
2013 2012 2013 2012Rs’000 Rs’000 Rs’000 Rs’000
(a) Current tax liabilitiesAt 1 January 9,794 7,076 - - Current tax on adjusted profit for the year at 15% (2012 : 15%) 8,236 7,284 1,016 - Transfer from other receivable (1,797) - (1,797)(Paid)/refund during the year (8,819) (4,854) 1,177 - Foreign tax credit (194) - (57) - Tax deducted at source (1,091) (620) (923) (620)Exchange difference (810) 181 - - Under provision on previous years assessment 563 107 - - Transfer to other receivables 636 620 584 620 At 31 December 6,518 9,794 - -
THE GROUP THE COMPANYRestated Restated
2013 2012 2013 2012Rs’000 Rs’000 Rs’000 Rs’000
(b) Income tax expenseCurrent tax on adjusted profit for the year at 15% (2011 : 15%) 8,236 7,284 1,016 - Withholding tax on dividend 803 - - - Under provision on previous years assessment 563 107 - - Deferred tax movement (note 17) (360) (144) 769 170 Tax charge 9,242 7,247 1,785 170
(c) The tax on the Group’s profit before tax differs from the theoretical amount that would arise using the basic tax rate of the Group as follows:
THE GROUP THE COMPANYRestated Restated
2013 2012 2013 2012Rs’000 Rs’000 Rs’000 Rs’000
Profit before taxation - attributable to continuing operations 21,306 14,712 18,465 40,130 Profit before taxation - attributable to discontinued operations - 10,754 - - Share of results of associates 7,727 7,581 - -
29,033 33,047 18,465 40,130
Tax calculated at a rate of 15% (2012: 15%) 4,355 4,957 2,770 6,020 Under provision in previous year 563 107 - - Income not subject to tax (3,628) (7,990) (1,446) (6,551)Expenses not deductible for tax purposes 203 854 90 701 Effect of different tax rate 3,704 3,570 - - Temporary differences not provided for 109 17 - - Utilisation of tax losses - (174) - - Effect of different year of assessment - (49) - - Under provision of deferred tax in previous years 940 56 940 - Tax losses for which no deferred tax recognised 874 - - - Withholding tax on dividend 803 - - - Tax credit (2,755) (442) (569) - Consolidation adjustments 4,074 6,341 - - Tax charge 9,242 7,247 1,785 170
Notes to the Financial StatementsYear ended 31 December 2013
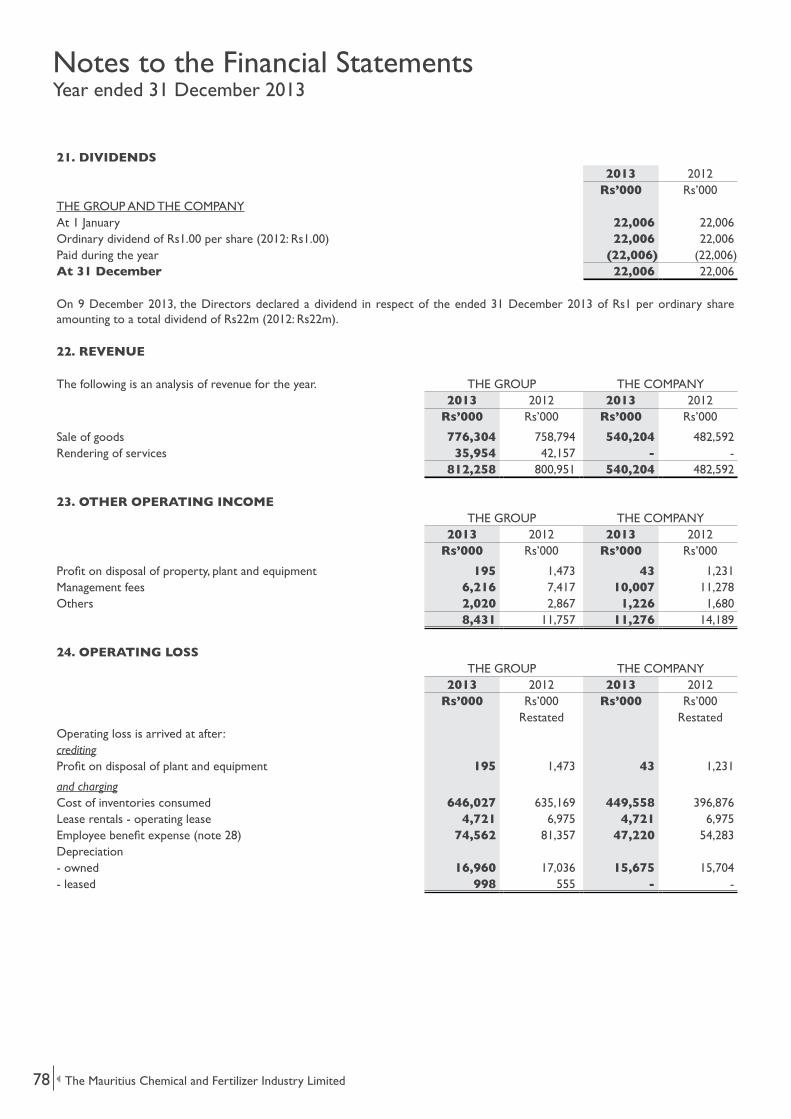
The Mauritius Chemical and Fertilizer Industry Limited78
21. DIVIDENDS2013 2012
Rs’000 Rs’000THE GROUP AND THE COMPANYAt 1 January 22,006 22,006 Ordinary dividend of Rs1.00 per share (2012: Rs1.00) 22,006 22,006 Paid during the year (22,006) (22,006)At 31 December 22,006 22,006
On 9 December 2013, the Directors declared a dividend in respect of the ended 31 December 2013 of Rs1 per ordinary share amounting to a total dividend of Rs22m (2012: Rs22m).
22. REVENUE
The following is an analysis of revenue for the year. THE GROUP THE COMPANY2013 2012 2013 2012
Rs’000 Rs’000 Rs’000 Rs’000
Sale of goods 776,304 758,794 540,204 482,592 Rendering of services 35,954 42,157 - -
812,258 800,951 540,204 482,592
23. OTHER OPERATING INCOMETHE GROUP THE COMPANY
2013 2012 2013 2012Rs’000 Rs’000 Rs’000 Rs’000
Profit on disposal of property, plant and equipment 195 1,473 43 1,231 Management fees 6,216 7,417 10,007 11,278 Others 2,020 2,867 1,226 1,680
8,431 11,757 11,276 14,189
24. OPERATING LOSSTHE GROUP THE COMPANY
2013 2012 2013 2012Rs’000 Rs’000 Rs’000 Rs’000
Restated RestatedOperating loss is arrived at after:creditingProfit on disposal of plant and equipment 195 1,473 43 1,231
and chargingCost of inventories consumed 646,027 635,169 449,558 396,876 Lease rentals - operating lease 4,721 6,975 4,721 6,975 Employee benefit expense (note 28) 74,562 81,357 47,220 54,283 Depreciation- owned 16,960 17,036 15,675 15,704 - leased 998 555 - -
Notes to the Financial StatementsYear ended 31 December 2013

Annual Report 2013 79
25. EXPENSES BY NATURETHE GROUP THE COMPANY
2013 2012 2013 2012Rs’000 Rs’000 Rs’000 Rs’000
Depreciation (note 5) 17,958 17,591 15,675 15,704 Impairment charges 4,815 (720) - - Employment benefit expense (note 28) 74,562 81,357 47,220 54,283 Changes in inventories of finished goods and work in progress 6,607 2,970 2,074 2,970 Raw materials used and consumed 639,419 634,989 447,483 392,951 Transportation 5,105 2,822 4,483 2,677 Advertising costs 808 919 204 606 Other expenses 76,511 81,783 59,747 64,396 Total cost of sales and operating expenses 825,785 821,711 576,886 533,587
26. OTHER INCOMETHE GROUP THE COMPANY
2013 2012 2013 2012Rs’000 Rs’000 Rs’000 Rs’000
Dividend receivable 494 435 9,494 9,574 Profit on disposal of investment in associates - 4,953 - 28,949 Profit on disposal of available-for-sale investments - 184 - 184 Interest receivable 20,598 19,405 20,679 19,514 Rental income 14,115 15,639 14,115 15,639 Net foreign exchange losses (note 29) (482) (574) (70) (574)
34,725 40,042 44,218 73,286
27. NET FINANCE (COST)/INCOMETHE GROUP THE COMPANY
2013 2012 2013 2012Rs’000 Rs’000 Rs’000 Rs’000
Interest payable on:- Bank overdraft (620) (1,094) (498) (1,094)- Bank and other loans repayable by instalments - - - - - Bank and other loans repayable not by instalments (423) (475) (116) (225)- Finance lease (643) (144) - -
(1,686) (1,713) (614) (1,319)Net foreign exchange gains (note 29) 1,090 3,721 267 4,969
(596) 2,008 (347) 3,650
28. EMPLOYEE BENEFIT EXPENSETHE GROUP THE COMPANY
2013 2012 2013 2012Rs’000 Rs’000 Rs’000 Rs’000
Wages and salaries including termination benefits 67,628 76,598 41,693 50,441 Social security costs 1,939 1,932 1,319 1,368 Pension costs - defined benefit plan (note 18(a)(vI)) 899 341 899 341 Pension costs - defined contribution plan 2,062 2,093 1,920 1,958 Other post retirement benefits (note 18(b)(i)) 2,034 393 1,389 175
74,562 81,357 47,220 54,283
Notes to the Financial StatementsYear ended 31 December 2013

The Mauritius Chemical and Fertilizer Industry Limited80
29. NET FOREIGN EXCHANGE GAINS/(LOSSES)
The exchange differences credited/(charged) to profit or loss are included as follows:
THE GROUP THE COMPANY2013 2012 2013 2012
Rs’000 Rs’000 Rs’000 Rs’000
Cost of sales 1,455 3,040 1,462 (436)Other income (note 26) (482) (574) (70) (574)Net finance income (note 27) 1,090 3,721 267 4,969
30. EARNINGS PER SHARETHE GROUP THE COMPANY
Restated Restated2013 2012 2013 2012
Rs’000 Rs’000 Rs’000 Rs’000(a) From continuing operationsNet profit attributable to shareholders from continuing operations 12,064 7,465 16,680 39,960
Thousands Thousands Thousands Thousands
Number of ordinary shares in issue 22,006 22,006 22,006 22,006
Rs Rs Rs Rs
Earnings per share 0.55 0.34 0.76 1.82
(b) From discontinued operations
Net profit attributable to shareholders from discontinued operations - 10,754 - -
Thousands Thousands Thousands Thousands
Number of ordinary shares in issue 22,006 22,006 22,006 22,006
Rs Rs Rs Rs
Earnings per share - 0.49 - -
Notes to the Financial StatementsYear ended 31 December 2013

Annual Report 2013 81
31. NOTES TO STATEMENT OF CASH FLOWS THE GROUP THE COMPANY
Restated Restated2013 2012 2013 2012
Rs’000 Rs’000 Rs’000 Rs’000(a) Cash generated from operationsProfit before taxation attributable to continuing operations 21,306 14,712 18,465 40,130 Profit before taxation attributable to discontinued operations - 10,754 - - Depreciation 17,958 17,591 15,675 15,704 Exchange differences (5,166) (1,176) (267) (4,970)Share of loss of associated companies - continuing activities 7,727 18,335 - - Share of profit of associated companies - discontinued activities - (10,754) - - Movement in retirement benefit obligations 2,832 634 2,188 416 Profit on disposal of property, plant and equipment (195) (1,473) (43) (1,231)Profit on disposal of available-for-sale investments - (184) - (184)Profit on disposal of associates - (4,953) - (28,949)Net provision for impairment of trade receivables 4,815 (720) - - Investment income (494) (435) (9,494) (9,574)Interest income (20,598) (19,405) (20,598) (19,514)Interest expense 1,686 1,713 614 1,319 Changes in working capital:- inventories 33,555 (82,172) 31,402 (48,200)- trade and other receivables 39,518 (12,563) 68,302 (44,100)- trade and other payables 85,097 (6,936) 62,195 6,162 - import loan - net (23,174) 27,166 (27,166) 27,166 Cash generated from/(absorbed in) operations 164,867 (49,866) 141,273 (65,825)
(b) Cash and cash equivalents THE GROUP THE COMPANY2013 2012 2013 2012
Rs’000 Rs’000 Rs’000 Rs’000
Bank and cash balances 56,819 16,494 38,464 1,026 Short term investments - 191,970 - 191,970 Cash and cash equivalents 56,819 208,464 38,464 192,996
Cash and cash equivalents and bank overdrafts include the following for the purpose of the statements of cash flows.
THE GROUP THE COMPANY2013 2012 2013 2012
Rs’000 Rs’000 Rs’000 Rs’000
Bank overdraft (33,872) (16,633) (33,005) (16,633)Cash and cash equivalents 56,819 208,464 38,464 192,996
22,947 191,831 5,459 176,363
(c) Non cash transactionsThe principal non cash transactions are the acquisition of motor vehicle using finance leases (Note 5).
Notes to the Financial StatementsYear ended 31 December 2013

The Mauritius Chemical and Fertilizer Industry Limited82
32. SEGMENTAL INFORMATION - THE GROUP
(a) MCFI Ltd’s reportable segments namely Fertilizers, Trading and Contracting are strategic business units that offer different products and services. They are managed separately because each business requires different technology and marketing strategies.
MCFI Ltd (Group) has 3 reportable segments : Fertilizers, Trading and Contracting.The category “Others” includes dividend, interest receivable, rental and other income.The accounting policies of the operating segments are the same as those described in the summary of significant accounting policies. Performance is evaluated on the basis of profit or loss from operations before tax expense. Intersegment sales and transfers are accounts for as if the sales or transfers were to third parties, that is, at current market prices.
2013 Fertilizers Trading Contracting Others TotalRs’000 Rs’000 Rs’000 Rs’000 Rs’000
Total segment revenues 559,806 214,414 38,038 - 812,258 Inter segment revenues - - - - - Revenues from external customers 559,806 214,414 38,038 - 812,258
Segment (loss)/profit (14,146) 17,047 (7,997) - (5,096)Other income (note 26) (480) - - 35,205 34,725 Net finance (cost)/income (note 27) (488) 285 (393) - (596)Share of results of associates (note 8) - - (11,219) 3,492 (7,727)Profit before taxation (15,114) 17,332 (19,609) 38,697 21,306 Income tax expense 2,748 (6,643) (66) (5,281) (9,242)Profit from discontinued operations - - - - - Profit for the year (12,366) 10,689 (19,675) 33,416 12,064
2012 Fertilizers Trading Contracting Others TotalRs’000 Rs’000 Rs’000 Rs’000 Rs’000
Total segment revenues 553,197 204,780 42,974 - 800,951 Inter segment revenues - - - - - Revenues from external customers 553,197 204,780 42,974 - 800,951
Segment profit (32,047) 19,345 3,699 - (9,003)Other income (note 26) (575) - - 40,617 40,042 Net finance income/(cost) (note 27) 3,589 (1,387) (194) - 2,008 Share of loss of associates (note 8) - - (16,635) (1,700) (18,335)Profit before taxation (29,033) 17,958 (13,130) 38,917 14,712 Income tax expense 5,809 (6,898) (65) (6,093) (7,247)Profit from discontinued operations - 10,754 - - 10,754 Profit for the year (23,224) 21,814 (13,195) 32,824 18,219
Notes to the Financial StatementsYear ended 31 December 2013

Annual Report 2013 83
32. SEGMENTAL INFORMATION - THE GROUP (CONT’D)
2013 Fertilizers Trading Contracting Others TotalRs’000 Rs’000 Rs’000 Rs’000 Rs’000
Interest/dividend receivable - - - 21,174 21,174 Interest expense (627) (739) (320) - (1,686)Material items of expenses- Cost of sales (467,066) (170,625) (21,192) - (658,883)- Operating expenses (119,377) (27,188) (20,337) - (166,902)Depreciation 15,675 1,478 805 - 17,958 Investment in associates - 798 12,079 - 12,877 Addition to non current asset 3,928 1,903 446 - 6,277 Segment assets 516,651 110,994 46,337 320,261 994,243 Segment liabilities 157,518 57,842 20,160 - 235,520
2012 Fertilizers Trading Contracting Others TotalRs’000 Rs’000 Rs’000 Rs’000 Rs’000
Interest/dividend receivable - - - 19,840 19,840 Interest expense (1,319) (235) (159) - (1,713)Material items of expenses- Cost of sales (480,092) (158,684) (19,770) - (658,546)- Operating expenses (119,341) (24,174) (19,650) - (163,165)Depreciation 15,703 1,256 632 - 17,591 Investment in associates - 798 6,900 - 7,698 Addition to non current asset 14,589 2,117 1,288 - 17,994 Segment assets 576,399 96,150 47,172 209,404 929,125 Segment liabilities 105,460 34,141 15,607 - 155,208
Notes to the Financial StatementsYear ended 31 December 2013

The Mauritius Chemical and Fertilizer Industry Limited84
32. SEGMENTAL INFORMATION - THE GROUP (CONT’D)
(b) Secondary reporting format - geographical segmentsAlthough the Group’s three business segments are managed in Mauritius, they operate in the following main geographical areas.
Revenue Total assets Capital expenditure2013 2012 2013 2012 2013 2012
Rs’000 Rs’000 Rs’000 Rs’000 Rs’000 Rs’000
Mauritius 501,057 446,823 883,248 832,975 4,374 15,879 Reunion 22,943 97,199 - - - - Madagascar 26,508 20,271 - - - - Zambia 246,024 236,658 110,995 96,150 1,903 2,115 Others 15,726 - - - - -
812,258 800,951 994,243 929,125 6,277 17,994
Sales revenue is based on the country in which the customer is located. Total assets and capital expenditure are shown by the geographical area in which the assets are located.
33. CONTINGENT LIABILITIES
As at 31 December 2013, the Group and the Company had given bank guarantees of Rs4.555m (2012:Rs3.436m) and Rs0.795m (2012: Rs0.795m) respectively in the ordinary course of business.
Notes to the Financial StatementsYear ended 31 December 2013

Annual Report 2013 85
34. R
EL
AT
ED
PA
RT
Y T
RA
NS
AC
TIO
NS
Tra
nsa
ctio
ns
Bal
an
ces
(a)
(i)
TH
E G
ROU
P
R
em
un
era
tio
n
an
d b
en
efi
ts
Pu
rch
ase
o
f go
od
s an
d
serv
ice
s
Sal
es
of
goo
ds
an
d
serv
ice
s
Man
age
me
nt
serv
ice
s an
d f
ee
s (p
ayab
le)/
re
ceiv
ab
le
Lo
an
s/
advan
ces
to
rela
ted
p
art
y
Lo
ans/
ad
van
ces
refu
nd
by
rela
ted
p
arty
Inte
rest
re
ceiv
ab
le
Am
ou
nt
ow
ed
by
rela
ted
p
art
y
Am
ou
nt
ow
ed
to
re
late
d
part
yR
s’0
00
Rs’
00
0R
s’0
00
Rs’
00
0R
s’0
00
Rs’
00
0R
s’0
00
Rs’
00
0R
s’0
00
2013
Hol
ding
com
pany
-
1,0
12
1
(
13
,41
1)
11
2,0
56
-
2
0,3
22
3
05
,28
6
3,1
50
Fe
llow
sub
sidi
arie
s -
3
6,6
65
1
7,1
11
5
,86
6
-
-
-
9,2
70
1
5,9
52
A
ssoc
iate
s -
8
74
-
-
-
-
-
-
-
A
ssoc
iate
s of
the
hol
ding
com
pany
-
6,1
51
8
,18
3
-
-
-
-
3,4
05
1
En
terp
rise
s in
whi
ch k
ey
man
agem
ent
pers
onne
l has
si
gnifi
cant
/sub
stan
tial i
nter
est
-
1,3
86
-
-
-
-
-
-
-
D
irec
tors
and
key
man
agem
ent
pers
onne
l 2
,44
1
-
-
-
-
-
-
1,0
00
-
(a)
(ii) T
HE
GRO
UP
2012
Hol
ding
com
pany
-
5,4
52
4
(13
,911
) 4
5,00
0 9
6,03
0 1
8,46
6 1
92,5
89
3,5
20
Fello
w s
ubsi
diar
ies
-
16,
084
10,
444
7,4
17
-
-
-
13,
801
5,9
13
Ass
ocia
tes
-
-
16,
398
-
-
-
-
-
-
Ass
ocia
tes
of t
he h
oldi
ng c
ompa
ny -
5
,807
9
,733
-
-
-
-
5
,015
3
,719
En
terp
rise
s in
whi
ch k
ey
man
agem
ent
pers
onne
l has
si
gnifi
cant
/sub
stan
tial i
nter
est
-
1,9
02
-
-
-
-
-
-
806
D
irec
tors
and
key
man
agem
ent
pers
onne
l 2
,438
-
-
-
-
-
-
1
,000
-
Notes to the Financial StatementsYear ended 31 December 2013

The Mauritius Chemical and Fertilizer Industry Limited86
34. R
EL
AT
ED
PA
RT
Y T
RA
NS
AC
TIO
NS
(C
ON
T’D
)
Tra
nsa
ctio
ns
Bal
an
ces
(b)
(i) T
HE
CO
MPA
NY
Re
mu
ne
rati
on
an
d b
en
efi
ts
Pu
rch
ase
o
f go
od
s an
d
serv
ice
s
Sal
es
of
goo
ds
an
d
serv
ice
s
Man
age
me
nt
serv
ice
s an
d f
ee
s (p
ayab
le)/
re
ceiv
ab
le
Lo
an
s/
advan
ces
to
rela
ted
p
art
y
Lo
an
s/
advan
ces
refu
nd
by
rela
ted
p
art
yIn
tere
st
rece
ivab
le
Am
ou
nt
ow
ed
by
rela
ted
p
art
y
Am
ou
nt
ow
ed
to
re
late
d
part
yR
s’0
00
Rs’
00
0R
s’0
00
Rs’
00
0R
s’0
00
Rs’
00
0R
s’0
00
Rs’
00
0R
s’0
00
2013
Hol
ding
com
pany
-
1,0
12
1
(
13
,41
1)
11
2,0
56
-
2
0,3
22
3
05
,28
6
3,1
50
Su
bsid
iari
es -
4
,49
0
83
,63
0
4,5
40
-
5
,40
0
13
9
61
,68
0
30
,77
4
Fello
w s
ubsi
diar
ies
-
5,3
91
1
2,2
33
5
,86
6
-
-
-
4,3
92
1
,59
4
Ass
ocia
tes
-
87
4
-
-
-
-
-
-
-
Ente
rpri
ses
in w
hich
key
m
anag
emen
t pe
rson
nel h
as
sign
ifica
nt/s
ubst
antia
l int
eres
t -
1
,38
6
-
-
-
-
-
-
-
Dir
ecto
rs a
nd k
ey m
anag
emen
t pe
rson
nel
2,4
41
-
-
-
-
-
-
1
,00
0
-
(ii) T
HE
CO
MPA
NY
2012
Hol
ding
com
pany
-
5,4
52
4
(13
,911
) 4
5,00
0 9
6,03
0 1
8,46
6 1
92,5
89
3,5
20
Subs
idia
ries
-
132
2
,373
3
,861
7
,800
-
-
1
06,0
38
30,
805
Fello
w s
ubsi
diar
ies
-
6,1
17
10,
511
7,4
17
-
-
-
13,
801
1,3
12
Ass
ocia
tes
-
-
16,
398
-
-
-
-
-
-
Ente
rpri
ses
in w
hich
key
m
anag
emen
t pe
rson
nel h
as
sign
ifica
nt/s
ubst
antia
l int
eres
t -
1
,902
-
-
-
-
-
-
8
06
Dir
ecto
rs a
nd k
ey m
anag
emen
t pe
rson
nel
2,4
38
-
-
-
-
-
-
1,0
00
-
Notes to the Financial StatementsYear ended 31 December 2013

Annual Report 2013 87
34. RELATED PARTY TRANSACTIONS (CONT’D)Remuneration and benefits
THE GROUP AND THE COMPANY2013 2012
Rs’000 Rs’000Key management personnel compensationDirectors’ fees 2,441 2,438
TERMS AND CONDITIONS WITH RELATED PARTIESThe sales to and purchases from related parties are made in the normal course of business. Outstanding balances at the year-end are unsecured, interest free (except for loan to holding company and to directors and key management personnel at 7 - 7.5% p.a.) and settlement occurs in cash. No guarantees were provided or received for any related party receivables and payables. For the year ended 31 December 2013, the Group has not impaired the receivables relating to amounts owed by each related party (2012 :Rsnil). The assessment is undertaken each financial year through examining the financial position of each related party and the market in which it operates.
35. ULTIMATE HOLDING ENTITY
The Group is controlled by Harel Mallac & Co. Ltd incorporated in Mauritius which owns 70.4% of the Company’s shares. The remaining 29.6% of the shares is widely held.
The directors recognise Harel Mallac & Co. Ltd. as the parent entity and the ultimate parent entity is Société Pronema. Both entities are constituted in Mauritius.
36. OPERATING LEASE COMMITMENTS
The Company leases premises under non-cancellable operating lease agreements. The leases have varying terms, escalation clauses and renewal rights. The future aggregate minimum lease payments under non-cancellable operating lease are as follows:-
THE GROUP AND THE COMPANY2013 2012
Rs’000 Rs’000
Not later than one year 5,161 5,161 Later than one year and not later than 5 years 5,161 10,322
10,322 15,483
The agreed lease period is up to 14 December 2015 with option of renewal for further periods of fifteen years.
37. EVENTS AFTER THE REPORTING PERIOD
There are no events after the end of the reporting period which the directors consider may materially affect the financial statements for the year ended 31 December 2013.
Notes to the Financial StatementsYear ended 31 December 2013

The Mauritius Chemical and Fertilizer Industry Limited88
38. THREE-YEAR SUMMARY OF PUBLISHED RESULTS AND ASSETS AND LIABILITIES - THE GROUP
Restated Restated(a) Statements of profit or loss 2013 2012 2011
Rs’000 Rs’000 Rs’000Continuing operationsRevenue 812,258 800,951 690,404 Share of loss of associates (7,727) (18,335) (7,314)Profit before taxation 21,306 14,712 52,510 Income tax expense (9,242) (7,247) (16,640)Profit for the year from continuing operations 12,064 7,465 35,870 Discontinued operationsProfit for the year from discontinued operations - 10,754 12,470 Profit for the year 12,064 18,219 48,340
Profit attributable to:- Owners of the parent 12,064 18,219 48,340
(b) Statements of profit or loss and other comprehensive income
Profit for the year 12,064 18,219 48,340 Other comprehensive income for the year (5,252) (3,412) (1,648)Total comprehensive income for the year 6,812 14,807 46,692
Total comprehensive income attributable to:- Owners of the parent 6,812 14,807 46,692
Dividend per share (Rs) 1.00 1.00 1.00 Earnings per share from continuing operations(Rs/share) 0.55 0.34 1.63 Earnings per share from discontinued operations (Rs/share) - 0.49 0.57
(c) Statements of financial position As at 1 January
2012 20122013 Restated Restated
Rs’000 Rs’000 Rs’000ASSETSNon-current assets 465,598 170,201 206,829 Current assets 528,645 758,924 687,557 Total assets 994,243 929,125 894,386
EQUITY AND LIABILITIESCapital and reserves 758,723 773,917 781,116
LIABILITIESNon-current liabilities 24,533 21,058 18,976 Current liabilities 210,987 134,150 94,294 Total equity and liabilities 235,520 155,208 113,270
Total equity and liabilities 994,243 929,125 894,386
Notes to the Financial StatementsYear ended 31 December 2013

Annual Report 2013 89
39. EFFECTS OF CHANGES IN ACCOUNTING POLICIES
(i) Adoption of IAS 19 Employee Benefits (Revised 2011)
In the current year, the Group has adopted IAS 19 Employee Benefits (Revised 2011). The Group has applied IAS 19 (Revised 2011) retrospectively in accordance with the transitional provisions as set out in IAS 19 (Revised 2011), paragraph 173. These transitional provisions do not have an impact on future periods. The opening statement of financial position of the earliest comparative period presented (January 1, 2012) has been restated.
The amendments to IAS 19 change the accounting for defined benefit plans and termination benefits. The most significant change relates to the accounting for changes in defined benefit obligations and plan assets. The amendments require the recognition of changes in defined benefit obligations and in fair value of plan assets when they occur, and hence eliminate the ‘corridor approach’ permitted under the previous version of IAS 19 and accelerate the recognition of past service costs.
All actuarial gains and losses are recognised immediately through other comprehensive income in order for the net pension asset or liability recognised in the statements of financial position to reflect the full value of the plan deficit or surplus. Furthermore, the interest cost and expected return on plan assets used in the previous version of IAS 19 are replaced with a ‘net-interest’ amount under IAS 19 (Revised 2011), which is calculated by applying the discount rate to the net defined benefit liability or asset. IAS 19 (Revised 2011) introduces certain changes in the presentation of the defined benefit cost including more extensive disclosures.
Impact of the application of IAS 19 (Revised 2011)These 2013 financial statements are the first financial statements in which the Group has adopted IAS 19 (Revised 2011). IAS 19 (Revised 2011) has been adopted retrospectively in accordance with IAS 8. Consequently, the Group has adjusted opening equity as of January 1, 2012 and the figures for 2012 have been restated as if IAS 19 (Revised 2011) had always been applied.
The effect on the statements of financial position are as follows:
THE GROUP Retirement benefit
obligationsDeferred tax
liabilitiesRs’000 Rs’000
Balance as reported at January 1, 2012 - as previously stated 6,255 14,274 - effect of adopting IAS 19 (Revised 2011) (2,236) 338 - as restated 4,019 14,612
Balance as reported at December 31, 2012 - as previously stated 6,698 14,159 - effect of adopting IAS 19 (Revised) on 2011 figures (2,236) 338 - effect of adopting IAS 19 (Revised) on 2012 figures 234 (41) - as restated 4,696 14,456
Notes to the Financial StatementsYear ended 31 December 2013

The Mauritius Chemical and Fertilizer Industry Limited90
39. EFFECTS OF CHANGES IN ACCOUNTING POLICIES
(i) Adoption of IAS 19 Employee Benefits (Revised 2011) (cont’d)
Impact of the application of IAS 19 (Revised 2011) (cont’d)
THE COMPANY Retirement benefit
obligationsDeferred tax
liabilitiesRs’000 Rs’000
Balance as reported at January 1, 2012 - as previously stated 5,317 10,548 - effect of adopting IAS 19 (Revised 2011) (2,252) 337 - as restated 3,065 10,885
Balance as reported at December 31, 2012 - as previously stated 5,542 10,746 - effect of adopting IAS 19 (Revised) on 2011 figures (2,252) 337 - effect of adopting IAS 19 (Revised) on 2012 figures 271 (40) - as restated 3,561 11,043
THE
GROUPTHE
COMPANYThe effect on profit or loss is as follows: 2012 2012
Rs’000 Rs’000
Increase in administrative expenses 192 192 Decrease in income tax expense (28) (28)Increase in profit for the year 164 164
The effect on the statements of comprehensive income is as follows:
Remeasurement of defined benefit obligations (43) (80)Increase in deferred tax relating to remeasurement of defined benefit obligations 12 12 Decrease in other comprehensive income (31) (68)
Notes to the Financial StatementsYear ended 31 December 2013

Annual Report 2013 91
Notes
The Mauritius Chemical and Fertilizer Industry Limited92
Notes

Member of the Harel Mallac Group
The Mauritius Chemical and Fertilizer Industry LimitedChaussée Tromelin, Fort Georges, Port Louis, Mauritius
Tel: (230) 216 3990 Fax: (230) 242 5321Email: [email protected]