Embed Size (px)
Citation preview

1
What’s Important in AAC Decision Making for Children? Evidence from a Best-worst Scaling
Survey
Edward J.D. Webb and David Meads
University of Leeds
Yvonne Lynch
Manchester Metropolitan University
Nicola Randall and Simon Judge
Barnsley Hospital NHS Foundation Trust
Juliet Goldbart, Stuart Meredith, and Liz Moulam
Manchester Metropolitan University
Stephane Hess
University of Leeds
Janice Murray
Manchester Metropolitan University
Author Note
Edward J.D. Webb, David Meads, Leeds Institute of Health Sciences, University of Leeds;
Yvonne Lynch, Juliet Goldbart, Stuart Meredith, Liz Moulam, Janice Murray, Faculty of Health,
Psychology and Social Care, Manchester Metropolitan University; Nicola Randall, Simon Judge,
Barnsley Assistive Technology Team, Barnsley Hospital NHS Foundation Trust; Stephane Hess, Choice
Modelling Centre, University of Leeds.
2
This independent research was funded by the National Institute for Health Research, UK (Health
Services & Delivery Research Project: 14/70/153 - Identifying appropriate symbol communication aids
for children who are non-speaking: enhancing clinical decision-making). The views expressed in this
article are those of the authors and not necessarily those of the NHS, the National Institute for Health
Research or the Department of Health. Thank you to Muireann McCleary and the Speech and Language
Therapy team at the Central Remedial Clinic who piloted and gave feedback on the survey, and to
participants who responded to the survey. Stephane Hess acknowledges additional support by the
European Research Council through the consolidator grant 615596-DECISIONS.
Correspondence concerning this article should be addressed to Edward J.D. Webb, Leeds Institute
of Health Sciences, University of Leeds, Worsley Building, Clarendon Way, Leeds, LS2 9NL, UK.
Email: [email protected]
Abstract
The choice of which AAC device to provide for a child can have long lasting consequences, but
little is known about the decision making of AAC professionals who make recommendations in
this context. A survey was conducted with AAC professionals using best-worst scaling
methodology examining what characteristics of children and attributes of AAC devices are
considered most important in decision making. A total of 19 child characteristics and 18 device
attributes were selected by the authors from lists generated from literature reviews and from focus
groups with AAC professionals, people who use AAC, and other stakeholders. The characteristics
and attributes were used to develop two best-worst scaling surveys that were administered to 93
AAC professionals based in the UK. Relative importance of characteristics/attributes was
estimated using statistical modeling. Child characteristics related to language and communication,
cognitive and learning abilities, and personality traits were generally found to be more important
3
than physical features. Communication, language, and interface-related AAC device attributes
were generally more important than hardware and physical attributes. Respondent demographics
(e.g., experience, professional background) did not seem to influence the importance assigned to
device characteristics or attributes. Findings may inform both future quantitative research into
decision making and efforts to improve decision making in practice.
Keywords: Clinical decision making; AAC recommendations; Best-worst scaling; Stated
preference
Introduction
The proportion of children in the UK in need of augmentative and alternative
communication (AAC) has been estimated to be up to one in 200 (Enderby, Judge, Creer, &, John,
2013; Gross, 2010; Judge, Enderby, Creer, & John, 2017). AAC encompasses a wide range of
aided and unaided communication modes. This paper specifically focuses on considerations
related to graphic-symbol AAC devices, which comprise aided modes of non-spoken language
representation, incorporating symbols that are typically semantically based to convey conceptual
information in graphic form (von Tetzchner, 2018). A wide variety of these devices is available
in both low-tech (e.g., communication books) or high-tech (e.g., speech generating devices) forms,
and provision of aided AAC is suggested to be a cost-effective use of UK National Health Service
resources (Gross, 2010; Munton, 2013). The term graphic-symbol AAC device is used throughout
the current article to specify any high tech or low tech modality where a graphic-symbol
communication system is embedded within the AAC device to enable the user to convey
conceptual and grammatical intentions (von Tetzchner, 2018).
AAC devices are known to yield benefits in terms of child development, education, and
quality of life (Haijar, McCarthy, Benigno, & Chabot, 2016; Ryan et al., 2015); however, children

4
and their support networks often encounter problems in adopting the devices. Concerns have
emerged over abandonment or underutilization of devices, influenced by factors including child
characteristics, AAC device attributes, and environmental factors (Johnson, Inglebret, Jones, &
Ray, 2006; Moorcroft, Scarinci, & Meyer, 2018). Non-use or abandonment can be costly, as AAC
devices range from about £500 (approx. US$700) up to about £10,000 (approx. US$13,000),
without taking into account the cost of professional support, peripheral devices, warranty, and
maintenance (Reddington, 2013).
Although AAC device decision-making practices vary worldwide, in general,
recommendations about specific equipment follow an assessment process informed by AAC
professionals. Recent studies allude to the complexity of the decision-making process and the need
to understand it further (e.g. Baxter, Enderby, Evans, & Judge, 2012; Lund, Quach, Wiessling,
McKelvey, & Dietz, 2017; McFadd & Wilkinson, 2010; Zapf, Scherer, Baxter, & Rintala, 2016).
Complex decisions, which can have long-lasting implications for children, their carers, and
families (Murray, Bell & Goldbart, 2016), are often made with limited support from clinical
standards or guidelines and a restricted evidence base (Ryan et al., 2015; Quach, Lund &
McKelvey, 2012). Identifying appropriate AAC devices for children is complex and challenging
for a number of reasons. First, children who may benefit from AAC are a diverse group with a
wide variety of skills, abilities, and challenges. Significant speech impairments may relate to a
range of disparate conditions such as cerebral palsy, severe dyspraxia, and autism spectrum
condition. Children with the same condition may have very different needs and abilities that
impact on their ability to use AAC devices. Second, children who use AAC are doing so while
the process of language acquisition is underway. AAC devices must therefore not only support the
child’s ability to communicate in the present, but also their language development, allowing them

5
to engage with the structures of language to realize their linguistic potential (Smith, 2015). Third,
children with significant speech impairments often rely on AAC devices as their literacy skills
develop. Graphic symbols are very different to spoken languages, which requires learning a new
set of skills in order to communicate with the symbols in spoken environments (Smith, 2015).
Although guidelines to support decision making exist, many are not current, not focused
on the UK and/or tend to offer broad appraisals of service structure, clinical skills, and knowledge,
rather than processes of decision making per se (e.g., American-Speech-Language-Hearing
Association, 2005; NHS England, 2016; Royal College of Speech and Language Therapists, 2009).
The present study aimed to provide specific evidence on decision-making processes within the UK
context, by exploring the factors that are most important to AAC professionals in the complex
environment highlighted above. It formed part of a larger project considering aspects of clinical
decision making and therefore is one of a number of studies investigating decision making using
a range of methods and incorporating a full range of environmental, professional, and
family/personal perspectives.
The aim was to contribute to evidence that ultimately aids AAC professionals in making
decisions by prompting them to reflect on the factors related to individual children and to AAC
devices that influence their own decision making. The study did not consider in detail
environmental factors, which are considered elsewhere in the extended research project and other
literature (e.g., Thistle & Wilkinson, 2015; van Niekerk, Dada, Tonsing, & Boshoff, 2017).
Although the importance of contextual and environmental influences cannot be underestimated
(Chung & Stoner, 2016), the current study focused specifically on factors related to child
characteristics and AAC device feature.
Several existing studies (e.g., Enderby et al., 2013; Geytenbeek, Heim, Vermeulen &
6
Oostrom, 2014; Thistle & Wilkinson, 2015) highlight important factors in decision making.
However, the present study is the first to address the topic using an approach known as discrete
choice stated preference methods. Discrete choice stated preference methods are widely used in
health research and broadly consist of presenting survey respondents with a series of hypothetical
decision-making situations and asking them to state their preferences in some way. An example
might be a hypothetical scenario requiring a choice between an invasive but highly effective
treatment with significant negative side effects, and a non-invasive treatment with lower
demonstrated effectiveness but no significant side effects. The hypothetical nature of the situations
that are presented mean it is possible to study decision-making situations that would be difficult
or impossible to gather data on otherwise (e.g., patient preferences for treatments still in
development). It can also make it easier to disentangle the effect of factors that are often
confounded in real life decision situations (e.g., the efficacy of a treatment could be highly
correlated with the severity of side effects). Such methods have the additional advantage of
systematically gathering data from a large number of individuals.
An alternative method to identify factors that are important in decision making that was
considered was a Delphi method, commonly used to elicit expert opinion. The Delphi method is
an iterative approach in which participants respond to several rounds of questionnaires, receiving
feedback from their peers after each round and having the opportunity to revise their opinion in
the light of this (Hasson, Keeney, & McKenna, 2000). However, the purpose of this latter method
is to arrive at an expert consensus on the best way to approach a problem or to forecast events. The
present study did not aim to obtain consensus but rather to elicit individual views on current
practice, allowing for diversity of opinion, that might underpin diversity in clinical decision
making, rendering the Delphi method unsuitable. Consequently, a survey was developed that

7
investigated AAC professionals' stated priorities when making decisions about device
recommendations, using a method termed Best-Worst Scaling (BWS) Case 11, which allows the
relative importance of many factors in decision making to be assessed.
Method
Participants
The target population was any UK-based professional involved in decision making
regarding AAC provision, and who worked either in whole or in part with children. To make
statistical modeling as robust as possible, the aim was to obtain as large a sample size as was
feasible and to reach a geographically widespread UK audience. Participants were recruited via
emails sent to (a) members of a mailing list, (developed by the authors) of attendees at previous
project-related event; (b) the mailing list of Communication Matters, a UK-wide AAC charity
(www.communicationmatters.org) and a Chapter of the International Society of Augmentative and
Alternative Communication (ISAAC); and (d) administrators of various service providers, who
were asked to forward the invitation to their staff members. In addition, personalized invitations
were sent to authors' professional contacts with a request to circulate to others who might be
interested in participating. Responses were collected between 24/3/17 and 15/5/17. Ethical
approval was received from an NHS Research Ethics Committee (REC reference 6/NW/0165) and
informed consent was obtained from participants at the start of the survey.
In all, 113 participants answered at least one question, and 93 completed the full survey.
However, some non-completers may have returned later and are included in the 93. Non-
completers answered a median of four questions. No data is available on those who did not respond
to invitations, so it is not possible to compare them to responders.
Participant Demographics

8
Table 1 summarizes participants’ demographics. A large majority reported being women
(n = 84, 90%) and of white British ethnicity (n = 80, 86%). Almost half reported over 10 years’
experience of working with AAC (n = 42, 45%). Most were speech-language therapists (n = 66,
71%), and almost half reported that at least 80% of their role was related to AAC (n = 41, 44%),
with relatively few (n = 9, 10%) reporting less than 20%. Around three-quarters of participants
reported that they spend some of their time working in an educational establishment (n = 71, 76%),
with a majority reporting spending time in healthcare settings (n = 58, 62%). Just under half
reported visiting people’s own homes (n = 43, 46%) (participants could report working in multiple
settings, thus percentages do not total 100%). How representative this sample was of AAC
specialists in the UK is difficult to determine. However, UK guidelines for the composition of
AAC services indicate that it should include speech and language therapists, occupational
therapists, specialist teachers, and assistive technology specialists (NHS England, 2016). The data
includes representation from all these specialisms, although there is a bias towards speech and
language therapy.
Table 2 shows the geographical distribution of the organization(s) that respondents
reported working for. Some areas were over-represented (e.g., North West England, n = 19, 20%,
compared to 11% of the UK population; and Yorkshire and Humber, n = 56, 16%, compared to 8%
of the UK population), and some were under-represented (e.g. Scotland, n = 3, 3%, compared to
8% of the UK population; and the East of England, n = 4, 4%, compared to 9% of the UK
population). (2011 UK census.)
Insert Tables 1 and 2 about here
Procedures
Characteristic and attribute development. Two sources of data informed the

9
development of lists of characteristics and attributes that might influence decisions about device
recommendations: the scientific literature and focus group discussions. Two literature reviews
were conducted to provide material for candidate child characteristics (e.g., diagnosis, physical
and cognitive abilities, motivation, personality traits2) and device attributes (e.g., hardware and
software features such as voice, portability, vocabulary, navigation) to include in the survey. The
first review sought to identify attributes of symbol-based communication aids considered to
influence clinical decisions. Searches for articles published since 1970 that included terms
synonymous with symbol communication aid and attribute were performed on the EBSCO,
EMBASE, PROQUEST, Scopus, Web of Knowledge, Cochrane Library and AAC Journal
databases. After removal of duplicates, 54,673 records were identified, which, after filtering for
topic relevance and study quality, resulted in 11 articles for data extraction. The second review
identified studies addressing decision making related to recommending symbol-based
communication aids for children. Searches for articles published since 1970 that included terms
synonymous with AAC and decision making were performed on the same databases listed
previously. After removal of duplicates, 29,591 records remained; after filtering for topic relevance
and study quality, six articles were selected for data extraction.
Focus groups. It is considered good practice to construct attributes for stated preference
studies using qualitative methods (Coast et al., 2012). Aspects of the wider research project were
able to provide material for characteristics and attributes from a number of sources. These included
data from focus groups held with 30 AAC clinical specialist stakeholders across the UK, with
contributors from 50% of the specialized providers, as well as data from discussions held with 20
AAC experts, including AAC professionals (speech and language therapists, occupational
therapists, physiotherapists, teachers and teaching/therapy assistants), people who use AAC,

10
relatives, and support personnel of people who use AAC. This material was collected and analyzed
to establish factors relevant to AAC decision making.
The findings from the literature review and focus groups were extracted by authors (first,
second, third, fourth, fifth, sixth, eighth) with expertise in AAC, speech and language therapy, and
qualitative research. They were condensed into an initial list of 31 potential characteristics related
to children and 29 attributes related to AAC devices through consensus discussions between
several authors with diverse expertise in AAC, speech and language therapy, qualitative research,
discrete choice stated preference, and health economics. Consensus was achieved by unstructured
discussion.
As fewer characteristics/attributes mean (ceteris paribus) greater statistical power and more
precise results, the goal was to reduce the number of attributes as much as possible. Thus, in an
iterative process, the authors listed above had further consensus discussions to clarify
characteristic/attribute definitions, combine similar ones, and discard those whose influence was
largely captured by another characteristic/attribute (e.g., age and educational stage). This process
continued until all authors agreed that no further reductions could be made without excluding key
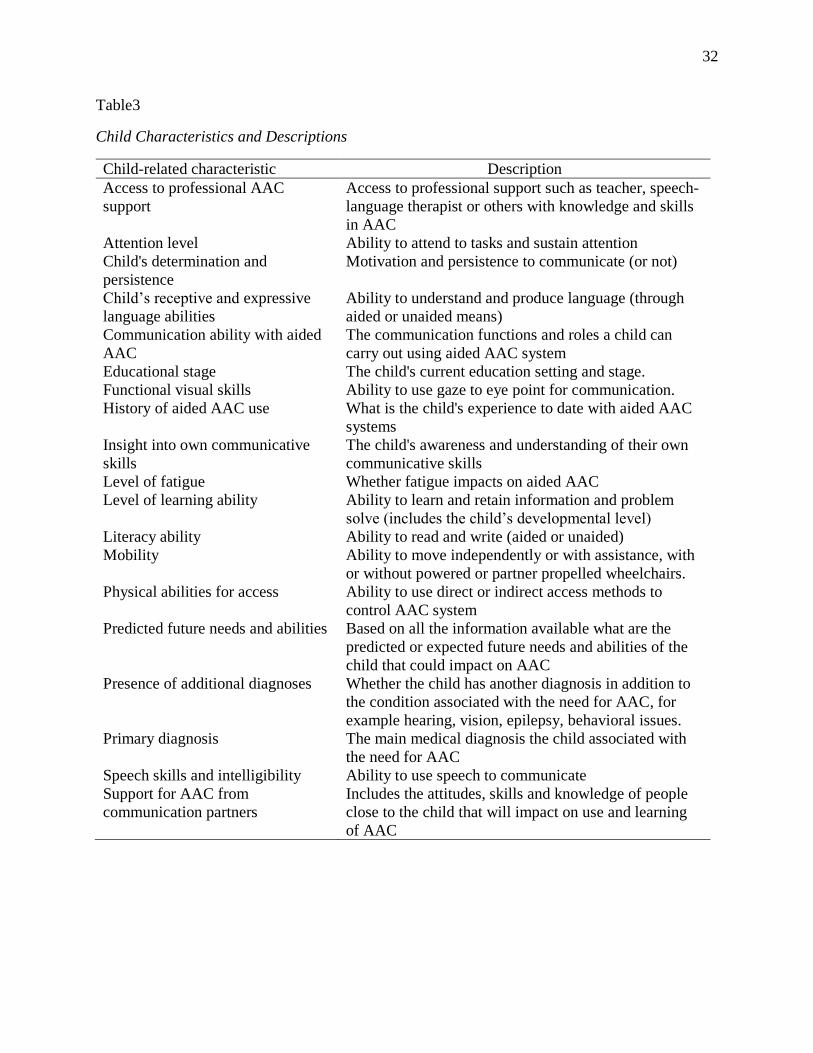
factors. The result was a list of 19 child-related characteristics and 18 AAC device-related
attributes, given in Tables 3 and 4.
Insert Tables 3 and 4 about here
Survey design and implementation. One option for determining the relative importance
of the 19 characteristics and 18 attributes would have been to ask participants to rank them in order
of importance. However, the large number of potentially relevant attributes/characteristics
identified would have imposed a significant cognitive burden (Louviere et al., 2008) potentially
leading to poor data quality. In addition, BWS Case 1 responses can be used to calculate relative

11
importance scores, showing not just that one attribute/characteristic is more important than another
but also how much more important. BWS is an established tool in healthcare research (for a review
of the literature see Cheung et al., 2016), but decision making in health is most often studied using
discrete choice experiments. These have the advantage that participants make choices between
alternatives more closely resembling decision making in the real world than stating priorities as in
BWS. However, due to the cognitive demand of discrete choice experiment tasks, they typically
include only a small number of attributes, typically five or six.
While it would have been possible to carry out a discrete choice experiment for the current
study, no prior discrete choice stated preference work had been carried out to provide guidance as
to the most important and suitable attributes/characteristics to include. Therefore, a more
appropriate starting point was to use a method that captures more aspects of decision making prior
to conducting a discrete choice experiment. BWS Case 1 allows the inclusion of many more
attributes than either discrete choice experiments or BWS Cases 2 and 3 (for example Kremer et
al. (2016) use 27), lowering the chance of missing vital factors. Performing a BWS Case 1 survey
thus gives information about the relative importance of a large number of decision-making factors.
In the context of the current study, it had the added advantage of improving the relevance of a
subsequent discrete choice experiment, by providing quantitative evidence as to which factors
were most suitable to select as attributes.
Due to the large number of characteristics and attributes, child-related characteristics and
AAC device-related attributes were separated into two parts, administered as a single survey. In
each question, participants were shown a list of six characteristics/attributes and asked to select
which was the most and which was the least important factor in their decision about provision of
an AAC device. Descriptions of the six attributes/characteristics from Tables 3 and 4 were included

12
below the list. Figure 1 shows an example of a decision screen.
Insert Figure 1 about here
For each BWS component, participants answered 10 questions, for a total of 20 BWS
questions. Two survey versions were constructed using Sawtooth3, each with five variants.
Sawtooth uses an algorithm to generate designs, which as much as possible balance (a) the number
of times each attribute/characteristic is presented, (b) the number of times each combination of
two attributes/characteristics appear together, and (c) the number of times each
attribute/characteristic is shown in a given position, in order of priority. Each of the five BWS
child component variants, denoted as A, B, C, D, E, was then paired with a BWS AAC device
component, denoted as 1, 2, 3, 4, 5, for a total of five versions of the questionnaire: A1, B2, C3,
D4, E5. Five more versions were created by reversing the order of the child and AAC device
component (1A, 2B, 3C, 4D, 5E) for a total of 10 versions. After completing both BWS
components, participants also answered questions about themselves and their work (e.g., age,
gender, number of years’ experience with AAC, etc.). An example survey is included as
supplementary online material.
The survey was tested with five AAC professionals who were not part of the research team.
They completed the survey in the presence of a researcher and were encouraged to speak aloud
about their thought process as they did so. The researcher assessed the ease of understanding of
the task, appropriateness of response burden, and if characteristics/attributes were interpreted as
intended. Based on feedback, alterations to visual presentation and wording of instructions and
characteristics/attributes were made. The survey was then administered using Online Surveys4,
with participants randomized between versions using JavaScript. For each survey item,
participants were shown a series of six attributes/characteristics and had to indicate which was the

13
most and which was the least important in their decision making.
Statistical analysis. The aim of analyzing BWS responses is to find the relative importance
of each characteristic/attribute. Analysis is based on the principle that if a characteristic/attribute
is more important out of the full list of 19, it is more likely to be chosen by a respondent out of a
list of six. Conversely, if a characteristic/attribute is less important out of the full list of 19, it is
more likely to be chosen as the least important out of a list of six. Statistical techniques are then
used to find the importance for each characteristic/attribute that maximizes the probability of
observing the survey responses that were gathered. For both characteristics and attributes, a
random parameters logit (also known as mixed logit) model was estimated using hierarchical
Bayes as implemented in the ChoiceModelR package for R. Parameters were normally distributed
with the means dependent on respondent characteristics. Additional detail on the analysis is
included in the appendix.
Results are presented using relative importance scores (RIS), which give the importance of
characteristics/attributes on a ratio scale. Thus, a characteristic/attribute with a RIS of 10 is twice
as important as one with a RIS of 5, and a characteristic/attribute with a RIS of 2 is only half as
important as one with a RIS of 4. The RIS of all characteristics/attributes is transformed to sum to
100, hence implying that a RIS of 100/19≈5.26 for children and 100/18≈5.55 for AAC devices
represents a characteristic/attribute of average importance. Statistical tests (t-tests) were used to
examine whether observed differences in RIS represent true underlying differences in opinions or
were found only by chance. In line with standard practice, a difference was considered significant
if the probability of observing it by chance was 5% or lower. Based on test results, characteristics
and attributes were divided into three groups: (a) those with a RIS significantly greater than
average, (b) those with a RIS not significantly different from average, and (c) those with

14
significantly lower than average RIS. It was tested whether all characteristics and attributes
differed in importance from each other, and each RIS was also tested to determine if there were
differences according to respondent demographics.
Response quality. Response quality was assessed in the following ways: First, statistical
tests (Kolmogorov-Smirnov tests) were used to check whether individuals were biased towards
selecting an attribute/characteristic in a given position, (e.g., at the top of the list). Second, the
proportion of times participants made either contradictory choices (i.e., stating Characteristic A is
more important than Characteristic B in one question, then stating the opposite in another question)
or choices that violated transitivity (the principle that if Attribute A is more important that Attribute
B, and B is more important than Attribute C, then A is more important than C) was calculated. As
individuals whose choices are logical should be consistent and transitive, and should contain an
even spread of choices in each position, poor performance may indicate a lack of understanding or
inattentiveness.
The median number of contradictory choices respondents made was two (2.56%) for child
characteristics and two (2.60%) for AAC device attributes. The median number of choices that
were either contradictory or intransitive was six (4.88%) for child characteristics and eight (5.93%)
for AAC device attributes. (Note percentages are relative to the number of opportunities
participants had to make contradictory/intransitive choices.)
Given the small sample size, no responses were excluded from the main analysis. However,
robustness checks were performed to ensure results were not skewed by poor quality responses.
Respondents were split according to whether their choices displayed above or below the median
proportion of consistency and transitivity and it was examined whether RIS differed significantly
between the two groups. Statistical models were re-estimated including only participants whose

15
choices were consistent and transitive at least 80% of the time on the basis that this removed
participants with the greatest number of inconsistent and intransitive choices while retaining
sufficient data to estimate models.
Results
Relative Importance of Child Characteristics
Table 5 gives the RIS for child characteristics, which were split into three groups: those of
greater than average, average, or less than average importance. Of the 19 characteristics, six
(31.6%) were considered of greater than average importance. These were Child’s receptive and
expressive language abilities, Support for AAC from communication partners, Child’s
communication ability with aided AAC, Child’s determination and persistence, Physical abilities
for access, and Predicted future needs and abilities. Characteristics of lower than average
importance were: Functional visual skills, History of AAC use, Presence of additional diagnoses,
Level of fatigue, Literacy ability, Educational stage, Primary diagnosis, and Mobility.
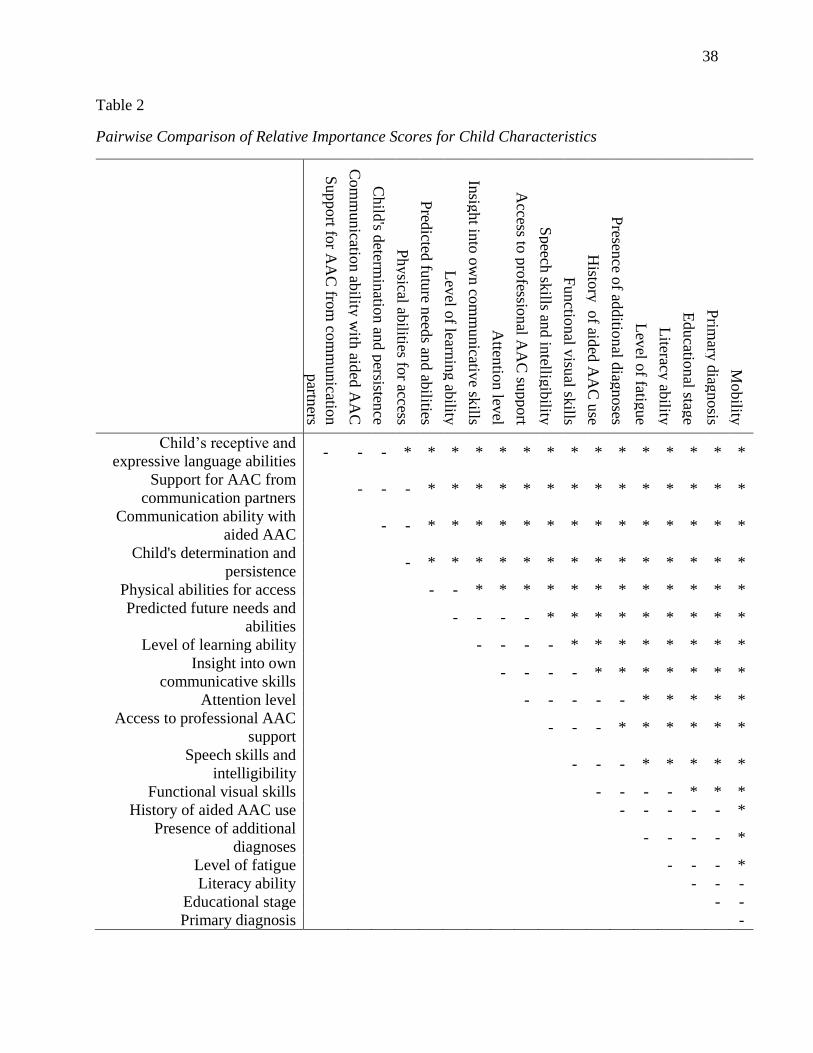
Table 6 gives the results of tests for differences in the RIS of every pair of characteristics
(i.e., which differences are significant and which may simply have arisen by chance). It shows that
it is impossible to distinguish the importance of any characteristic from that of any adjacently
ranked characteristic. Nevertheless, out of 171 pairwise comparisons, 115 (67.3%) are
significantly different. Characteristics with above average RIS are more similar in importance than
those with below average RIS. For example, Child’s receptive and expressive language abilities,
ranked first, is only 1.6 times as important as Predicted future needs and abilities, ranked sixth,
whereas Functional visual skills, ranked 12 th, is almost 19 times as important as Mobility, ranked
19 th. Table 7 shows that the survey was able to detect only six significant differences in RIS
according to respondent demographics, all for characteristics that were of less than average

16
importance.
Insert tables 5, 6 and 7 about here
Relative Importance of AAC Device Attributes
Table 5 shows the RIS for AAC device-related attributes. Splitting AAC device-related
attributes into three groups reveals that six (33.3%) attributes each were of above average, average,
and below average importance. Those that had greater than average importance were: Vocabulary
or language package(s), Consistency of layout and navigation, Ease of customization, Durability
and reliability, Type of vocabulary organization, and Number of keypresses required to generate
symbol or text. Those that had below average importance were: Supplier support, Ease of
mounting on a range of equipment, Cost, Additional assistive technology features, Voice, and
Appearance.
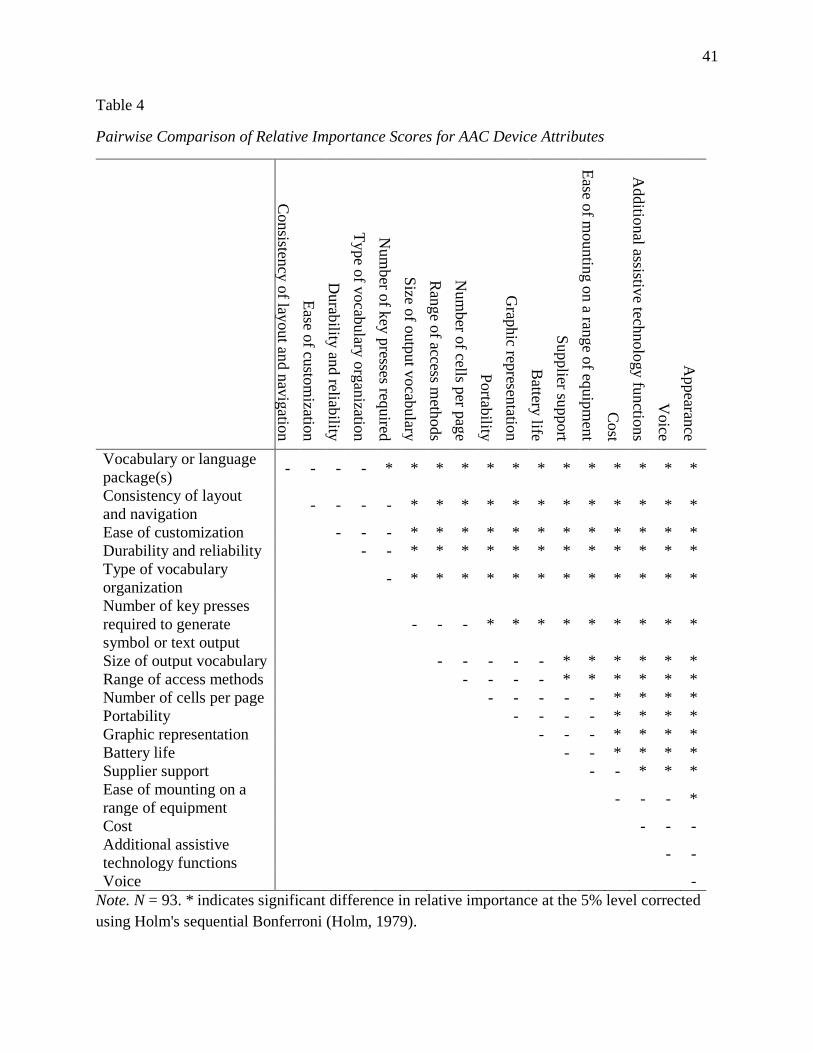
Table 8 shows that, as in the previous section, it is impossible to distinguish the importance
of any attribute from any adjacently ranked attribute. However, out of 153 pairwise combinations,
102 (66.7%) are significantly different. Again, attributes with above average RIS are more tightly
grouped in terms of importance than those with below average RIS. The top ranked attribute,
Vocabulary or language package(s), is only 1.4 times more important than the sixth ranked
attribute, Number of key presses required to generate symbol or text output, yet the 13th ranked
attribute, Supplier support, is over 10 times more important than Appearance, ranked 18th.
Table 7 gives details of the eight significant differences in RIS according to respondent
demographics that the survey was able to detect. On three occasions some groups considered an
attribute of above average importance while those not in that group considered it below average.
Those with a higher AAC role percentage and those who commonly encounter Neuromuscular
diagnoses considered a Range of access methods of above average importance, whereas those who

17
do not commonly encounter Neuromuscular diagnoses and those with a lower AAC role
percentage do not. Similarly, those who do not commonly encounter autism diagnoses considered
Ease of mounting on a range of equipment of above average importance, whereas those who do
commonly encounter autism diagnoses did not.
Insert Table 8 about here
Robustness Checks
Respondents did not exhibit a tendency to choose attributes/characteristics in one position
in the list over any other (p-value >.999 for children, p-value .939 for AAC devices. No significant
differences were observed in the RIS of participants above or below the median proportion of
consistent and transitive choices. The results of estimating models with the participants whose
choices were consistent and transitive at least 80% of the time were qualitatively similar to those
from the full sample. Details are available from the corresponding author upon request.
Discussion
Participants obeyed the axioms of consistency and transitivity around 95% of the time,
evidence that they understood the tasks and found them meaningful. This compares favorably with
response quality observed in other stated preference studies (Rezaei & Patterson, 2015). In addition,
participants showed no tendency of bias towards choosing attributes/characteristics that appeared
at the top of the list. The results give interesting and useful insight into the decision-making
priorities of AAC professionals working with children. Some results are in accord with existing
research, although there are some potential differences highlighted between AAC professionals’
priorities and people who use AAC, as discussed below.
For factors relating to children, a trend emerged that physical abilities were considered less
important than cognitive, learning, language and communication abilities, and personality traits.
18
Only one physical characteristic, Physical abilities for access, achieved greater than average
importance, with Level of fatigue and Mobility in the five lowest ranked characteristics. Receptive
and expressive language, Communication ability with aided AAC, and Level of learning ability
were characteristics related to language and communication ability and learning ability, which
were ranked higher than average importance, whereas Literacy ability and Educational stage were
both considered below average importance. Child’s determination and persistence and Insight into
own communicative skills, both of which are aspects of a child’s personality, were both ranked
higher than average importance, with Attention level just below average importance.
The prioritization of Child’s determination and persistence suggests recognition of the high
demands that aided communication may place on children and their need to continue trying to
communicate, though their experiences with aided communication might be effortful, slow, and
physically and cognitively demanding. It also suggests that interventions focused on reducing the
effortful demands of aided communication, (e.g., incorporating low tech AAC, such as symbol
communication boards, to reduce operational demands when linguistic demands are higher,
Beukelman, 1991) and incorporating strategies to help children to develop greater resilience and a
willingness to continue trying may have positive long-term outcomes.
Support for AAC by communication partners was the second most important child-related
factor significantly more important than 14 other child characteristics. This suggests that
professionals pay close attention to support in the child’s environment in making AAC device
recommendations. Further exploration of environmental influences would be useful.
The future developmental trajectory of a child, represented by Predicted future needs and
abilities, emerged as above average importance, while past experiences, represented by History of
AAC use, was of below average importance. This is interesting given reported concerns regarding

19
abandonment or non-use of AAC devices (Johnson, et al., 2006; Moorcroft et al., 2018). However,
low importance attached to AAC history may simply reflect a majority of children encountered in
assessments being new to AAC, or that professionals prioritize or are optimistic about future
potential. This latter explanation would also be in line with official guidance to have high
aspirations for children who use AAC (Department for Education & Department of Health, 2015).
Primary and secondary diagnoses were among the least important characteristics. This may be
because key features of diagnoses are captured by other characteristics, or that they are poor
predictors of AAC use or choice due to the diversity of presentations within a condition,
particularly when considering speech, language and communication.
Few differences were observed between the priorities of respondents representing different
demographics, and those differences that were seen were in relation to characteristics of less than
average importance. Such homogeneity of opinion is arguably encouraging, since it suggests
consistency of opinion and practice. However, it should be noted that a failure to find statistically
significant heterogeneity does not mean it does not exist, especially given the small sample size.
In addition, this finding may reflect the homogeneity of respondents. For example, as a large
majority of respondents were speech and language therapists, the results will inevitably largely
reflect their viewpoint. Future research could usefully investigate the priorities of AAC
professionals with other professional backgrounds.
With AAC device attributes, greater importance tended to be ascribed to language and
communication and interface aspects than hardware aspects, which may be due to the prevalence
of speech and language therapists in the sample. Only a single hardware-related attribute,
Durability and reliability, emerged as more important than average, with all the other above
average importance attributes relating to the vocabulary organization aspects or interfacing with
20
the AAC device. Vocabulary and language package(s) and Consistency of layout and navigation
were the highest ranked attributes. Ease of customization was ranked third, but not significantly
differently to the two language and communication attributes, and range of access methods was
rated just above average importance. Four out of six of the highest ranked AAC device attributes
pertain to the vocabulary within the device and how it is organized. Furthermore, physical features
such as Ease of mounting on a range of equipment, Voice and Appearance were ranked as below
average importance. It is possible that that professionals have a greater focus on features that
specifically influence the communicative use of an AAC device, giving less priority to attributes
such as Ease of mounting that may be less problematic in a clinic setting than everyday life. These
priorities may be different to those of children who use AAC and their families, suggesting a need
for tools to support consensus building and agreement of priorities to inform AAC device
recommendation across all stakeholders. Despite potential discrepancies, it is not possible to
directly compare the views of AAC professionals and children and families, as the present study
surveyed only the former. It would thus be a fruitful avenue for future stated preference research
to compare both groups’ priorities.
Cost was one of the least important AAC device attributes, suggesting a positive impact
of the recent policy change in the UK introducing dedicated funding for AAC devices. However,
another recent study suggests cost remains a key consideration for professionals in other countries
and may have considerable influence on decision making (van Niekirk et al., 2017). Reducing the
relative priority of cost within decision making (while retaining a focus on value for money) is
likely to support the selection of AAC devices based on individual child need rather than budgetary
constraints.
Graphic representation stands out as the only language attribute ranked as having lower

21
than average relative importance in this study. Recent studies suggest ambivalence towards the
challenges or levels of cognitive difficulty associated with perceived levels of graphic
representation (Dada, Murphy, & Tönsing, 2017). There is some evidence that more abstract
symbols are favored for children with higher cognitive abilities, while in other contexts there was
a preference to go for more iconic symbols that were easier to learn.
Overall, the top-ranked characteristics and attributes were found to be reasonably similar
in importance, whereas there were large differences in those ranked lower. One possible
interpretation of this is that there are a few aspects of decision making that are relevant in the
majority of cases and are weighted reasonably evenly. There is then a “long tail” of factors that
are relevant in an increasingly small minority of cases.
While there is some conflict with previous results in terms of the importance of Aesthetics
and Ease of mounting as highlighted above, there is also considerable agreement with existing
literature. For example, McFadd and Wilkinson (2010) stress the importance of the design of visual
displays, and several display-related attributes were ranked highly in the present study. In addition,
the results presented here concur with previous work (e.g., Baxter et al., 2011; Zapf et al. 2015)
showing that professionals frequently need to balance a wide range of factors relating to each
individual child, the available devices and how these might be accessed; in turn thisbalancing act
necessitates some prioritization when recommending equipment.
Limitations and Future Directions
A disadvantage of BWS Case 1 is that, while it is possible to show the relative importance
of characteristics and attributes, it is not possible to demonstrate which are of absolute importance.
However, characteristics and attributes were developed by drawing on existing literature and the
views of practitioners, indicating that all included characteristics and attributes were, at least to a
22
certain extent, important. Another disadvantage is that the stated importance of
characteristics/attributes reflects the variation participants see in practice. Thus it is not clear
whether a characteristic/attribute is unimportant, or whether the population respondents encounter
are homogeneous with respect to that characteristic, or if there is no variation in that feature seen
in the AAC devices available to them.
The sample size of 93 was relatively low, approximately half the average sample size of
BWS Case 1 studies in health (Cheung et al., 2016). However, many other studies have smaller
sample sizes, (e.g., van Til, Groothuis-Oudshoorn, Lieferink, Dolan, & Goetghebeur, 2014; n =
15). A larger sample size would have been desirable in order to robustly explore differences
between adjacently ranked characteristics/attributes. However, recruitment of even the current
number of participants proved challenging, given the low population size of AAC professionals in
the UK, estimated to be 800 people across the UK (Communication Matters (ISAAC-UK),
personal correspondence).
A potential issue is whether it was meaningful for participants to distinguish between
several highly important characteristics/attributes. However, the high proportion of consistent and
transitive choices is evidence that most were able to coherently respond to the BWS questions. In
addition, models were re-estimated excluding respondents with many inconsistent and intransitive
choices. It is not certain whether or not some characteristics and attributes had different meanings
for different respondents, though the survey was tested prior to use, and explanations were
provided in each question. However, to some extent this reflects wider issues in AAC, related to
its multidisciplinary nature, resulting in challenges finding a common language and terminology.
By design, child characteristics and AAC device attributes were studied separately, making
it difficult to compare their importance and impossible to study how they interact. Given the wide

23
range of conditions AAC professionals encounter and the disparate needs of different children,
such interactions are crucial to investigate. To build on these findings, a discrete choice experiment
has been designed and carried out with both child characteristics and AAC device attributes,
meaning trade-offs and interactions can be estimated.
While some environmental factors were included (e.g., Support for AAC from
communication partners) and some factors can be related indirectly to the decision-making
environment (e.g., the importance of Cost depends on the budgetary circumstances of service
providers), they were not explicitly considered as a class of attributes in their own right. This was
due to the necessity of keeping the scope of the present study manageable and to avoid
overburdening participants with a third set of questions. Nevertheless, given the importance of
contextual factors (van Niekerk et al., 2017) it is a limitation of the present study that it does not
consider them in more depth, and future research could usefully focus on them.
A final issue with stated preference methodology is that it gives information about the
general situation and the average importance of characteristics/attributes. This fails to reflect the
vast heterogeneity AAC professionals see among children in their day-to-day work. Every child is
unique, with unique experiences, needs, and preferences, so that real-life decision making is even
more complex and nuanced than reflected in our results.
Conclusion
So far little evidence has been published about the decision making of AAC professionals
working with children. Here, a first step has been made in quantifying their priorities and
identifying the most crucial aspects of both children and AAC devices when making their choices
and recommendations. The present study is the first to investigate what AAC practitioners working
with children prioritize in decision making using stated preference methods. As such, a strength of

24
the study design is that attributes/characteristics were selected using qualitative methods involving
both searching the literature and conducting focus groups with individuals who use AAC and their
families and AAC professionals from a variety of backgrounds. This process means a relative
confidence that important features of decision making have not been omitted. The BWS Case 1
methodology allowed information to be gathered on a large number of factors. Important insight
has been gained, showing that physical traits of children are perceived to be relatively less
important in AAC professionals’ decision making than language and communication, cognitive
and learning abilities, and personality traits, and that the communication, language and interface
features of AAC devices are considered relatively more important by professionals than hardware
and physical features.
There is much scope for future quantitative research in this field. Only AAC professionals
were studied, and it would be of interest to directly compare results from professionals with those
from other stakeholders involved in the decision making process, particularly people who use AAC
and their families. Further, the results of the current study have been used to inform attribute
selection for a discrete choice experiment to examine in more detail the trade-offs AAC
professionals make when prescribing for children and the interaction between child characteristics
and AAC device related attributes.

25
References
American Speech-Language-Hearing Association. (2005). Evidence-based practice in
communication disorders [Position Statement]. Retrieved from www.asha.org/policy.
Baxter, S., Enderby, P., Evans, P., & Judge, S. (2012). Barriers and facilitators to the use of
high‐technology augmentative and alternative communication devices: A systematic
review and qualitative synthesis. International Journal of Language & Communication
Disorders, 47, 115-129. doi: 10.1111/j.1460-6984.2011.00090.x
Beukelman, D. (1991). Magic and cost of communicative competence. Augmentative and
Alternative Communication, 7(1), 2-10. doiː10.1080/07434619112331275633
Cheung, K. L., Wijnen, B. F., Hollin, I. L., Janssen, E. M., Bridges, J. F., Evers, S. M., &
Hiligsmann, M. (2016). Using best–worst scaling to investigate preferences in health
care. PharmacoEconomics, 34, 1195-1209. doi: 10.1007/s40273-016-0429-5
Chung, Y.C., and Stoner, J.B. (2016) A meta-synthesis of team members’ voices: What we need
and what we do to support students who use AAC. Augmentative and Alternative
Communication 32, 175-186. doiː10.1080/07434618.2016.1213766
Coast, J., Al-Janabi, H., Sutton, E. J., Horrocks, S. A., Vosper, A. J., Swancutt, D. R., & Flynn,
T. N. (2012). Using qualitative methods for attribute development for discrete choice
experiments: Issues and recommendations. Health Economics, 21, 730-741. doi:
10.1002/hec.1739
Dada, S., Murphy, Y., & Tönsing, K. (2017). Augmentative and alternative communication
practices: a descriptive study of the perceptions of South African speech-language
therapists. Augmentative and Alternative Communication, 33, 189-200. doi:
10.1080/07434618.2017.1375979

26
Department for Education, & Department of Health (2015). SEND code of practice 0–25 years.
Retrieved from https://www.gov.uk/government/publications/send-code-of-practice-0-to-
25
Enderby, P., Judge, S., Creer, S., & John, A. (2013). Examining the need for and provision of
AAC methods in the UK. Advances in Clinical Neuroscience & Rehabilitation, 13, 20-
23.
Geweke, J. (1992). Evaluating the accuracy of sampling-based approaches to the calculation of
posterior moments. Paper presented at the Fourth Valencia International Meeting on
Bayesian Statistics, Valencia.
Geytenbeek, J.J., Heim, M.J.M, Knol, D.L., Vermeulen, R.J., & Oostrom, K.J. (2014). Spoken
language comprehension in non-speaking children with severe cerebral palsy
International Journal of Language and Communication Disorders, 57, 294-300.
doiː10.1111/dmcn.12619
Gross, J. (2010). Augmentative and alternative communication: A report on provision for
children and young people in England: Office of the Communication Champion.
Retrieved from www.thecommunicationtrust.org.uk/media/4090/aac_provision_
for_children_and_young_people_in_england.pdf
Hajjar, D., McCarthy, J.W., Benigno, J.P., & Chabot, J. (2016) “You get more than you give”:
Experiences of community partners in facilitating active recreation with individuals who
have complex communication needs. Augmentative and Alternative Communication, 32,
131-142, doi:10.3109/07434618.2015.1136686
Hasson, F., Keeney, S., & McKenna, H. (2000). Research guidelines for the Delphi survey
technique. Journal of Advanced Nursing, 32, 1008-1015, doi: 10.1046/j.1365-

27
2648.2000.t01-1-01567.x
Holm, S. (1979). A simple sequentially rejective multiple test procedure. Scandinavian Journal
of Statistics, 6, 65-70.
Johnson, J. M., Inglebret, E., Jones, C., & Ray, J. (2006). Perspectives of speech language
pathologists regarding success versus abandonment of AAC. Augmentative and
Alternative Communication, 22, 85-99. doi: 10.1080/07434610500483588
Judge, S., Enderby, P., Creer, S., & John, A. (2017). Provision of powered communication aids
in the United Kingdom. Augmentative and Alternative Communication, 33, 181-187. doi:
10.1080/07434618.2017.1347960
Judge, S., & Townend, G. (2013). Perceptions of the design of voice output communication aids.
International Journal of Language & Communication Disorders, 48, 366-381. doi:
10.1111/1460-6984.12012
Kremer, I. E., Evers, S. M., Jongen, P. J., van der Weijden, T., van de Kolk, I., & Hiligsmann,
M. (2016). Identification and prioritization of important attributes of disease-modifying
drugs in decision making among patients with multiple sclerosis: A nominal group
technique and best-worst scaling. PloS One, 11, e0164862. doi:
10.1371/journal.pone.0164862
Lipovetsky, S., & Conklin, M. (2014). Best-worst scaling in analytical closed-form solution.
Journal of Choice Modelling, 10, 60-68. doi: 10.1016/j.jocm.2014.02.001
Louviere, J. J., Street, D., Burgess, L., Wasi, N., Islam, T., & Marley, A. A. (2008). Modeling
the choices of individual decision-makers by combining efficient choice experiment
designs with extra preference information. Journal of Choice Modelling, 1, 128-164. doi:
10.1016/S1755-5345(13)70025-3
28
Lund, S., Quach, W., Weissling, K.S.E., McKelvey, M.L., & Dietz, A.R (2017). Assessment
with children who need augmentative and alternative communication (AAC): Clinical
decisions of AAC specialists. Language, Speech, and Hearing Services in Schools, 48,
56-68. doiː10.1044/2016_LSHSS-15-0086
McFadd, E., & Wilkinson, K. (2010). Qualitative analysis of decision making by speech-
language pathologists in the design of aided visual displays. Augmentative and
Alternative Communication, 26, 136-147. doi: 10.3109/07434618.2010.481089
Moorcroft, A., Scarinci, N., & Meyer, C. (2018): A systematic review of the barriers and
facilitators to the provision and use of low-tech and unaided AAC systems for people
with complex communication needs and their families. Disability and Rehabilitation:
Assistive Technology, 1-22. doi:10.1080/17483107.2018.1499135
Munton, T. (2013). Augmentative and Alternative Communication (AAC) support in Scotland:
A review of the research literature and cost benefit analyses. NHS Education for
Scotland. Retrieved from
www.rcslt.org/speech_and_language_therapy/docs/aac_finalreport2013
Murray, J., Bell, H., & Goldbart, J. (2016). Operational demands and representational forms. In
M. Smith & J. Murray (Eds.), The silent partner? Language, interaction and aided
communication (pp. 35-64). Albury, Nr Guildford, UK: J&R Press
NHS England, (2016). Guidance for commissioning AAC services and equipment. Retrieved
from https://www.communicationmatters.org.uk/page/national-standards-aac-services
Quach, W., Lund, S. K., & McKelvey, M. (2012). AAC assessment and clinical-decision
making: The impact of experience. Augmentative and Alternative Communication, 28,
148-159. doiː10.3109/07434618.2012.704521

29
Orme, B. (2005). MaxDiff system technical paper. Sawtooth Software Research Paper Series.
Retrieved from www.sawtoothsoftware.com/download/techpap/maxdifftech.pdf
Reddington, J. (2013). The Domesday dataset: Linked open data in disability studies. Journal of
Intellectual Disabilities, 17, 107-121. doi: 10.1177/1744629513482650
Rezaei, A., & Patterson, Z. (2015). Detecting, non-transitive, inconsistent responses in discrete
choice experiments: CIRRELT. Retrieved from
http://collections.banq.qc.ca/ark:/52327/bs2472762
Royal College of Speech and Language Therapists. (2009). Resource manual for commissioning
and planning services for SLCN. Retrieved from www.rcslt.org
Ryan, S. E., Shepherd, T., Renzoni, A. M., Anderson, C., Barber, M., Kingsnorth, S., & Ward,
K. (2015). Towards advancing knowledge translation of AAC outcomes research for
children and youth with complex communication needs. Augmentative and Alternative
Communication 31, 137-147. doi: 10.3109/07434618.2015.1030038
Smith, M. M. (2015). Language development of individuals who require aided communication:
Reflections on state of the science and future research directions. Augmentative and
Alternative Communication, 31, 215-233. doi: 10.3109/07434618.2015.1062553
Thistle, J. J., & Wilkinson, K.M. (2015). Building evidence-based practice in AAC display
design for young children: Current practices and future directions. Augmentative and
Alternative Communication 31, 124-136. doi:10.3109/07434618.2015.1035798
van Niekerk, K., Dada, S., Tönsing, K., & Boshoff, K. (2017). Factors perceived by
rehabilitation professionals to influence the provision of assistive technology to children:
A systematic review. Physical & Occupational Therapy In Pediatrics 38, 168-189,
doi:10.1080/01942638.2017.1337661

30
van Til, J., Groothuis-Oudshoorn, C., Lieferink, M., Dolan, J., & Goetghebeur, M. (2014). Does
technique matter: A pilot study exploring weighting techniques for a multi-criteria
decision support framework. Cost effectiveness and resource allocation, 12, 22. doi:
10.1186/1478-7547-12-22
von Tetzchner, S. (2018). Introduction to special issue aided language processes, development
and use: An international perspective. Augmentative and Alternative Communication, 34,
2–15. doi:10.1080/07434618.2017.1422020
Zapf, S.A., Scherer, M.J., Baxter, M.F., & Rintala, D.H. (2016). Validating a measure to assess
factors that affect assistive technology use by students with disabilities in elementary and
secondary education. Disability and Rehabilitation: Assistive Technology, 11, 38-49.
doiː10.3109/17483107.2015.1104559

31
End Notes
1 Case 1, also known as object case, distinguishes our method from the closely related methods
of BWS Case 2 (or profile case) and BWS Case 3 (or multi-profile case); for more information
about the latter two see Cheung et al. (2016).
2 Note: “characteristic” is used rather than “attribute” for children because it better represents
person-first inclusive language; however, this does not imply a meaningful distinction between
characteristics and attributes in terms of BWS methodology.
3 Sawtooth is a product of Sawtooth Software, Inc., Provo, Utah, United States,
www.sawtoothsoftware.com
4 Online Surveys is a product of Jisc, Bristol, United Kingdom, www.onlinesurveys.ac.uk
32
Table3
Child Characteristics and Descriptions
Child-related characteristic Description
Access to professional AAC
support
Access to professional support such as teacher, speech-
language therapist or others with knowledge and skills
in AAC
Attention level Ability to attend to tasks and sustain attention
Child's determination and
persistence
Motivation and persistence to communicate (or not)
Child’s receptive and expressive
language abilities
Ability to understand and produce language (through
aided or unaided means)
Communication ability with aided
AAC
The communication functions and roles a child can
carry out using aided AAC system
Educational stage The child's current education setting and stage.
Functional visual skills Ability to use gaze to eye point for communication.
History of aided AAC use What is the child's experience to date with aided AAC
systems
Insight into own communicative
skills
The child's awareness and understanding of their own
communicative skills
Level of fatigue Whether fatigue impacts on aided AAC
Level of learning ability Ability to learn and retain information and problem
solve (includes the child’s developmental level)
Literacy ability Ability to read and write (aided or unaided)
Mobility Ability to move independently or with assistance, with
or without powered or partner propelled wheelchairs.
Physical abilities for access Ability to use direct or indirect access methods to
control AAC system
Predicted future needs and abilities Based on all the information available what are the
predicted or expected future needs and abilities of the
child that could impact on AAC
Presence of additional diagnoses Whether the child has another diagnosis in addition to
the condition associated with the need for AAC, for
example hearing, vision, epilepsy, behavioral issues.
Primary diagnosis The main medical diagnosis the child associated with
the need for AAC
Speech skills and intelligibility Ability to use speech to communicate
Support for AAC from
communication partners
Includes the attitudes, skills and knowledge of people
close to the child that will impact on use and learning
of AAC

33
Table 4
AAC Device Attributes and Descriptions
AAC device attribute Description
Additional assistive technology
functions
Whether the aided AAC system supports other
assistive technology functions such as offering
computer features
Appearance Appearance and feel including the hardware and the
interface
Battery life How long the battery lasts between charges
Consistency of layout and navigation Consistency of layout of symbols or text on pages
Cost Cost of purchase including warranty or repair
Durability and reliability How robust the aided AAC system is, how frequently
or easily it stops working
Ease of customization How intuitive and easy is it to add and change
vocabulary and customize other features such as
changing the volume
Ease of mounting on a range of
equipment
The compatibility of the aided AAC system with
different mounting systems and to be used with
different equipment (e.g. power chair)
Graphic representation Type of symbol or text used
Number of cells per page The number of cells or locations for symbols or text
on each page in an aided AAC system
Number of key presses required to
generate symbol or text output
Number of selections required to generate symbol or
text output
Portability Ease of carrying or moving the aided AAC system
Range of access methods Range of access methods offered to allow control of
the aided AAC system
Size of output vocabulary The size of the output vocabulary available within the
aided AAC system
Supplier support Technical and training support provided by AAC
device company
Type of vocabulary organization Format used to organize the vocabulary within the
aided AAC system for example
Vocabulary or language package(s) Preprogrammed vocabulary set(s)
Voice The type and quality of voice output provided by the
aided AAC system

34
Table 1
Participant Characteristics
Variable Sub-variable n %
Age 18 – 24 2 2.15
25 – 34 29 31.18
35 – 44 34 36.56
45 – 54 19 20.43
55 – 64 9 9.68
Gender Female 84 90.32
Male 7 7.53
Prefer not to say 2 2.15
Ethnicity White – English/Welsh/Scottish/Northern
Irish/British
80 86.02
White: Any other White background 7 7.53
White: Irish 4 4.3
Asian/Asian British: Chinese 1 1.08
Mixed/multiple ethnic group: White and Asian 1 1.08
Experience (years) < 1 2 2.15
1 – 4 27 29.03
5 – 10 22 23.66
> 10 42 45.16
Professional
background
Speech and language therapist 66 70.97
Other 9 9.68
Occupational therapist 7 7.53
Assistive technology specialist 5 5.38
Teacher 4 4.3
Clinical scientist 4 4.3
% of role relating to
AAC
1-20% 9 9.68
20-40% 15 16.13
40-60% 19 20.43
60-80% 9 9.68
80-100% 41 44.09
Workplace Education establishments 71 76.34
Healthcare setting 58 62.37
Person's own home 43 46.24
Residential care 22 23.66
Day care settings 18 19.35
Other 3 3.23
Note. N = 93. For some questions more than one response was allowed, so percentages do not
always sum to 100%

35
Table 2
Common Diagnoses and Age Groups Participants Reported Prescribing for, and Workplace
Locations
Variable Sub-variable n %
Most common
diagnoses
Neuromuscular (including cerebral palsy) 71 76.34
Intellectual disability/developmental Delay 66 70.97
Autism spectrum disorder 59 63.44
Neurological 35 37.63
Syndromes 34 36.56
Dyspraxia 11 11.83
Specific speech/language impairment 11 11.83
Other 4 4.3
Unknown 2 2.15
Age group Preschool age 39 41.94
Primary school age 51 54.84
Secondary school age 53 56.99
All age groups 36 38.71
Higher education 11 11.83
Further education 7 7.53
Adults 6 6.45
Other 3 3.23
Location (figures
in parentheses
give percentage
of UK population
from 2011
census)
North West England 19 20.43 (11.16)
South East England 16 17.2 (13.67)
Yorkshire and Humber 15 16.13 (8.36)
Wales 9 7.53 (4.85)
West Midlands 9 9.68 (8.87)
Northern Ireland 7 7.53 (2.87)
East Midlands 7 7.53 (7.17)
South West England 5 5.38 (8.37)
East of England 4 4.3 (9.25)
London 4 4.3 (12.94)
Scotland 3 3.23 (8.38)
North East England 2 2.15 (4.11)
Non-UK 1 1.08
Note. N = 93. For some questions more than one response was allowed, so percentages do not
always sum to 100%

36
Table 1
Relative Importance Scores for Child Characteristics and AAC Device Attributes
Child characteristics Mean 95% CI P-value
Child’s receptive and expressive language abilities 11.4 10.6 12.3 <.001*
Support for AAC from communication partners 11 10.2 11.8 <.001*
Communication ability with aided AAC 10.4 9.73 11.1 <.001*
Child's determination and persistence 9.93 9.13 10.7 <.001*
Physical abilities for access 8.94 8.11 9.75 <.001*
Predicted future needs and abilities 7.04 6.15 8.03 .002*
Level of learning ability 6.86 5.77 7.84 .012
Insight into own communicative skills 5.67 4.78 6.53 .438
Attention level 5.08 3.88 6.42 .811
Access to professional AAC support 4.88 3.9 5.93 .538
Speech skills and intelligibility 4.38 3.54 5.3 .101
Functional visual skills 3.64 2.7 4.65 .007*
History of aided AAC use 2.55 1.66 3.34 <.001*
Presence of additional diagnoses 2.21 1.53 2.93 <.001*
Level of fatigue 1.96 1.45 2.51 <.001*
Literacy ability 1.65 1.02 2.32 <.001*
Educational stage 1.14 0.53 1.72 <.001*
Primary diagnosis 1.09 0.53 1.72 <.001*
Mobility 0.19 0.02 0.59 <.001*
AAC device attributes Mean 95% CI P-value
Vocabulary or language package(s) 11 9.9 12 <.001*
Consistency of layout and navigation 10.6 9.64 11.5 <.001*
Ease of customization 9.92 9.02 10.9 <.001*
Durability and reliability 9.62 8.65 10.6 <.001*
Type of vocabulary organization 9.36 8.44 10.3 <.001*
Number of key presses required to generate symbol or
text output 7.98 7.04 8.92 <.001*
Size of output vocabulary 6.62 5.69 7.56 .062
Range of access methods 5.9 5.08 6.77 .500
Number of cells per page 5.28 4.2 6.34 .673
Portability 5.1 4.09 6.11 .458
Graphic representation 4.82 3.87 5.8 .211
Battery life 4.3 3.34 5.3 .038
Supplier support 3.22 2.44 4.01 <.001*
Ease of mounting on a range of equipment 2.65 1.92 3.45 <.001*
Cost 1.44 0.83 2.15 <.001*
Additional assistive technology functions 1 0.51 1.57 <.001*
Voice 0.97 0.42 1.59 <.001*
Appearance 0.31 0.05 0.75 <.001*
37
Note. N = 93. CI = confidence interval.
* indicates RIS significantly different at 5% level from average importance (RIS=5.56 for
children, RIS = 5.55 for devices ) corrected using Holm’s sequential Bonferroni (Holm 1979).
38
Table 2
Pairwise Comparison of Relative Importance Scores for Child Characteristics
Support fo
r AA
C fro
m co
mm
unicatio
n
partn
ers
Com
municatio
n ab
ility w
ith aid
ed A
AC
Child
's determ
inatio
n an
d p
ersistence
Physical ab
ilities for access
Pred
icted fu
ture n
eeds an
d ab
ilities
Lev
el of learn
ing ab
ility
Insig
ht in
to o
wn co
mm
unicativ
e skills
Atten
tion lev
el
Access to
pro
fessional A
AC
support
Speech
skills an
d in
telligib
ility
Functio
nal v
isual sk
ills
Histo
ry o
f aided
AA
C u
se
Presen
ce of ad
ditio
nal d
iagnoses
Lev
el of fatig
ue
Literacy
ability
Educatio
nal stag
e
Prim
ary d
iagnosis
Mobility
Child’s receptive and
expressive language abilities - - - * * * * * * * * * * * * * * *
Support for AAC from
communication partners - - - * * * * * * * * * * * * * *
Communication ability with
aided AAC - - * * * * * * * * * * * * * *
Child's determination and
persistence - * * * * * * * * * * * * * *
Physical abilities for access - - * * * * * * * * * * * *
Predicted future needs and
abilities - - - - * * * * * * * * *
Level of learning ability - - - - * * * * * * * *
Insight into own
communicative skills - - - - * * * * * * *
Attention level - - - - - * * * * *
Access to professional AAC
support - - - * * * * * *
Speech skills and
intelligibility - - - * * * * *
Functional visual skills - - - - * * *
History of aided AAC use - - - - - *
Presence of additional
diagnoses - - - - *
Level of fatigue - - - *
Literacy ability - - -
Educational stage - -
Primary diagnosis -

39
Note. N = 93. * indicates significant difference in relative importance at the 5% level corrected
using Holm's sequential Bonferroni (Holm 1979).

40
Table 3
Significant Differences in Relative Importance Scores for Child Characteristics and Device
Related Attributes According to Demographic Variables
Demographic variable Child characteristic
mean RIS (s.e.)
Participants
in group
Participants
not in group
Professional background as a speech
and language therapist
Educational stage 1.53 0.175
(0.33) (0.08)
Work in an educational setting Literacy ability 2.09 0.233
(0.38) (0.09)
Work in a healthcare setting Educational stage 1.64 0.307
(0.36) (0.14)
Reported neuromuscular conditions as
one of the three most common
diagnoses they see
Level of fatigue 2.43 0.447
(0.49) (0.40)
Reported intellectual/developmental
delay as one of the three most
common diagnoses they see
History of aided AAC use 3.1 0.0374
(0.51) (0.02)
Reported autism as one of the three
most common diagnoses they see
Level of fatigue 0.748 4.06
(0.24) (0.97)
AAC device attribute
Professional background as a speech
and language therapist
Additional assistive
technology functions
1.36 0.128
(0.34) (0.08)
Role at least 60% AAC related Range of access methods 8.33 3.08
(1.23) (0.61)
Work in an educational setting Supplier support 3.8 1.32
(0.58) (0.44)
Voice 1.23 0.127
(0.32) (0.04)
Reported neuromuscular conditions as
one of the three most common
diagnoses they see
Range of access methods 7.06 2.17
(0.92) (0.65)
Additional assistive
technology functions
1.28 0.121
(0.32) (0.05)
Reported intellectual/developmental
delay as one of the three most
common diagnoses they see
Additional assistive
technology functions
1.34 0.179
(0.34) (0.07)
Reported autism as one of the three
most common diagnoses they see
Ease of mounting on a
range of equipment
0.96 5.59
(0.20) (1.05)
Note. N = 93. s.e. = standard error; significance judged at the 5% level with p-values corrected
using Holm’s sequential Bonferroni (Holm 1979).
41
Table 4
Pairwise Comparison of Relative Importance Scores for AAC Device Attributes
Consisten
cy o
f layout an
d n
avig
ation
Ease o
f custo
mizatio
n
Durab
ility an
d reliab
ility
Type o
f vocab
ulary
org
anizatio
n
Num
ber o
f key
presses req
uired
Size o
f outp
ut v
ocab
ulary
Ran
ge o
f access meth
ods
Num
ber o
f cells per p
age
Portab
ility
Grap
hic rep
resentatio
n
Battery
life
Supplier su
pport
Ease o
f mountin
g o
n a ran
ge o
f equip
men
t
Cost
Additio
nal assistiv
e technolo
gy fu
nctio
ns
Voice
Appearan
ce
Vocabulary or language
package(s) - - - - * * * * * * * * * * * * *
Consistency of layout
and navigation - - - - * * * * * * * * * * * *
Ease of customization - - - * * * * * * * * * * * *
Durability and reliability - - * * * * * * * * * * * *
Type of vocabulary
organization - * * * * * * * * * * * *
Number of key presses
required to generate
symbol or text output
- - - * * * * * * * * *
Size of output vocabulary - - - - - * * * * * *
Range of access methods - - - - * * * * * *
Number of cells per page - - - - - * * * *
Portability - - - - * * * *
Graphic representation - - - * * * *
Battery life - - * * * *
Supplier support - - * * *
Ease of mounting on a
range of equipment - - - *
Cost - - -
Additional assistive
technology functions - -
Voice -
Note. N = 93. * indicates significant difference in relative importance at the 5% level corrected
using Holm's sequential Bonferroni (Holm, 1979).

42
Figure 1. Example decision screen

43
Appendix
Statistical Analysis Methods
All analysis was carried out using R version 3.3.1.
Analysis was grounded in random utility theory. The utility individual 𝑖 receives from
choosing option 𝑘 ∈ {1,2, … ,6} in choice situation 𝑗 is modelled as being
𝑢𝑖𝑗𝑘 =∑𝛽𝑖𝑙𝑥𝑗𝑘𝑙 + 휀𝑗𝑘𝑙
𝑁𝐴
𝑙=1
where 𝑥𝑗𝑘𝑙is a dummy variable indicating whether option 𝑘 includes attribute/characteristic 𝑙 or
not, 𝛽𝑖𝑙 is a parameter representing individual 𝑖’s preference for attribute/characteristic 𝑙, 휀𝑖𝑗𝑘 is
an i.i.d. extreme value error term, and 𝑁𝐴 is the total number of attributes/characteristics.
Each BWS question is considered to consist of two choice situations: one to select the
most important attribute/characteristic and one to select the least important. For choice situations
selecting the most important attribute, 𝑥𝑗𝑘𝑙 takes the value 1 if option 𝑘 contains
attribute/characteristic 𝑙 and 0 otherwise. For choice situations selecting the least important, 𝑥𝑗𝑘𝑙
takes the value -1 if option 𝑘 contains attribute/characteristic 𝑙 and 0 otherwise.
Estimates of the 𝛽 parameters were obtained from random parameters logit (also
commonly known as mixed logit) models. For a given attribute, 𝑙, individuals’ parameters were
assumed to be normally distributed with mean �̅�𝑖𝑙 and variance 𝜎𝑙. The distribution mean was
allowed to depend on respondent characteristics according to
�̅�𝑖𝑙 = 𝛽𝑙0 + ∑ 𝛿𝑙𝑚𝑍𝑖𝑚 + 𝜂𝑖𝑙
𝑀
𝑚=1
where 𝛽𝑙0 is a constant, the 𝑍𝑖𝑚 are 𝑀 variables representing characteristics of individual 𝑖, the
𝛿𝑙𝑚 are parameters giving the dependence of preference on characteristics and 𝜂𝑖𝑙 is a normally

44
distributed error term. The 𝑍 included were a series of dummy variables, with the details given in
Table A1.
Individual level parameters were estimated using hierarchical Bayes as implemented in
the ChoiceModelR package for R. Priors for parameter means were taken from analytical best-
worst scaling scores (Lipovetsky & Conklin, 2014), prior variance was 2 for all parameters. The
Markov Choice Monte Carlo algorithm was run until stationarity was achieved as assessed by the
Geweke test (Geweke, 1992) implemented in the MCMCPack package for R.
The relative importance score (RIS) of attribute/characteristic 𝑙 for individual 𝑖 is then
(see (Orme, 2005)) calculated using
𝑅𝐼𝑆𝑖𝑙 =100𝑒�̂�𝑖𝑙
𝑒�̂�𝑖𝑙 + 𝑁𝐴 − 1∑
𝑒�̂�𝑖𝑙 + 𝑁𝐴 − 1
𝑒�̂�𝑖𝑙
𝑁𝐴
𝑙=1
where �̂�𝑖𝑙 is the estimated individual level coefficient on attribute/characteristic 𝑙 for respondent
𝑖. Mean RIS is then calculated across participants for each attribute.
There were t-tests performed of the null hypotheses that each attribute/characteristic was
of average relative importance, and also for each pair of attributes/characteristics of the null that
they were of equal RIS. Whether RIS differed according to each of the demographic variables in
Table A1 was examined using t-tests.
Kolmogrov-Smirnov tests were used to test the null hypothesis that
attributes/characteristics in each position on the list were selected equally as often. Respondents
were split according to whether their choices displayed above or below the median proportion of
consistency and transitivity. Whether RIS differed significantly between the two groups was
assessed using t-tests.

45
Statistical significance was judged at the 5% level, with adjustment for multiple testing
using Holm’s sequential Bonferroni correction (Holm, 1979).

46
Table A1
Respondent Demographic Variables Included in Regression Models, Description, and Number of
Participants in Each Group
Demographic group Number in
group %
Participant aged 35 or older 62 67.4
Participants with 5 or more years of AAC experience 64 69.6
Participants with a professional background as a speech and language
therapist 66 71.7
Participants whose role is at least 60% AAC related 50 54.3
Participants who work in an educational setting 71 77.1
Participants who work in a healthcare setting 58 63.0
Participants who work in a person’s own home 43 46.7
Participants who reported neuromuscular conditions as one of the three most
common diagnoses they see 71 77.2
Participants who report intellectual/developmental delay as one of the three
most common diagnoses they see 66 71.7
Participants who report autism as one of the three most common diagnoses
they see 59 64.1
Note. N = 93