Embed Size (px)
Citation preview

Many games involve probability and
chance. One game uses this spinner or
a number cube labelled 1 to 6.
You can choose to spin the pointer or
roll the number cube. You win if the
pointer lands on red. You win
if you roll a 6. Are you
more likely to win if
you spin the
pointer or roll
the number
cube?
Explain.
What You’ll Learn• Use the language of probability.
• Conduct simple experiments.
• List the possible outcomes of experiments
by using tree diagrams, modelling, and lists.
• Identify possible outcomes and
favourable outcomes.
• State the probability of an outcome.
• Understand how probability can relate
to sports and games of chance.
• Use probability to solve problems.
Why It’s ImportantIn the media, you hear and read
statements about the probability of
everyday events, such as living to be
100 or winning the lottery.
To make sense of these statements,
you need to understand probability.
Gr7 Math/U11/F3 7/21/04 11:18 AM Page 404

Key Words• probability
• outcome
• tree diagram
• relative frequency
• experimentalprobability
• theoreticalprobability
Gr7 Math/U11/F3 7/21/04 11:19 AM Page 405
✓
406 UNIT 11: Probability
� 2
� 2
� 25
� 25
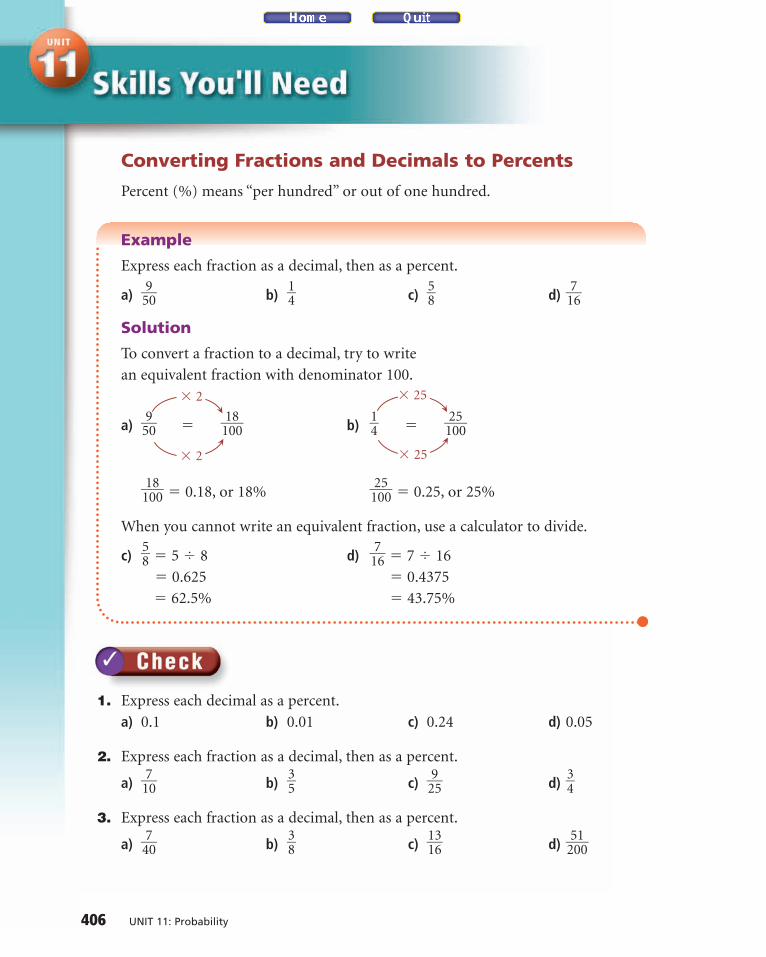
Converting Fractions and Decimals to Percents
Percent (%) means “per hundred” or out of one hundred.
Example
Express each fraction as a decimal, then as a percent.
a) �590� b) �
14� c) �
58� d) �1
76�
Solution
To convert a fraction to a decimal, try to write
an equivalent fraction with denominator 100.
a) �590� � �1
1080� b) �
14� � �1
2050�
�11080� � 0.18, or 18% �1
2050� � 0.25, or 25%
When you cannot write an equivalent fraction, use a calculator to divide.
c) �58� � 5 � 8 d) �1
76� � 7 � 16
� 0.625 � 0.4375
� 62.5% � 43.75%
1. Express each decimal as a percent.
a) 0.1 b) 0.01 c) 0.24 d) 0.05
2. Express each fraction as a decimal, then as a percent.
a) �170� b) �
35� c) �2
95� d) �
34�
3. Express each fraction as a decimal, then as a percent.
a) �470� b) �
38� c) �
11
36� d) �2
5010�
Gr7 Math/U11/F1 7/20/04 12:29 PM Page 406
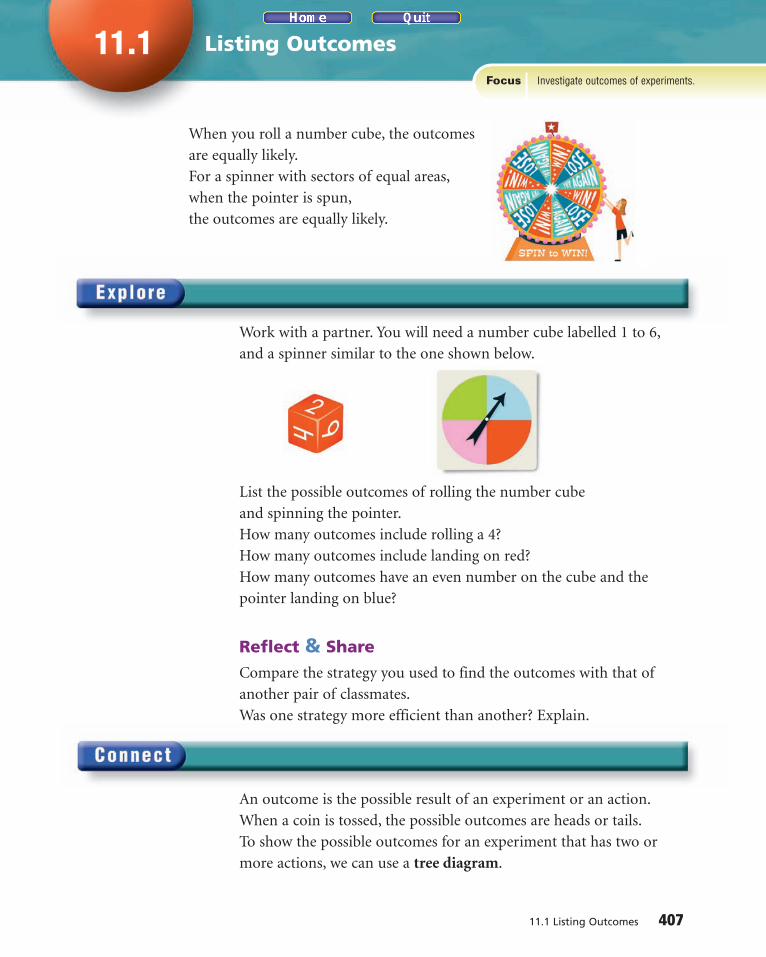
Work with a partner. You will need a number cube labelled 1 to 6,
and a spinner similar to the one shown below.
List the possible outcomes of rolling the number cube
and spinning the pointer.
How many outcomes include rolling a 4?
How many outcomes include landing on red?
How many outcomes have an even number on the cube and the
pointer landing on blue?
Reflect & Share
Compare the strategy you used to find the outcomes with that of
another pair of classmates.
Was one strategy more efficient than another? Explain.
An outcome is the possible result of an experiment or an action.
When a coin is tossed, the possible outcomes are heads or tails.
To show the possible outcomes for an experiment that has two or
more actions, we can use a tree diagram.
11.1 Listing Outcomes 407
11.1 Listing Outcomes
Investigate outcomes of experiments.Focus
When you roll a number cube, the outcomes
are equally likely.
For a spinner with sectors of equal areas,
when the pointer is spun,
the outcomes are equally likely.
Gr7 Math/U11/F1 7/20/04 12:30 PM Page 407
408 UNIT 11: Probability
Example
Solution
HH HH
HT
TH
TT
T
H
TT
1st Coin 2nd Coin Outcomes
When 2 coins are tossed, the outcomes for each coin
are heads (H) or tails (T).
List the outcomes of the first coin toss.
For each outcome, list the outcomes of the second coin toss.
Then list the outcomes for the coins tossed together.
There are 4 possible outcomes: HH, HT, TH, TT
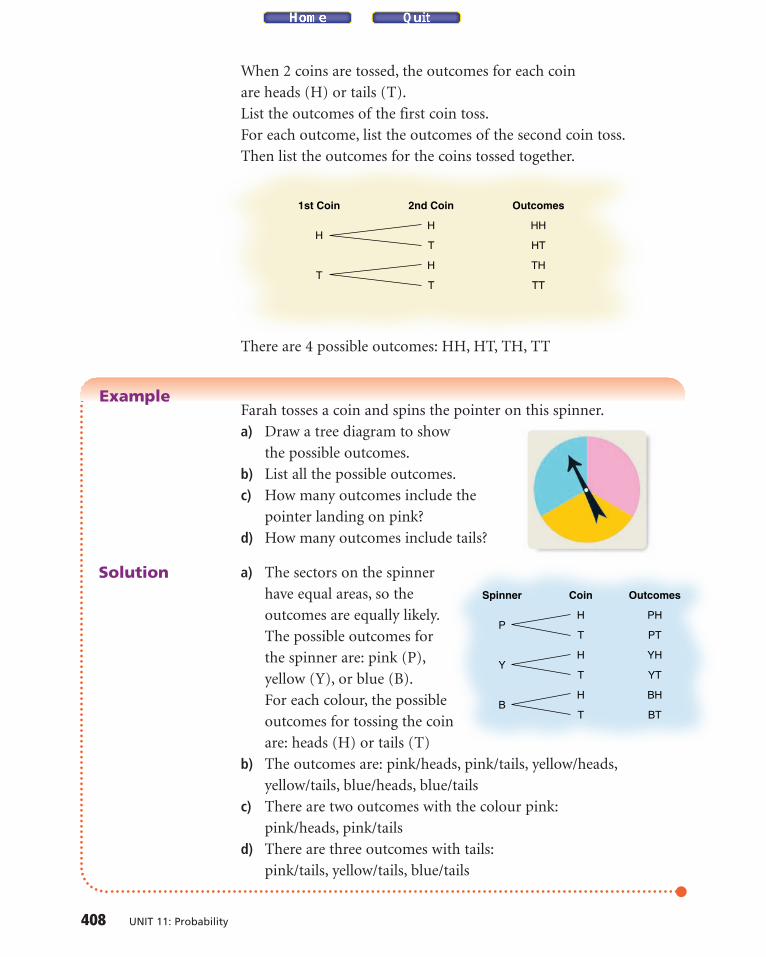
Farah tosses a coin and spins the pointer on this spinner.
a) Draw a tree diagram to show
the possible outcomes.
b) List all the possible outcomes.
c) How many outcomes include the
pointer landing on pink?
d) How many outcomes include tails?
a) The sectors on the spinner
have equal areas, so the
outcomes are equally likely.
The possible outcomes for
the spinner are: pink (P),
yellow (Y), or blue (B).
For each colour, the possible
outcomes for tossing the coin
are: heads (H) or tails (T)
b) The outcomes are: pink/heads, pink/tails, yellow/heads,
yellow/tails, blue/heads, blue/tails
c) There are two outcomes with the colour pink:
pink/heads, pink/tails
d) There are three outcomes with tails:
pink/tails, yellow/tails, blue/tails
PH PH
PT
YH
YT
BH
BT
T
H
TY
Spinner Coin Outcomes
H
TB
Gr7 Math/U11/F1 7/20/04 12:30 PM Page 408

11.1 Listing Outcomes 409
1. List the possible outcomes in each case.
a) spinning the pointer b) rolling a number cube
labelled 1 to 6
2. List the possible outcomes in each case.
a) the colour of a traffic light when you reach it
b) the gender of a baby who is born
c) the points scored in a hockey game
d) the suit of a card pulled from a deck of playing cards
3. The Scenic Railroad sells tickets for trips on Saturdays and
Sundays. All-day and half-day trips are available. There are adult,
child, and senior fares. Draw a tree diagram to show the possible
ticket types.
4. Use a tree diagram to show the possible combinations for
breakfast. You must choose one of each:
• eggs or fruit
• toast, pancakes, or cereal
• milk or juice
5. Jim has to choose an outfit. His choices of pants are black, grey,
or navy. His sweater choices are red, beige, white, or yellow.
a) Draw a tree diagram to display all the possible outfits.
b) How many outfits have either black pants or a white sweater?
c) How many outfits do not have black pants or do not have a
white sweater?
d) How many outfits have a black sweater?
6. A deli offers 2 soups, 4 salads, 5 sandwiches, and 3 beverages.
How many choices are there for a customer who wants
each of the following meals?
a) a salad and a beverage
b) soup, a sandwich, and a beverage
c) soup, a salad, and a beverage
d) a sandwich or salad, and a soup
Mental Math
Simplify.
• (�3) � (�5)
• (�3) � (�5)
• (�3) � (�5)
• (�3) � (�5)
Gr7 Math/U11/F2 7/20/04 3:37 PM Page 409
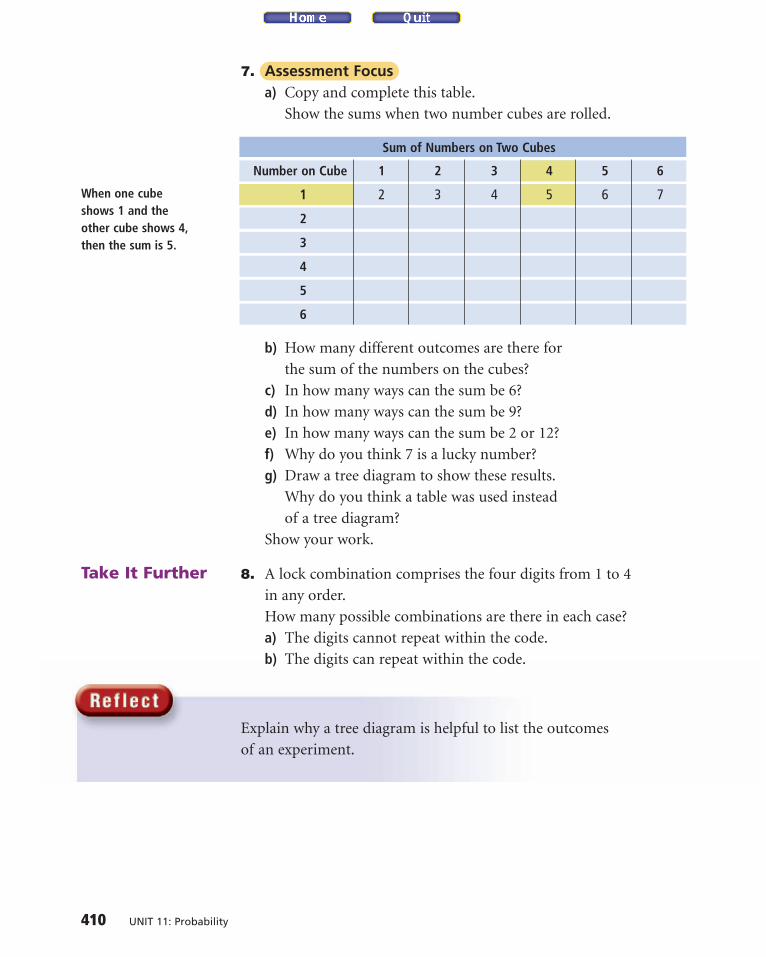
7. Assessment Focusa) Copy and complete this table.
Show the sums when two number cubes are rolled.
b) How many different outcomes are there for
the sum of the numbers on the cubes?
c) In how many ways can the sum be 6?
d) In how many ways can the sum be 9?
e) In how many ways can the sum be 2 or 12?
f) Why do you think 7 is a lucky number?
g) Draw a tree diagram to show these results.
Why do you think a table was used instead
of a tree diagram?
Show your work.
8. A lock combination comprises the four digits from 1 to 4
in any order.
How many possible combinations are there in each case?
a) The digits cannot repeat within the code.
b) The digits can repeat within the code.
Explain why a tree diagram is helpful to list the outcomes
of an experiment.
410 UNIT 11: Probability
When one cubeshows 1 and theother cube shows 4,then the sum is 5.
Take It Further
Sum of Numbers on Two Cubes
Number on Cube 1 2 3 4 5 6
1 2 3 4 5 6 7
2
3
4
5
6
Gr7 Math/U11/F1 7/20/04 12:30 PM Page 410
11.2 Experimental Probability 411
11.2 Experimental Probability
Determine probability from experiments.Focus
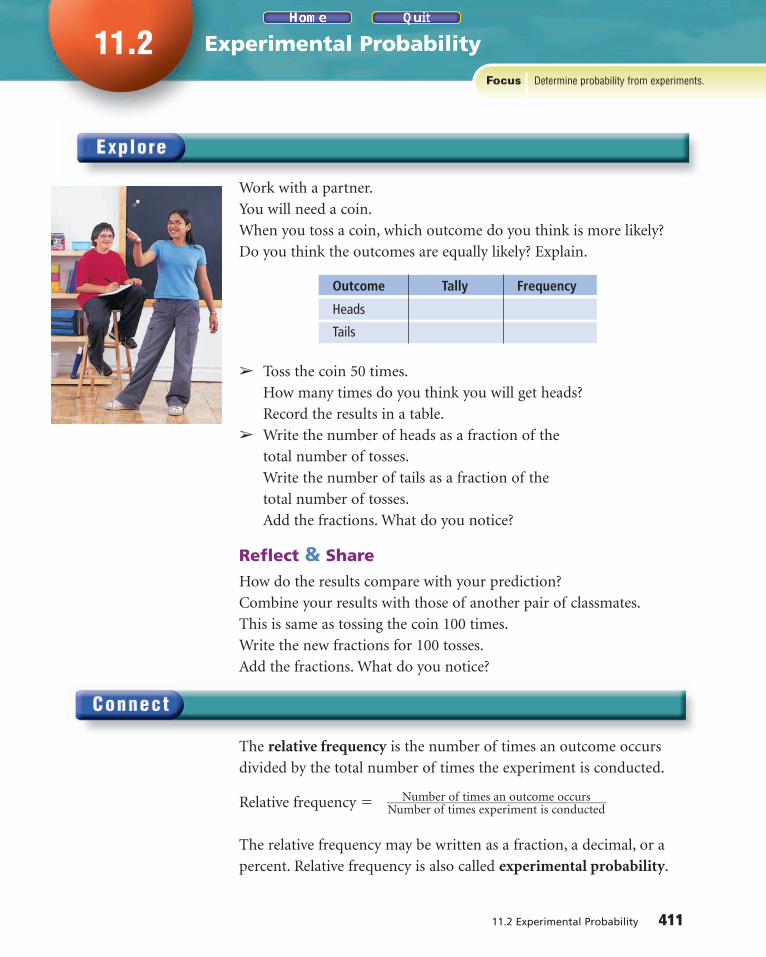
Work with a partner.
You will need a coin.
When you toss a coin, which outcome do you think is more likely?
Do you think the outcomes are equally likely? Explain.
➢ Toss the coin 50 times.
How many times do you think you will get heads?
Record the results in a table.
➢ Write the number of heads as a fraction of the
total number of tosses.
Write the number of tails as a fraction of the
total number of tosses.
Add the fractions. What do you notice?
Reflect & Share
How do the results compare with your prediction?
Combine your results with those of another pair of classmates.
This is same as tossing the coin 100 times.
Write the new fractions for 100 tosses.
Add the fractions. What do you notice?
The relative frequency is the number of times an outcome occurs
divided by the total number of times the experiment is conducted.
Relative frequency �
The relative frequency may be written as a fraction, a decimal, or a
percent. Relative frequency is also called experimental probability.
Outcome Tally Frequency
Heads
Tails
Number of times an outcome occurs�����Number of times experiment is conducted
Gr7 Math/U11/F1 7/20/04 12:30 PM Page 411
Example
Solution
412 UNIT 11: Probability
Use a calculator to write each fraction as adecimal.
When a thumbtack is dropped,
it can land with its point up or
on its side.
Here are the results of 100 drops:
Relative frequency of Point up �
� �14060� , or 0.46
Relative frequency of On its side �
� �15040� , or 0.54
The sum of the relative frequencies for an
experiment is 1.
That is, �14060� + �1
5040� � 0.46 + 0.54
� 1
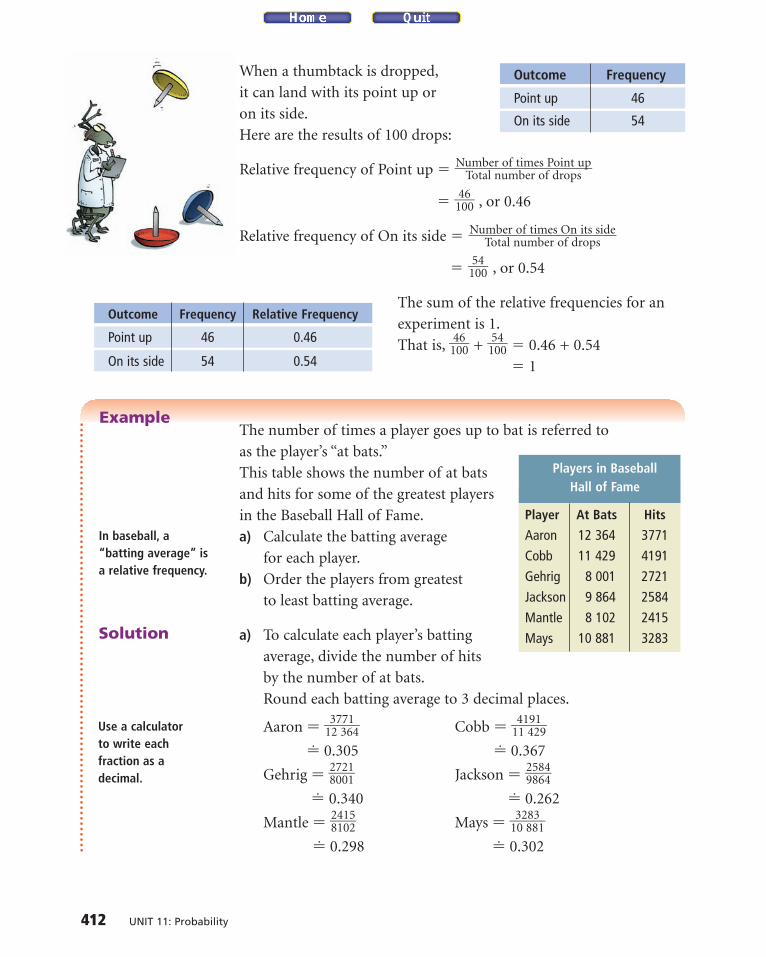
The number of times a player goes up to bat is referred to
as the player’s “at bats.”
This table shows the number of at bats
and hits for some of the greatest players
in the Baseball Hall of Fame.
a) Calculate the batting average
for each player.
b) Order the players from greatest
to least batting average.
a) To calculate each player’s batting
average, divide the number of hits
by the number of at bats.
Round each batting average to 3 decimal places.
Aaron � �132737614� Cobb � �1
41149219�
� 0.305 � 0.367
Gehrig � �28
70
20
11� Jackson � �
29
58
86
44�
� 0.340 � 0.262
Mantle � �28
41
10
52� Mays � �1
30288831�
� 0.298 � 0.302
Outcome Frequency Relative Frequency
Point up 46 0.46
On its side 54 0.54
Outcome Frequency
Point up 46
On its side 54
Players in Baseball Hall of Fame
Player At Bats Hits
Aaron 12 364 3771
Cobb 11 429 4191
Gehrig 8 001 2721
Jackson 9 864 2584
Mantle 8 102 2415
Mays 10 881 3283
Number of times Point up���Total number of drops
Number of times On its side���Total number of drops
In baseball, a“batting average” isa relative frequency.
Gr7 Math/U11/F1 7/20/04 12:30 PM Page 412
11.2 Experimental Probability 413
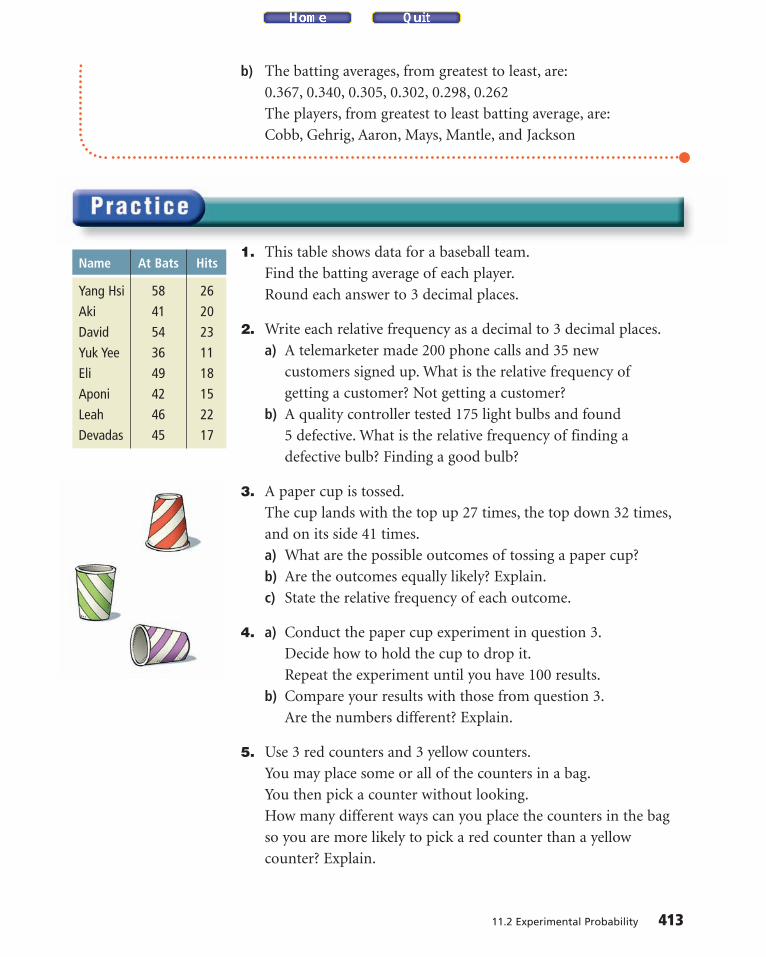
Name At Bats Hits
Yang Hsi 58 26
Aki 41 20
David 54 23
Yuk Yee 36 11
Eli 49 18
Aponi 42 15
Leah 46 22
Devadas 45 17
b) The batting averages, from greatest to least, are:
0.367, 0.340, 0.305, 0.302, 0.298, 0.262
The players, from greatest to least batting average, are:
Cobb, Gehrig, Aaron, Mays, Mantle, and Jackson
1. This table shows data for a baseball team.
Find the batting average of each player.
Round each answer to 3 decimal places.
2. Write each relative frequency as a decimal to 3 decimal places.
a) A telemarketer made 200 phone calls and 35 new
customers signed up. What is the relative frequency of
getting a customer? Not getting a customer?
b) A quality controller tested 175 light bulbs and found
5 defective. What is the relative frequency of finding a
defective bulb? Finding a good bulb?
3. A paper cup is tossed.
The cup lands with the top up 27 times, the top down 32 times,
and on its side 41 times.
a) What are the possible outcomes of tossing a paper cup?
b) Are the outcomes equally likely? Explain.
c) State the relative frequency of each outcome.
4. a) Conduct the paper cup experiment in question 3.
Decide how to hold the cup to drop it.
Repeat the experiment until you have 100 results.
b) Compare your results with those from question 3.
Are the numbers different? Explain.
5. Use 3 red counters and 3 yellow counters.
You may place some or all of the counters in a bag.
You then pick a counter without looking.
How many different ways can you place the counters in the bag
so you are more likely to pick a red counter than a yellow
counter? Explain.
Gr7 Math/U11/F1 7/20/04 12:30 PM Page 413

6. Copy and continue the table to show all months of the year.
Have each student write her or his month of birth on the board.
Find the number of students who were born in each month.
a) Complete the table.
b) What is the relative frequency for
birthdays in the same month as yours?
c) Find the sum of the relative frequencies.
Explain why this sum makes sense.
7. Assessment Focus A regular octahedron has faces labelled
1 to 8. Two of these octahedra are rolled.
The numbers on the faces the octahedra land on are added.
Work with a partner. Use the regular octahedra you made in
Unit 3. Label the faces of each octahedron from 1 to 8.
Conduct an experiment to find the relative frequency of getting a
sum of 7 when two regular octahedra are rolled.
a) Report your results.
b) How are the results affected if you conduct the experiment
10 times? 50 times? 100 times? Explain.
Suppose you know the relative frequency of one outcome
of an experiment.
How can you use that to predict the likelihood of that outcome
occurring if you conduct the experiment again?
Use an example to explain.
Month Tally Frequency Relative Frequency
January
February
March
Number Strategies
Find each percent.
• 10% of $325.00
• 15% of $114.00
• 20% of $99.99
• 25% of $500.00
414 UNIT 11: Probability
Gr7 Math/U11/F1 7/20/04 12:33 PM Page 414
Mid-Unit Review 415
1. Jenna plays a video game on her
computer. Each time she plays, she
can choose an easy, intermediate, or
challenging level of difficulty. She
can also choose 1 or 2 players.
Use a tree diagram to show the
possible game choices.
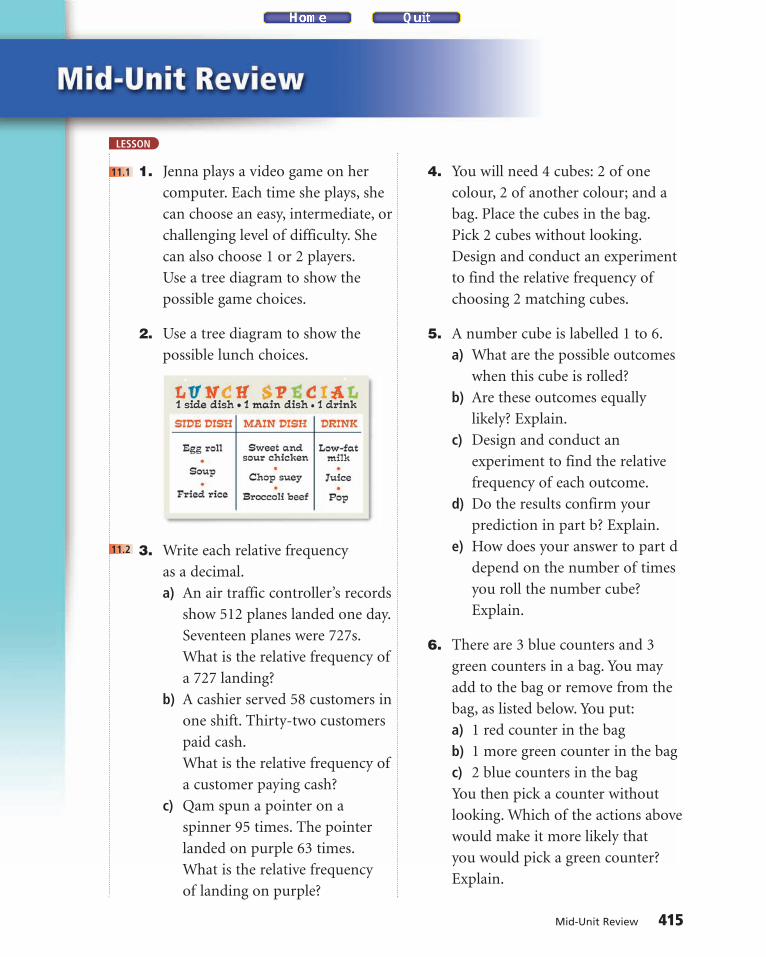
2. Use a tree diagram to show the
possible lunch choices.
3. Write each relative frequency
as a decimal.
a) An air traffic controller’s records
show 512 planes landed one day.
Seventeen planes were 727s.
What is the relative frequency of
a 727 landing?
b) A cashier served 58 customers in
one shift. Thirty-two customers
paid cash.
What is the relative frequency of
a customer paying cash?
c) Qam spun a pointer on a
spinner 95 times. The pointer
landed on purple 63 times.
What is the relative frequency
of landing on purple?
4. You will need 4 cubes: 2 of one
colour, 2 of another colour; and a
bag. Place the cubes in the bag.
Pick 2 cubes without looking.
Design and conduct an experiment
to find the relative frequency of
choosing 2 matching cubes.
5. A number cube is labelled 1 to 6.
a) What are the possible outcomes
when this cube is rolled?
b) Are these outcomes equally
likely? Explain.
c) Design and conduct an
experiment to find the relative
frequency of each outcome.
d) Do the results confirm your
prediction in part b? Explain.
e) How does your answer to part d
depend on the number of times
you roll the number cube?
Explain.
6. There are 3 blue counters and 3
green counters in a bag. You may
add to the bag or remove from the
bag, as listed below. You put:
a) 1 red counter in the bag
b) 1 more green counter in the bag
c) 2 blue counters in the bag
You then pick a counter without
looking. Which of the actions above
would make it more likely that
you would pick a green counter?
Explain.
LESSON
11.1
11.2
Gr7 Math/U11/F1 7/20/04 12:33 PM Page 415
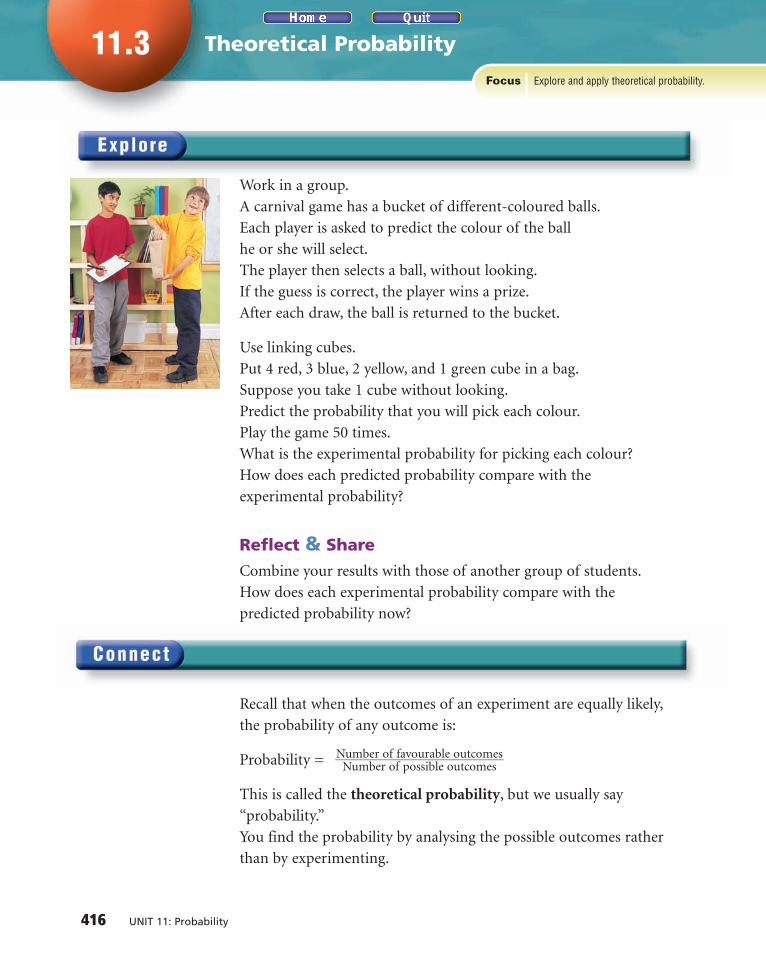
Work in a group.
A carnival game has a bucket of different-coloured balls.
Each player is asked to predict the colour of the ball
he or she will select.
The player then selects a ball, without looking.
If the guess is correct, the player wins a prize.
After each draw, the ball is returned to the bucket.
Use linking cubes.
Put 4 red, 3 blue, 2 yellow, and 1 green cube in a bag.
Suppose you take 1 cube without looking.
Predict the probability that you will pick each colour.
Play the game 50 times.
What is the experimental probability for picking each colour?
How does each predicted probability compare with the
experimental probability?
Reflect & Share
Combine your results with those of another group of students.
How does each experimental probability compare with the
predicted probability now?
Recall that when the outcomes of an experiment are equally likely,
the probability of any outcome is:
Probability =
This is called the theoretical probability, but we usually say
“probability.”
You find the probability by analysing the possible outcomes rather
than by experimenting.
416 UNIT 11: Probability
11.3 Theoretical Probability
Explore and apply theoretical probability.Focus
Number of favourable outcomes����Number of possible outcomes
Gr7 Math/U11/F1 7/20/04 12:33 PM Page 416
11.3 Theoretical Probability 417
When you pick anobject withoutlooking, the object ispicked at random.
Example
Solution
Twenty counters were put in a bag:
7 green, 6 black, 5 orange, and 2 purple
You take one counter from the bag without looking.
There are 4 outcomes: green, black, orange, and purple
Suppose the favourable outcome is black.
Then, the probability of picking a black counter is: �260� � 0.3
Suppose the favourable outcome is green.
Then, the probability of picking a green counter is: �270� � 0.35
Note that the outcomes are not equally likely.
We can predict the possible number of times an outcome will occur
by multiplying the probability by the number of repetitions.
Suppose we pick a counter at random 54 times.
Then, the predicted number of times a black counter is picked is:
54 � 0.3 � 16.2
We would expect to pick a black counter about 16 times.
However, we may never pick a black counter, or we might always
pick a black counter.
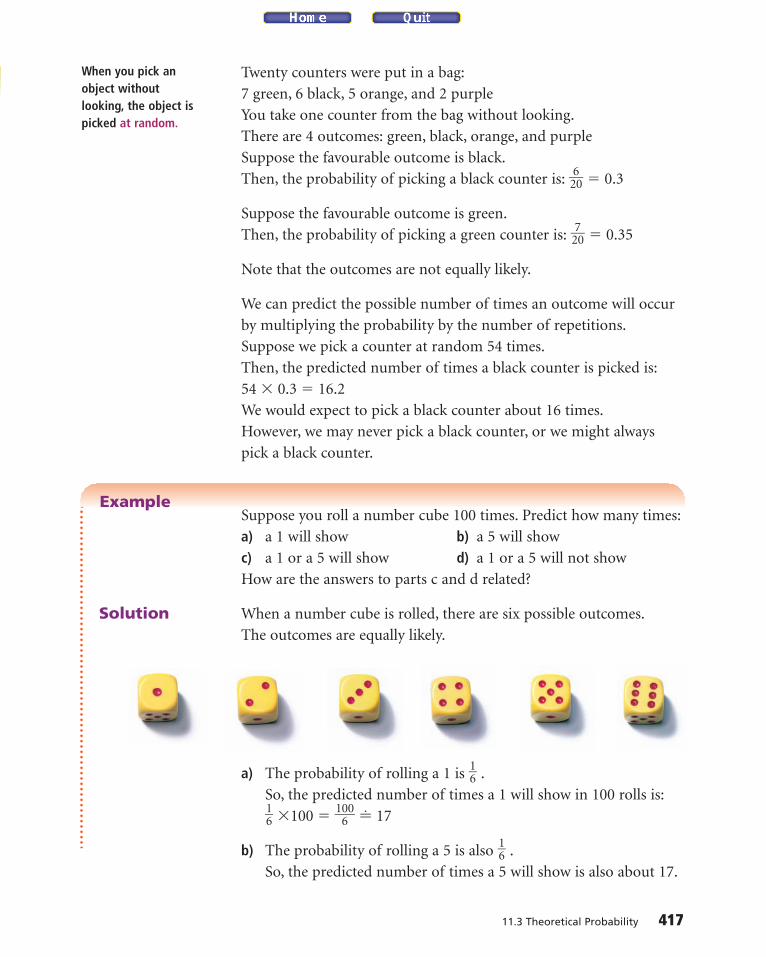
Suppose you roll a number cube 100 times. Predict how many times:
a) a 1 will show b) a 5 will show
c) a 1 or a 5 will show d) a 1 or a 5 will not show
How are the answers to parts c and d related?
When a number cube is rolled, there are six possible outcomes.
The outcomes are equally likely.
a) The probability of rolling a 1 is �16� .
So, the predicted number of times a 1 will show in 100 rolls is:�16� �100 � �
106
0� � 17
b) The probability of rolling a 5 is also �16� .
So, the predicted number of times a 5 will show is also about 17.
Gr7 Math/U11/F1 7/20/04 12:33 PM Page 417

c) The probability of rolling a 1 or a 5 is �26� , or �
13�.
So, the predicted number of times a 1 or a 5 will show is:�13� � 100 � �
103
0� � 33
d) For a 1 and a 5 not to show, a 2, 3, 4, or 6 shows.
The probability of rolling a 2, 3, 4, or 6 is �46�, or �
23�.
So, the predicted number of times a 1 or a 5 does not show is:�23� � 100 � �
203
0� � 67
The predicted number of times a 1 or a 5 shows and the
predicted number of times a 1 or a 5 does not show are:
33 � 67 � 100
An outcome occurs or it does not occur. So,
Predicted number � Predicted number � Number of times
of times an of times the outcome the experiment
outcome occurs does not occur is conducted
In the Example part c, in 100 rolls, a 1 or a 5 will show about
33 times. This does not mean that a 1 or a 5 will show exactly
33 times, but the number of times will likely be close to 33.
The more times an experiment is conducted, the closer the
experimental probability is to the theoretical probability.
1. A bag contains these granola bars: 12 apple, 14 banana, 18 raisin,
and 10 regular. You pick one bar at random. Find the probability
of choosing:
a) a banana granola bar b) an apple granola bar
2. There are 8 names in a hat.
You pick one name without
looking. Find each probability.
a) A three-letter name will be picked.
b) A five-letter name will be picked.
c) Laura will be picked.
d) Jorge will not be picked.
418 UNIT 11: Probability
When you see the word“probability” in asentence, it meanstheoretical probability.
Gr7 Math/U11/F1 7/20/04 12:34 PM Page 418

11.3 Theoretical Probability 419
3. Is each statement true or false? Explain.
a) If you toss a coin 10 times, you will never get 10 heads.
b) If you toss a coin 10 times, you will always get exactly 5 heads.
c) If you toss a coin many times, the number of heads should be
approximately �12� the number of tosses.
4. The pointer on this spinner is spun 100 times.
Is each statement true or false? Justify your answer.
a) The pointer will land on Win about 33 times.
b) The pointer will land on Win, Lose, and Tie
an equal number of times.
c) The pointer will land on Lose exactly 33 times.
5. Two hundred fifty tickets for a draw were sold.
The first ticket drawn wins the prize.
a) Joe purchased 1 ticket. What is the probability Joe will win?
b) Maria purchased 10 tickets.
What is the probability Maria will win?
c) Ivan purchased 25 tickets.
What is the probability Ivan will not win?
6. Assessment Focusa) Construct a spinner with red, yellow, blue, and green sectors,
so the following probabilities are true.
• The probability of landing on red is �14�.
• The probability of landing on yellow is �12�.
• The probability of landing on blue is �16�.
• The probability of landing on green is �112�.
Explain how you drew your spinner.
b) In 200 trials, about how many times would the pointer land
on each colour?
c) Suppose the spinner had been constructed so the
probability of landing on yellow was �14�.
What effect would this have on the probability of landing on
each other colour? Explain.
How are theoretical probability and experimental probability
similar? Different?
Use an example to explain.
Number Strategies
Simplify.
• �58� + �
34�
• �45� – �
23�
• 1 �130� + 2 �
12�
• �23� + �
25� + �1
30�
Gr7 Math/U11/F1 7/20/04 12:34 PM Page 419

420 UNIT 11: Probability
Work with a partner.
You will play the Sum and Product game.
You will need 4 blank cards and a bag.
Write the numbers from 1 to 4 on the cards.
Place the cards in the bag.
Each person picks a card.
Both of you find the sum and the product of the two numbers.
One of you is Player A, the other is Player B.
If the sum is less than or equal to the product, Player A gets a point.
If the sum is greater than the product, Player B gets a point.
➢ Who is likely to win? Explain your reasoning.
➢ Play the game several times; you choose how many times.
Who won?
➢ How does your prediction of the winner compare with
your result?
Reflect & Share
Compare your results with those of another pair of classmates.
Work together to come up with an explanation of who is more likely
to win.
➢ Probability can be expressed as a fraction, a decimal, or a percent.
When probability is expressed as a percent, we use the word
“chance.”
For example, the weather forecast is a 40% chance of rain today.
This means that the probability of rain is: �14000� � 0.4
➢ When an outcome is certain, the probability of it occurring is 1.
For example, when we toss a coin, the probability of it landing
heads or tails is 1.
When an outcome is impossible, the probability of it occurring is
0. For example, when we roll a number cube labelled 1 to 6, the
probability of a 7 showing is 0.
11.4 Applications of Probability
Solve probability problems.Focus
Gr7 Math/U11/F1 7/20/04 12:34 PM Page 420
11.4 Applications of Probability 421
Example
Solution
The word “exactly” isincluded because“winning one game”might be interpretedas winning one ormore games.
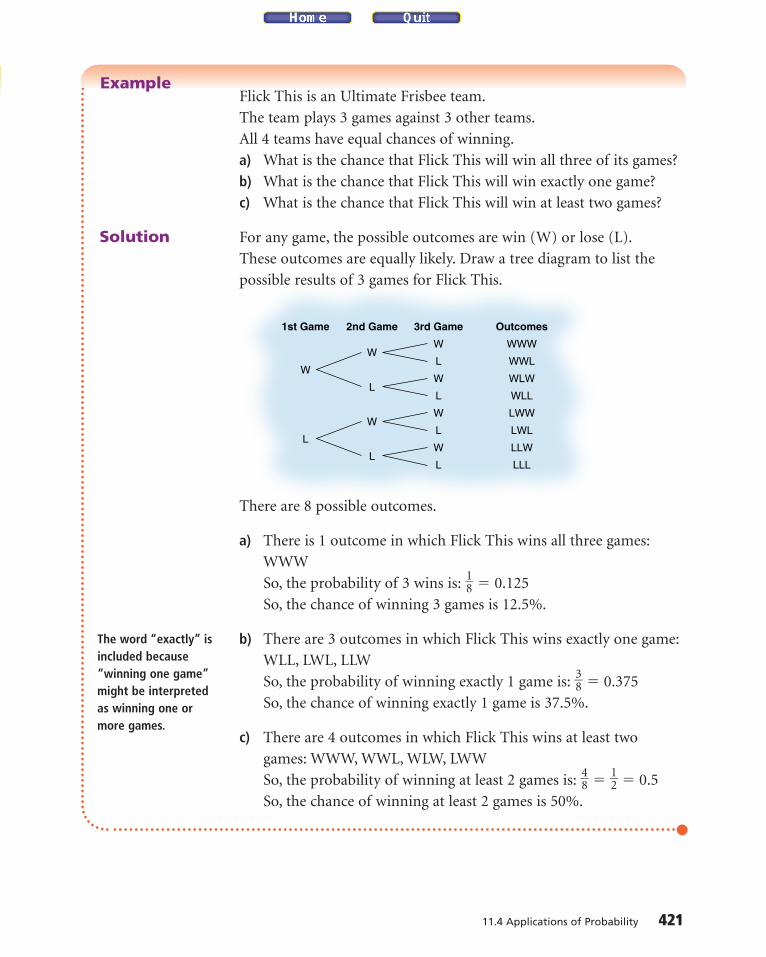
Flick This is an Ultimate Frisbee team.
The team plays 3 games against 3 other teams.
All 4 teams have equal chances of winning.
a) What is the chance that Flick This will win all three of its games?
b) What is the chance that Flick This will win exactly one game?
c) What is the chance that Flick This will win at least two games?
For any game, the possible outcomes are win (W) or lose (L).
These outcomes are equally likely. Draw a tree diagram to list the
possible results of 3 games for Flick This.
There are 8 possible outcomes.
a) There is 1 outcome in which Flick This wins all three games:
WWW
So, the probability of 3 wins is: �18� � 0.125
So, the chance of winning 3 games is 12.5%.
b) There are 3 outcomes in which Flick This wins exactly one game:
WLL, LWL, LLW
So, the probability of winning exactly 1 game is: �38� � 0.375
So, the chance of winning exactly 1 game is 37.5%.
c) There are 4 outcomes in which Flick This wins at least two
games: WWW, WWL, WLW, LWW
So, the probability of winning at least 2 games is: �48� � �
12� � 0.5
So, the chance of winning at least 2 games is 50%.
WW
W
L
L
W
L
L
W
L
W
L
W
L
WWW
WWL
WLW
WLL
LWW
LWL
LLW
LLL
1st Game 2nd Game 3rd Game Outcomes
Gr7 Math/U11/F1 7/20/04 12:34 PM Page 421

422 UNIT 11: Probability
FF
F
M
M
F
M
M
F
M
F
M
F
M
FFF
FFM
FMF
FMM
MFF
MFM
MMF
MMM
1st Place 2nd Place 3rd Place Outcomes
1. The 1st, 2nd, and 3rd place winners of a contest can be female
or male. This tree diagram shows the possible outcomes of
the contest.
a) How many possible outcomes are there?
b) What is the probability that all the winners are female?
c) What is the probability that none of the winners is male?
d) How are the answers to parts b and c related? Explain.
2. On this spinner, the pointer is spun once.
The colour is recorded.
The pointer is spun a second time.
The colour is recorded.
a) Suppose you win if you spin the
same colour on both spins.
What are your chances of winning?
b) Suppose you win if you spin two different colours.
What are your chances of winning?
3. a) Three coins are tossed. Find the chance of tossing:
i) one heads and two tails ii) exactly two heads
iii) at least two tails iv) no heads
b) Why do we need the words “at least” in part a, iii?
What if these words were left out?
How would the answer change?
c) Why do we need the word “exactly” in part a, ii? What if this
word was left out? How would the answer change?
4. At a carnival, the game with the least chance of winning often
has the greatest prize. Explain why this might be.
Gr7 Math/U11/F1 7/20/04 12:34 PM Page 422

11.4 Applications of Probability 423
5. There are four children in a family.
What is the chance of each event?
a) There are two boys and two girls.
b) There is at least one girl.
c) All four children are of the same gender.
6. Assessment Focus The school cafeteria has this lunch menu.
A student chooses a sandwich and a vegetable. Assume the
choice is random.
a) Find the probability of each
possible combination.
b) Suppose 3 desserts were added
to the menu. Each student
chooses a sandwich, a
vegetable, and a dessert.
How would the probabilities of
possible combinations change?
Use examples to explain your thinking.
7. At the school carnival, there is a game with two spinners.
Spinner A Spinner B
You get two spins.
You may spin the pointer on each spinner once, or spin the
pointer on one spinner twice.
If you get pink on one spin and yellow on another spin (the order
does not matter), you win.
To have the greatest chance of winning, what should you do?
Explain.
How is probability related to chance?
Use an example in your explanation.
Lunch Menu
Sandwich Vegetable
Grilled Cheese Broccoli
Chicken Carrots
Tuna
Calculator Skills
Which threeconsecutive primenumbers have aproduct of 7429and a sum of 59?
Take It Further
Gr7 Math/U11/F1 7/20/04 12:34 PM Page 423

424 UNIT 11: Probability
1. For her birthday, Janine was given a row of 25 pennies.
Her father replaced every second coin with a nickel.
Her mother replaced every third coin with a dime.
Her brother replaced every fourth coin with a quarter.
Her uncle replaced every fifth coin with a loonie.
How much did Janine get on her birthday?
2. Arif has a part-time job.
He was offered $96 per week or $4.50/h.
Which is the better deal? Explain.
3. a) The perimeter of a rectangle is 36 cm.
What is the maximum possible area of the rectangle?
b) The sum of the length, width, and height of a rectangular
prism is 18 cm.
What is the maximum possible volume of the prism?
4. What fraction of this
figure is shaded?
5. Divide the square at the left into four congruent figures.
Record each way you find on dot paper.
Find at least ten different ways to do this.
6. Running shoes cost $79.99. They are on sale for 20% off.
The sales tax of 15% has to be added.
Which would you choose? Explain.
a) Take the 20% off the price, then add the 15% sales tax.
b) Add the 15% sales tax, then take off the 20%.
7. The Magic Money Box doubles any amount of money placed in
it, then adds $1 to it.
Yesterday I placed a sum of money in the box and got a
new amount.
Today I put the new amount in the box and got $75 out.
How much did I put in the box yesterday?
Choosing a Strategy
Strategies
• Make a table.
• Use a model.
• Draw a diagram.
• Solve a simpler problem.
• Work backward.
• Guess and check.
• Make an organized list.
• Use a pattern.
• Draw a graph.
• Use logical reasoning.
Gr7 Math/U11/F1 7/20/04 12:37 PM Page 424

Reading and Writing in Math: Choosing a Strategy 425
8. Play this game with a partner.
Each of you needs an octahedron
and a cube like these:
The faces of a red octahedron are
labelled from �1 to �8.
The faces of a white cube are
labelled from �1 to �6.
Take turns to roll the two solids.
Subtract the red number from
the white number.
The person with the lesser number
scores a point.
The first person to reach 20 points
is the winner.
9. On your first birthday, you have 1 candle on your cake.
On your second birthday, you have 2 candles on your
cake, and so on, every year.
How many candles will be needed to celebrate your first
16 birthdays?
10. A radio station plays an average of 16 songs every hour.
One-half the songs are pop, one-quarter are jazz,
one-eighth are country, and the rest are classical.
One show is 3 h long. The songs are played at random.
a) How many classical songs would be played?
b) What is the probability that the first song played
is jazz?
11. An octahedron has eight faces labelled 1 to 8.
A cube has six faces labelled 1 to 6.
a) Both solids are rolled. What is the probability that the
sum of the numbers is 8?
b) Both solids are rolled. What is the probability that the
sum of the numbers is a prime number?
Gr7 Math/U11/F1 7/20/04 12:37 PM Page 425
426 UNIT 11: Probability
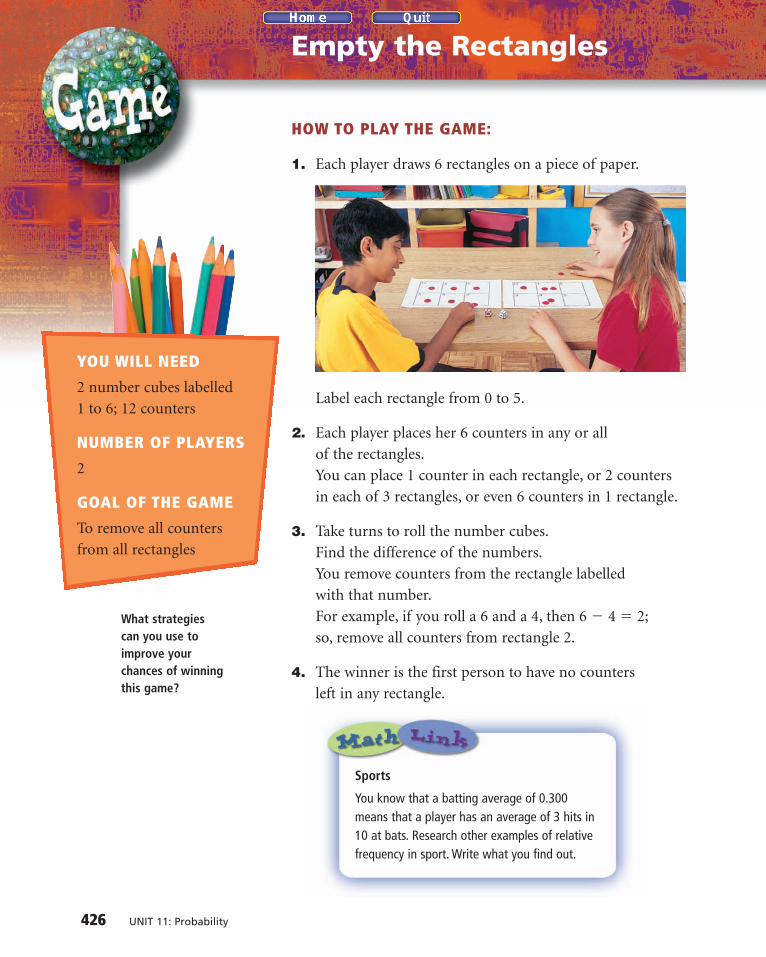
HOW TO PLAY THE GAME:
1. Each player draws 6 rectangles on a piece of paper.
Label each rectangle from 0 to 5.
2. Each player places her 6 counters in any or all
of the rectangles.
You can place 1 counter in each rectangle, or 2 counters
in each of 3 rectangles, or even 6 counters in 1 rectangle.
3. Take turns to roll the number cubes.
Find the difference of the numbers.
You remove counters from the rectangle labelled
with that number.
For example, if you roll a 6 and a 4, then 6 � 4 � 2;
so, remove all counters from rectangle 2.
4. The winner is the first person to have no counters
left in any rectangle.
Empty the Rectangles
Sports
You know that a batting average of 0.300means that a player has an average of 3 hits in10 at bats. Research other examples of relativefrequency in sport. Write what you find out.
What strategies can you use to improve your chances of winning this game?
YOU WILL NEED
2 number cubes labelled
1 to 6; 12 counters
NUMBER OF PLAYERS
2
GOAL OF THE GAME
To remove all counters
from all rectangles
Gr7 Math/U11/F1 7/20/04 12:37 PM Page 426

Unit Review 427
What Do I Need to Know?
1. a) Use a tree diagram to show the
possible combinations for a
breakfast. You can choose:
• a banana, an orange,
or an apple
• carrots, celery, or cucumber,
and
• yogurt or cheese
b) How many outcomes have a
banana and cheese?
c) How many outcomes have an
orange, celery, or a yogurt?
d) How many outcomes do not
have an apple?
2. Four coins are tossed.
a) List all the possible outcomes.
b) How many outcomes have
exactly 1 head?
c) How many outcomes have
exactly 2 tails?
d) How many outcomes have at
least 3 tails?
3. A biologist tested a new vaccine.
She found that in 500 trials, the
test was successful 450 times.
a) What is the relative frequency
that the vaccine is successful?
b) Suppose the vaccine is used on
15 000 people. How many
successes can be expected?
4. The owner of a shop recorded
customer sales for one week.
Determine the relative frequency
of each outcome.
a) A customer is male.
b) A customer is female.
c) A customer makes a purchase.
d) A male does not make a
purchase.
e) A female makes a purchase.
LESSON
11.1 11.2
What Should I Be Able to Do?
Gender Purchase No Purchase Total
Male 125 65 190
Female 154 46 200
✓ Relative frequency �
✓ Theoretical probability �
Number of times an outcome occurs�����Number of times experiment is conducted
Number of favourable outcomes����Number of possible outcomes
Review any lesson with
For extra practice, go to page 448.
Gr7 Math/U11/F1 7/20/04 12:37 PM Page 427

5. Is each statement true or false?
Explain.
a) When a coin is tossed
100 times, it will never show
tails 100 times.
b) When a coin is tossed
100 times, it is unlikely to
show heads 100 times.
c) When a coin is tossed
100 times, it will show tails
exactly 50 times.
d) The more often a coin is
tossed, the more likely that �12� the results will be tails.
6. In a game show, each contestant
spins the wheel once to win the
money shown.
a) Are the probabilities of
winning the amounts equally
likely? Explain.
b) What is the probability of
winning $100?
c) What is the probability of
winning less than $50?
d) What is the probability of
winning from $30 to $70?
7. Twenty cards are numbered from
1 to 20. The cards are shuffled.
A card is drawn. Find the
probability that the card has:
a) an odd number
b) a multiple of 4
c) a number that is not a
perfect square
d) a prime number
8. Each of the numbers 1 to 15 is
written on a separate card.
The cards are shuffled and
placed in a pile face down.
A card is picked from the pile.
Its number is recorded.
The card is returned to the pile.
In 99 trials, about how many
times would you expect each
outcome?
a) a 6
b) a multiple of 3
c) a number less than 10
d) an even number
9. What is the chance of
each outcome?
a) tossing 2 coins and getting:
i) 2 heads
ii) 1 tail and 2 heads
b) tossing 3 coins and getting:
i) 1 head and 2 tails
ii) at least 1 tail
10. An electronic game has three
coloured sectors. A colour lights
up at random, followed by a
colour lighting up at
random again.
What is the
chance the two
consecutive
colours are
the same?
LESSON
11.3
11.4
428 UNIT 11: Probability
Gr7 Math/U11/F1 7/20/04 12:38 PM Page 428

1. A theatre shows movies on Saturday and Sunday.
There are matinee and evening shows.
There are adult, child, and senior rates.
Draw a tree diagram to show the possible ticket types.
2. A number cube is labelled 1 to 6.
The cube is rolled 60 times.
Predict how many times each outcome will occur.
Explain each answer.
a) 1 is rolled.
b) An even number is rolled.
c) A number greater than 3 is rolled.
d) 9 is rolled.
3. a) In Sarah’s first 30 times at bat, she had 9 hits.
What is Sarah’s batting average?
b) In Sarah’s next game, she had 3 hits in 4 times at bat.
What is Sarah’s new batting average?
c) How many hits would you expect Sarah to have in 90 times at
bat? Explain your reasoning.
4. A number cube is labelled 1 to 6.
Suppose you roll a number cube twice.
Is it more likely you will get a 3 then a 5, or a 3 then a 3?
Explain your reasoning.
5. In the game “rock, paper, scissors,” 2 players make hand signs.
Players can make a hand sign for rock, paper, or scissors.
On the count of 3, players show
their hand signs.
Suppose the players choose
their signs at random.
In 75 games, how many times
would you expect to see both
players showing rock?
Practice Test 429
Gr7 Math/U11/F1 7/20/04 12:38 PM Page 429

430 UNIT 11: Probability
Games of Chance
Part 1
Emma and Jonah created a spinner game called Match/No-Match.
Two people play the game.
A player spins the pointer twice.
If the pointer lands on the same colour (a match), the player scores.
If the pointer lands on different colours (a no-match),
the opponent scores.
Jonah and Emma reasoned that, since there are two matching
combinations (red/red and green/green), a player should score
only 1 point for a match, and the opponent should score
2 points for a no-match.
Unit Problem
Gr7 Math/U11/F3 7/22/04 2:13 PM Page 430

Unit Problem: Games of Chance 431
Play the Match/No-Match game. Take at least 50 turns each.
Use the results to find the relative frequency of a match
and of a no-match.
List the possible outcomes of a turn (two spins).
Find the theoretical probability of a match and a no-match.
Do you think the players have equal chances of winning? Explain.
Part 2
Design a game using spinners, number cubes, coins,
or any other materials.
The game should use two different items.
Play the game.
Do the players have equal chances of winning? Explain.
Calculate some probabilities related to your game.
Show your work.
Give at least two examples of how you use probability in everyday life.
Your work should show:
all calculations offrequency orprobability, in detail
diagrams, tables, orlists to show possibleoutcomes and resultsof each game
an explanation ofplayers’ chances ofwinning each game
correct use of thelanguage ofprobability
✓
✓
✓
✓
Check List
Gr7 Math/U11/F1 7/20/04 12:40 PM Page 431