Embed Size (px)
Citation preview
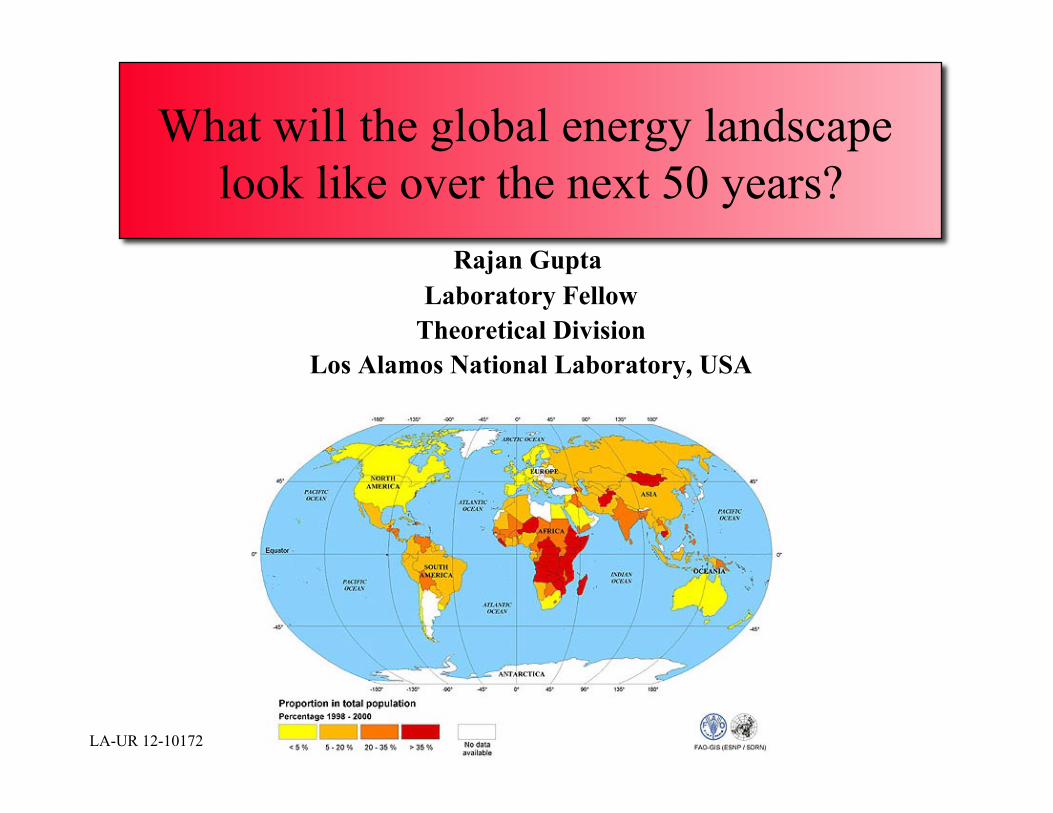
What will the global energy landscape look like over the next 50 years?
Rajan Gupta Laboratory Fellow
Theoretical Division Los Alamos National Laboratory, USA
LA-UR 12-10172
Summary
This talk summarizes the transformations in energy systems that have taken place in the last 10 years and examines the evolving energy needs and supplies. Based on development needs, resource, infrastructure and technology constraints I outline a scenario of what the energy landscape will look like over the next 50 years.
History in Making:
The youth are demanding meaningful jobs, a better quality of life & better governance
How will countries create jobs and develop areas of comparative advantage for trade?
How will countries fuel their development and mitigate climate change?
History in Making:
The youth are demanding meaningful jobs, a better quality of life & better governance
How will countries fuel their development and mitigate climate change?
How will countries create jobs for 7+ billion people and develop areas of comparative advantage to sustain trade and development?
Context of these lectures
• Development
• Energy Security
• Pollution and Climate Change
The Energy-Development-Environment-Climate Challenge
Energy is a primary driver of development: All energy resources will be utilized as they
become economical or are subsidized • The goal is to optimize portfolio over
– Indigenous fuel, water, mineral resources – Regional resources (Regional trade) – Minimize environmental impact – Mitigate climate change (reduce GHG emissions)
The cost of large-scale fuel or energy systems imports will remain high countries vulnerable to geo-politics
Developing a credible roadmap to GHG-neutral systems
• Focusing on “peak-oil”, declining oil/gas/coal/U resources in one field, one country, etc., is not a compelling strategy. There is plenty of economically accessible fossil fuel for the next 50 years for global need.
• There are compelling forces driving choices countries make – Energy security
– Cost
– Economic development
– Easily available fossil fuels
– Technology
– Uncertainty of and unfamiliarity with emerging options
– Social and political pressures
• There is no free lunch. Society must develop a coherent/realistic framework – What risk society is willing to accept with respect to impacts of a given energy system
– What time-evolving adjustments society is willing to make if environmental degradation and climate change is an unacceptable risk
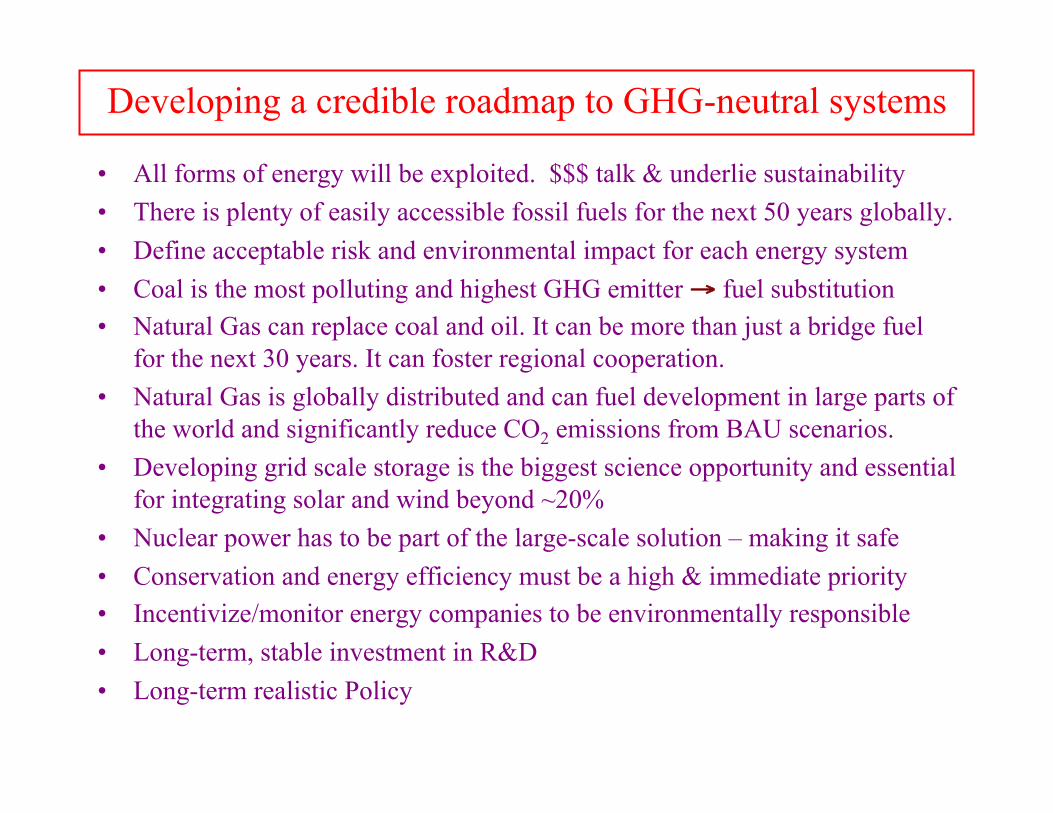
Developing a credible roadmap to GHG-neutral systems
• All forms of energy will be exploited. $$$ talk & underlie sustainability • There is plenty of easily accessible fossil fuels for the next 50 years globally. • Define acceptable risk and environmental impact for each energy system • Coal is the most polluting and highest GHG emitter → fuel substitution • Natural Gas can replace coal and oil. It can be more than just a bridge fuel
for the next 30 years. It can foster regional cooperation. • Natural Gas is globally distributed and can fuel development in large parts of
the world and significantly reduce CO2 emissions from BAU scenarios. • Developing grid scale storage is the biggest science opportunity and essential
for integrating solar and wind beyond ~20% • Nuclear power has to be part of the large-scale solution – making it safe • Conservation and energy efficiency must be a high & immediate priority • Incentivize/monitor energy companies to be environmentally responsible • Long-term, stable investment in R&D • Long-term realistic Policy
Modern Energy Needs
Transportation Fuels Electric Power Generation Heat (buildings, kilns, …)
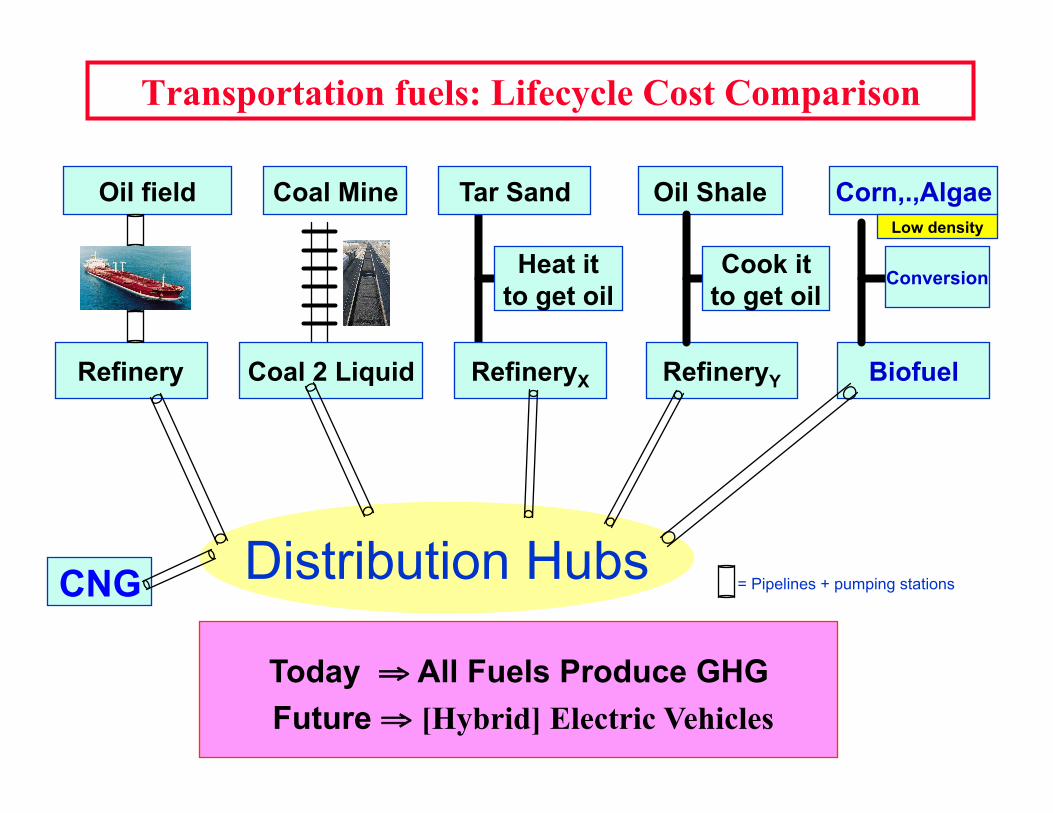
Transportation fuels: Lifecycle Cost Comparison
Distribution Hubs
Coal Mine
Coal 2 Liquid
Oil Shale
Refinery
Cook it to get oil
Oil field
= Pipelines + pumping stations
RefineryX RefineryY
Tar Sand Corn,.,Algae
Biofuel
Heat it to get oil
Today ⇒ All Fuels Produce GHG Future ⇒ [Hybrid] Electric Vehicles
Conversion
Low density
CNG
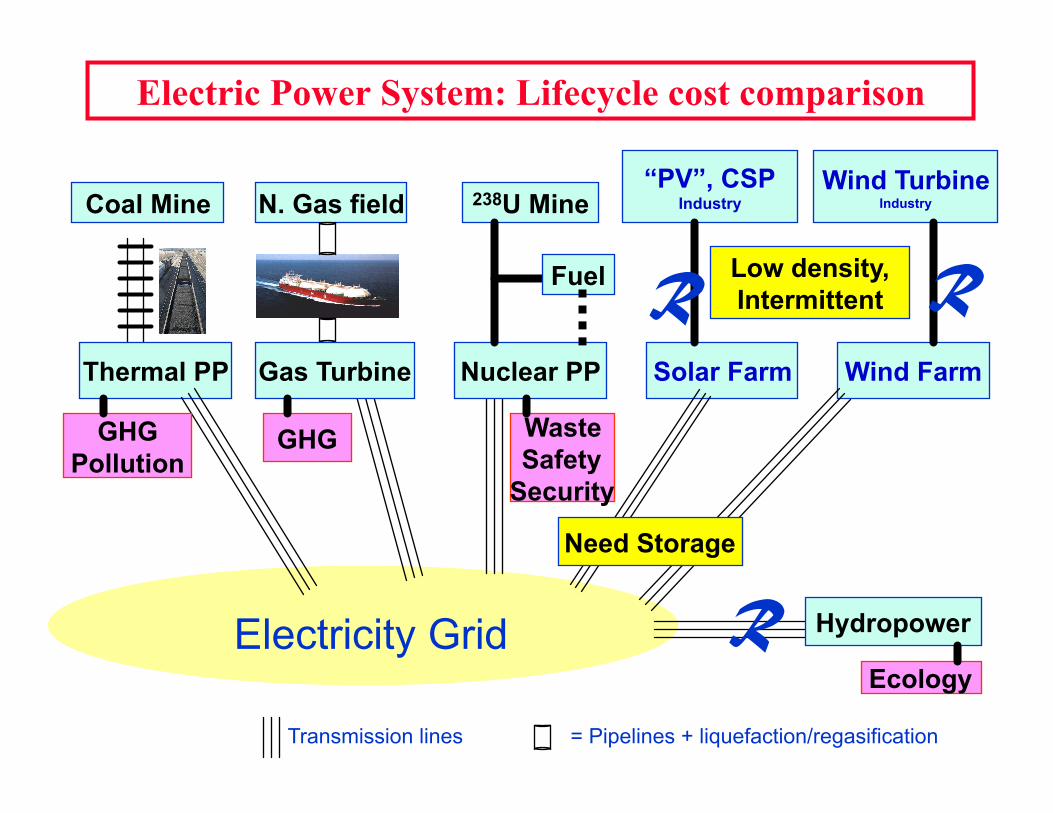
Electric Power System: Lifecycle cost comparison
Electricity Grid
Coal Mine
Thermal PP
= Pipelines + liquefaction/regasification
Solar Farm
“PV”, CSP Industry
Wind Turbine Industry
Wind Farm
Hydropower
R R
GHG Pollution
Transmission lines
Ecology
238U Mine
Nuclear PP
Waste Safety
Security
Fuel
Need Storage
Low density, Intermittent
N. Gas field
Gas Turbine
GHG
R
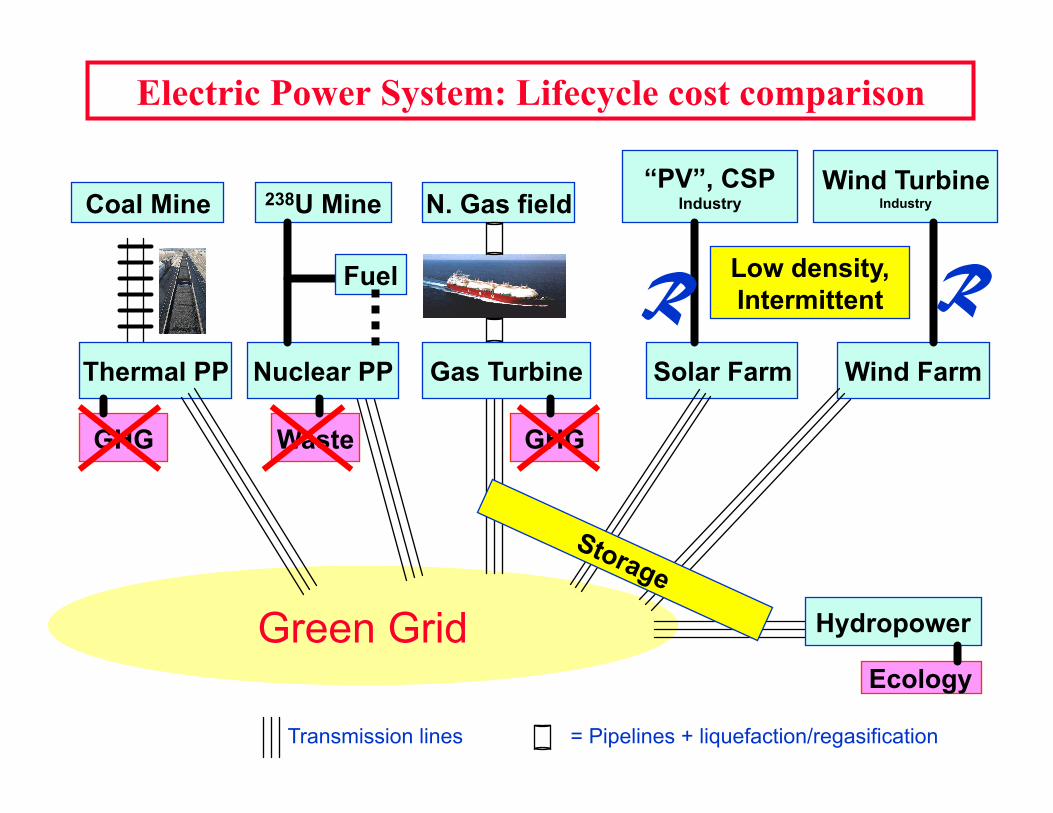
Electric Power System: Lifecycle cost comparison
Green Grid
Coal Mine
Thermal PP
= Pipelines + liquefaction/regasification
Solar Farm
“PV”, CSP Industry
Wind Turbine Industry
Wind Farm
Hydropower
R R
GHG
Transmission lines
Ecology
238U Mine
Nuclear PP
Waste
Fuel Low density, Intermittent
N. Gas field
Gas Turbine
GHG
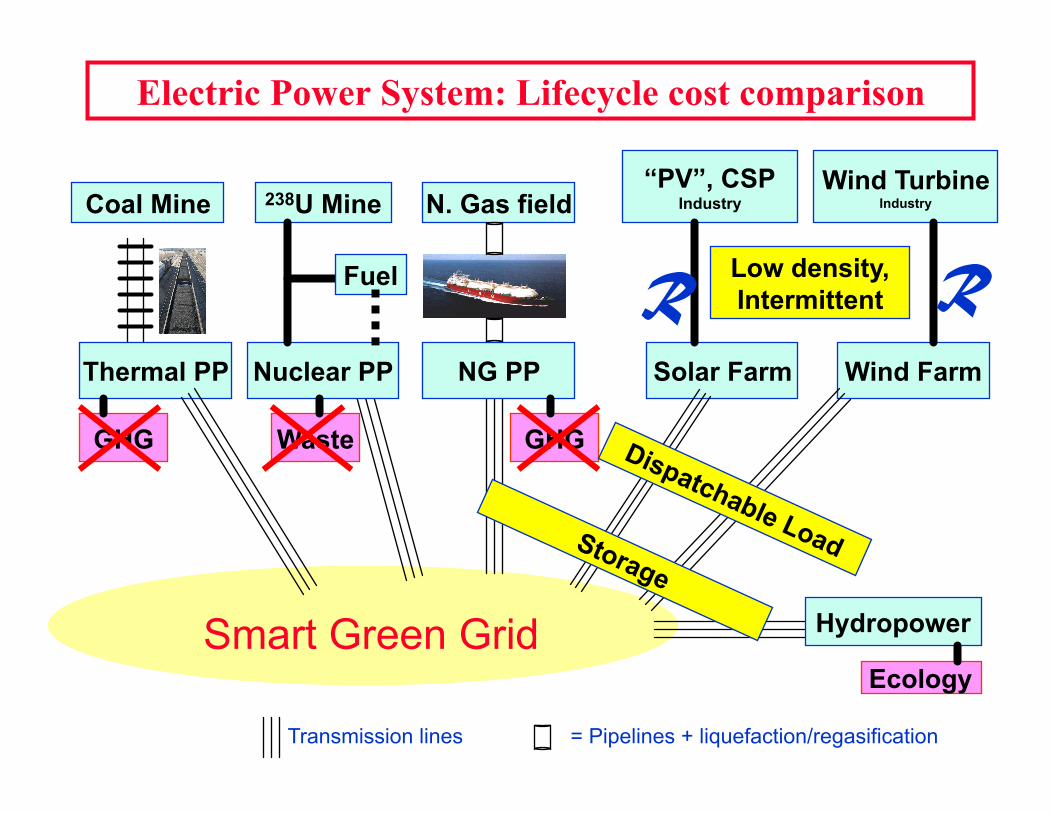
Electric Power System: Lifecycle cost comparison
Smart Green Grid
Coal Mine
Thermal PP
= Pipelines + liquefaction/regasification
Solar Farm
“PV”, CSP Industry
Wind Turbine Industry
Wind Farm
Hydropower
R R
GHG
Transmission lines
Ecology
238U Mine
Nuclear PP
Waste
Fuel Low density, Intermittent
N. Gas field
NG PP
GHG
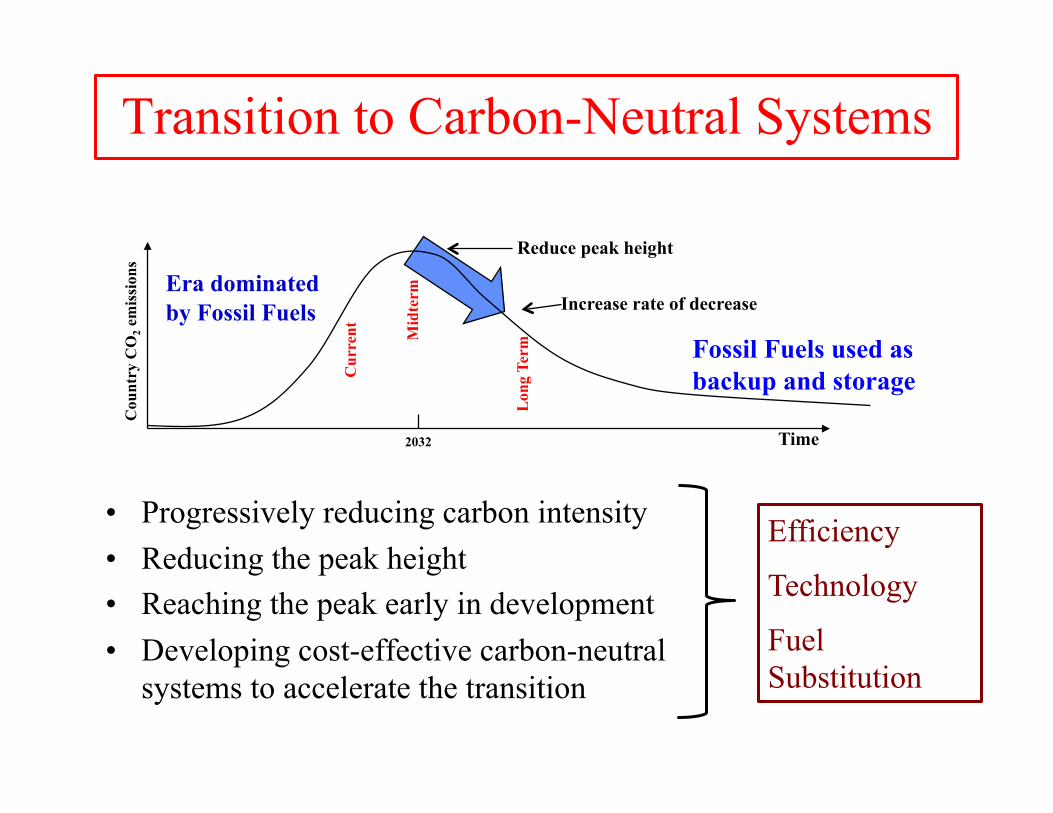
Transition to Carbon-Neutral Systems
• Progressively reducing carbon intensity • Reducing the peak height • Reaching the peak early in development • Developing cost-effective carbon-neutral
systems to accelerate the transition
Time
Cou
ntry
CO
2 em
issi
ons
Increase rate of decrease
Reduce peak height
Lon
g Te
rm M
idte
rm
Cur
rent
2032
Era dominated by Fossil Fuels
Fossil Fuels used as backup and storage
Efficiency
Technology
Fuel Substitution
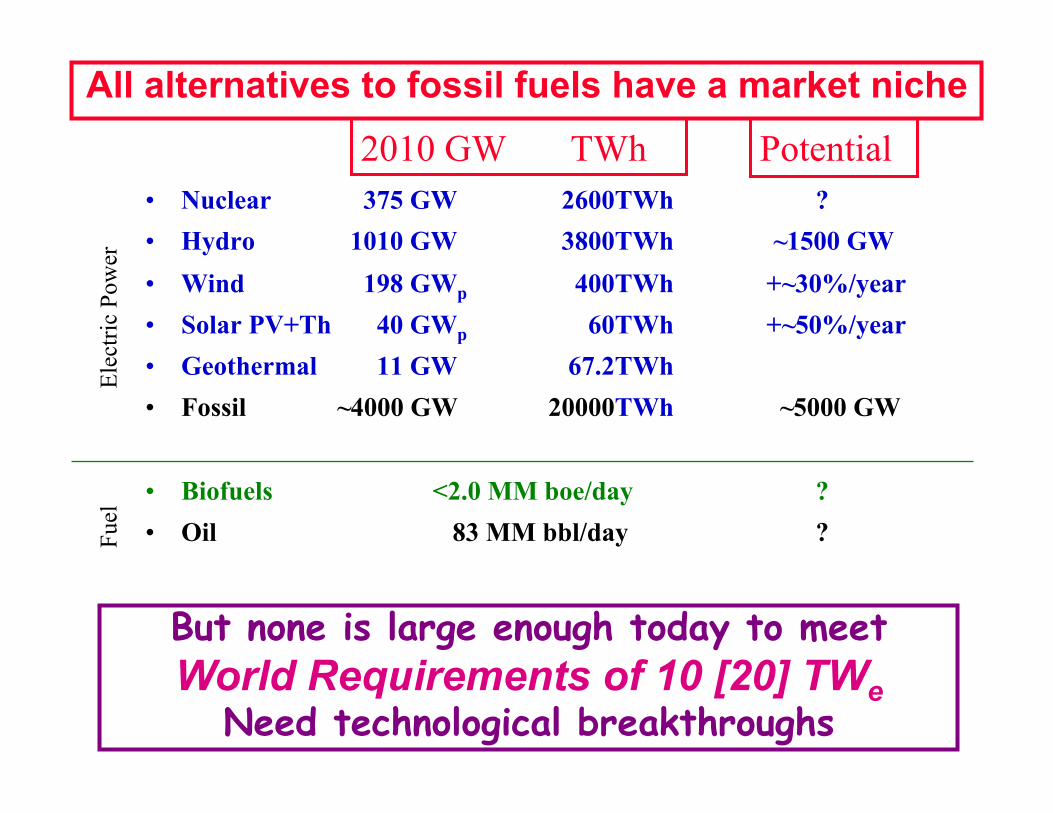
All alternatives to fossil fuels have a market niche • Nuclear 375 GW 2600TWh ? • Hydro 1010 GW 3800TWh ~1500 GW • Wind 198 GWp 400TWh +~30%/year • Solar PV+Th 40 GWp 60TWh +~50%/year • Geothermal 11 GW 67.2TWh • Fossil ~4000 GW 20000TWh ~5000 GW
• Biofuels <2.0 MM boe/day ? • Oil 83 MM bbl/day ?
But none is large enough today to meet World Requirements of 10 [20] TWe
Need technological breakthroughs
2010 GW TWh Potential El
ectri
c Po
wer
Fu
el
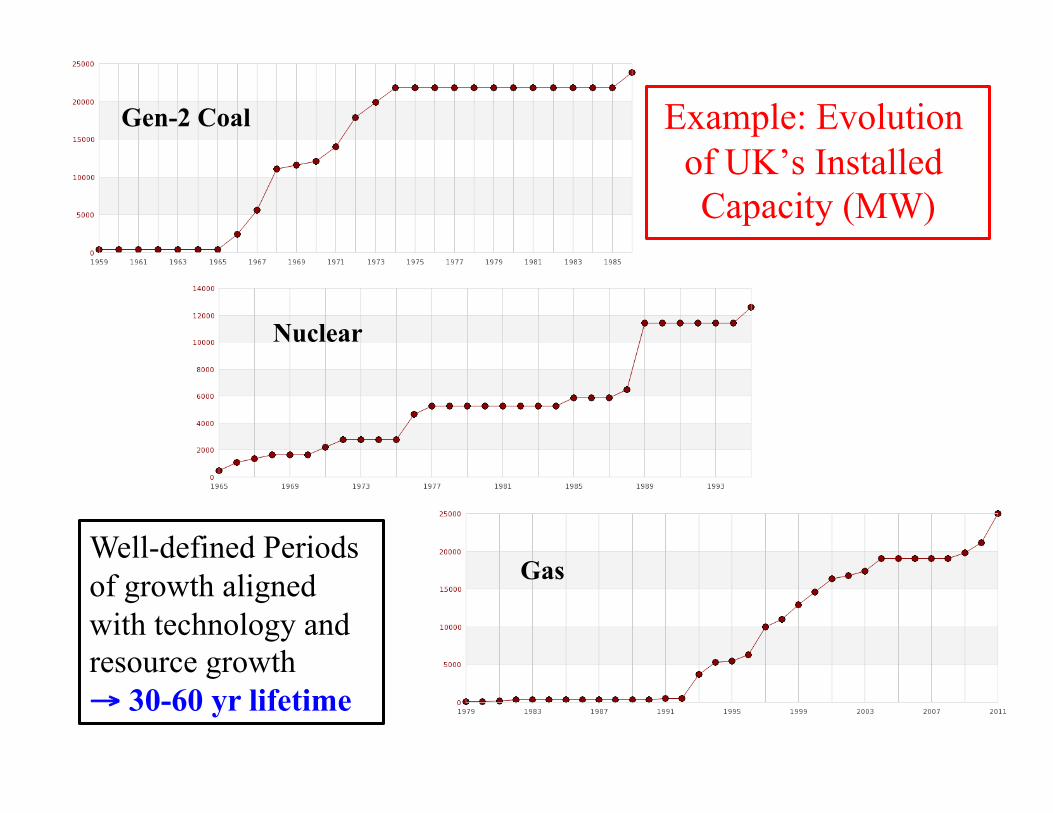
Example: Evolution of UK’s Installed Capacity (MW)
Gen-2 Coal
Nuclear
Gas Well-defined Periods of growth aligned with technology and resource growth → 30-60 yr lifetime
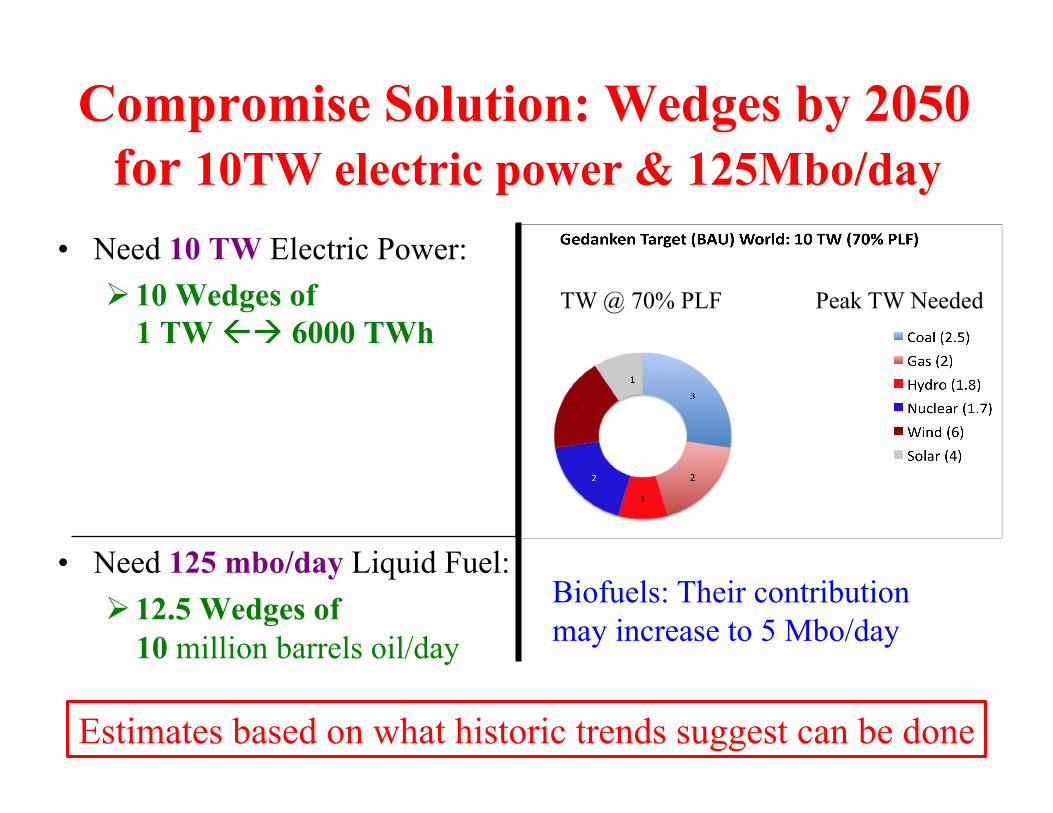
Compromise Solution: Wedges by 2050 for 10TW electric power & 125Mbo/day
• Need 10 TW Electric Power: 10 Wedges of
1 TW 6000 TWh
• Need 125 mbo/day Liquid Fuel: 12.5 Wedges of
10 million barrels oil/day
TW @ 70% PLF Peak TW Needed
Biofuels: Their contribution may increase to 5 Mbo/day
Estimates based on what historic trends suggest can be done
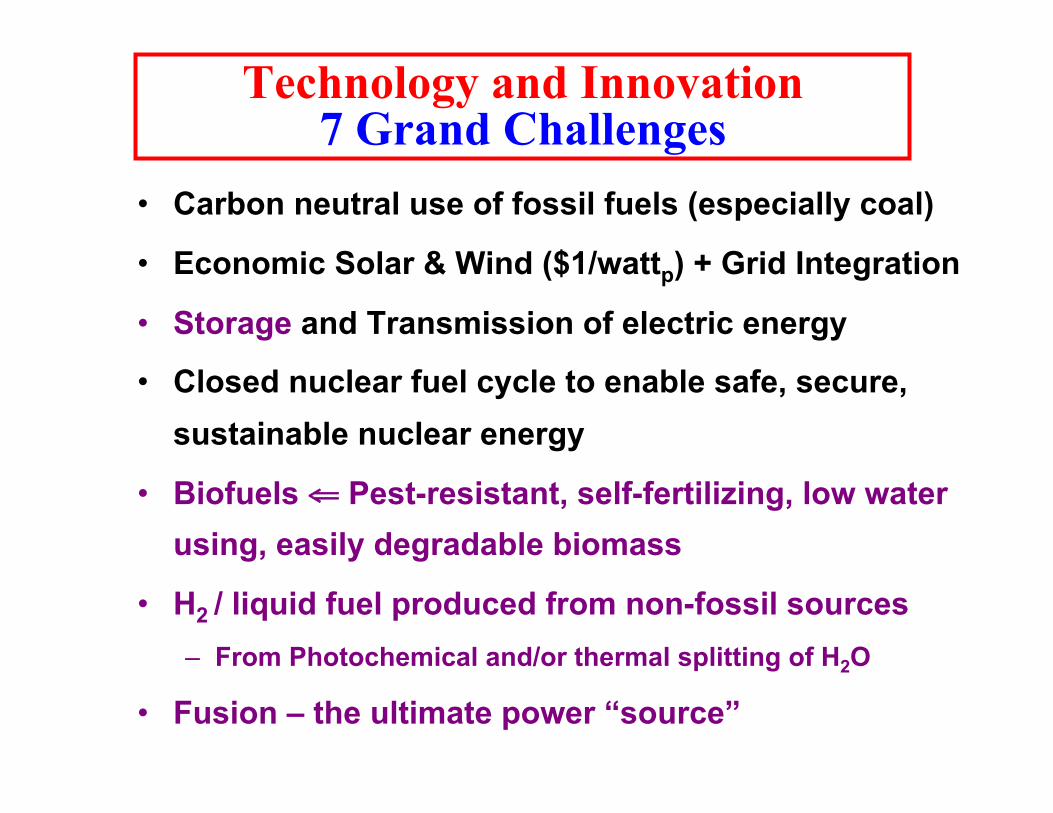
Technology and Innovation 7 Grand Challenges
• Carbon neutral use of fossil fuels (especially coal)
• Economic Solar & Wind ($1/wattp) + Grid Integration
• Storage and Transmission of electric energy
• Closed nuclear fuel cycle to enable safe, secure, sustainable nuclear energy
• Biofuels ⇐ Pest-resistant, self-fertilizing, low water using, easily degradable biomass
• H2 / liquid fuel produced from non-fossil sources – From Photochemical and/or thermal splitting of H2O
• Fusion – the ultimate power “source”
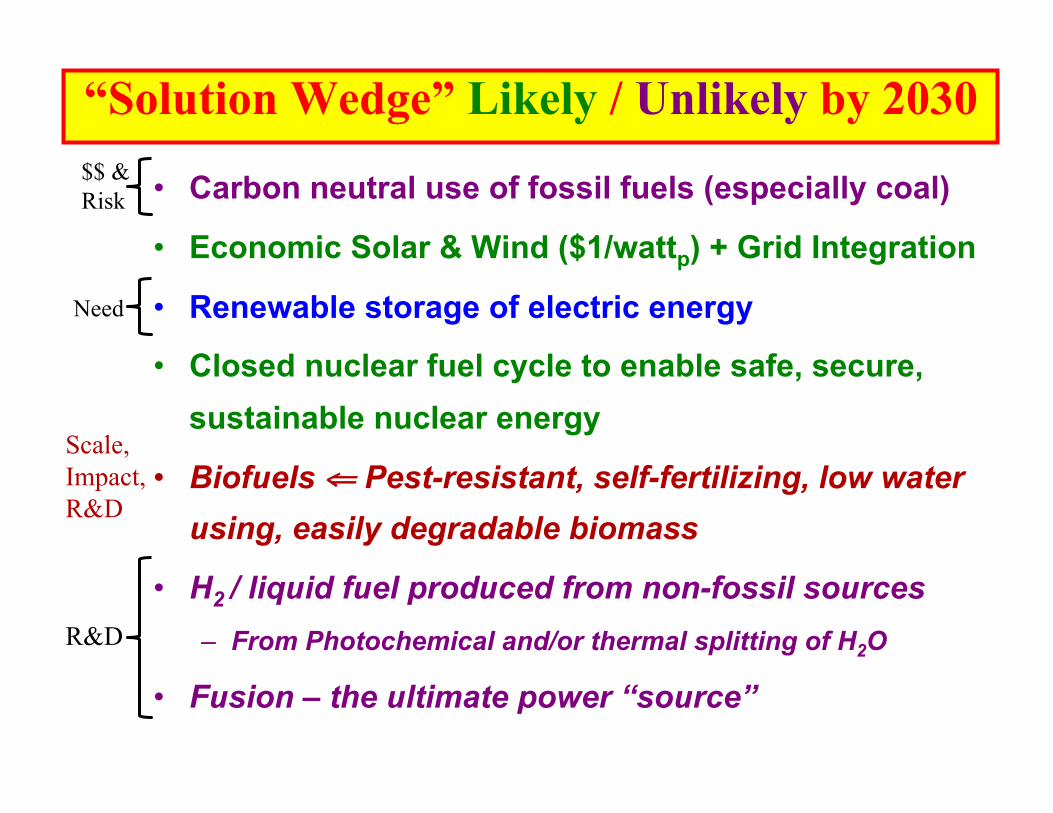
“Solution Wedge” Likely / Unlikely by 2030
• Carbon neutral use of fossil fuels (especially coal)
• Economic Solar & Wind ($1/wattp) + Grid Integration
• Renewable storage of electric energy
• Closed nuclear fuel cycle to enable safe, secure, sustainable nuclear energy
• Biofuels ⇐ Pest-resistant, self-fertilizing, low water using, easily degradable biomass
• H2 / liquid fuel produced from non-fossil sources – From Photochemical and/or thermal splitting of H2O
• Fusion – the ultimate power “source”
R&D
$$ & Risk
Need
Scale, Impact, R&D
Conservation is a very significant low hanging fruit: First Priority
• Can reduce per capita footprint by 25-50%
• Technology exists
• Demonstration examples at scale exist
• Need
– Education
– Local expertise for installing and maintaining systems
– Incentives, regulations (CAFÉ, building codes) and Policy
– Behavior change
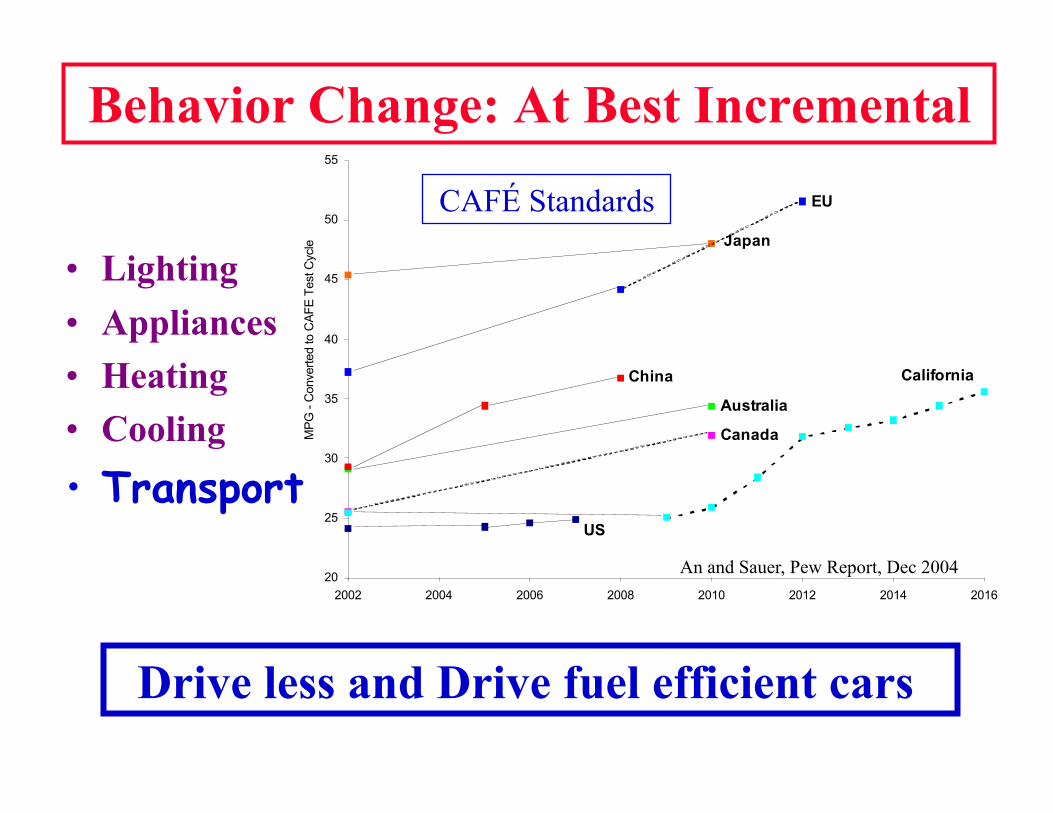
Behavior Change: At Best Incremental
• Lighting • Appliances • Heating • Cooling • Transport
EU
Canada
US
Japan
Australia
China California
20
25
30
35
40
45
50
55
2002 2004 2006 2008 2010 2012 2014 2016
MP
G -
Convert
ed to C
AF
E T
est C
ycle
CAFÉ Standards
Drive less and Drive fuel efficient cars
An and Sauer, Pew Report, Dec 2004
Electric Power and air-conditioning (HVAC--heating and cooling) needs of
suburbia can already be met through
• Solar (both PV and thermal)
• Ground source (heat-pump/geo-solar) systems
• Better insulation of buildings
Needs Building Regulations and Codes
Short-term: the US is in a “comfortable” position • Existing coal and nuclear power plants are paid for.
No incentive for utility companies to shut them down. – Life extension preserves their profits
– US has the largest coal reserves
– No hunger to create an enlightened national energy policy
• Large underutilized capacity in gas turbine power plants built during 1985-2004 – no immediate threat/shortage – Relies on continued availability of cheap gas (shale gas)
• US has the lowest CAFÉ standards for private cars/trucks – Stupid
• Challenge: Manufacturing capacity moved/moving off-shore – How long will US lead in innovation without manufacturing capability?
– Public confidence in safety, security, safeguards of nuclear plants as manufacturing moves to Asia
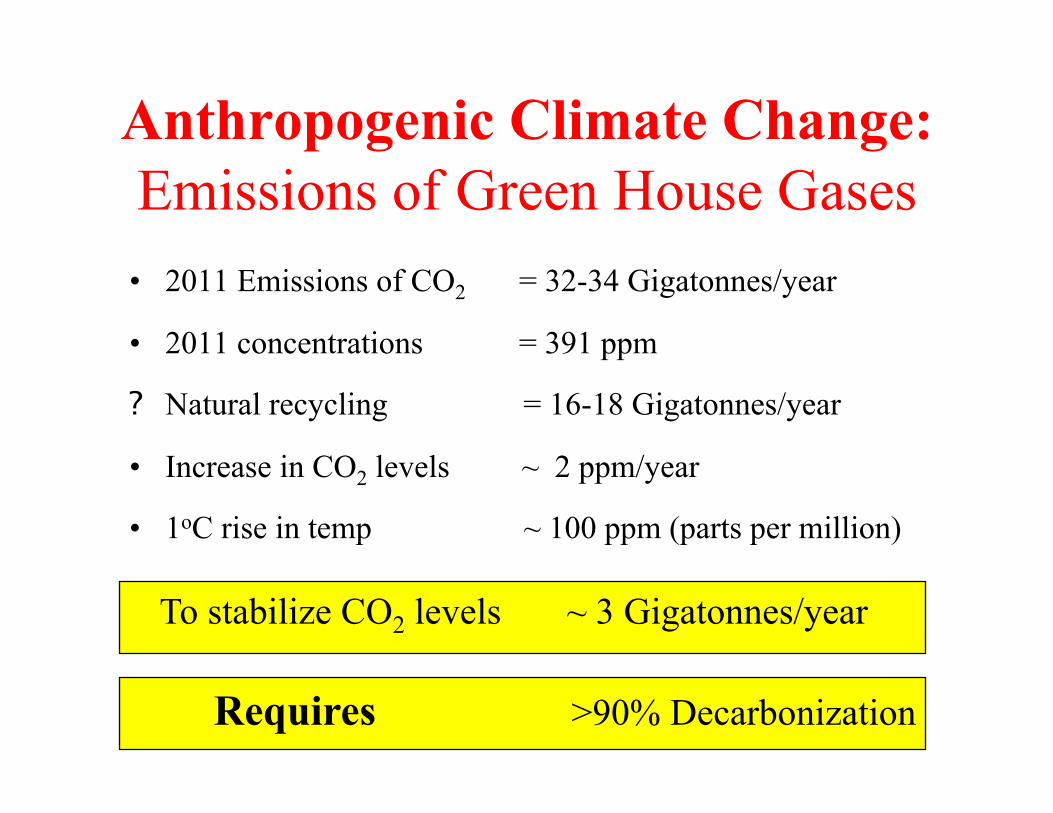
To stabilize CO2 levels ~ 3 Gigatonnes/year
Anthropogenic Climate Change: Emissions of Green House Gases • 2011 Emissions of CO2 = 32-34 Gigatonnes/year
• 2011 concentrations = 391 ppm
? Natural recycling = 16-18 Gigatonnes/year
• Increase in CO2 levels ~ 2 ppm/year
• 1oC rise in temp ~ 100 ppm (parts per million)
Requires >90% Decarbonization
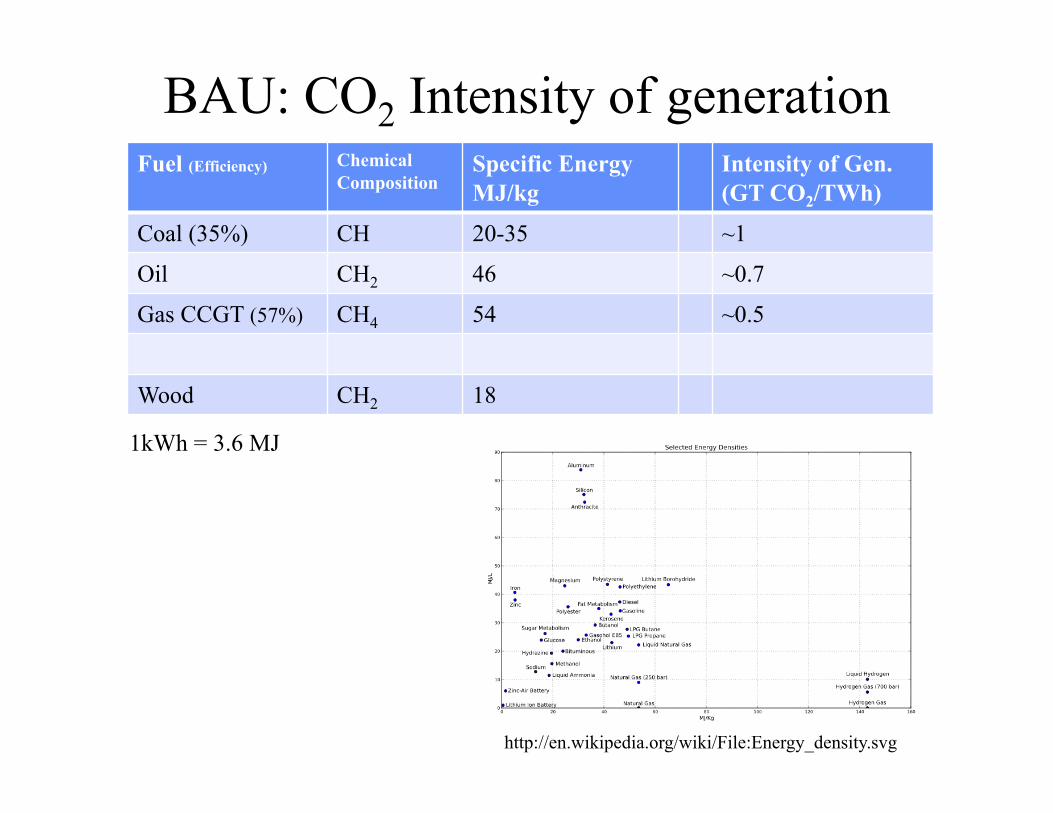
BAU: CO2 Intensity of generation Fuel (Efficiency) Chemical
Composition Specific Energy MJ/kg
Intensity of Gen. (GT CO2/TWh)
Coal (35%) CH 20-35 ~1
Oil CH2 46 ~0.7
Gas CCGT (57%) CH4 54 ~0.5
Wood CH2 18
http://en.wikipedia.org/wiki/File:Energy_density.svg
1kWh = 3.6 MJ
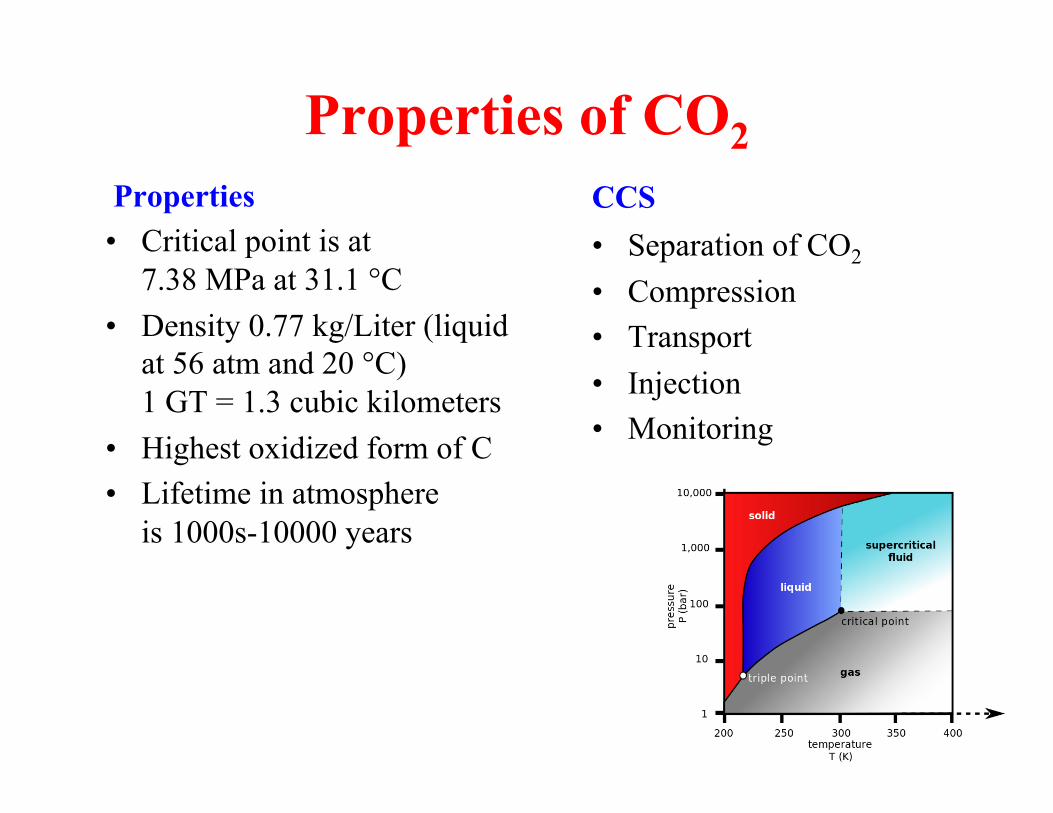
Properties of CO2 Properties • Critical point is at
7.38 MPa at 31.1 °C • Density 0.77 kg/Liter (liquid
at 56 atm and 20 °C) 1 GT = 1.3 cubic kilometers
• Highest oxidized form of C • Lifetime in atmosphere
is 1000s-10000 years
CCS • Separation of CO2
• Compression • Transport • Injection • Monitoring
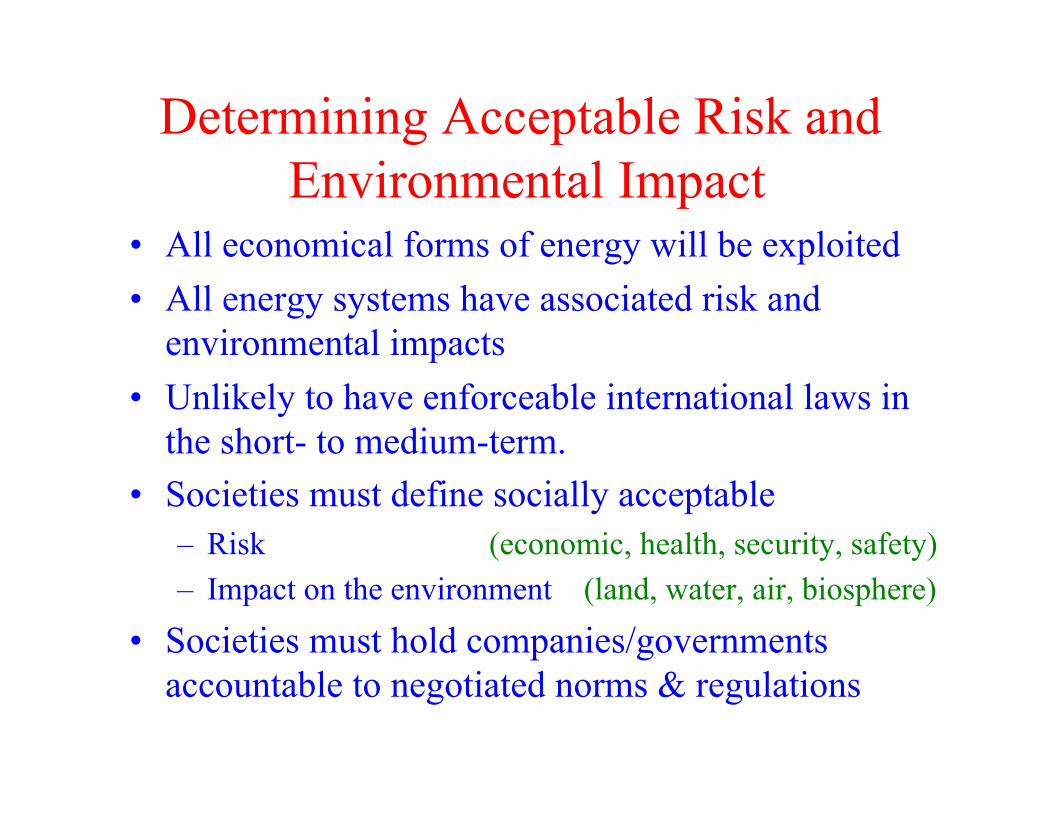
Determining Acceptable Risk and Environmental Impact
• All economical forms of energy will be exploited • All energy systems have associated risk and
environmental impacts • Unlikely to have enforceable international laws in
the short- to medium-term. • Societies must define socially acceptable
– Risk (economic, health, security, safety) – Impact on the environment (land, water, air, biosphere)
• Societies must hold companies/governments accountable to negotiated norms & regulations
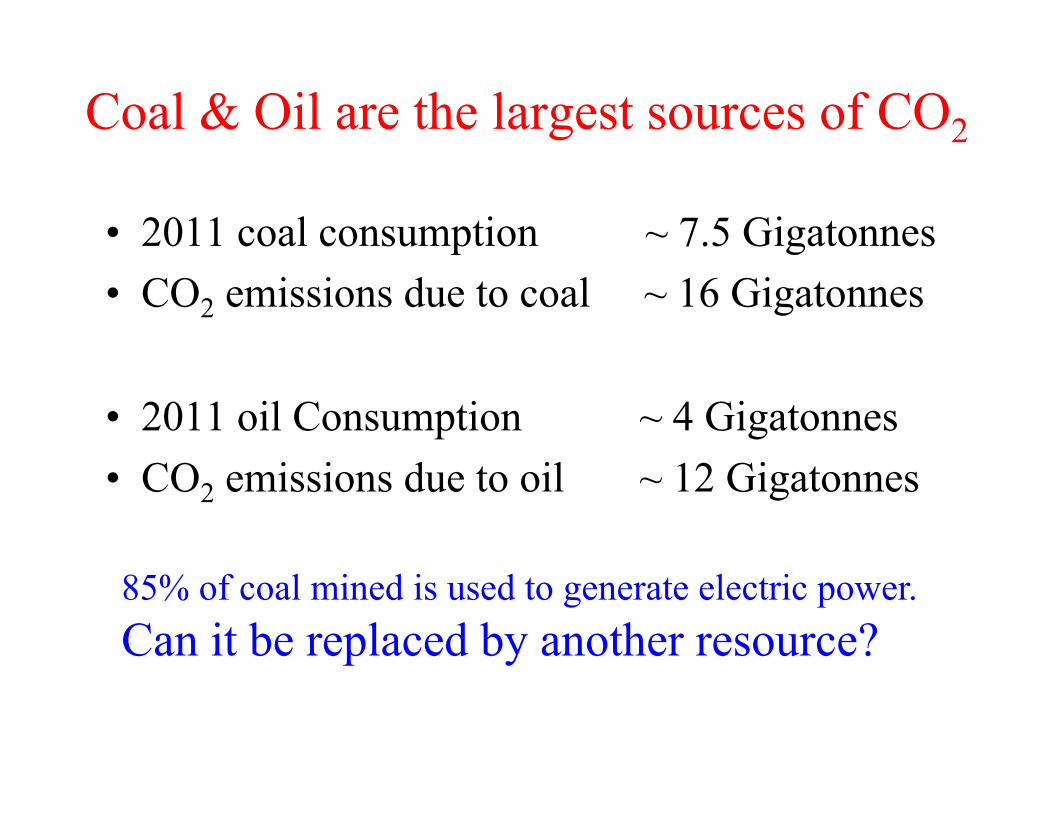
Coal & Oil are the largest sources of CO2
• 2011 coal consumption ~ 7.5 Gigatonnes • CO2 emissions due to coal ~ 16 Gigatonnes
• 2011 oil Consumption ~ 4 Gigatonnes • CO2 emissions due to oil ~ 12 Gigatonnes
85% of coal mined is used to generate electric power. Can it be replaced by another resource?
Cheap Coal fueled development in the 20th century
It’s use will persist through at least the first half of the 21st century
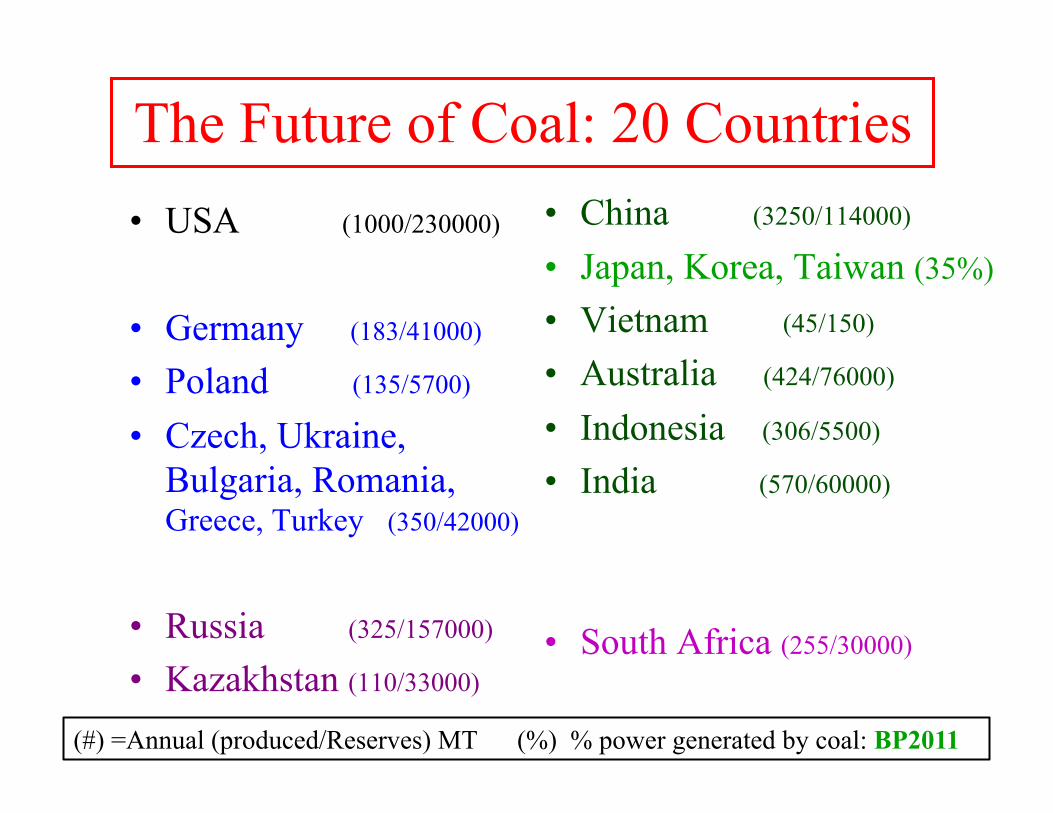
The Future of Coal: 20 Countries • USA (1000/230000)
• Germany (183/41000) • Poland (135/5700) • Czech, Ukraine,
Bulgaria, Romania, Greece, Turkey (350/42000)
• Russia (325/157000) • Kazakhstan (110/33000)
• China (3250/114000) • Japan, Korea, Taiwan (35%) • Vietnam (45/150) • Australia (424/76000) • Indonesia (306/5500) • India (570/60000)
• South Africa (255/30000)
(#) =Annual (produced/Reserves) MT (%) % power generated by coal: BP2011
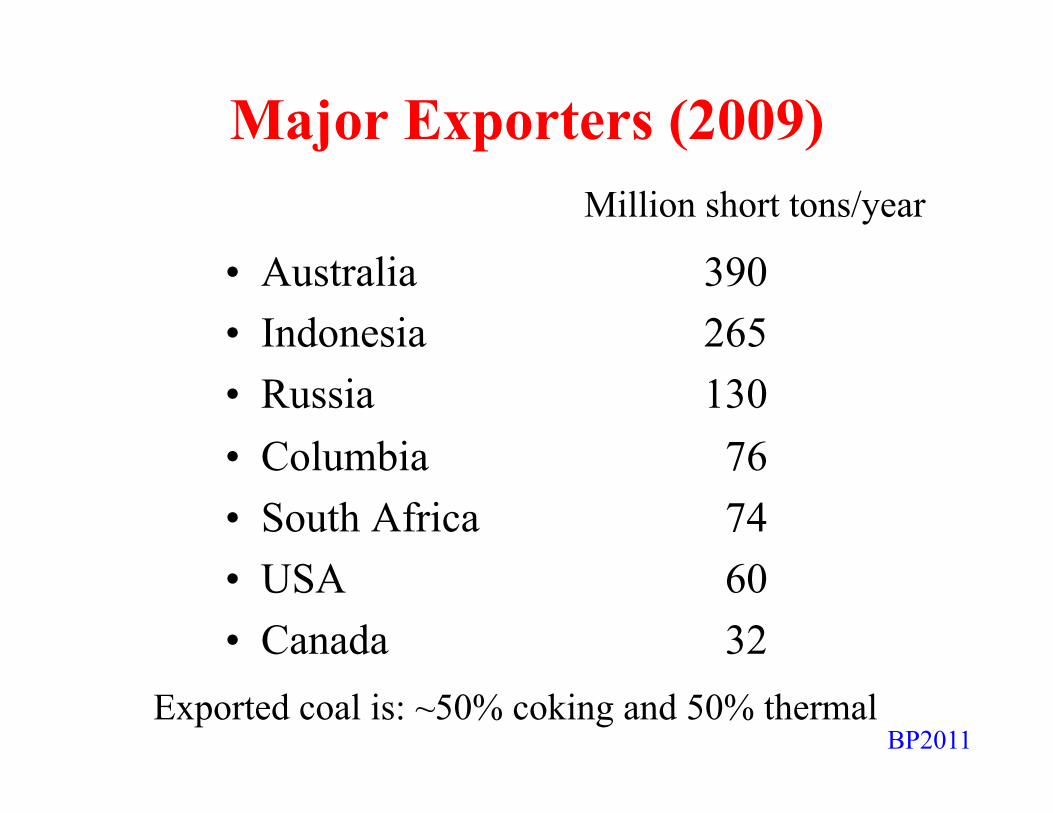
Major Exporters (2009)
• Australia 390 • Indonesia 265 • Russia 130 • Columbia 76 • South Africa 74 • USA 60 • Canada 32
Million short tons/year
Exported coal is: ~50% coking and 50% thermal BP2011
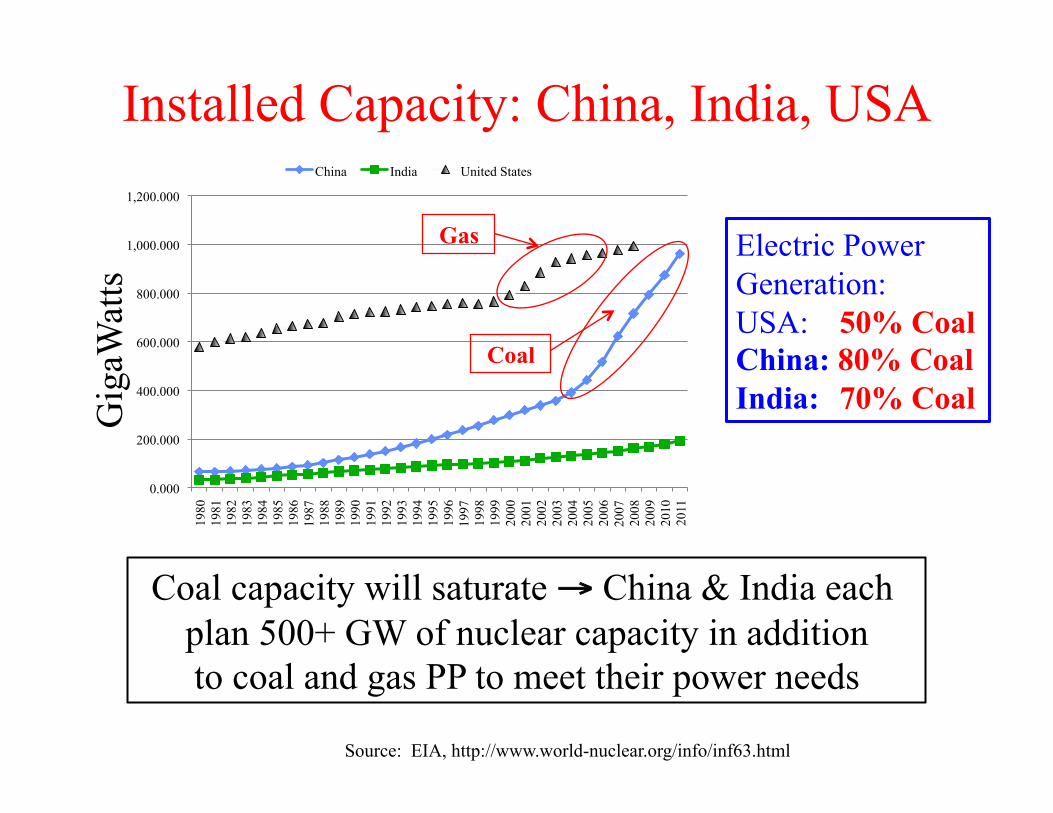
Installed Capacity: China, India, USA
Source: EIA, http://www.world-nuclear.org/info/inf63.html
Coal capacity will saturate → China & India each plan 500+ GW of nuclear capacity in addition to coal and gas PP to meet their power needs
0.000
200.000
400.000
600.000
800.000
1,000.000
1,200.000 19
80
1981
19
82
1983
19
84
1985
19
86
1987
19
88
1989
19
90
1991
19
92
1993
19
94
1995
19
96
1997
19
98
1999
20
00
2001
20
02
2003
20
04
2005
20
06
2007
20
08
2009
20
10
2011
China India United States
Gig
aWat
ts
Gas
Coal
Electric Power Generation: USA: 50% Coal China: 80% Coal India: 70% Coal
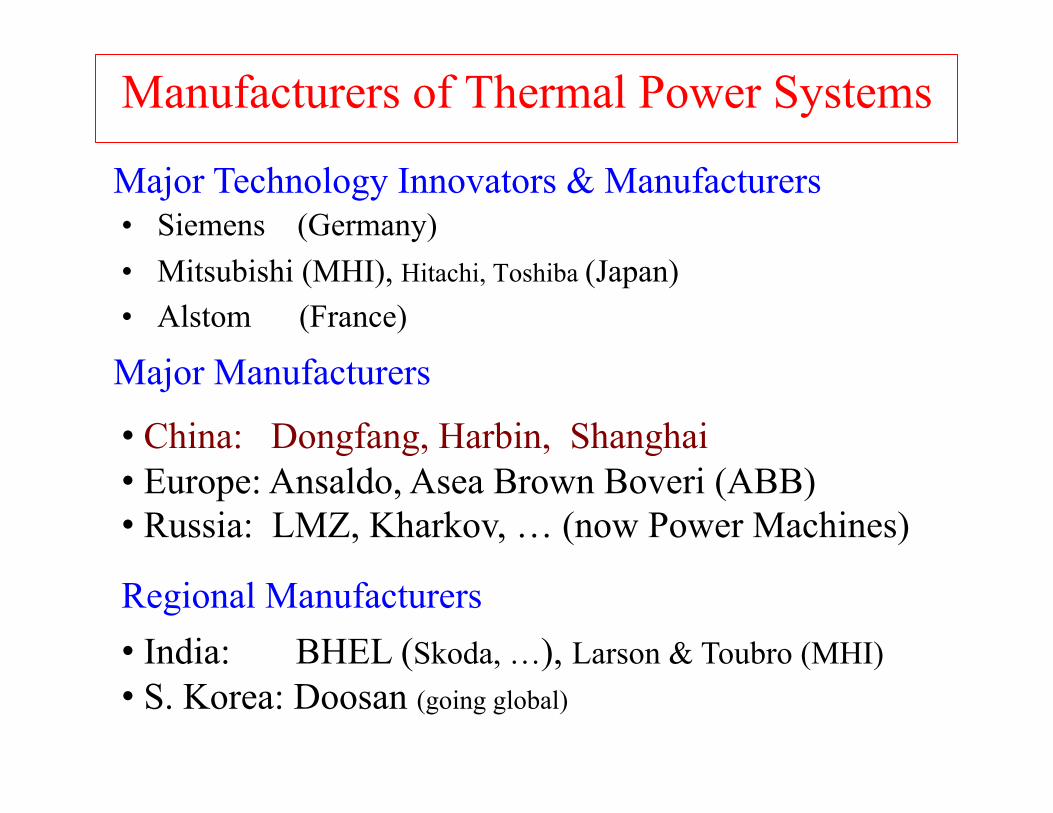
Manufacturers of Thermal Power Systems
• Siemens (Germany) • Mitsubishi (MHI), Hitachi, Toshiba (Japan) • Alstom (France)
Major Technology Innovators & Manufacturers
Major Manufacturers
• China: Dongfang, Harbin, Shanghai • Europe: Ansaldo, Asea Brown Boveri (ABB) • Russia: LMZ, Kharkov, … (now Power Machines)
Regional Manufacturers • India: BHEL (Skoda, …), Larson & Toubro (MHI) • S. Korea: Doosan (going global)
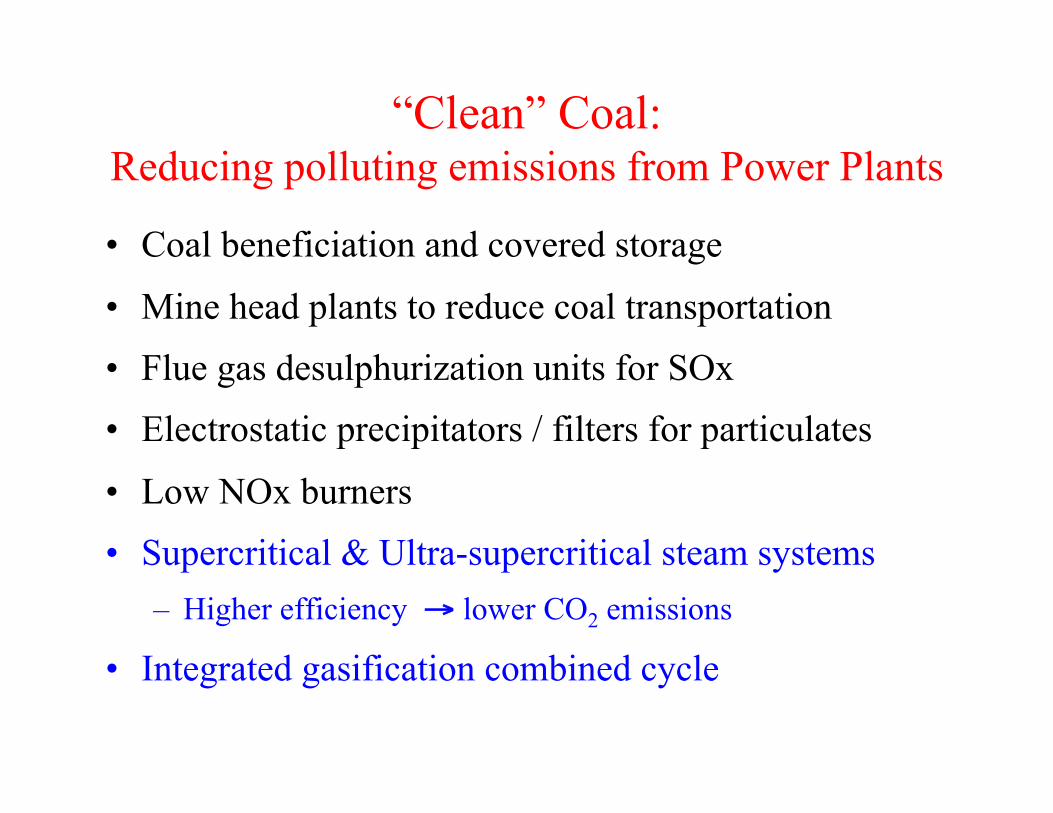
“Clean” Coal: Reducing polluting emissions from Power Plants
• Coal beneficiation and covered storage
• Mine head plants to reduce coal transportation
• Flue gas desulphurization units for SOx
• Electrostatic precipitators / filters for particulates
• Low NOx burners
• Supercritical & Ultra-supercritical steam systems – Higher efficiency → lower CO2 emissions
• Integrated gasification combined cycle
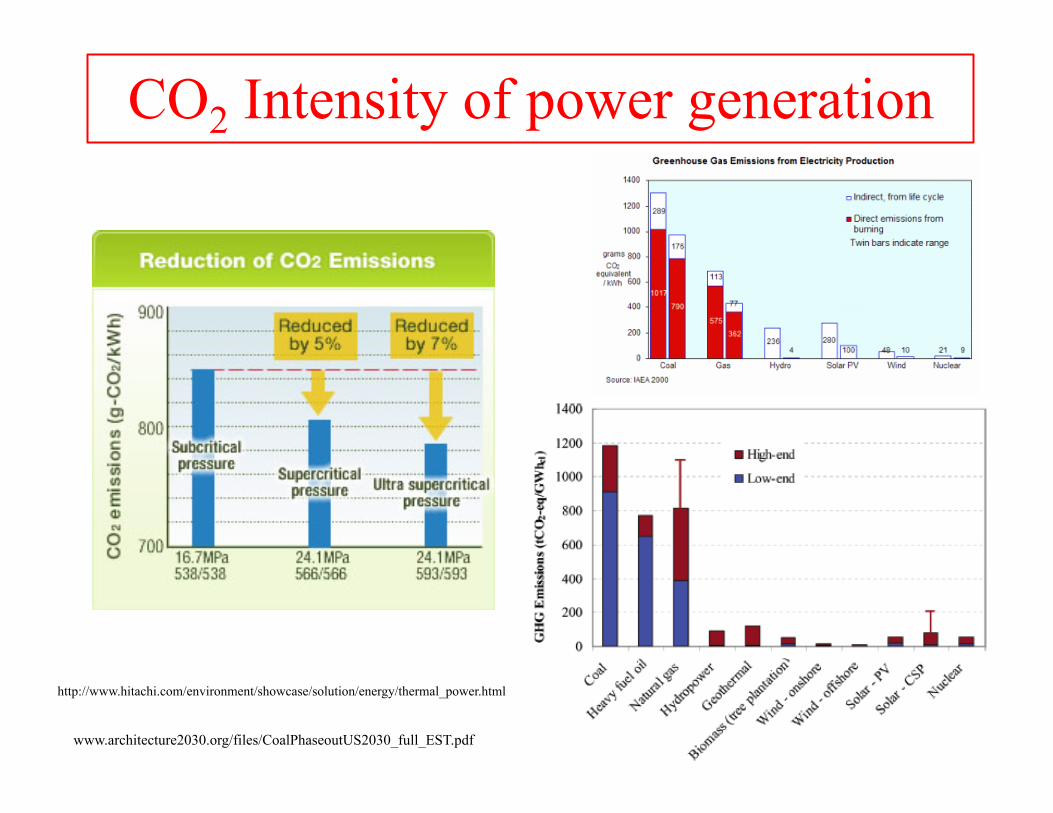
CO2 Intensity of power generation
http://www.hitachi.com/environment/showcase/solution/energy/thermal_power.html
www.architecture2030.org/files/CoalPhaseoutUS2030_full_EST.pdf
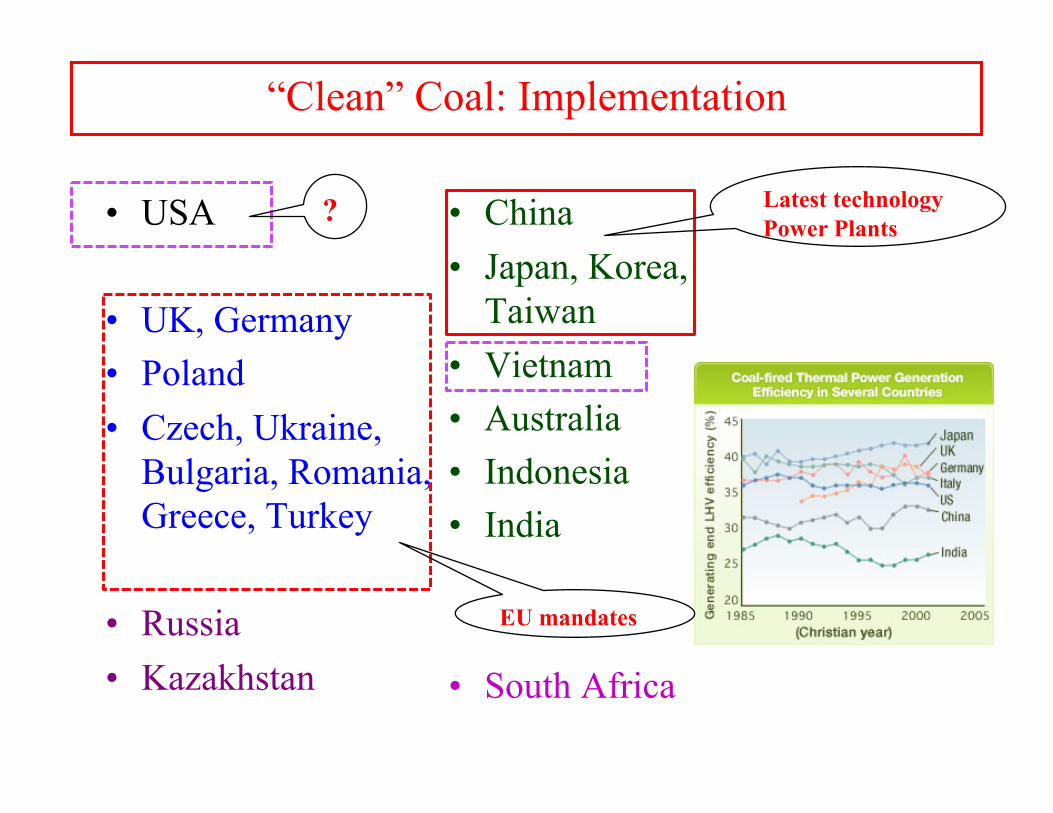
“Clean” Coal: Implementation
• USA
• UK, Germany • Poland • Czech, Ukraine,
Bulgaria, Romania, Greece, Turkey
• Russia • Kazakhstan
• China • Japan, Korea,
Taiwan • Vietnam • Australia • Indonesia • India
• South Africa
? Latest technology Power Plants
EU mandates
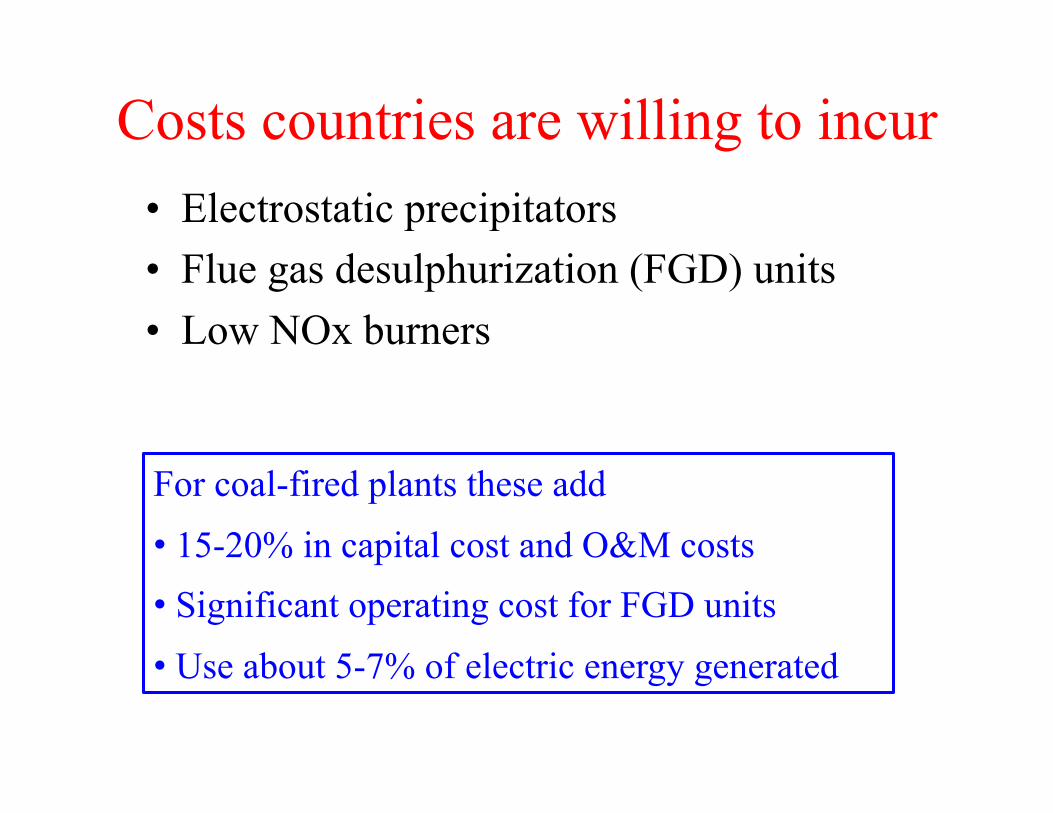
Costs countries are willing to incur • Electrostatic precipitators • Flue gas desulphurization (FGD) units • Low NOx burners
For coal-fired plants these add
• 15-20% in capital cost and O&M costs • Significant operating cost for FGD units
• Use about 5-7% of electric energy generated
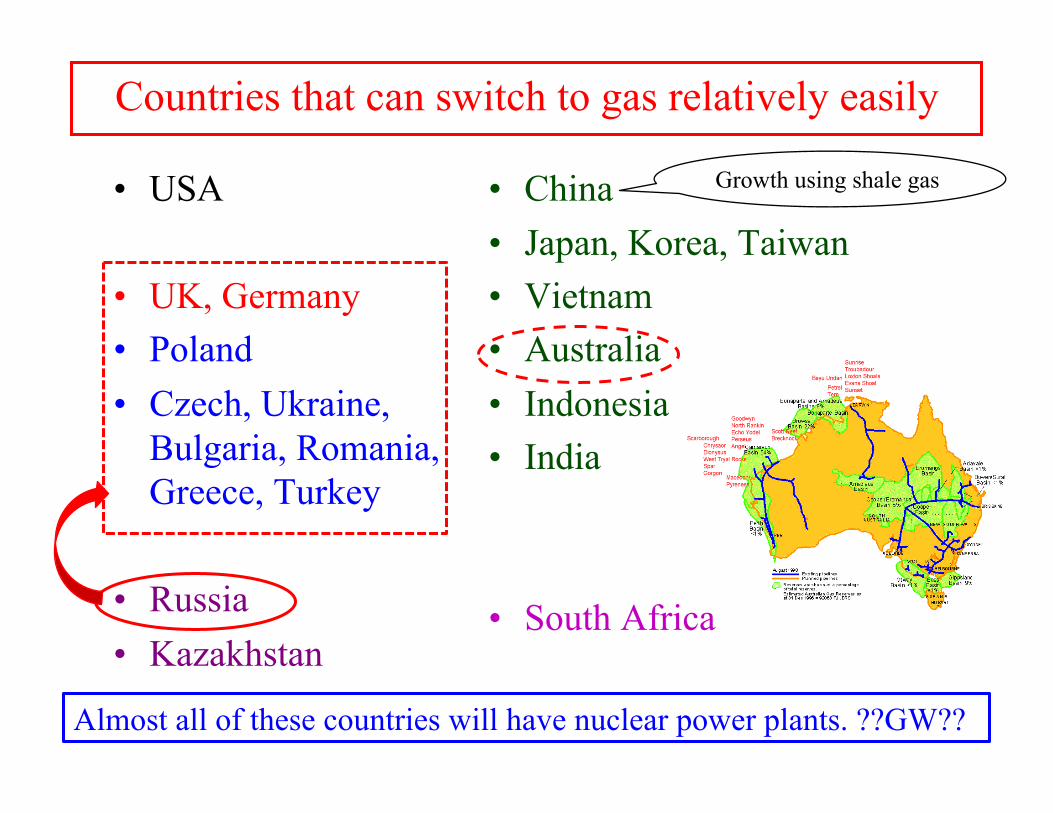
Countries that can switch to gas relatively easily
• USA
• UK, Germany • Poland • Czech, Ukraine,
Bulgaria, Romania, Greece, Turkey
• Russia • Kazakhstan
• China • Japan, Korea, Taiwan • Vietnam • Australia • Indonesia • India
• South Africa
Almost all of these countries will have nuclear power plants. ??GW??
Growth using shale gas
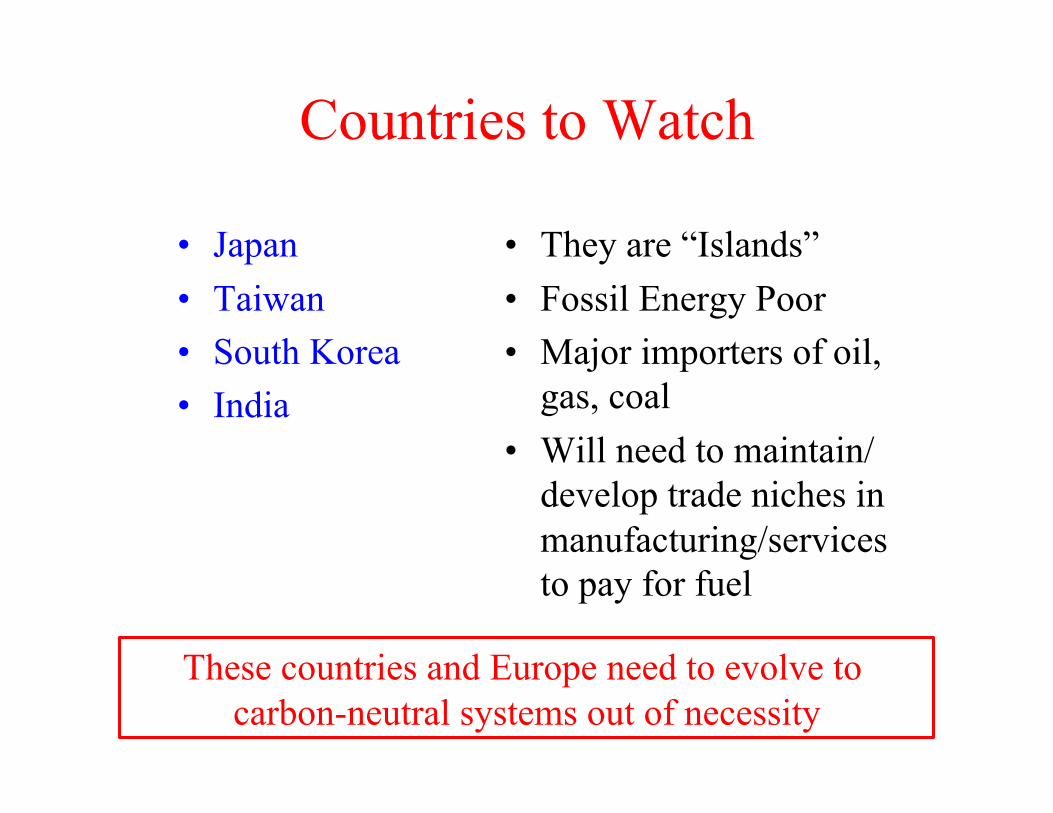
Countries to Watch
• Japan • Taiwan • South Korea • India
• They are “Islands” • Fossil Energy Poor • Major importers of oil,
gas, coal • Will need to maintain/
develop trade niches in manufacturing/services to pay for fuel
These countries and Europe need to evolve to carbon-neutral systems out of necessity
BAU: In the short term coal use will continue to grow at 2-2.5%/yr
My guess, based on the 20 major consumer countries and resource distribution, is that coal use will
peak at about 9 Gigatonnes/yr
9 Gigatonnes of coal → ~18 Gigatonnes of CO2
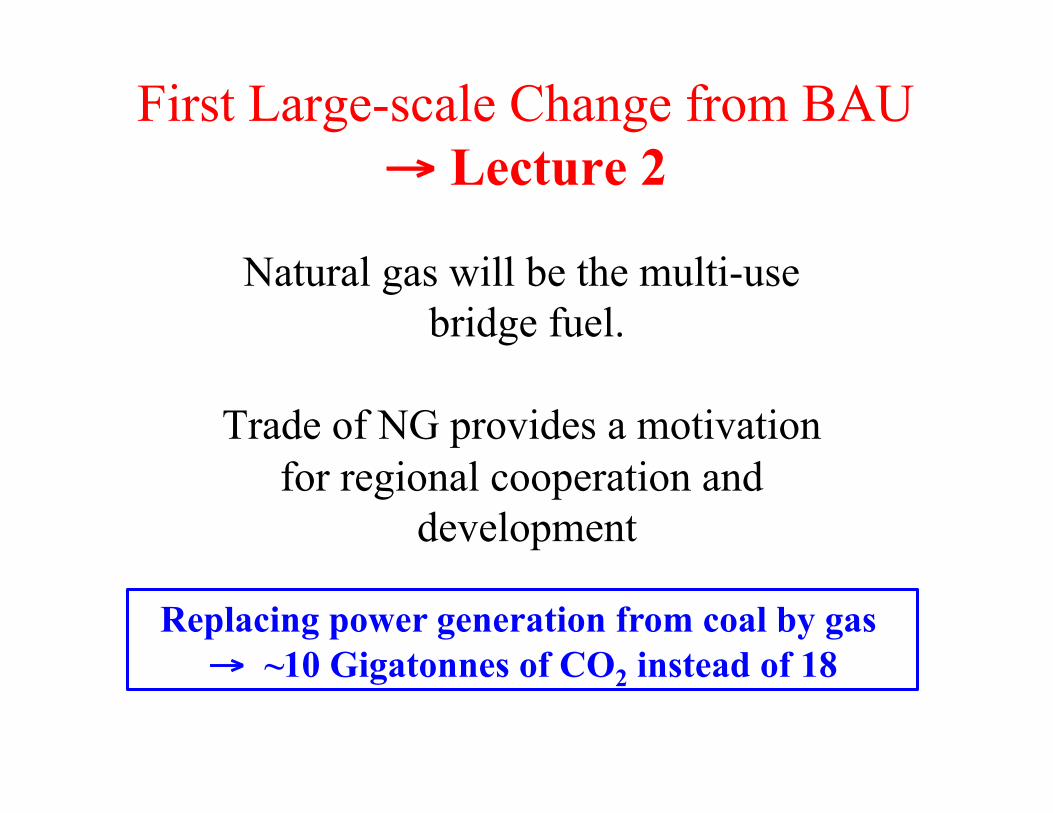
First Large-scale Change from BAU → Lecture 2
Natural gas will be the multi-use bridge fuel.
Trade of NG provides a motivation for regional cooperation and
development
Replacing power generation from coal by gas → ~10 Gigatonnes of CO2 instead of 18