Embed Size (px)
Citation preview
© 2016 Halliburton. All rights reserved.
What will shape the
global supply mix?
Dr. Jonathan Lewis
Senior Vice President, Completion & Production
February 2015

2 © 2016 Halliburton. All rights reserved.
Safe Harbor
The statements in this presentation that are not historical statements, including statements regarding future financial performance and the pending Baker Hughes transaction, are
forward-looking statements within the meaning of the federal securities laws. These statements are subject to numerous risks and uncertainties, many of which are beyond the
company's control, which could cause actual results to differ materially from the results expressed or implied by the statements. These risks and uncertainties include, but are not
limited to: with respect to the Baker Hughes acquisition, the timing to consummate the proposed transaction; the terms, timing and completion of divestitures undertaken to obtain
required regulatory approvals; the conditions to closing of the proposed transaction may not be satisfied or the closing of the proposed transaction otherwise does not occur; the
risk a regulatory approval that may be required for the proposed transaction is not obtained or is obtained subject to conditions that are not anticipated; the diversion of
management time on transaction-related issues; the ultimate timing, outcome and results of integrating the operations of Halliburton and Baker Hughes and the ultimate outcome
of Halliburton’s operating efficiencies applied to Baker Hughes’ products and services; the effects of the business combination of Halliburton and Baker Hughes, including the
combined company’s future financial condition, results of operations, strategy and plans; expected synergies and other benefits from the proposed transaction and the ability of
Halliburton to realize such synergies and other benefits; with respect to the Macondo well incident, final court approval of, and the satisfaction of the conditions in, Halliburton's
September 2014 settlement, including the results of any appeals of rulings in the multi-district litigation; indemnification and insurance matters; with respect to repurchases of
Halliburton common stock, the continuation or suspension of the repurchase program, the amount, the timing and the trading prices of Halliburton common stock, and the
availability and alternative uses of cash; changes in the demand for or price of oil and/or natural gas can be significantly impacted by weakness in the worldwide economy;
consequences of audits and investigations by domestic and foreign government agencies and legislative bodies and related publicity and potential adverse proceedings by such
agencies; protection of intellectual property rights and against cyber attacks; compliance with environmental laws; changes in government regulations and regulatory
requirements, particularly those related to offshore oil and natural gas exploration, radioactive sources, explosives, chemicals, hydraulic fracturing services, and climate-related
initiatives; compliance with laws related to income taxes and assumptions regarding the generation of future taxable income; risks of international operations, including risks
relating to unsettled political conditions, war, the effects of terrorism, foreign exchange rates and controls, international trade and regulatory controls, and doing business with
national oil companies; weather-related issues, including the effects of hurricanes and tropical storms; changes in capital spending by customers; delays or failures by customers
to make payments owed to us; execution of long-term, fixed-price contracts; structural changes in the oil and natural gas industry; maintaining a highly skilled workforce;
availability and cost of raw materials; and integration and success of acquired businesses and operations of joint ventures. Halliburton's Form 10-K for the year ended December
31, 2015, recent Current Reports on Form 8-K, and other Securities and Exchange Commission filings discuss some of the important risk factors identified that may affect
Halliburton's business, results of operations, and financial condition. Halliburton undertakes no obligation to revise or update publicly any forward-looking statements for any
reason.

3 © 2016 Halliburton. All rights reserved.
Agenda
Where Are We?
How Did We Get Here?
Demand Outlook
Key Drivers of Where the Industry
Will Find and Produce Resources

4 © 2016 Halliburton. All rights reserved.
Where We Are
Source: Baker Hughes US Rig Count, through 2/12/16
0.20
0.40
0.60
0.80
1.00
0 25 50 75 100 125 150In
de
xe
d R
ig C
ou
nt
Weeks
1985-88 1997-01 2001-04 2008-11 2014-Curr
-72% -67%
U.S. Rig Count Index
Crude oil at 13-year lows
U.S. rig count down 72%
Capital spend reduced
250,000 energy jobs lost
-57% -72% -43% -52% -67%

5 © 2016 Halliburton. All rights reserved.
How We Got Here
Source: EIA, IHS
0
2
4
6
8
10
12
2010 2011 1Q12 1Q13 1Q14 1Q15 1Q16
OPEC N. America Total Liquids Supply Total Liquids Demand
Mill
ion
ba
rre
ls p
er
da
y
2010-11
Healthy demand growth
following global recession
Incremental Supply and Demand by Source

6 © 2016 Halliburton. All rights reserved.
0
2
4
6
8
10
12
2010 2011 2012 2013 2014 2015 1Q16
OPEC N. America Total Liquids Supply Total Liquids Demand
2010-11
Healthy demand growth
following global recession
2012 -14
N. America production growing
faster than incremental global
demand
How We Got Here
Source: EIA, IHS
Mill
ion
ba
rre
ls p
er
da
y
Incremental Supply and Demand by Source

7 © 2016 Halliburton. All rights reserved.
How We Got Here
0
2
4
6
8
10
12
2010 2011 2012 2013 2014 2015 2016
OPEC N. America Total Liquids Supply Total Liquids Demand
2010-11
Healthy demand growth
following global recession
2012 -14
N. America production growing
faster than incremental global
demand
2015
OPEC increases production to
maintain share
Source: EIA, IHS
Mill
ion
ba
rre
ls p
er
da
y
Incremental Supply and Demand by Source

8 © 2016 Halliburton. All rights reserved.
Is This Downturn Different?
0.90
0.95
1.00
1.05
1.10
1.15
1.20
0.0
0.2
0.4
0.6
0.8
1.0
1.2
1985 1986 1987
WTI Price Global Production
0.90
0.95
1.00
1.05
1.10
1.15
1.20
0.0
0.2
0.4
0.6
0.8
1.0
1.2
2014 2015 2016
WTI Price Global Production
WT
I price in
dex
WT
I price in
dex
Glo
bal p
roductio
n in
dex
Glo
bal p
roductio
n in
dex
1985 - 1987
Oil price only bottomed after OPEC
cut production in 3Q86
2014 – 2016
Lack of meaningful production declines
has weighed on price
Global Production vs. Oil Price

9 © 2016 Halliburton. All rights reserved.
Going Forward – Hydrocarbons Dominate
0
100
200
300
400
500
600
700
2000 2005 2010 2015 2020 2025
Quadrilli
on B
TU
s
Economic Growth
Urbanization
Policy
Technology Developments
Global Energy Demand
Annual growth: 1-2%
2015-2025
CAGR 1-4% ~2% 3-4% 2-3% ~1% 6-9% 0-1%
Oil Gas Coal Nuclear Biomass/
Waste Hydro
Other
Renewables
Source: BP, Exxon Mobil, Statoil, company estimates

10 © 2016 Halliburton. All rights reserved.
Time To Revisit Demand Consensus?
$0
$20
$40
$60
$80
$100
$120
-2%
-1%
0%
1%
2%
3%
4%
5%
1994 1995 1996 1997 1998 1999 2000 2001 2002 2003 2004 2005 2006 2007 2008 2009 2010 2011 2012 2013 2014 2015
YOY Change in Oil Demand WTI Price
Annual change in
glo
bal liq
uid
s d
em
and
O
il pric
e, $
/barre
l
1994 – 2004 low-priced oil
Average demand growth:
+1.8% / year
2004-2014 high-priced oil
Average demand growth:
+0.8% / year
Global Demand vs. Oil Price

11 © 2016 Halliburton. All rights reserved.
How Much New Oil Do We Need To Produce?
0
20
40
60
80
100
120
2015 2016 2017 2018 2019 2020
Production Offset decline New Demand
Mill
ion
ba
rre
ls p
er
da
y
* Assumes 1% annual
demand growth
2015 - 2020
19mm barrels of new supply to offset production decline
and meet 1% demand growth
Source: Rystad Energy, Feburary 2016
Global Demand vs. Oil Production
12 © 2016 Halliburton. All rights reserved.
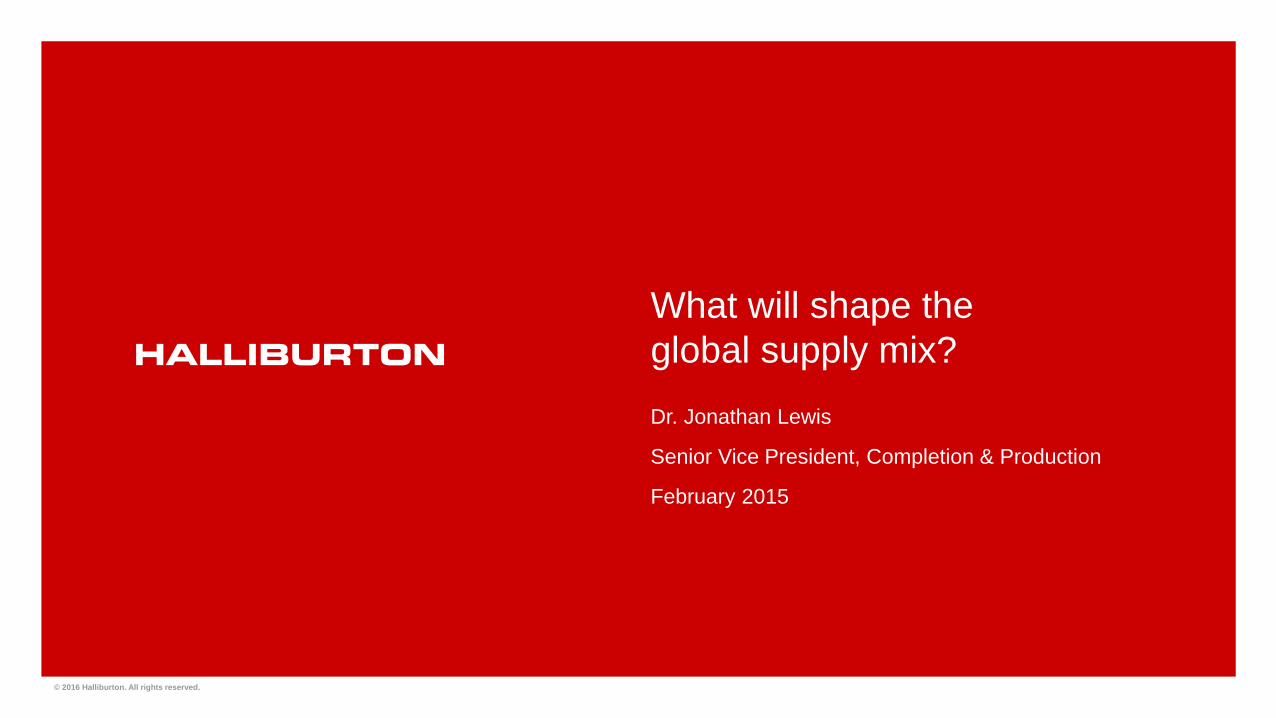
0 50 100 150
$40 Breakeven $60 Breakeven
Liquid reserves in billions of barrels
Resource Availability Key drivers of where the industry will find and produce oil
Source: Rystad Energy, February 2016
At $60 Oil
LTO has significant upside production
potential relative to deep water
Deep Water
Light Tight Oil (LTO)
Economically Recoverable
Resources by Supply Source
13 © 2016 Halliburton. All rights reserved.
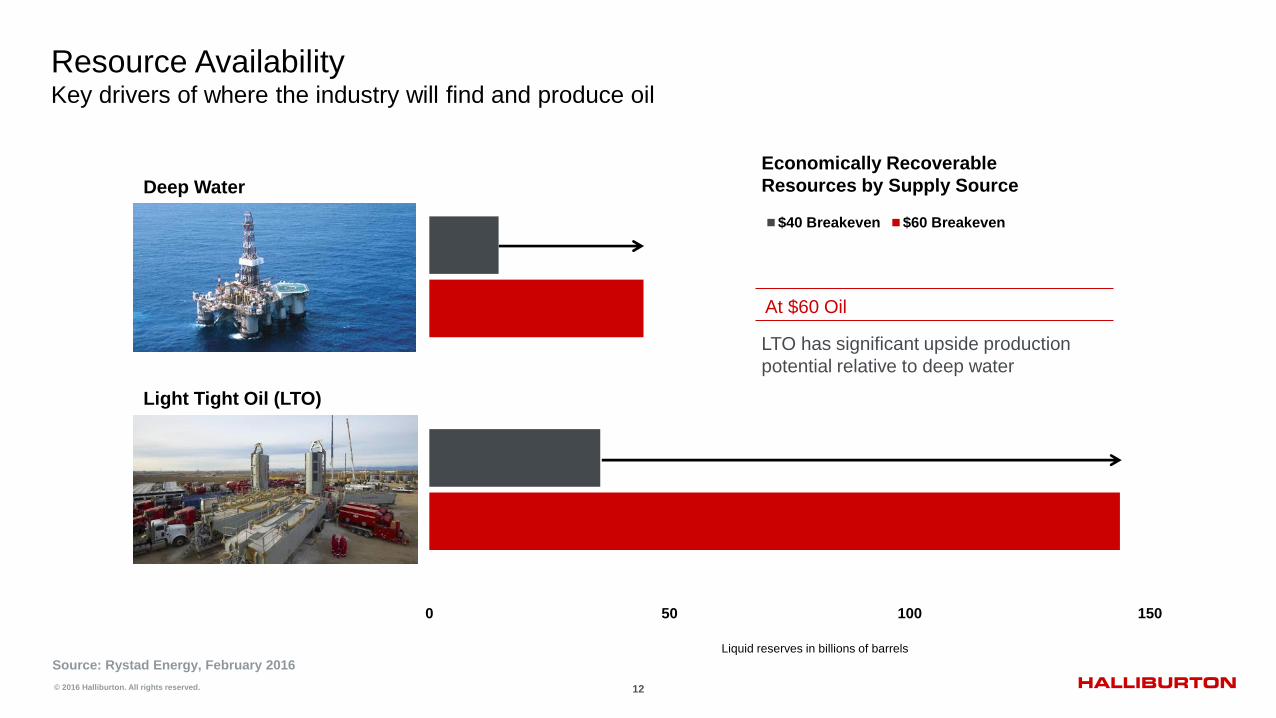
Light Tight Oil Costs Are Declining, While Production Increases $M
M
per
horizonta
l w
ell
90-d
ay in
itia
l pro
ductio
n,
BO
E/d
ay
$ p
er fo
ot o
f late
ral le
ngth
Source: Rystad Energy, February 2016, PacWest
28% 41%
CapEx per
Well CapEx per
Lateral Foot
68%
90-day IPs
$0
$500
$1,000
$1,500
$2,000
$2,500
$3,000
$0
$2
$4
$6
$8
$10
$12
2011 2012 2013 2014 2015
$/Hz well $/ft lateral
0
100
200
300
400
500
600
2011 2012 2013 2014 2015
Cost per horizontal well and per foot of lateral
Permian Basin
Average 90-day IPs, horizontal wells
Permian Basin
2011-15 change

14 © 2016 Halliburton. All rights reserved.
North American LTO Production
0
100
200
300
400
500
600
700
800
900
2010 2011 2012 2013 2014 2015 2016
Bakken Eagle Ford Niobrara PermianN
ew
liq
uid
s p
roductio
n p
er
rig
(th
ousands o
f barr
els
per
day)
+500% +150% +500% +200%
2010-2016
U.S. shale production has not declined at the rate of rig
count, partially driven by increased new barrels per rig
Source: EIA
New barrels per rig
Major U.S. LTO basins

15 © 2016 Halliburton. All rights reserved.
Technologies Enabling North American Shale Efficiency
Harvesting Reserves Stimulation Materials
Frac Design Surface Efficiency Reservoir Insight

16 © 2016 Halliburton. All rights reserved.
$0
$10
$20
$30
$40
$50
$60
$70
$80
2010 2011 2012 2013 2014 2015
LTO vs. Deep Water Breakeven Trends
$0
$10
$20
$30
$40
$50
$60
$70
$80
2010 2011 2012 2013 2014 2015
Bre
ake
ve
n p
rice
, $
pe
r b
arr
el
Bre
ake
ve
n p
rice
, $
pe
r b
arr
el
Source: Rystad Energy, February 2016
Deep Water
Deepwater project breakeven
by approval year
Light Tight Oil
U.S. average wellhead breakeven price
for horizontal wells by spud year
-33%
-9%

17 © 2016 Halliburton. All rights reserved.
0
5
10
15
20
25
<$20 $20-40 $40-60 $60-80 $80-100 >$100
LTO Shelf and Midwater Other Onshore Deep Water Other
Mill
ion
ba
rre
ls p
er
da
y
Light Tight Oil Expected To Be The Largest Source Of New Production in 2020
New Production By Source With Current Breakevens
Source: Rystad Energy, February 2016
19 million bpd of new supply

18 © 2016 Halliburton. All rights reserved.
0
5
10
15
20
25
<$20 $20-40 $40-60 $60-80 $80-100 >$100
LTO Shelf and Midwater Other Onshore Deep Water Other
Mill
ion
ba
rre
ls p
er
da
y
Light Tight Oil Expected To Be The Largest Source Of New Production in 2020
Mill
ion
ba
rre
ls p
er
da
y
New Production By Source With Current Breakevens New Production By Source with Continued Productivity Gains*
Source: Rystad Energy, February 2016
19 million bpd of new supply
0
5
10
15
20
25
<$20 $20-40 $40-60 $60-80 $80-100 >$100
LTO Shelf and Midwater Other Onshore Deep Water Other
19 million bpd of new supply
*Productivity assumptions include:
• 30% total cost reduction for LTO and deepwater from 2015-20
• 40% increase in production from new LTO assets
• 15% increase in production from new deep water assets

19 © 2016 Halliburton. All rights reserved.


![Incorporation of Shape Memory Polymers in Interactive DesignTable 1: Shape Memory Polymer Volumetric Mix Ratios [13] Samples Epon 826 (ml) Jeffamine D-230 (ml) NGDE (ml) T g ( C) 1](https://img.pdfslide.us/doc/110x75/5faaece21fb6cb6fb628c60b/incorporation-of-shape-memory-polymers-in-interactive-design-table-1-shape-memory.jpg)