Embed Size (px)
Citation preview

Page 1 of 17
What will be on your Math 1070 Statistics Final Exam? The Course Content Standards:
As a result of completing this course, students will be able to:
1. Analyze statistical problems using critical thinking skills, such as deciding on appropriate statistics to measure and suitable tests to be performed;
2. Support statistical analyses using the course-required calculator whenever possible; 3. Define basic descriptive and inferential statistical terms; Chapters 1, 2, 10
Page 2 of 17
4. Define terms of Experimental Design;
Page 3 of 17
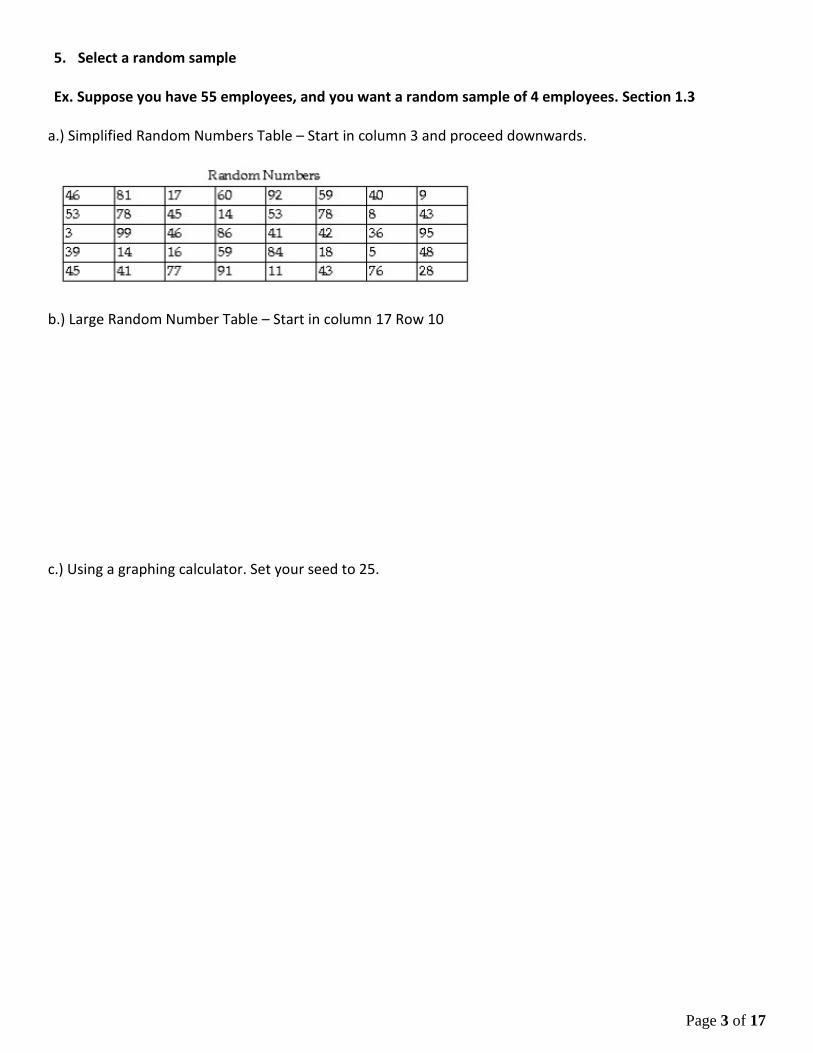
5. Select a random sample
Ex. Suppose you have 55 employees, and you want a random sample of 4 employees. Section 1.3
a.) Simplified Random Numbers Table – Start in column 3 and proceed downwards.
b.) Large Random Number Table – Start in column 17 Row 10
c.) Using a graphing calculator. Set your seed to 25.
Page 4 of 17
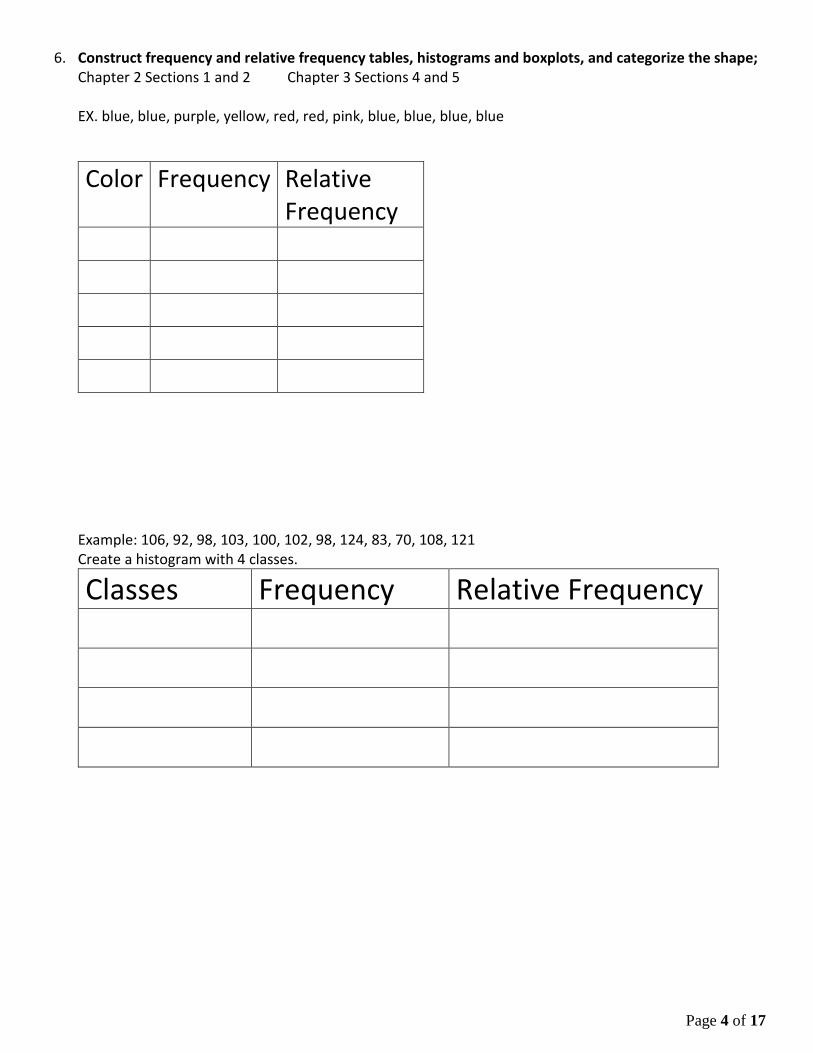
6. Construct frequency and relative frequency tables, histograms and boxplots, and categorize the shape; Chapter 2 Sections 1 and 2 Chapter 3 Sections 4 and 5 EX. blue, blue, purple, yellow, red, red, pink, blue, blue, blue, blue
Color Frequency Relative Frequency
Example: 106, 92, 98, 103, 100, 102, 98, 124, 83, 70, 108, 121 Create a histogram with 4 classes.
Classes Frequency Relative Frequency
Page 5 of 17
7. Define the mean, median, mode, standard deviation, range, and quartiles and calculate their values for a set of data using the course required calculator; Chapter 3 Sections 1, and 2
106, 92, 98, 103, 100, 102, 98, 124, 83, 70, 108, 121
Page 6 of 17
8. Identify outliers from a data set; Chapter 3 Section 4 Ex. Are there any outliers? 106, 92, 98, 103, 100, 102, 98, 124, 83, 70, 108, 121
Page 7 of 17
9. Calculate, interpret and apply z-scores. Chapter 3 Section 4 What is the z-score for 105? 106, 92, 98, 103, 100, 102, 98, 124, 83, 70, 108, 121 Interpret your z-score.

Page 8 of 17
10. Understand and apply basic concepts of probability; Chapter 5 Section 1
Ex. Let the sample space be S = {1, 2, 3, 4, 5, 6, 7, 8, 9, 10}. Suppose the outcomes are equally likely.
a.) Compute the probability of the event E = {1, 2, 3}
b.)Compute the probability of the event “an even number”
Ex. What is the probability of spinning and landing on a green spot?
Ex. What is the probability of rolling a 7 on a die?
Ex. What is the probability of selecting an Ace from a deck of cards?

Page 9 of 17
11. Compute regular, compound, and conditional probabilities of events from a contingency table; Chapter 5 Section 3
A.) What is the probability that a business phone was present?
B.) What is the probability that a business phone was present and the job title was present?
C.)What is the probability that a business phone was present or the job title was present?
D. Given that the business phone was present, what is the probability that the job title was not present?
Page 10 of 17
12. Compute binomial probabilities and their mean and standard deviation; Chapter 6 Section 2
According to the American Lung Association, 90% of adult smokers started smoking before turning 21 years old. Ten smokers 21 years old or older are randomly selected, and the number of smokers who started smoking before 21 is recorded.
a.) Find the probability that exactly 8 of them started smoking before 21 years of age.
b.)Find the probability that fewer than 8 of them started smoking before 21 years of age.
c.) Find the probability that at least 8 of them started smoking before 21 years of age.
d.)Find the probability that between 7 and 9 of them, inclusive stated smoking before 21 years of age.
e.)Compute the mean of the random variable X, the number of smokers who started before turning 21 years old.
f.) Compute the standard deviation of the random variable X, the number of smokers who started before turning 21 years old.
Page 11 of 17
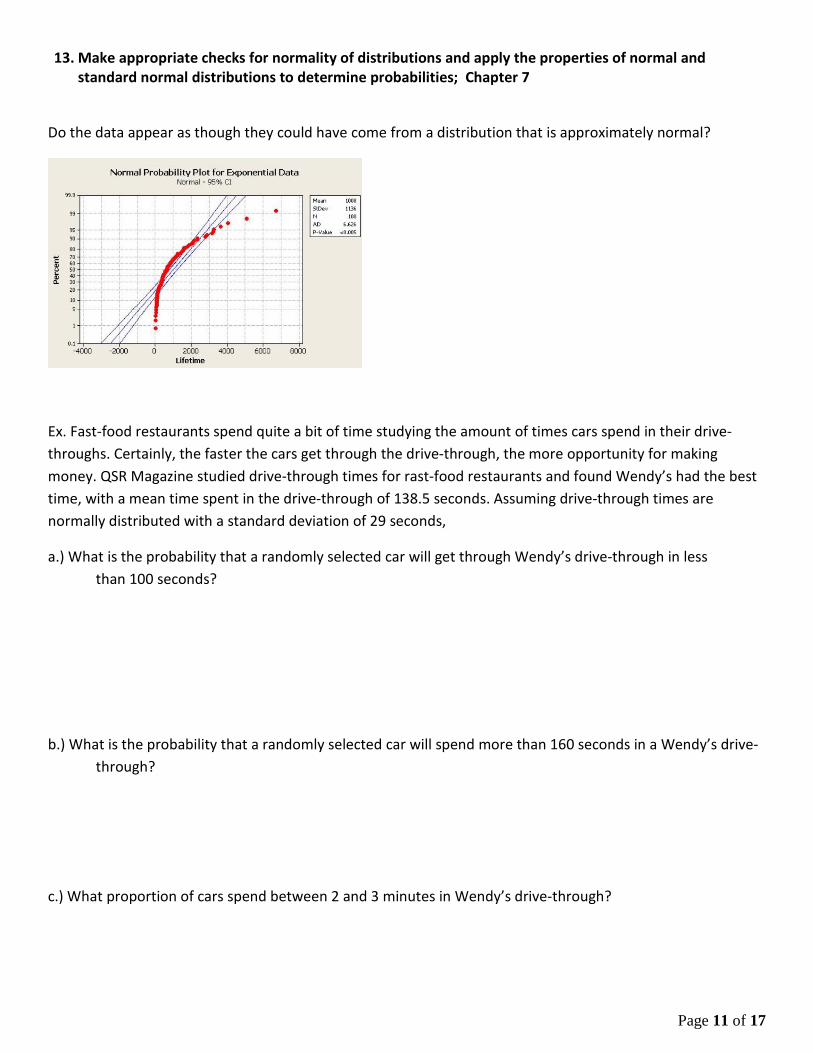
13. Make appropriate checks for normality of distributions and apply the properties of normal and standard normal distributions to determine probabilities; Chapter 7
Do the data appear as though they could have come from a distribution that is approximately normal?
Ex. Fast-food restaurants spend quite a bit of time studying the amount of times cars spend in their drive-throughs. Certainly, the faster the cars get through the drive-through, the more opportunity for making money. QSR Magazine studied drive-through times for rast-food restaurants and found Wendy’s had the best time, with a mean time spent in the drive-through of 138.5 seconds. Assuming drive-through times are normally distributed with a standard deviation of 29 seconds,
a.) What is the probability that a randomly selected car will get through Wendy’s drive-through in less than 100 seconds?
b.) What is the probability that a randomly selected car will spend more than 160 seconds in a Wendy’s drive- through?
c.) What proportion of cars spend between 2 and 3 minutes in Wendy’s drive-through?

Page 12 of 17
14. Use the Central Limit Theorem to describe the sampling distribution of the sample mean and sample proportion; Chapter 8
Ex. According to U.S. News and World Report, in the population of 4,361 students enrolled in Penn State World Campus bachelor’s degree programs, 811 have military experience. If we were to randomly select 75 students to participate in a research study, describe the sampling distribution of the sample proportion. Ex. The most famous geyser in the world, Old Faithful in Yellowstone National Park, has a mean time between eruptions of 85 minutes. If the interval of time between eruptions is normally distributed with standard deviation 21.25 minutes, describe the sampling distribution of the sample mean for a random sample of 30 time intervals.
Page 13 of 17
15. Determine confidence intervals for the mean and proportion of one population for large samples or normally distributed populations; Chapter 9
EX. A mileage test is conducted for a new car model, the “RRacer.” Thirty (n=30) random selected RRacer are driven for a month and the mileage is carefully measured in each. The mean mileage for the sample is 28.6 miles per gallon (mpg) and the sample standard deviation is 2.2 mpg. Estimate a 95% confidence interval for the mean mpg in the entire population of RRAcer. Round your answer to two decimal places. EX. The 2001 Youth Risk Behavior survey done by the U.S. Centers for Disease Control found that 747 out of 1168 female 12th graders said they always use a seatbelt when driving. Construct a 95% confidence interval for the proportion of 12th grade females in the population who always use a seatbelt when driving.
Page 14 of 17
16. Apply the basic model of hypothesis testing and select the appropriate distribution to make inferences about a population mean and proportion or the difference between two population means and proportions, including the use of z-, t-, statistics; Chapters 10 and 11
A random sample of 1,562 undergraduates enrolled in marketing courses was asked to respond on a scale from one (strongly disagree) to seven (strongly agree) to the proposition: "Advertising helps raise our standard of living." The sample mean response was 4.27 and the sample standard deviation was 1.32. Test the following hypothesis at the α = .05 significance level. H0: µ = 4 HA: µ > 4 Males and females were asked about what they would do if they received a $100 bill by mail, addressed to their neighbor, but wrongly delivered to them. Would they return it to their neighbor? Of the 69 males sampled, 52 said yes and of the 131 females sampled, 120 yes. Does the data indicate that the proportions that said yes are different for male and female at a 5% level of significance?

Page 15 of 17
16 continued: EX. The Department of Transportation in Georgia did a study a number of years ago that showed that the proportion of cars tested which failed to meet the state pollution standard was .37. The department would like to be able to say that the cars have improved since then. In a sample of n=100 cars more recently, the proportion not meeting the standards was .28. Perform the hypothesis test at level a = .01 level. EX. A sample of 40 male students selected from ISU produced a mean GPA (grade point average) of 2.79 with a standard deviation of 0.36. Another sample of 50 female students selected from ISU produced a mean GPA of 2.87 with a standard deviation of 0.32. The alternative hypothesis is that the mean GPA of all male students at ISU is less than the mean GPA of all female students at ISU. The significance level is 10%. Perform the appropriate hypothesis test.
Page 16 of 17
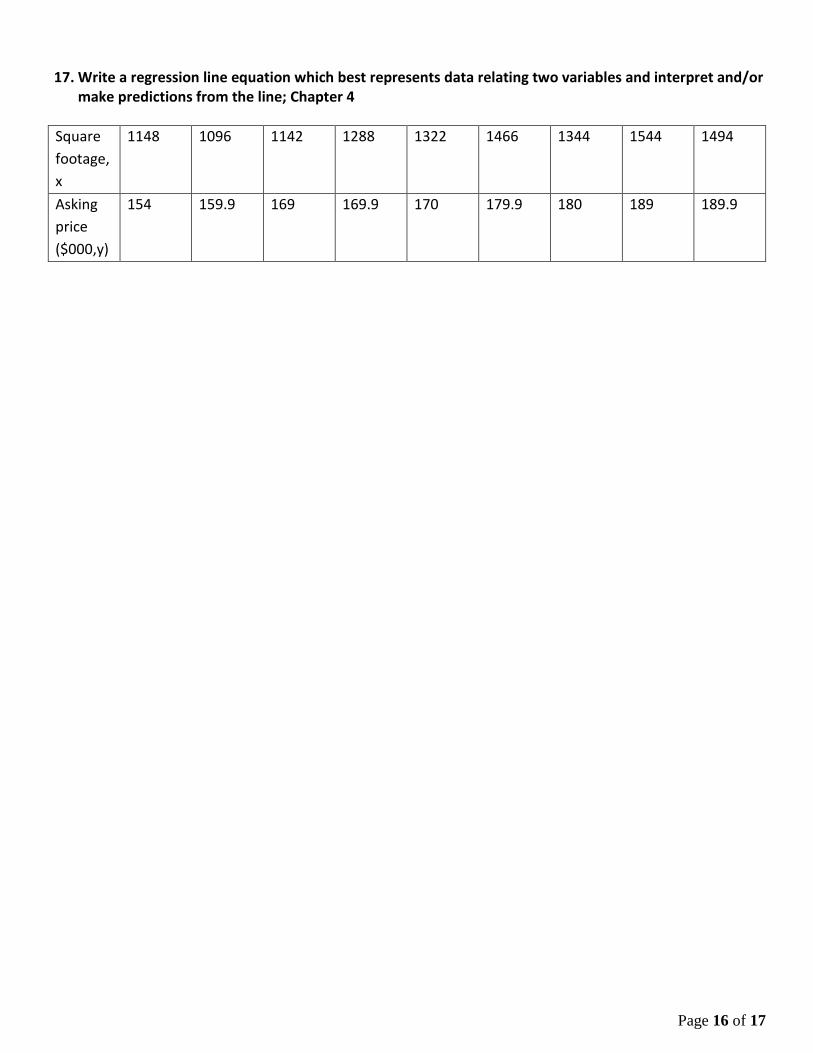
17. Write a regression line equation which best represents data relating two variables and interpret and/or
make predictions from the line; Chapter 4
Square footage, x
1148 1096 1142 1288 1322 1466 1344 1544 1494
Asking price ($000,y)
154 159.9 169 169.9 170 179.9 180 189 189.9

Page 17 of 17
18. Compute the linear correlation coefficient and coefficient of determination for a regression line using
the course required calculator and interpret its significance. Chapter 4 pg. 206 #28 The following data represent the square footage and asking price (in thousands of dollars) for a random sample of homes for sale in Naples, Florida, in December 2010.
Square footage, x
1148 1096 1142 1288 1322 1466 1344 1544 1494
Asking price ($000,y)
154 159.9 169 169.9 170 179.9 180 189 189.9