Embed Size (px)
Citation preview

What we found in TTSDAbout 30-40 students (per school) who
need a comprehensive reading program Middle schools: 1000 studentsHigh Schools:2000 students
A few students who need to build fluency
120 - 200 students who need comprehension strategy instruction per school
Many students who benefit from literacy instruction across the curriculum

Curriculum Choices Language! (Comprehensive Reading
& Writing)Soar to Success (MS
Comprehension)Literacy Strategies Classes (HS
Comprehension)McREL & Beers/Tovani Teaching
Reading in the Content Areas

All students have access to embedded literacy strategies across content areas
Foci:Frayer ModelAnticipation GuideWord SortsActive ParticipationDR/TA or KWLGroup SummarizingDefinition Word ChartDifferentiated
Assessment
Tier III
Tier II
Tier I
Across the Tiers

Tier I: What do students receive? General Ed Classes Access to Content
Literacy Strategies A limited number of
students are monitored by the Literacy Specialist
Target = 80% of student population

Content Literacy StrategiesPurpose/Prior Knowledge Anticipation Guide
Vocabulary Development Definition Word ChartFrayer ModelWord Sorts
Cues and Questioning/ Patterns
DRTAKWL
Reflection Group Summarizing

Literacy Strategies in Math Class!

Tier II: What do students receive? General Ed Classes Access to Content Literacy
Strategies Strategic Intervention
Soar to Success (Middle School)
Literacy Strategies (High School) Identify Text Structure Predictions Main Idea/Detail Inferences Visualization Summarizing Definition Word Chart
Target = 15% Student Population

Students Write about Strategic Instruction

Tier III: What do students receive? Access to Content
Literacy Strategies Comprehensive
reading and writing support LANGUAGE! (High
School) LANGUAGE!
(Middle School)
Target: 5%

LANGUAGE!- A student’s perspective

Grade Universal Screening Tools
Core Program Second Tier Interventions
Third Tier Interventions
6-8 MAZEOregon Assessment of Knowledge & Skills (OAKS)
HOLT – Elements of LiteratureHOLT – Elements of LanguageContent Literacy Strategies Supported Throughout All Content Areas
Soar to Success45 minutes/day minimum
Language!90 minutes/day
9-12 Oregon Assessment of Knowledge & Skills (OAKS)
Literacy Strategies Identify Text StructurePredictionsMain Idea/DetailInferencesVisualizationSummarizingDefinition Word Chart
Language!90 minutes/day
Who does this work?
ALL STAFF ALL STAFF Language Arts Teachers / Reading Specialists
Reading Specialists
TTSD 6-12 Reading Protocol

TTSD 6-12 Reading Decision RulesScreening:
Every student at each grade level who scores in the lowest 20 percent on MAZE, or at or below the 35th percentile on the OAKS, is: further screened with oral reading fluency
measures from 6-Minute Solution (check for fluency & accuracy); then,
the San Diego Quick is administered to evaluate what level of the SRAI to use; then,
the SRAI is administered to gauge comprehension skills; then,
for students with the most comprehensive reading needs, the Language! placement tests are administered.
Progress monitoring (6-12):Maze-CBM twice monthly.

Reading Decision Rules Continued
Intensifying interventions (These conditions should instigate a discussion in an EBIS meeting at the end of an intervention period):Maze scores indicate 3 to 4 data points (in a semester)
below the aimline AND are below the 50th percentile.Maze trendline analysis indicates a flat or declining
slope AND scores are below the 50th percentile.Grade+ scores are in the 3rd stanine or below.
Exiting interventions:Maze scores indicate 3 or more data points above the
aimline AND are at or above the 50th percentile; AND,Grade+ scores are at or above the 5th stanine; ANDOAKS scores are at or above the 36th percentile

Measuring Reading Comprehension with a Cloze Procedure
“Maze” is a multiple-choice “cloze” task that students complete while reading silently for 3 minutes. The first sentence of a 150-400 word passage is left intact. Thereafter, every 6th word is replaced with three words inside parenthesis. One of the words is the exact one from the original passage. The number of correct responses is normed, as is the rate of improvement.
Science-based research has shown that this provides a reliable and valid measure of reading comprehension.

EBIS Intervention Progress Monitoring
3 3
7
5
25
0
5
10
15
20
25
30
9/ 15 10/ 15 11/ 14 12/ 14 1/ 13 2/ 12 3/ 13 4/ 12 5/ 12 6/ 11
Monitoring/ Correct
Baseline/ Benchmark
Aimline
Trendline
Grade: 8
Probe Name: MAZE Karen Twain
Teacher Name: Goldman
School: The School of Dan
Cor
rect
Wor
ds/
Min
.
Intervention: Soar to Success
Change the Intervention!!!
Grade+ Composite Score =
1st Stanine
Intervention:LANGUAGE! D
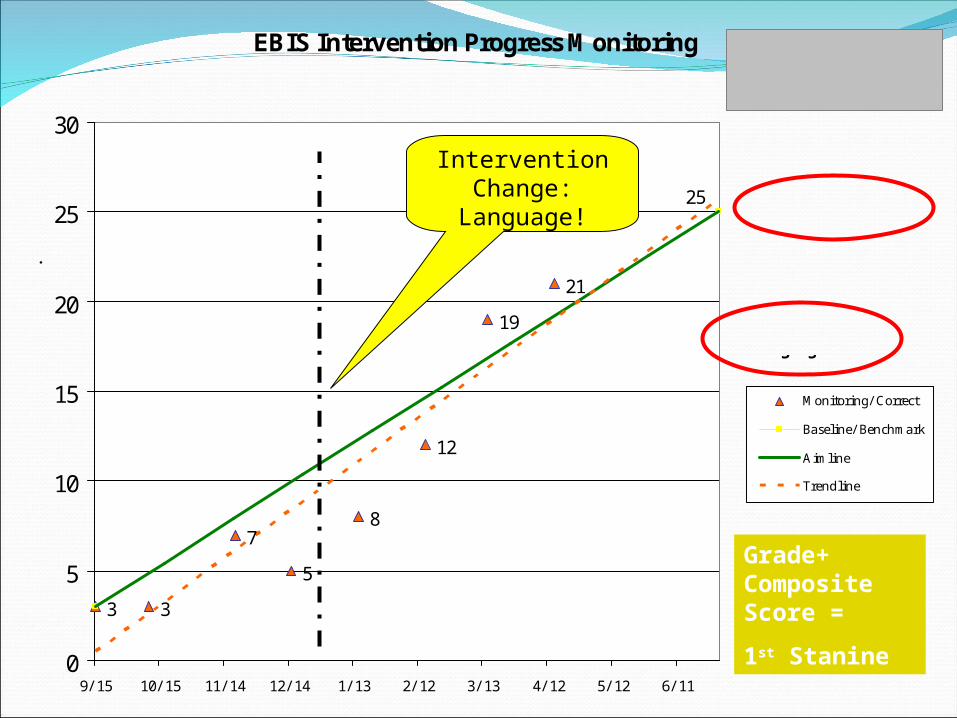
EBIS Intervention Progress Monitoring
3 3
7
5
8
12
19
21
25
0
5
10
15
20
25
30
9/ 15 10/ 15 11/ 14 12/ 14 1/ 13 2/ 12 3/ 13 4/ 12 5/ 12 6/ 11
Monitoring/ Correct
Baseline/ Benchmark
Aimline
Trendline
Grade: 8
Probe Name: MAZE Karen Twain
Teacher Name: Lolich
School: The School of Dan
Cor
rect
Wor
ds/
Min
.
Intervention: Language D
Intervention Change:
Language!
Grade+ Composite Score =
1st Stanine

Grade Level(s) Universal Screening Tools Core Program Second Tier Interventions Third Tier Interventions
K-1 First Step To Success Behavior ScreenerPhoneme Segmentation FluencyOffice Discipline ReferralsAttendance ReportsSuspension/Expulsion Data
School Rules & Behavior Expectations Are Explicitly Taught to ALL StudentsAll Students Regularly & Consistently Acknowledged for Demonstrating Behavior ExpectationsAll Students Immediately & Reliably Corrected When Behavior Expectations Are Not Demonstrated. Positive Behavior Expectation Re-taught & Reinforced ImmediatelySchool-wide Social/Emotional Curriculum Delivery (e.g., Second Steps, Steps to Respect, Too Good for Drugs/Violence, etc.)
Re-Teach ExpectationsCheck & Connect ProgramsHUG ProgramAdult MentoringSkills GroupsBehavior ContractsTargeted Social/Emotional Curriculum Follow-up (e.g., Second Steps with Small Group of Struggling Students)
Core + Second Tier and… First Step To Success Functional Behavior Assessment & Individual Behavior Support PlansIndividualized Behavior Goals and Progress Monitoring (IEP & 504)
2-12 Office Discipline ReferralsAttendance ReportsSuspension/Expulsion DataOregon Healthy Teens SurveySocial Marketing SurveysGrades
Re-Teach ExpectationsCheck & Connect HUG ProgramCheck in/Check outStrategic “Positive Referrals” for Identified Students Working Towards Increased Positive BehaviorAdult MentoringPeer MentoringSkills GroupsBehavior ContractsAdvisory ClassesTargeted Social/Emotional Curriculum Follow-up (e.g., Too Good for Drugs for Struggling Students)Strategic Tutors
Core + Second Tier and… Functional Behavior Assessment & Individual Behavior Support PlansIndividualized Behavior Goals and Progress Monitoring (IEP & 504)
Who does this work?
EBIS / EBS Teams FSTS Staff
EBS Teams & ALL STAFF
Appropriate Staff as Determined by EBIS Teams
Appropriate Staff as Determined by EBIS Teams
TTSD Standard Behavior Protocol

TTSD Standard Behavior ProtocolDecision Rules:Screening
6-12 Office Discipline Referral Data reviewed monthly. If more
than 1 major referral per day per month for every 200 students, revisit the CORE and look for patterns in location, time, grade, type, and frequency of incidents.
K-12 CORE:
If more than 20% of all students received 2 or more referrals: revisit the CORE.
If more than 20% of students are failing, revisit the CORE. If more than 40% of referrals occur in classrooms: re-
teach classroom expectations, increase professional development in classroom management strategies, and/or revisit CORE instruction in specific classrooms.
If more than 30% of referrals occur in a specific area of the school: re-teach specific common area behavior expectations, acknowledge/reward positive behavior, & correct inappropriate behavior immediately.
Behavior Decision Rules, Continued Strategic:
If more than 2 referrals in a 30-day period, meet with parents and develop a plan. If more than 5 absences in a 30-day period: instigate communication strategies with
families and EBIS team reviews other data to determine appropriate interventions. If a student has 2 or more F’s or a GPA of <1.4 during any quarter, provide
intervention. If more than 5 referrals, complete an FBA and individualize your interventions.
Progress monitoring:
K/1: 1x/week PSF & Behavior Intervention Data. K-12: Behavior data from Check and Connect program, referrals, grades and
attendance K-12: Progress on individual behavior goals or Behavior Support Plan.
Intensifying intervention:
If progress is below the expected rate after 4 to 6 weeks of Second Tier Intervention, students move to Third Tier Interventions (consider performing a Functional Behavior Assessment and developing a Behavior Support Plan).
Students receiving 6 or more behavior referrals during the school year - perform an appropriate Functional Behavior Assessment & develop a Behavior Support Plan.

Donald participates in the general curriculum
Effective Support Team reviews achievement and behavioral
data (school wide) and places Donald in group interventionDonald isn’t
doing well
Donaldimproves
Donaldimproves
Effective Support Team conducts
Individual Problem Solving
Resumesgeneralprogram
Donalddoesn’t
improve
Donalddoesn’t
improve
Special Education referral is initiated
Donald probably recycles
Donald may recycle
Intervention is intense and LD is suspected
Improvement is good and other
factors are suspected as
cause
Evaluation planning meeting, Procedural safeguards provided,
consent obtained, 60 school day timeline starts

LANGUAGE A
LANGUAGE C
SOAR T
O S
UCCESS
SIM
STRATEGIE
S
ALL P
ROGRAM
S EXCPECTED GAIN
TTSD AVERAGE STUDENT GAIN
3.7
3.13.8
5.2
4
2 22
22
0
1
2
3
4
5
6
EXCPECTEDGAIN
TTSD AVERAGESTUDENT GAIN
Growth Measured Over 20 Weeks of Instructional Time
Median Reading Comprehension Gain vs. Expected Gain for
Students In Secondary Literacy Programs - By Curriculum
December 2006 Through May 2007 - Students w/ 3 or more scores only
Expected Growth Rate for Students Below the 25th Percentile is .1
Words Per Week

6th Grade Average RIT Gains on the OSAT Reading Test - 2006-07 Secondary Literacy Initiative
5.255.43
2.93
3.84
0
1
2
3
4
5
6
Secondary LitStudents - 6th Grade
ALL TTSD - 6th Grade All Mim DNM - 6thGrade
All MiM - 6th Grade
RIT
Gai
n
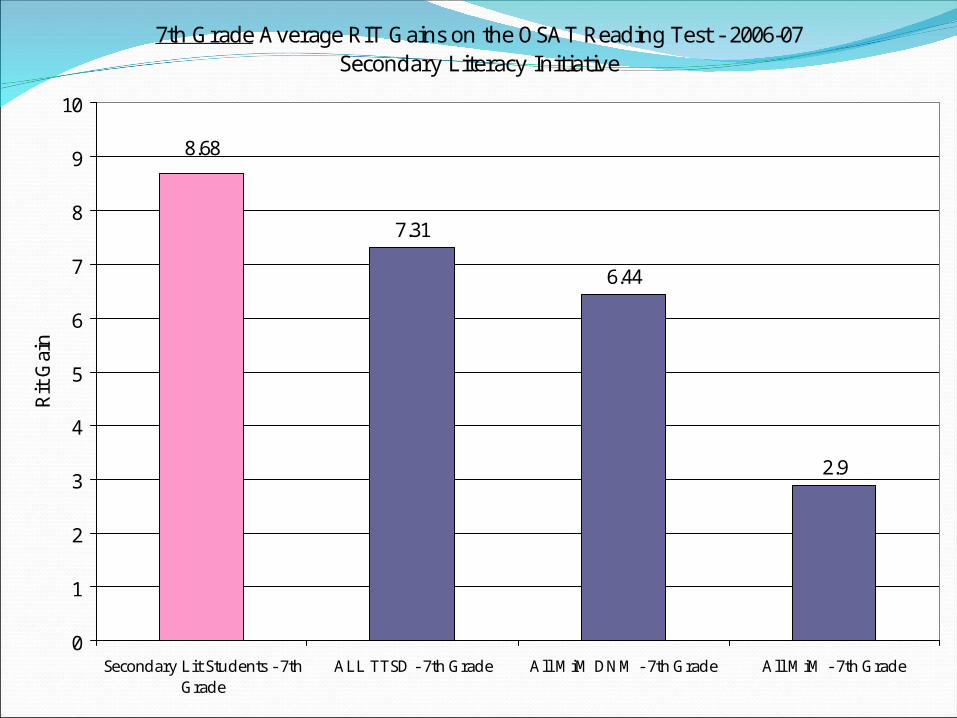
7th Grade Average RIT Gains on the OSAT Reading Test - 2006-07 Secondary Literacy Initiative
7.31
6.44
2.9
8.68
0
1
2
3
4
5
6
7
8
9
10
Secondary Lit Students - 7thGrade
ALL TTSD - 7th Grade All MiM DNM - 7th Grade All MiM - 7th Grade
Rit
Gai
n

8th Grade Average RIT Gains on the OSAT Reading Test - 2006-07 Secondary Literacy Initiative
6.02
5.33
1.93
3.8
0
1
2
3
4
5
6
7
Secondary LitStudents - 8th Grade
ALL TTSD - 8th Grade All MiM DNM - 8thGrade
All MiM - 8th Grade
Rit
Gai
n

Percent of 10th Grade Students Meeting and Exceeding Oregon State Benchmarks*
65%
71%
74%73%
75%
66%
60%
62%
64%
66%
68%
70%
72%
74%
76%
2002-03 2003-04 2004-05 2005-06 2006-07 2007-08
*Adjusted to 2006-07 Revised Performance Standards

For more information:www.nclack.k12.or.us/
Schools.Services/rti/index.htmwww.ttsd.k12.or.us/orrti