Embed Size (px)
Citation preview
Increasing WDC Contributions by Working Women: What WDC Eligible Workers say about Participation and
Contribution Decisions
Karen Holden, University of Wisconsin-Madison
Sara Kock, University of Wisconsin-Madison
Center for Financial Security Working Paper 2012-10.1
October 2012
An index to the Center for Financial Security’s
Working Paper Series is available at:
http://www.cfs.wisc.edu/publications-papers.htm cfs.wisc.edu
1
10/17/2012
Increasing WDC Contributions by Working Women:
What WDC Eligible Workers say about Participation and Contribution
Decisions.
Karen Holden
Emeritus Professor of Consumer Science and Public Affairs
School of Human Ecology
University of WisconsinMadison
Sara Kock
Center for Financial Security
University of WisconsinMadison
Center for Financial Security
School of Human Ecology
1300 Linden Drive
Madison, WI 53706
http://cfs.wisc.edu
The research reported herein was performed pursuant to a grant from the U.S. Social Security
Administration (SSA) funded as part of the Financial Literacy Research Consortium. The
opinions and conclusions expressed are solely those of the authors and do not represent the
opinions or policy of SSA, any agency of the Federal Government or the State of Wisconsin, or
the Center for Financial Security at the University of Wisconsin-Madison.
DRAFT paper. Please do not quote without permission of the authors.
2
Introduction
This paper is the third report in our study of the influences affecting participation and
contribution decisions of individuals eligible to participate in the Wisconsin Deferred
Compensation (WDC) program. This analysis is intended to complement both the quantitative
analysis in Holden and Kock (2012), based on administrative and survey data, and the focus
group discussions reported in Holden and Kock (2011). In the 2012 paper, we documented
account balances lower contributions made by women, even when taking account of earnings
and demographic characteristics. While other literature convincingly argues that women have
lower retirement savings than do men because of different types of benefits offered in jobs they
hold and the lower salaries of women, our results show that women have lower WDC savings
even when they are in jobs with identical benefits and have comparable earnings. It appears that
something different is occurring when women and men are faced with WDC-related decisions.
The focus groups of female WDC account holders, suggested some reasons that may make
women delay their participating in WDC beyond the date of first eligibility and lead to more
conservative investment decisions. Here we tap their responses to survey questions about the
“why” of their decisions to explore whether there are differences between the decision making
process of men and women that could be addressed by WDC.
Data
We refer readers to Holden and Kock (2012) for a fuller description of the WDC program
and the full data collection efforts undertaken. The data for this paper come from the mail
survey sent to a randomly selected sample of 2,000 individuals who were Wisconsin state
workers and WDC participants, drawn from the WDC administrative data and to a sample of
1,000 Wisconsin state workers who are eligible to but were neither in the administrative files of
3
participants not currently participating as indicated in ETF records from which the sample was
drawn. We received useable responses from 1,280 individuals, for an overall response rate of 43
percent. Not surprisingly, the response was somewhat higher from those who had WDC
accounts at 47 percent than those who were not account holders at 40 percent. The questions that
form the core of this paper were what we would label “subjective” questions designed to
ascertain the influences on WDC-account related decisions and opinions about the program.
The analysis sample in this paper excludes respondents who were at the time of the
survey over 65 years of age or younger than 25 at the time of the survey (i.e., born before 1946
and after 1987). We also trimmed a very few who made very large contributions to WDC in
2010 and those who reported themselves no longer working for the state of Wisconsin for
reasons other than retirement.1
Themes.
We structure our discussion in this paper around the same themes that were raised through the
focus group structured questions and which are described in Holden and Kock (2011). The
common themes reflect our purposeful development of survey questions that paralleled focus
1 Some exclusions are consistent with Holden and Kock (2012) analytical sample. The handful
of high contributors reported contributions of $130,000 or more in 2010. These are likely to
include roll-overs, which we cannot distinguish from annual contributions. These few would
potentially skew results without providing added insight into contribution decisions. For the
present paper we include WDC participants and nonparticipants, but exclude those not working
for reasons other than retirement. After the age and contribution trimming, this eliminated 37
respondents.
4
group discussion. One of the intents of the focus groups was to understand what issues were
relevant for further examination through the larger and more representative survey sample.
Although the survey allowed us to ask a wider range of questions, the questions do not always
reflect the richness and nuances that arose as focus group members discussed the details of their
WDC choices. We include some of those insights in this paper, but readers are urged to read the
full report on focus groups in Holden and Kock (2011).
The survey findings are laid out in the following order:
Account holders
o Reasons for delayed enrollment and nonparticipation
o Motivators for participation
o Influencing agents on enrollment decisions
Decisions of account holders
o Influences on account-related decisions
o Frequency of cessation, catchup, and account withdrawals
o Reaction to budge bill increases in benefit costs
WDC program strengths and weaknesses
o Publications
o Website
o Satisfaction with WDC
Survey sample:
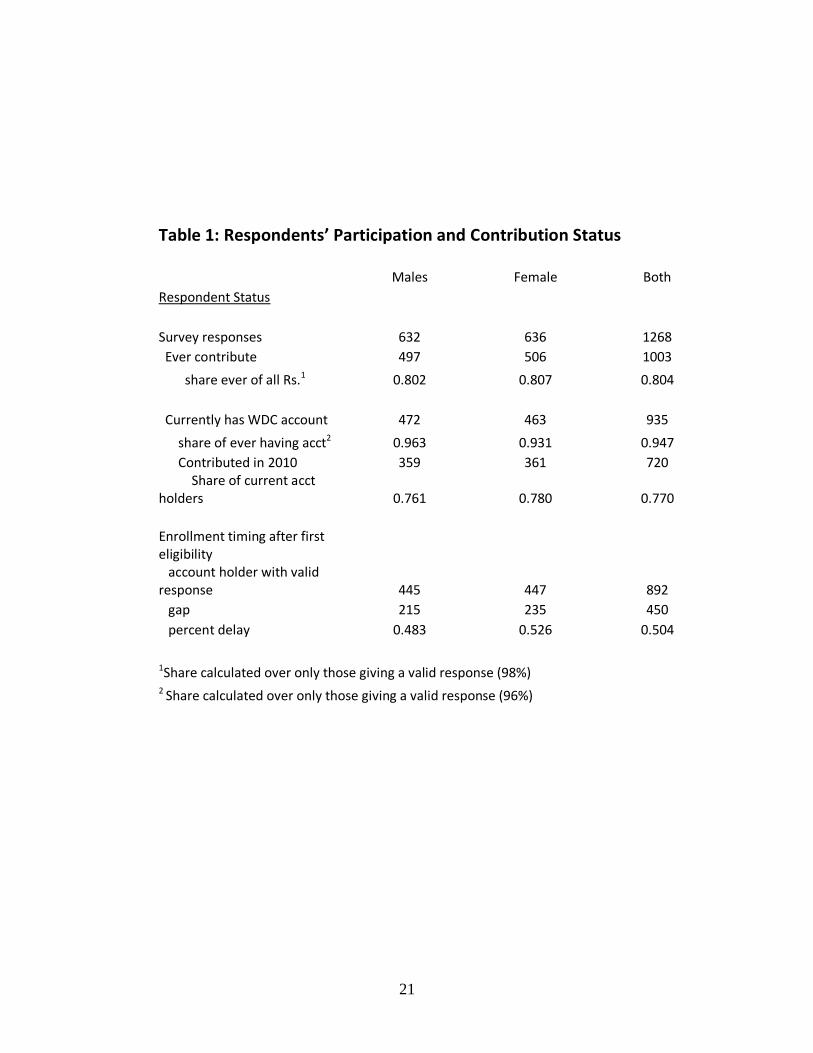
Table 1 shows the number of in our sample by gender and WDC participation status. The
rate in the third row should not be taken as a WDC “participation rate,” since the sample
selection was random but with a target sample number of participants and nonparticipants rather
5
than a percentage of all WDC eligibles in each group. For all items we calculate rates over only
respondents with valid answers; generally there were missing or otherwise invalid answers from
about 2-4 percent of potential respondents to most questions. We have no way to impute
participation status when it was not reported nor to confirm the accuracy of individual responses
about accounts against administrative information. Although the survey sample was drawn from
WDC administrative data of known account holders and from ETF records for individuals who
did not have WDC contributions drawn from their Wisconsin state job earnings, administrative
and survey data could not be linked to confirm report accuracy for confidentiality reasons.2 Thus
we depend on respondents’ self-reports on their account status. 3
2 Strict IRB conditions do not permit us to calculate differential response rates by individual
characteristics. By WI state law WRS data cannot be shared externally, including with UW
researchers, unless it is for the direct benefit of the system. Thus our research plan had to
conform to the IRB requirement that our analysis have clearly stated WRS benefit outcomes.
For this reason we, unfortunately, were not able to link survey and administrative data.
3 We cannot estimate the probability of participation among eligibles since we asked that a
sample of nonparticipants be drawn which matched on characteristics to a sample of WDC
participants. We do not have information on the total eligible to participate or the full population
of nonparticipants from which the sample was drawn. Thus these rates only show the
distribution of survey respondents by participation status; we use them to confirm the accuracy
of responses to a key sampling criterion We provide some estimates from grouped data of
participation rates in Holden and Kock (2012) which suggest no difference in that proability for
women and men eligible state workers.
6
[Table 1 about here]
The first panel of Table 1 reports the percentage of all respondents who said they had
ever contributed to WDC. Most of currently have an account, although only about three-quarters
contributed to those accounts in 2010, the year of our participating sample frame. This is
roughly consistent with the percentage of participants who reported being retired and, therefore,
could not have contributions deducted from earnings.
A key purpose of the study is to ascertain why individuals do not participate in WDC or
why they may have delayed enrolling when first eligible and to examine whether these reasons
may be different for men and women workers. We asked participants who delayed more than
one year after first eligibility why they did so and nonparticipants about their reasons for never
participating.4 There was no significant difference (at the p< .1 level) between female and male
account holders in the probability of their delaying participation beyond the first year of
eligibility. About 50 percent of both women and men who eventually became WDC contributors
did so during their first year of eligibility.5 The median delay for those who did not contribute
during their first year of eligibility was between 3 and 4 years, with women being somewhat
slower than were men to enroll during the first five years of eligibility. Because of this slower
participation by women in the first five years of eligibility, the mean delay for women (of 8.1
4 Persons who had been hired before WDC was an option (i.e., prior to 1983) were asked about
the delay beyond the first year they became eligible.
5 This delay refers to a twelve month period. Thus, what could be labeled “on time” enrollees
could have made that decision within twelve months after first eligibility.
7
years) was significantly (at the .05 level) longer than for males who delayed (at 6.8 years).6
Reasons for delays and nonparticipation are one major topic of this report.
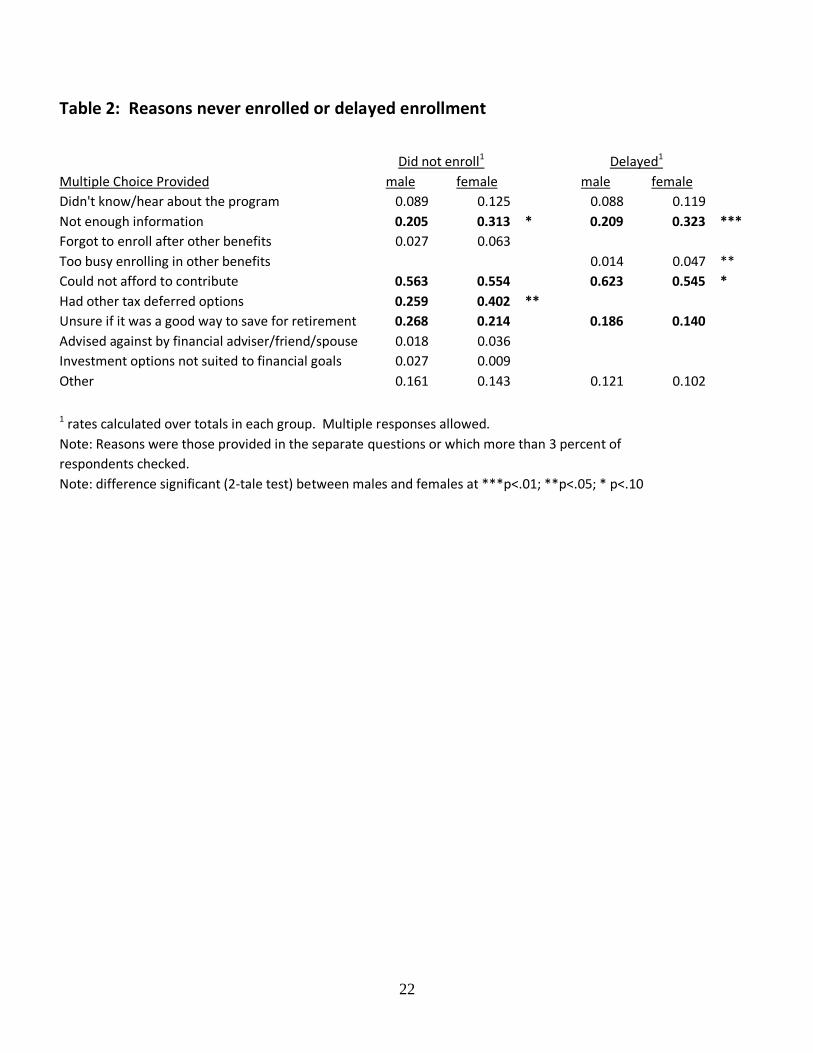
Reasons for delay and influences on enrollment
Table 2 shows the responses to questions on reasons for delay and nonparticipation.
Responses for both groups are shown in this table because we provided comparable check
options on the survey and the responses for the two groups present a common issue in making
the enrollment decision—the lack of program information and sufficient funds. While some
were advised against enrolling or had other tax deferred options available, not enrolling when
eligible was for most respondents linked to those two reasons. Note that respondents were
allowed to check as many reasons as applied.7 However, the large majority of respondents
checked only one or two reasons, which suggests the importance of information and
affordability. Indeed one could venture that information is key even to the affordability issue
since there is no minimum contribution required by WDC. Thus, the inability to afford savings
may be an informational issue as well. That women were more likely to have other tax deferred
savings options is likely associated with the savings options faced by their working husbands.
[Table 2 about here]
6 By year four of eligibility 42 percent of delayed participants had enrolled compared to 38
percent of females. By year five those percentages were 55 and 52, respectively. In subsequent
years a slightly higher percentage of females had enrolled than males. However, a delay in
contributions of only a year or two can make a difference to retirement accounts at the time of
retirement.
7 They were not asked the relative importance of each reason.
8
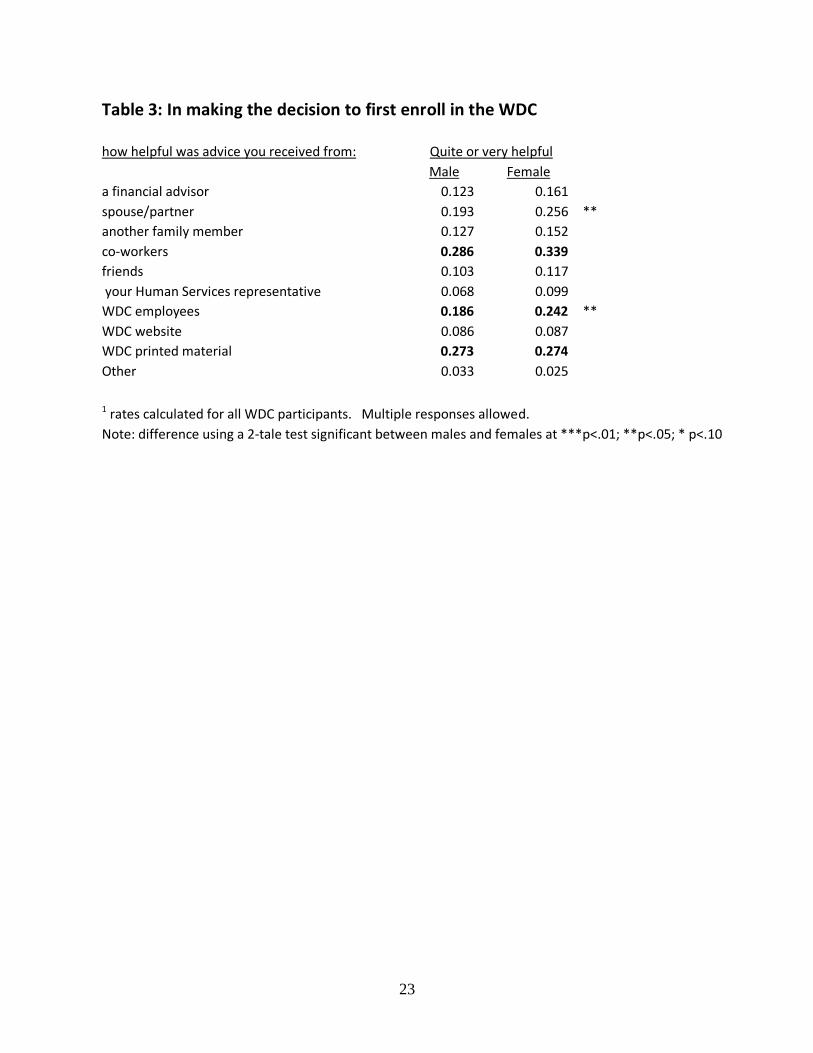
We asked all WDC participants the degree to which specific individuals, institutions, and
program material influenced their decision to enroll. Options we presented in the survey
reflected what we’d learned from the focus group discussions, most important being the
inclusion of the “co-worker” option, separate from other informal groups (e.g., friends) and from
fellow workers whose responsibility is to advise on benefit options. Respondents were asked to
rate the importance of several potential influencers on their decision to enroll. Table 3 shows the
number and percent of relevant respondents who indicated “quite” or “a lot” of influence of each
option provided. Again, most individuals indicated only one as having this large an influence,
other reasons having only some or less influence. What is most striking is the consistency with
focus group discussions that indicated the importance of co-workers in the initial enrollment
decision. Over one-quarter of those who enrolled were primarily influenced by co-workers.
Indeed the influence of informal sources—friends, family, co-workers—was at least as
influential as were formal WDC sources at this decision point. It is also interesting that, for
these participants, WDC representatives and printed WDC material were far more important than
was on-line information or Human Resource personnel, the latter playing an important role for
only a small percentage of enrollees. Enrollment by individuals seems dependent on direct
contact in person or through printed material with WDC itself.
[Table 3 about here]
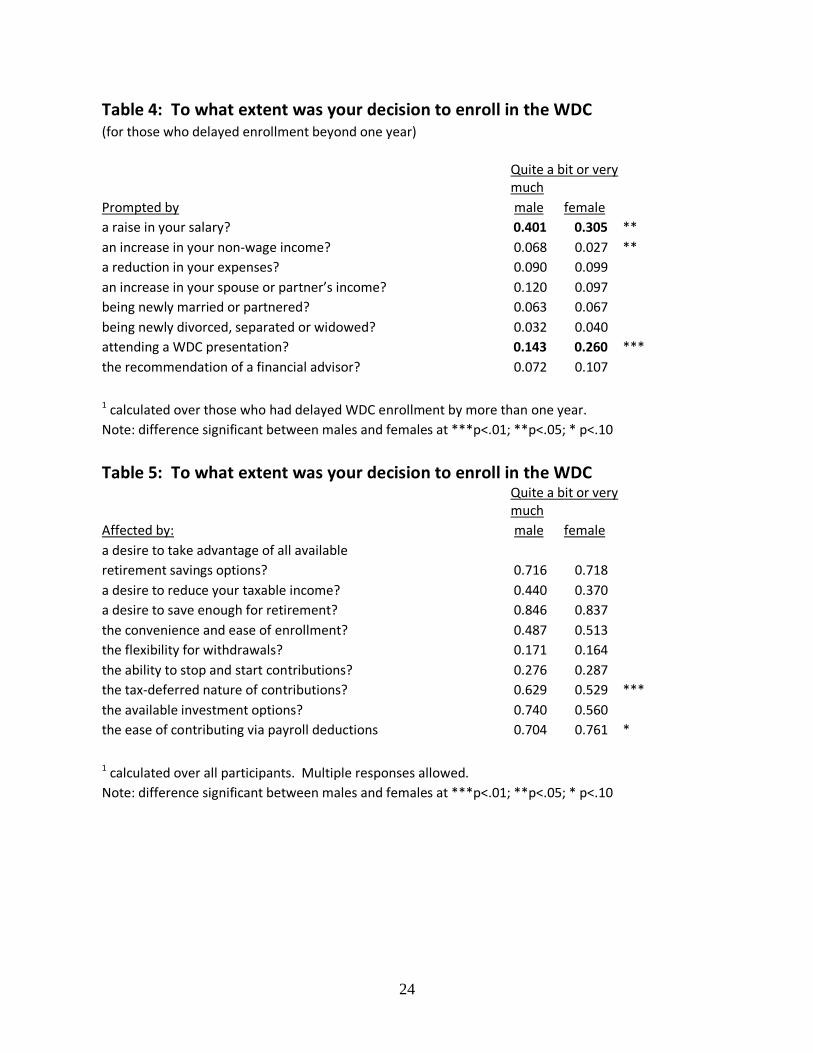
We asked survey respondents about the reasons they enrolled in WDC. In Table 4, we
show what prompted those who delayed retirement to eventually enroll. The message of this
table is the “teachable moment” that is presented by salary raises. This is consistent with the
reasons given by focus group members and a logical reason for deciding to participate when the
initial decision was not to do so immediately. At the same time it points out the importance of
9
WDC program personnel understanding key moments for influencing participation while also
educating about the ability to contribute very modest amounts when first eligible. The latter may
become even more important to participation as salary increases become less likely for public
workers as public budgets become more constraining. While salary increases are less often
given in the current budget environment, individuals may still receive modest increases as they
advance through professional ranks. Again, WDC presentations play an important role in
motivating WDC enrollment.
[Table 4 and 5 about here]
Table 5 shows the percentage of all WDC participants who indicated the importance to
their enrolling of key programmatic aspects. To this question, respondents indicated on average
4-5 reasons being important to their decision. Not surprising retirement savings were the
primary motivation for the vast majority with the ease of enrollment and contributing cited by a
majority. On the other hand, only about half indicated the tax deferred aspect as being that
important. We quote from one of the focus groups to emphasize the importance of this
information to participants on the advantages of savings for retirement through a tax deferred
account.
And it really didn’t hurt as much as you thought it would. Because of the tax deferred it
didn’t feel like that much money. And it really wasn’t that much money.
All participants probably understand that the income contributed to WDC is not immediately
taxed, but, because they could be saving for retirement in taxable accounts with flexible
withdrawal rules, the tax-deferred status should be a major factor for all participants. Together
with the number of nonparticipants and delayed participants who were initially not sure about the
benefits of saving through WDC, this suggests an area for improved education.

10
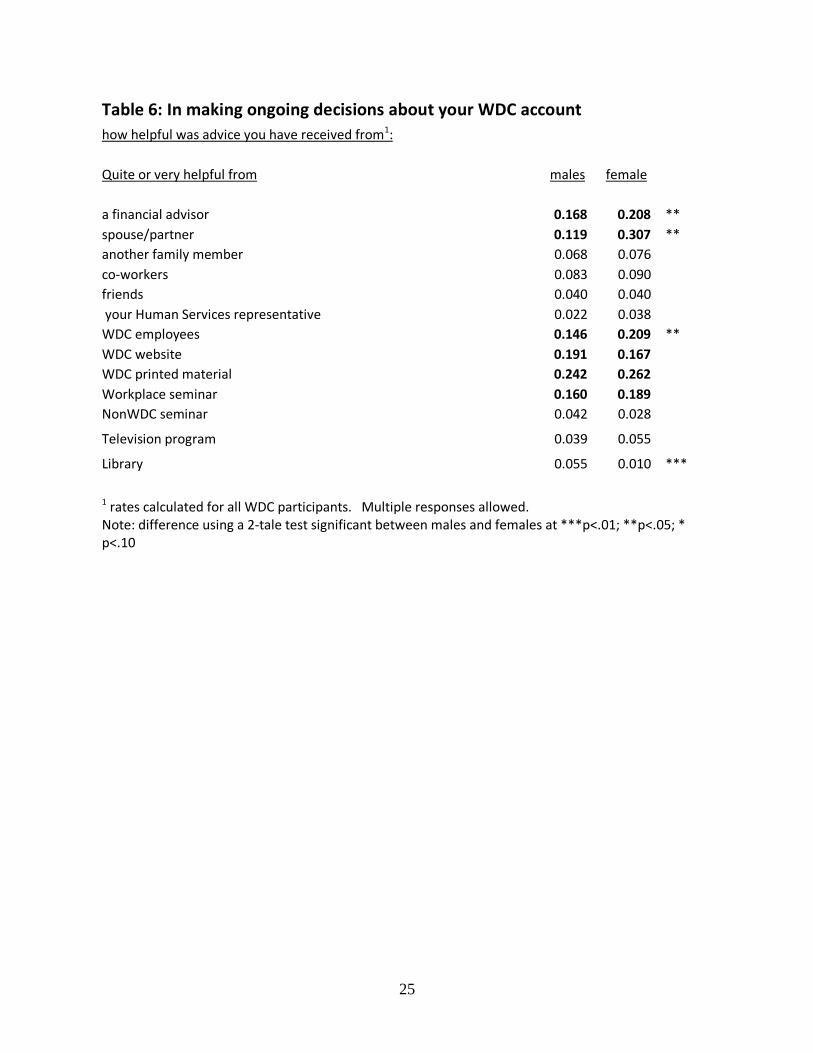
Decision making as account holders.
As in the focus groups, we asked who influenced survey respondents’ decisions as on-
going WDC account holders (Table 6). In contrast to the focus groups’ discussion of the
continued influence of co-workers, the responses to the survey indicate that co-workers’
influence was not large after the initial enrollment decision. This discrepancy between the
implication of the focus group discussion and these survey results may be because once co-
workers’ influence was shared in the focus group discussion, it would have been difficult (or
simply neglected) to describe their lesser subsequent influence. It could also be that after initial
enrollment, account holders use co-workers, friends, and family as part of the information
gathering process, with final decisions being made based on more formal, authoritative sources,
including WDC and financial advisors, thus lessening the importance of informal sources on
these ongoing WDC decisions. For these ongoing decision, use of the WDC website is more
influential, although participants still are more likely to depend on printed material and WDC
employees, presumably in face-to-face sessions. We note that while multiple factors could have
been assessed as having a large influence on these decisions, most respondents ranked only one
at the top of the influence scale. There were no notable differences between women and men
with the exception of the somewhat greater use by women of advice from WDC employees and
from their spouses.
[Table 6 about here]
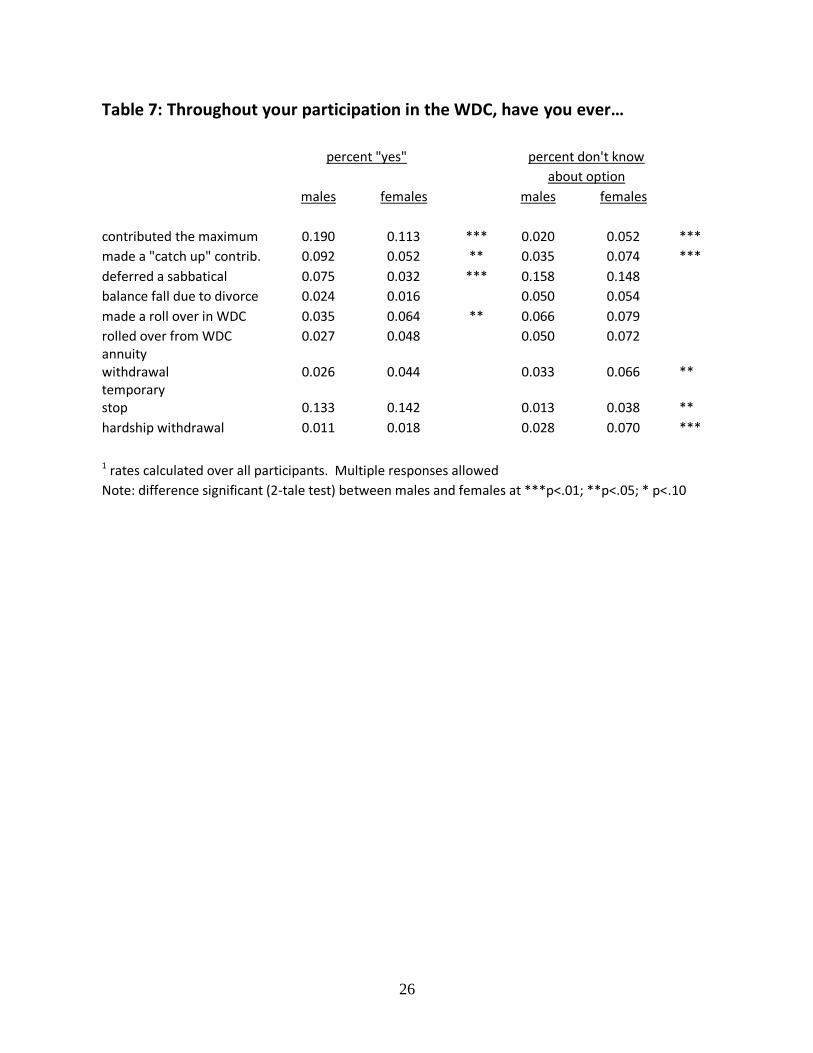
We explored two types of decisions that could have been made by account holders and
the difference between men and women. These are (1) whether they made additional
contributions or withdrawals as allowed prior to retirement and (2) changes in contribution and
retirement expectations as a consequence of the budget bill introduced quite unexpectedly in
11
early 2012 by newly installed Governor Walker. Table 7 shows various actions that were
presented to respondents, asking if they had taken such action at any time with the option of
indicating they did not know about that possibility. Some of these could boost WDC accounts,
while others could reduce the accumulation. Only a small percentage have had accounts
increased (or decreased) for any of these reasons, including by making the maximum allowed
contribution. The lower probability of women taking advantage of these account-boosting
options and the larger percentage indicating they did not know of these provisions is instructive,
duplicating findings in our quantitative analysis.
[Table 7 about here]
Our analysis in Holden and Kock (2012) documented the lesser probability of women
contributing either the maximum allowed or catch up amounts, even when controlling for other
characteristics. These mean measures duplicate those findings. The greater likelihood of women
rolling prior tax deferred account accumulations into WDC may reflect both women’s greater job
mobility and efforts to recruit women in the top positions in government agencies. However,
that women are consistently more likely not to know about these specific program features is
instructive for WDC outreach policies that would aim to ensure equal savings opportunities for
women and men.
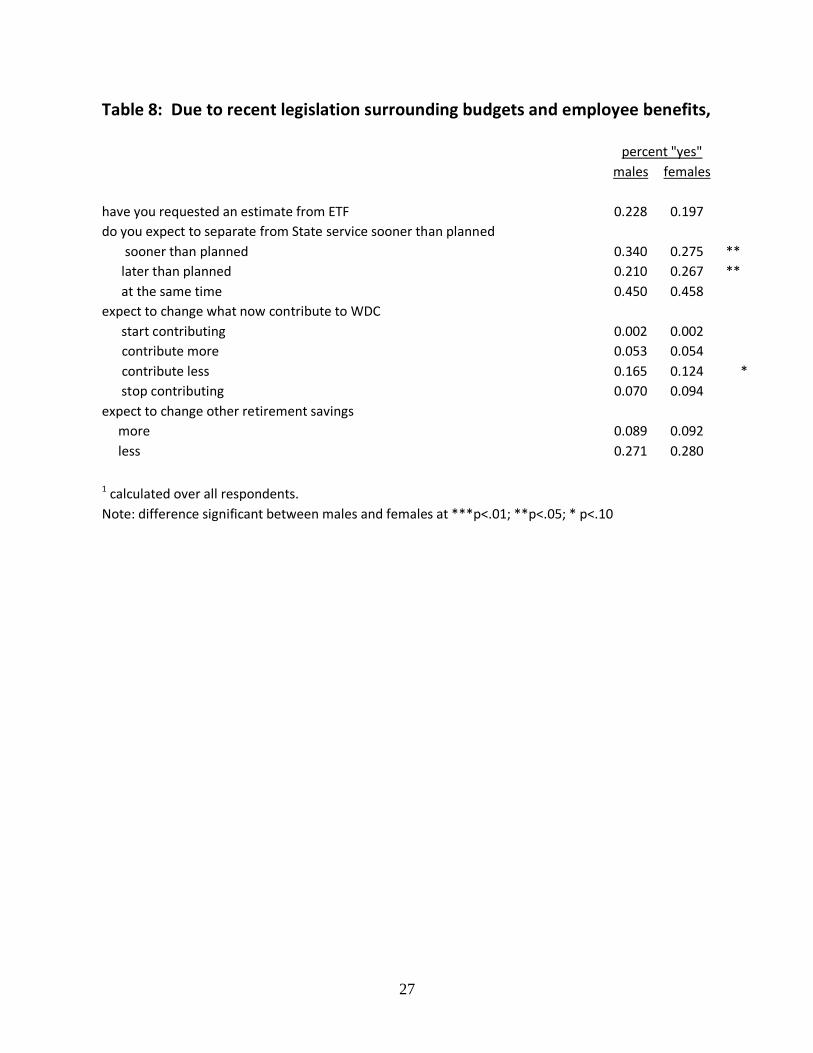
[Table 8 about here]
Table 8 lays out how respondents’ savings and retirement plans changed as a
consequence of the then-anticipated enactment of the budget bill that would change both union
bargaining rights and mandated increases in the employee share of premiums paid for both the
12
Wisconsin state retirement pension and for health care coverage. 8
About 20 percent of
respondents requested retirement estimates as a consequence of the proposed change with an
even higher percentage of men and women expecting to leave Wisconsin state employment
earlier than they had planned. However, some also expected to remain longer in their job.
Interestingly, while there was no difference in the percentage of women and men whose
expected separation age remained the same, women were significantly more likely to delay
separation and less likely to accelerate than were men. They were somewhat less likely to
contribute a smaller amount to their WDC accounts, although the percentage difference was
small. All other behaviors were not different for women and men, but for both men and women
changes were more likely in the direction of smaller retirement account accumulations, including
through WDC contributions.
8 The survey was distributed in April and May of 2011. In January of that year, Governor
Walker had proposed removing collective bargaining rights for virtually all public workers in
Wisconsin, requiring state workers to pay at least 12.6 percent of their health care costs, and
mandating Wisconsin state workers to pay 50 percent of their pension contributions (Office of
the Governor Scott Walker 2011). These changes were estimated to result in take-home wage
reductions of 11.8 percent on average. These proposals became law, and Wisconsin state
workers first saw their take-home wages reduced in August 2011. Publicity and demonstrations
early in the year meant it was likely that survey respondents had considered the implications of
these changes for their retirement savings and timing. A mandated study of the Wisconsin
Retirement System added to worker concerns about possible benefit changes.
13
Financial knowledge and confidence:
One responsibility of a retirement benefit program is to educate individuals not only
about the specific details of the program, but also how participation may enhance personal
financial goals. A program may simply assume basic financial knowledge and accept the
decisions individuals make or seek to improve the knowledge that is required to make sound
financial decisions. The focus group discussions revealed a range in the perceived competence
of WDC participants in making important financial decisions, with a call for more financial
education, specifically for women.9 For this reason, we attempted to discover through the survey
how confident women and men were with the level of their financial knowledge and practices.
In addition, we examined whether account holders and non-account holders were different in
their self-assessed financial knowledge. Differences between these groups are only correlation
because we cannot determine whether a difference in financial knowledge leads to different
decisions about WDC participation by men and women or whether WDC participation influences
financial knowledge. Regardless of what the causal relationship might be, however, differences
between women and men and between WDC participants and nonparticipants in financial
knowledge may be instructive to WDC outreach efforts.
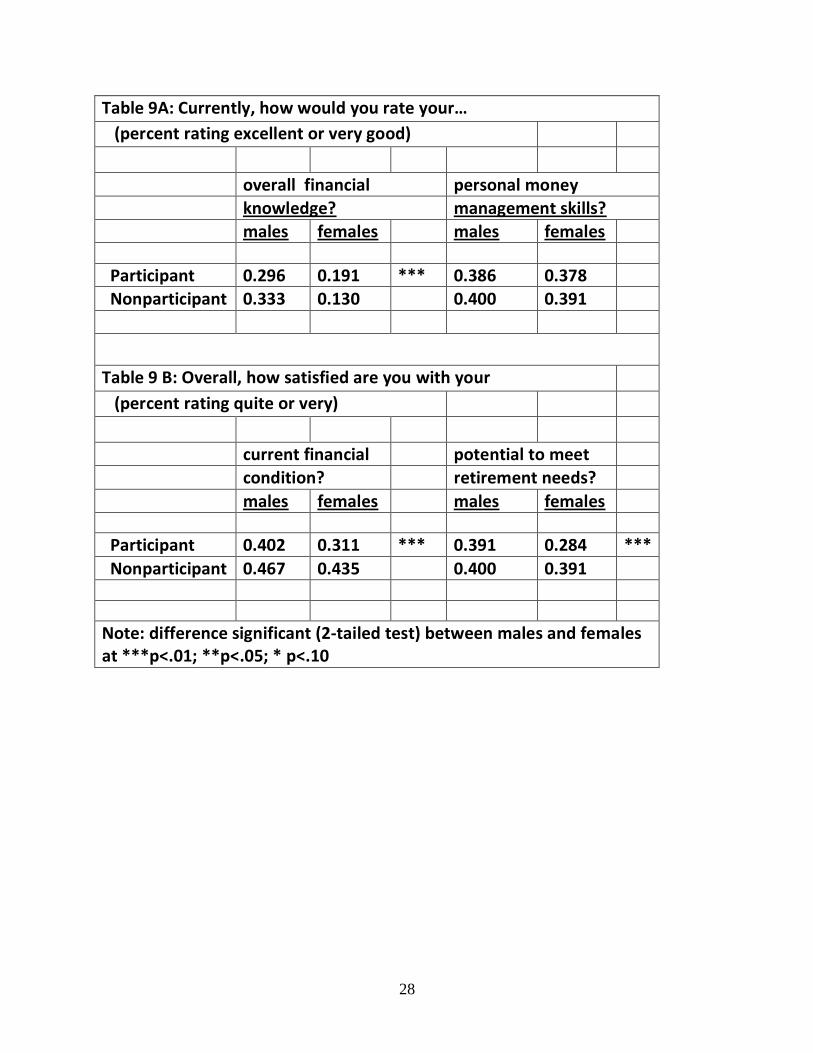
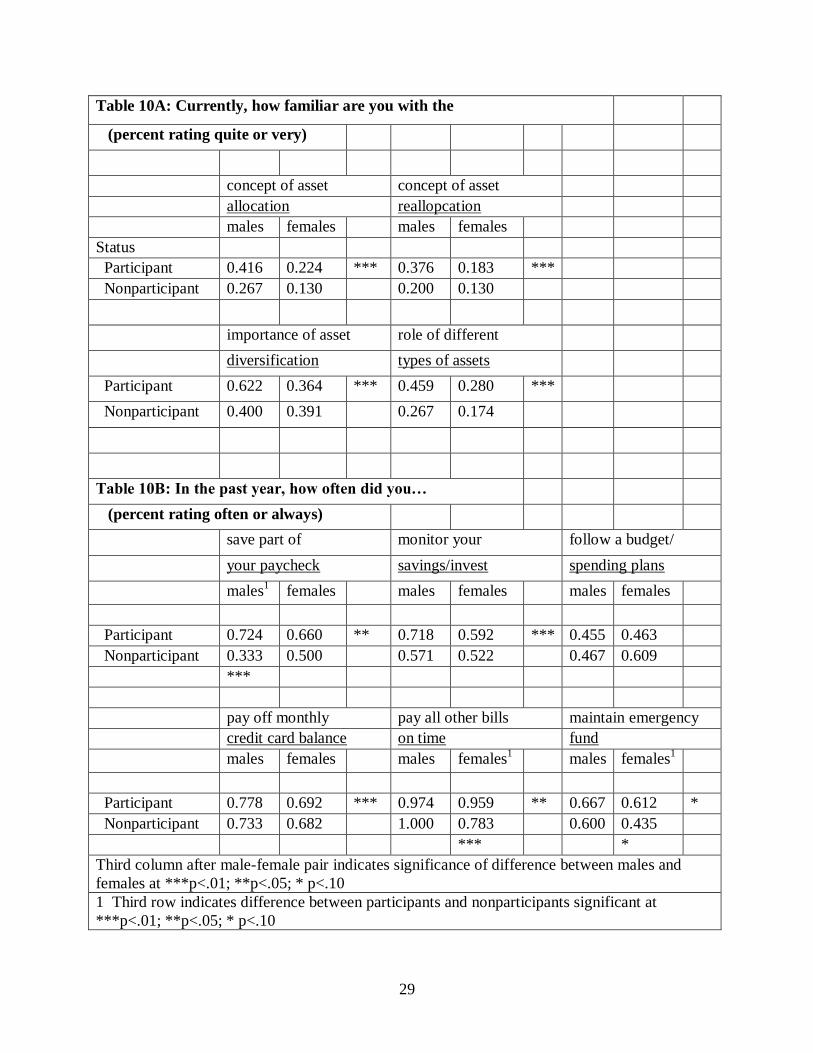
Tables 9A and 9B show the percentage of women and men who ranked themselves at the
top of scale (the top two categories) in felt financial competence and well-being. Tables 10A and
9 Focus groups were only of women, so we don’t know whether the same call for more financial
education would have been made by men. However, women in the focus groups did feel that
there was a greater need for financial education for women than for men, a sentiment that may
have partly arisen from their own experience and observations.
14
10B show the percentage who similarly ranked themselves high in familiarity with financial
concepts and in the frequency with which they followed basic financial practices. What is
notable in these two sets of tables is the consistently lower percentages of women who rank
themselves as financially knowledgeable, financially secure, and familiar with basic financial
concepts. Women followed basic financial practices as often as did men—they followed a
budget and virtually all paid bills on time. However, they appear to be less facile, perhaps less
comfortable, in savings-related behavior. Of concern to WDC should be the lower probability of
women tracking their savings accounts and lower familiarity with financial concepts even as they
express less confidence about the adequacy of their savings to meet future retirement needs. One
could speculate that women have lower retirement savings because of perceived lower retirement
needs. However, these results are not consistent with that being the case.
[Tables 9 and 10 about here]
Opinions about WDC services and options:
WDC provides retirement savings options to eligible Wisconsin public workers and
through newsletters, web-site information, and WDC staff seeks to educate workers on how the
program operates. The focus groups indicated a generally high regard for WDC services, and
this is borne out in the responses to survey questions about satisfaction with access to
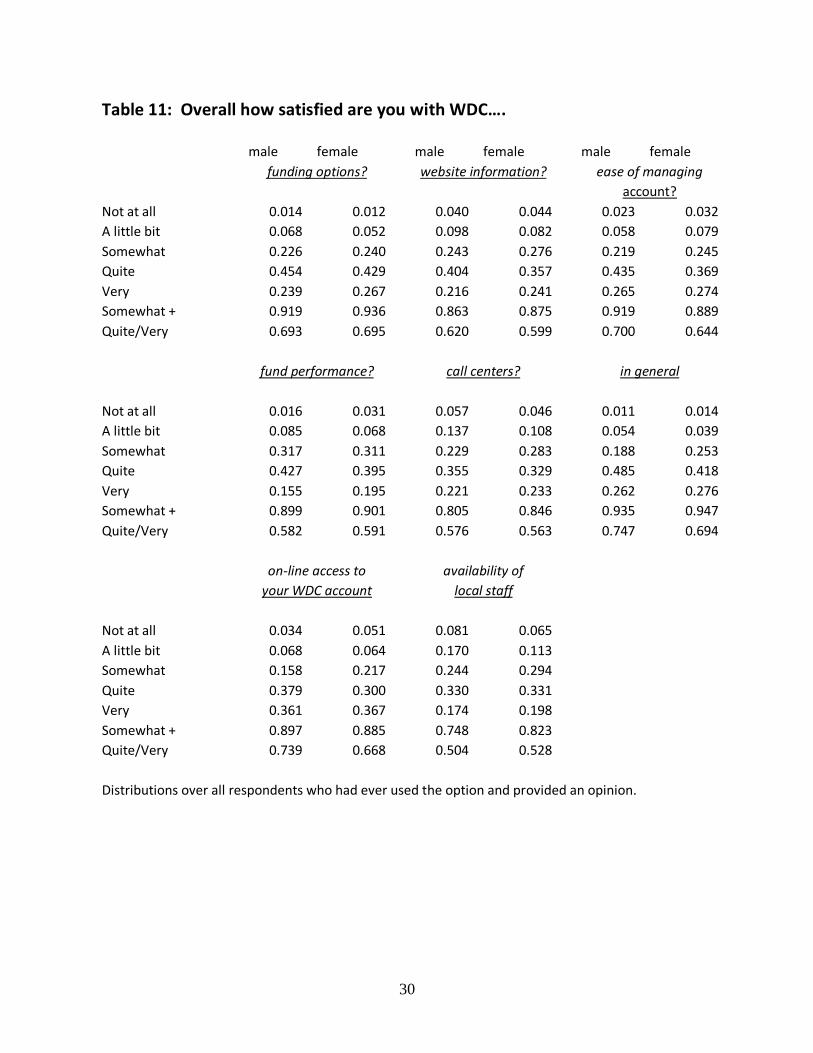
information and with investment options and access. Table 11 shows the distribution of
responses across the possible response categories to the question of “Overall, how satisfied are
you with ….” several program attributes. The last two rows are the total of responses in the top
three and top two satisfaction categories, respectively.
[Table 11 about here]
15
What is rather remarkable is the high regard of participants for WDC. Only a few are
less that “somewhat” satisfied, and two-thirds are quite or very satisfied. There are no
significant differences in the distribution of women and men across the five opinion categories.
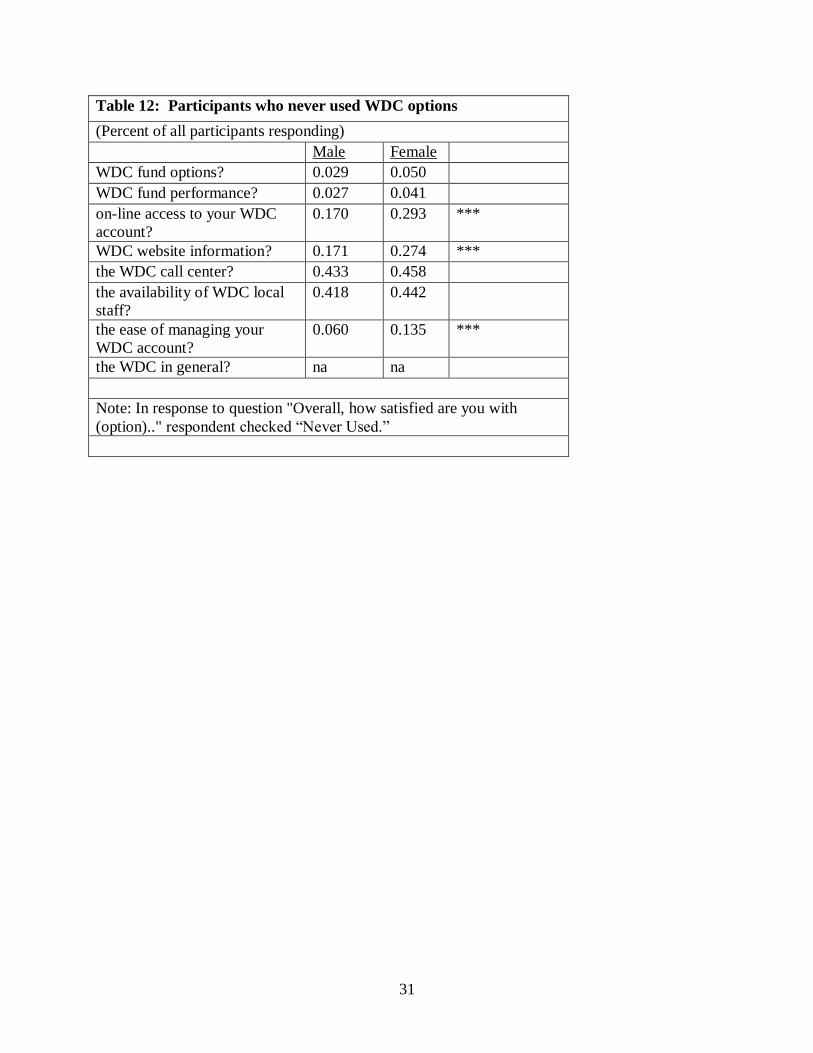
While Table 11 is for only account holders who used these services, Table 12 shows the
percentage of WDC account holders who indicated they had never used the specific service..
Two elements stand out here. First, is the high percentage who never use the call center or WDC
staff, the two services that have the lower approval rates (Table 11). Second, is the female-male
disparity in the use of informational services, with women more likely than are males to have
never used website and online services. This finding is consistent with earlier results on
decision-making influencers, from which we concluded that women are more likely to use face-
face and printed informational sources. Nevertheless, this suggests that women, even as they
express greater worry about retirement security, may be neglecting to access available
information that could educate them about retirement savings in general and WDC in particular.
[Table 12 about here]
Conclusions
Consistent with our focus group and quantitative analysis findings, Wisconsin state
workers who are eligible to participate in WDC are a diverse group with varying degree of
attachment and knowledge about WDC, even among those with accounts. The motivation for
this study was the observed average lower WDC account balances of women and the question of
whether this was driven by factors that could be addressed through WDC educational efforts and
improved access to services. The answer appears to be “yes.” This answer comes from several
key conclusions we draw from the subjective survey data presented in this paper, consistent with
our findings from the quantitative analysis, documenting lower contribution rates even when
16
accounting for salary and other factors, and from focus groups which argued for more financial
education targeted to women. Here we describe the major findings from the subjective
responses, including as appropriate how WDC might take those into account in how they present
informational material and to whom.
Women’s lower account balances do not arise because women have anticipated
retirement needs and thus lower targeted savings levels; women respondents were more
likely to say they are not confident about being able to meet their retirement needs
implying they are more likely not to be meeting retirement savings targets.
The survey was not designed to estimate WDC participation rates, although
administrative data suggest that eligible men and women workers are equally likely to
participate (Holden and Kock, 2012). Thus women state workers are no less likely to
become part of the WDC system than are their male co-workers. It is their decisions as
WDC account holders that appear to lead to lower balances.
A substantial proportion of individuals do not participate when first eligible, and the
proportion who do so is not different for women and men. However, the length of that
delay is longer for women than for men.
Delays and the failure to ever participate in WDC appear to be due in part to lack of
sufficient and persuasive information. The evidence for this is the initial uncertainty on
the part of individuals about WDC being the best way to save for retirement. It may be
that individuals take a while to accumulate the appropriate information, a possibility that
WDC should nevertheless consider in planning how information is provided to relatively
new workers but sometime after their initial eligibility.
17
Delayed participants eventually gather the information necessary to enroll, often being
persuaded by informal sources, including co-workers and often upon receiving a salary
increase. This and other evidence suggest that new employees do not understand the
value of contributing even very small amounts to a tax-deferred retirement account. One
option is for WDC to emphasize that more in its presentations and materials. Another is
to “teach by doing,” that is by enrolling newly hired workers by default. We suggest that
WDC explore the advantages of default participation with opt-out provisions a practice
recently instituted in at least two states—Virginia and South Dakota. A study of South
Dakota’s default enrollment shows substantial increases in participation.10
Not surprising, not being able to afford to participate is a primary reason for both delayed
and WDC nonparticipation. This may seem logical, until one realizes that there is no
minimum WDC contribution required and withdrawal rules are more flexible that are
withdrawal rules for other tax deferred retirement savings. WDC may review the
information provided on the advantages of even small contribution amounts over time.
Consistent with focus group observations, co-workers were key to the participation
decision for many workers. Indeed advice from co-workers was more often ranked as
helpful than any other single information/advice source. In on-going decisions, co-
10 Virginia (see: http://www.fascore.com/PDF/vadcp/457_Automatic_Enrollment_Bulletin.pdf)
and South Dakota have default participation with very modest contribution amounts. For an
evaluation of the effect in South Dakota, see
http://www.retirementmadesimpler.org/Library/RMS_South_Dakota_Study_090810_FINAL.pdf
.
18
workers played much less important a role. WDC may consider how to encourage co-
worker recruitment, perhaps by organizing new worker and current participant
workshops. This builds on the apparent greater importance to the enrollment of women
of WDC workshops than workshops were for men.
WDC printed material and contact with WDC employees were more often ranked as
more important to both initial and on-going decisions than were web resources. Women
workers were significantly more likely to use these “tactile” contacts than use electronic
communications. On the other hand, when asked to assess the usefulness of printed
material, a high proportion of respondents said they never used them. Thus several
aspects of gathering information on WDC are evident: overall eligible workers appear to
use web/online sources rather than printed material. This is consistent with the move in
all benefit plans towards providing information electronically. At the same time, women
are more likely to say they do not access WDC information in this way. This suggests
continuing effort on the part of WDC to facilitate the transition from printed to web-
based resources for both potential and current participants.
WDC participants were most often motivated by salary increases to first participate. This
is reasonable but of concern as salary increases become less likely and less generous
while benefit premiums rise. The reaction of WDC participants to recent benefit
premium increases suggests that smaller retirement savings may be a consequence of
smaller salary increases. WDC may wish to consider developing advice, or at least
persuasive information, about the virtues of even small contribution amounts as well as
the ways to and advantages of increasing contributions over time both when salaries rise
and they do not.
19
Given that families face periodic strains between the desire and ability to save for
retirement, it is important that eligible workers have full information on the ways in
which past shortfalls in contributions can be “made up” through catch up provisions.
Relatively few take advantage of these options (Table 7) but that women are less likely to
do so and are more likely not to be aware of these options may be one reason for lower
account accumulations over time.
Ideally, individuals making retirement savings decisions, feel confident about their
financial decisions. This is not the case as only 30-40 percent assess their financial
confidence and knowledge as “very good” or better. Notable is the consistently lower
assessment by women of their knowledge overall and familiarity with key financial
concepts. This is consistent with the focus group discussion about the greater need of
women for financial education. Men were also likely to not be aware of some these
concepts, suggesting that when financial concepts are important to good retirement
savings decisions, WDC eligibles may need continuing education.
Finally, WDC is in a position to be an effective educator. Not only are they poised to do
so as the only tax deferred option available to those employed in Wisconsin state
government, but participants hold the WDC in high regard. It is remarkable that 75
percent say they are at least “quite” satisfied, a rank that is the top two categories of the
satisfaction scale. The call by focus group members for more education on financial
issues by WDC should be taken not just as a statement about the inadequacies of
information provided but in their confidence that WDC would be a trusted educational
organization. Note that decisions about ongoing financial matters were primarily
20
influenced by WDC information personnel and material, not by other advisers, including
family, financial advisors and human resource officers.
This is the third part of a report to the Wisconsin Deferred Compensation Program on a
project that aimed to understand gender disparities in WDC account balances.
Karen Holden and Sara Kock, 2012. “Understanding Gender Disparities in Tax-Deferred
Retirement Account Balances: Saving through the Wisconsin Deferred Compensation
Program” Paper presented at the Foundation for International Studies on Social Security
Seventeenth International Research Seminar on Issues in Social Security, Sigtuna,
Sweden, June 2012.
Karen Holden and Sara Kock, 2011. “Understanding Gender Disparities in the Wisconsin
Deferred Compensation Program: What was learned through focus groups” Paper
originally presented at Center for Financial Security Workshop, August 2011.
21
Table 1: Respondents’ Participation and Contribution Status
Males Female Both
Respondent Status
Survey responses 632 636 1268
Ever contribute 497 506 1003
share ever of all Rs.1 0.802 0.807 0.804
Currently has WDC account 472 463 935
share of ever having acct2 0.963 0.931 0.947
Contributed in 2010 359 361 720
Share of current acct holders 0.761 0.780 0.770
Enrollment timing after first eligibility
account holder with valid response 445 447 892
gap
215 235 450
percent delay 0.483 0.526 0.504
1Share calculated over only those giving a valid response (98%)
2 Share calculated over only those giving a valid response (96%)
22
Table 2: Reasons never enrolled or delayed enrollment
Did not enroll1
Delayed1
Multiple Choice Provided male female
male female Didn't know/hear about the program 0.089 0.125
0.088 0.119
Not enough information 0.205 0.313 * 0.209 0.323 ***
Forgot to enroll after other benefits 0.027 0.063 Too busy enrolling in other benefits
0.014 0.047 **
Could not afford to contribute 0.563 0.554
0.623 0.545 *
Had other tax deferred options 0.259 0.402 ** Unsure if it was a good way to save for retirement 0.268 0.214
0.186 0.140
Advised against by financial adviser/friend/spouse 0.018 0.036 Investment options not suited to financial goals 0.027 0.009 Other
0.161 0.143
0.121 0.102
1 rates calculated over totals in each group. Multiple responses allowed. Note: Reasons were those provided in the separate questions or which more than 3 percent of
respondents checked. Note: difference significant (2-tale test) between males and females at ***p<.01; **p<.05; * p<.10
23
Table 3: In making the decision to first enroll in the WDC
how helpful was advice you received from: Quite or very helpful
Male Female
a financial advisor
0.123 0.161 spouse/partner
0.193 0.256 **
another family member
0.127 0.152 co-workers
0.286 0.339
friends
0.103 0.117 your Human Services representative 0.068 0.099 WDC employees
0.186 0.242 **
WDC website
0.086 0.087 WDC printed material
0.273 0.274
Other
0.033 0.025
1 rates calculated for all WDC participants. Multiple responses allowed. Note: difference using a 2-tale test significant between males and females at ***p<.01; **p<.05; * p<.10
24
Table 4: To what extent was your decision to enroll in the WDC (for those who delayed enrollment beyond one year)
Quite a bit or very much
Prompted by
male female a raise in your salary?
0.401 0.305 **
an increase in your non-wage income?
0.068 0.027 **
a reduction in your expenses?
0.090 0.099 an increase in your spouse or partner’s income?
0.120 0.097
being newly married or partnered?
0.063 0.067 being newly divorced, separated or widowed?
0.032 0.040
attending a WDC presentation?
0.143 0.260 ***
the recommendation of a financial advisor?
0.072 0.107
1 calculated over those who had delayed WDC enrollment by more than one year. Note: difference significant between males and females at ***p<.01; **p<.05; * p<.10
Table 5: To what extent was your decision to enroll in the WDC
Quite a bit or very much
Affected by:
male female a desire to take advantage of all available
retirement savings options?
0.716 0.718 a desire to reduce your taxable income?
0.440 0.370
a desire to save enough for retirement?
0.846 0.837 the convenience and ease of enrollment?
0.487 0.513
the flexibility for withdrawals?
0.171 0.164 the ability to stop and start contributions?
0.276 0.287
the tax-deferred nature of contributions?
0.629 0.529 ***
the available investment options?
0.740 0.560 the ease of contributing via payroll deductions
0.704 0.761 *
1 calculated over all participants. Multiple responses allowed. Note: difference significant between males and females at ***p<.01; **p<.05; * p<.10
25
Table 6: In making ongoing decisions about your WDC account how helpful was advice you have received from1:
Quite or very helpful from males female
a financial advisor
0.168 0.208 **
spouse/partner
0.119 0.307 **
another family member
0.068 0.076 co-workers
0.083 0.090
friends
0.040 0.040 your Human Services representative
0.022 0.038
WDC employees
0.146 0.209 **
WDC website
0.191 0.167 WDC printed material
0.242 0.262
Workplace seminar
0.160 0.189 NonWDC seminar
0.042 0.028
Television program
0.039 0.055 Library
0.055 0.010 ***
1 rates calculated for all WDC participants. Multiple responses allowed. Note: difference using a 2-tale test significant between males and females at ***p<.01; **p<.05; *
p<.10
26
Table 7: Throughout your participation in the WDC, have you ever…
percent "yes"
percent don't know
about option
males females
males females
contributed the maximum 0.190 0.113 *** 0.020 0.052 ***
made a "catch up" contrib. 0.092 0.052 ** 0.035 0.074 ***
deferred a sabbatical 0.075 0.032 *** 0.158 0.148 balance fall due to divorce 0.024 0.016
0.050 0.054
made a roll over in WDC 0.035 0.064 ** 0.066 0.079 rolled over from WDC 0.027 0.048
0.050 0.072
annuity withdrawal
0.026 0.044
0.033 0.066 **
temporary stop
0.133 0.142
0.013 0.038 **
hardship withdrawal 0.011 0.018
0.028 0.070 ***
1 rates calculated over all participants. Multiple responses allowed Note: difference significant (2-tale test) between males and females at ***p<.01; **p<.05; * p<.10
27
Table 8: Due to recent legislation surrounding budgets and employee benefits,
percent "yes"
males females
have you requested an estimate from ETF 0.228 0.197 do you expect to separate from State service sooner than planned
sooner than planned 0.340 0.275 ** later than planned 0.210 0.267 ** at the same time 0.450 0.458
expect to change what now contribute to WDC start contributing 0.002 0.002
contribute more 0.053 0.054 contribute less 0.165 0.124 *
stop contributing 0.070 0.094 expect to change other retirement savings
more 0.089 0.092 less 0.271 0.280
1 calculated over all respondents. Note: difference significant between males and females at ***p<.01; **p<.05; * p<.10
28
Table 9A: Currently, how would you rate your…
(percent rating excellent or very good)
overall financial personal money
knowledge? management skills?
males females males females
Participant 0.296 0.191 *** 0.386 0.378
Nonparticipant 0.333 0.130 0.400 0.391
Table 9 B: Overall, how satisfied are you with your
(percent rating quite or very)
current financial potential to meet
condition? retirement needs?
males females males females
Participant 0.402 0.311 *** 0.391 0.284 ***
Nonparticipant 0.467 0.435 0.400 0.391
Note: difference significant (2-tailed test) between males and females at ***p<.01; **p<.05; * p<.10
29
Table 10A: Currently, how familiar are you with the
(percent rating quite or very)
concept of asset concept of asset
allocation reallopcation
males females males females
Status
Participant 0.416 0.224 *** 0.376 0.183 ***
Nonparticipant 0.267 0.130 0.200 0.130
importance of asset role of different
diversification types of assets
Participant 0.622 0.364 *** 0.459 0.280 ***
Nonparticipant 0.400 0.391 0.267 0.174
Table 10B: In the past year, how often did you…
(percent rating often or always)
save part of monitor your follow a budget/
your paycheck savings/invest spending plans
males1 females males females males females
Participant 0.724 0.660 ** 0.718 0.592 *** 0.455 0.463
Nonparticipant 0.333 0.500 0.571 0.522 0.467 0.609
***
pay off monthly pay all other bills maintain emergency
credit card balance on time fund
males females males females1 males females
1
Participant 0.778 0.692 *** 0.974 0.959 ** 0.667 0.612 *
Nonparticipant 0.733 0.682 1.000 0.783 0.600 0.435
*** *
Third column after male-female pair indicates significance of difference between males and
females at ***p<.01; **p<.05; * p<.10
1 Third row indicates difference between participants and nonparticipants significant at
***p<.01; **p<.05; * p<.10
30
Table 11: Overall how satisfied are you with WDC….
male female
male female
male female
funding options?
website information?
ease of managing
account?
Not at all 0.014 0.012
0.040 0.044
0.023 0.032
A little bit 0.068 0.052
0.098 0.082
0.058 0.079
Somewhat 0.226 0.240
0.243 0.276
0.219 0.245
Quite 0.454 0.429
0.404 0.357
0.435 0.369
Very 0.239 0.267
0.216 0.241
0.265 0.274
Somewhat + 0.919 0.936
0.863 0.875
0.919 0.889
Quite/Very 0.693 0.695
0.620 0.599
0.700 0.644
fund performance?
call centers?
in general
Not at all 0.016 0.031
0.057 0.046
0.011 0.014
A little bit 0.085 0.068
0.137 0.108
0.054 0.039
Somewhat 0.317 0.311
0.229 0.283
0.188 0.253
Quite 0.427 0.395
0.355 0.329
0.485 0.418
Very 0.155 0.195
0.221 0.233
0.262 0.276
Somewhat + 0.899 0.901
0.805 0.846
0.935 0.947
Quite/Very 0.582 0.591
0.576 0.563
0.747 0.694
on-line access to
availability of
your WDC account
local staff
Not at all 0.034 0.051
0.081 0.065 A little bit 0.068 0.064
0.170 0.113
Somewhat 0.158 0.217
0.244 0.294 Quite 0.379 0.300
0.330 0.331
Very 0.361 0.367
0.174 0.198 Somewhat + 0.897 0.885
0.748 0.823
Quite/Very 0.739 0.668
0.504 0.528
Distributions over all respondents who had ever used the option and provided an opinion.
31
Table 12: Participants who never used WDC options
(Percent of all participants responding)
Male Female
WDC fund options? 0.029 0.050
WDC fund performance? 0.027 0.041
on-line access to your WDC
account?
0.170 0.293 ***
WDC website information? 0.171 0.274 ***
the WDC call center? 0.433 0.458
the availability of WDC local
staff?
0.418 0.442
the ease of managing your
WDC account?
0.060 0.135 ***
the WDC in general? na na
Note: In response to question "Overall, how satisfied are you with
(option).." respondent checked “Never Used.”
Increasing WDC Contributions by Working Women: What WDC Eligible Workers say about Participation and
Contribution Decisions
Center for Financial Security Working Paper 2012-10.1
Center for Financial Security School of Human Ecology
University of Wisconsin-Madison
1300 Linden Drive
Madison, Wisconsin 53706
608.262.6766
cfs.wisc.edu


![WDC[4].ppt (Read-Only)](https://img.pdfslide.us/doc/110x75/58789ec01a28ab0b7e8bbfd4/wdc4ppt-read-only.jpg)