Embed Size (px)
Citation preview

What value do employers give to qualifications? Support document
LEE RIDOUTT
CHRIS SELBY SMITH
KEVIN HUMMEL
CHRISTINA CHEANG
This document was produced by the authors based on their research for the report What value do employers give to qualifications? and is an added resource for further information. The report is available on NCVER’s website: <http://www.ncver.edu.au>
The views and opinions expressed in this document are those of the author(s) and
do not necessarily reflect the views of ANTA and NCVER. Any errors and
omissions are the responsibility of the author(s).
© Australian National Training Authority, 2005
This work has been produced by the National Centre for Vocational Education
Research (NCVER) with the assistance of funding provided by the Australian
National Training Authority (ANTA). It is published by NCVER under licence
from ANTA. Apart from any use permitted under the Copyright Act 1968, no part
of this publication may be reported by any process without the written permission
of NCVER Ltd. Requests should be made in writing to NCVER Ltd.
SUPP
ORT
DO
CUM
EN
T
2 What value do employers give to qualifications? Support document
Contents
Tables and figures 3
Appendix A: Detailed methodology 4Introduction 4
Methodology overview 4
Semi-structured interviews 5
Literature review 6
Focus groups 6
Survey data collection 6
Data analysis 10
Appendix B: Sample population 12Description of the sample population 12
Appendix C: Survey questionnaire 20
Appendix D: Telephone survey 31
NCVER 3
Tables and figuresTables1 Comparative analysis of mailed and telephone
survey instruments 7
2 Distribution of organisations by industry sector 9
3 Respondents by state/territory 10
4 Distribution of organisations by enterprise size 10
5 Distribution of organisations by meta-industry group 12
6 Distribution of organisations by sector 12
7 Distribution of enterprises by nature of the staffing mix 14
8 Cross-tabulation of staffing mix and meta-industry (%) 14
9 Cross-tabulation of staffing mix and enterprise size (%) 15
10 Prevalence of specific enterprise attributes 17
11 Prevalence of specific enterprise attributes 17
12 Distribution of organisations by level of change experienced 17
13 Distribution of organisations by level of growth experienced 18
14 Cross-tabulation of innovation by level of growthexperienced (%) 19
Figures1 Distribution of organisations by size 13
2 Average enterprise occupation profile 13
3 Average and maximum percentage of employeeoccupation type 14
4 Profile of ‘average’ sample enterprise population byemployment status 15
5 Distribution of sample by annual staff turnover 16
6 Description of annual staff turnover compared withown industry 16
7 Organisational innovation at different levels of changeexperienced by organisation (n = 148) 18
Box 1 Population sample size for survey (focus on proportions) 8

4 What value do employers give to qualifications? Support document
Appendix A: Detailed methodology
IntroductionThe study explored the importance that employers place on qualifications held by their employees.This included investigation of characteristics that influence employers’ valuing of qualifications, thetypes of competence for which formal recognition is pursued, and the associated decision-makingprocesses employers adopt.
Qualitative research methods were used initially to understand employer conceptualisations ofrelevant issues. The qualitative research consisted of interviews with key informants in industrialassociations and focus group discussions with heterogeneous industry groups in metropolitan andregional locations. The outcomes from this qualitative research were used to develop the surveyinstrument for the subsequent quantitative research.
By employing a mailed survey to a large number of enterprises, the research methodology sought toestablish quantified findings across different-sized enterprises in different industries. Althoughresponses were ultimately obtained from 150 enterprises, this was a smaller sample size thanoriginally anticipated, and hence limited both the analysis by sub-groups and the generalisability ofthe findings.
The main research questions addressed in this project were:
� Are there recognisable and significant variations in the use of qualifications between different‘categories’ of employers?
� Are there recognisable and significant variations within enterprises in the valuing ofqualifications based on such aspects as the type of employee, type of job classification or role, thetypes of competency?
� If employers do value qualifications:� why do they� what for (employee selection, motivation, promotion, performance management)� are some qualifications more valuable than others?
� If employers do NOT value qualifications, why not, and what factors might make this change?
� If they do value qualifications:� why do they� what for (employee selection, motivation, promotion, performance management)� are some qualifications more valuable than others?
� Who makes decisions about the type and level of competency assessment? On what basis aredecisions made, using what criteria? Is a risk management approach adopted?
Methodology overviewThe initial methodology for this project included four sequential steps:
Stage 1: semi-structured interviews of major employer groups
Stage 2: literature review
NCVER 5
Stage 3: mailed questionnaire survey of employers
Stage 4: focus group discussions.
The aim of this proposed methodology was to facilitate the design of the survey instrument. In viewof a number of issues and uncertainties on design and content matters arising subsequent to theinterview process, greater research effort was undertaken in the design of the questionnaireinstrument and the research process. A revised research methodology sequence was discussed withNCVER and adopted. It was agreed that this would include the following stages:
Stage 1: semi-structured interviews of major employer groups
Stage 2: focus group discussions to sharpen the research questions and to inform questionnairedesign
Stage 3: specific literature review informed by information gathered through the focus groups
Stage 4: focus group discussions to validate the draft questionnaire design
Stage 5: pilot testing of survey instrument
Stage 6: mailed questionnaire survey of employers.
The response rate to the mailed questionnaire survey, based on first-round responses with no non-respondent follow-up, proved to be poor, effectively about 10%. The reasons for this are touchedupon in subsequent sections. In summary, though, it appeared to result from a combination of:
� a poor mailing list, with many out-of-date records in the database (as evidenced by the highnumber of questionnaires which were ‘returned to sender’)
� a large and complex questionnaire
� increasing employer reluctance to respond to surveys, compounded by the downsizing of manyAustralian enterprises
� lack of an incentive to respondents in the form of a prize, which is becoming the norm withmany commercial survey researchers
� insufficient promotion of the survey from sources which were credible with employers.
The research process was halted in order to, first of all, determine whether the project shouldcontinue, and second, if it did, determine the best way forward.
After some delay, it was agreed between NCVER and the researchers that the project should becompleted. The new approach adopted was to (1) complete more surveys through telephoneinterviews, and (2) simplify the survey questionnaire where necessary. Hence the final twomethodology stages of the study became:
Stage 7: telephone interview of employers
Stage 8: analysis of qualitative (interviews/focus groups) and quantitative (mail/telephone survey)data, interpretation and reporting.
Details on each of the stages of the methodology outlined above are described in the followingsections.
Semi-structured interviewsIn the initial stages of the research project nine interviews were arranged and conducted with seniormembers of selected national and state employer organisations. The aims of the interviews were to:
� seek views on a range of possible questions and terminology likely to be used in the mailedquestionnaire survey instrument

6 What value do employers give to qualifications? Support document
� explore what dissemination approaches would be particularly welcomed
� create a ‘partnership’ relationship with the employer in the research project. The partnershipwould, at the minimum, be to the benefit of the researchers, in terms of assisted access toemployer members and facilitating existing or arranged groups for focus group discussions if notcontribute to questionnaire design and sampling framework. Ideally however, the organisationwould contribute to research processes (for example, questionnaire design, sampling framework)and profit from the research results.
The level of interest among the interviewed associations varied. Some exhibited a strong desire for apartnership arrangement, while at the other extreme, some associations were indifferent to theresearch agenda (and possibly to any research involving their membership). Those who were mostinterested in a partnership relationship were the Australian Chamber of Commerce and Industryand some of their affiliate members (Australian Business Limited and the Victorian EmployersChamber of Commerce and Industry). Their desire translated into contributing to the researchdesign, commenting on the survey instrument/s, arranging focus groups of members andincorporating a newsletter item encouraging participation in the survey.
Literature reviewAs part of prior research to this study (Ridoutt et al. 2002a, 2002b), reasonably extensive (althoughnot exhaustive) literature searches and reviews were conducted. An additional search and a shortliterature review were agreed as part of this study to explore specific issues in respect to the researchquestions and focus group discussions
Focus groupsSeveral focus groups were organised through the auspices of a number of the industry associationsmentioned above. The focus groups were conducted in two stages.
� Stage 1: exploratory group discussions prior to attempts to design the questionnaire. Thediscussions were primarily aimed at understanding how employers might most easily andclearly understand certain potentially difficult conceptual areas, such as enterprise risk, humanresource management decisions, factors determining enterprise size, even the concept of‘qualifications’ itself.
� Stage 2: confirmation group discussions, after initial questionnaire design efforts. Thesediscussions were primarily aimed to consolidate design features and to make adjustments to thecontent of particular survey questions.
The Stage 1 focus group discussions were directed by a set of discussion points formulated aroundresearcher-constructed hypotheses. The Stage 2 focus group discussions were directed by the draftquestionnaire.
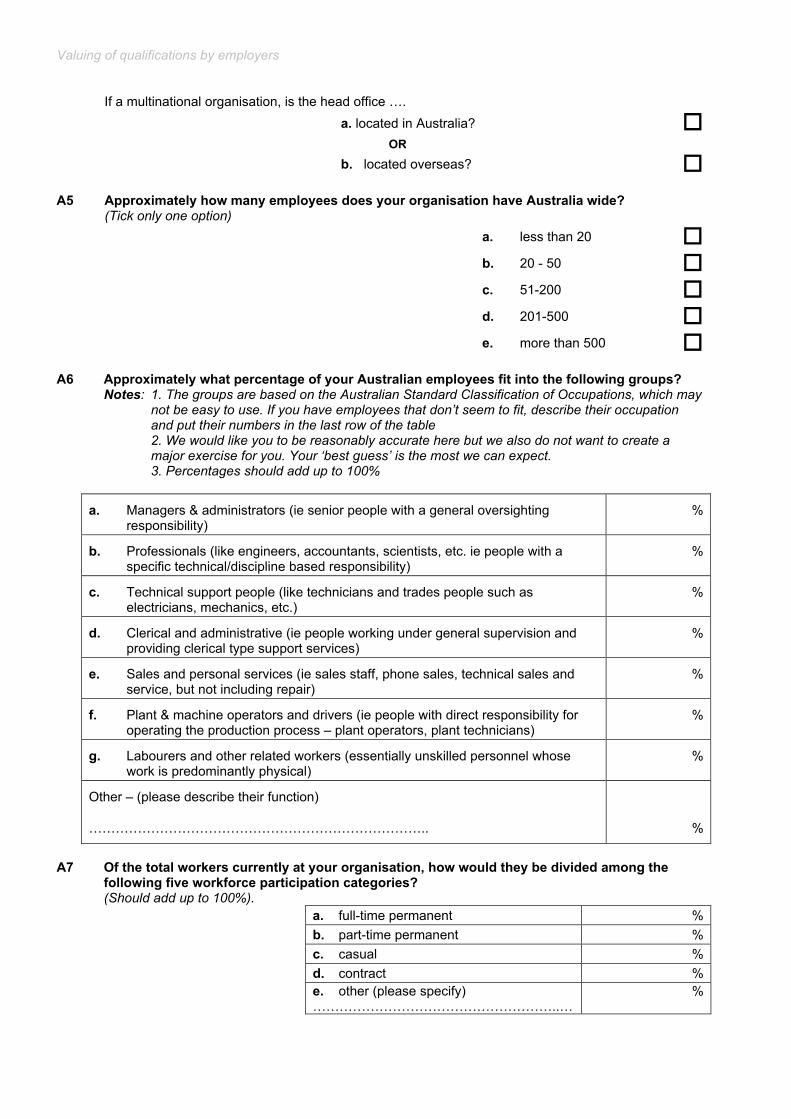
Survey data collectionQuestionnaire designA copy of the final paper questionnaire is attached as appendix C. The final draft was discussedwith three focus groups of employers, including two metropolitan and one non-metropolitanemployer group. Following this input and the extensive field testing which had already taken placeat that stage, the questionnaire was finalised and commissioned. Opportunity for further input byNCVER and the Statistical Clearing House (Australian Bureau of Statistics) was also provided priorto administration of the survey.

NCVER 7
As noted earlier, given the insufficient response rate, the researchers later undertook to seek furtherresponses through telephone interviews. This required some modification to the original surveyinstrument (see appendix D). Most of the modifications aimed to facilitate an interview process asopposed to self-completion, and therefore in essence, the questions remained consistent. Someother modifications attempted to improve respondents’ understanding of the intention of specificquestions, as well as ensuring that only relevant information for the research project was elicited.Generally, these questions were articulated so that they enabled comparison between the mailed andtelephone collected surveys. However, some questions were modified such that direct comparisonbecome indefensible. A summary comparison of the mailed questionnaire survey instrument againstthe telephone interview instrument is provided in the table 1.
Table 1: Comparative analysis of mailed and telephone survey instruments
SECTION A—ORGANISATION CHARACTERISTICS
A1 No changes
A2 No changes
A3 Part-question omitted (managed by owner)
A4 Question omitted (single, multinational, located in Australia or overseas)
A5 No changes
A6 Changed from ‘managers and administrators’ to ‘managers and supervisors’, consistent
A7 No changes
A8 Question omitted (awards)
A9 Question omitted (% staff covered by awards)
A10 Made optional
A11 Added description category: n = quick imitator
SECTION B—VALUE AND USE OF QUALIFICATIONS
B1 Additional questions B1a & B1b —why a degree or TAFE/trade qualification are not considered aqualification
B2 Question omitted (‘prefer that ALL workers hold/obtain formal qualifications’)
B3 Category ‘very important’ has been omitted
B3a Added – test idea that different categories of workers might have different requirements for skills andqualifications
B4 No changes
B5 Question omitted
B6,B7 &B8
Modified as follows:
It now includes a list of identified risks (guided question).
It identifies whether training and/or experience is important.
It identifies training types (formal education; company training; experience or other).
B9 Original question only asked about levels of assessment to ensure satisfactory skill/competence inminimising substantial skills.
Now B7a & B7b and optional questions relating to ‘high risk areas’ and asking whether:
the employer seeks to have more formal or external assessment of people’s skills – if so, why?
The employer sees formal qualifications as more important—if so, why?
Planned sample populationThe target population was enterprises in a selected number of Australian industries. A samplepopulation was constructed on the basis of two variables: industry sector and size of enterprise.The six industry sector strata were as follows: manufacturing; retail and wholesale; education andtraining; construction; transport; and commercial services. The three enterprise size strata were:<50 employees (small); 50–199 employees (medium); and 200 or more employees (large). Thetwo main variables for sample stratification were chosen since size had been shown in previousstudies (Hayton et al. 1996; Ridoutt et al. 2002b) to be a potentially strong influence on training
8 What value do employers give to qualifications? Support document
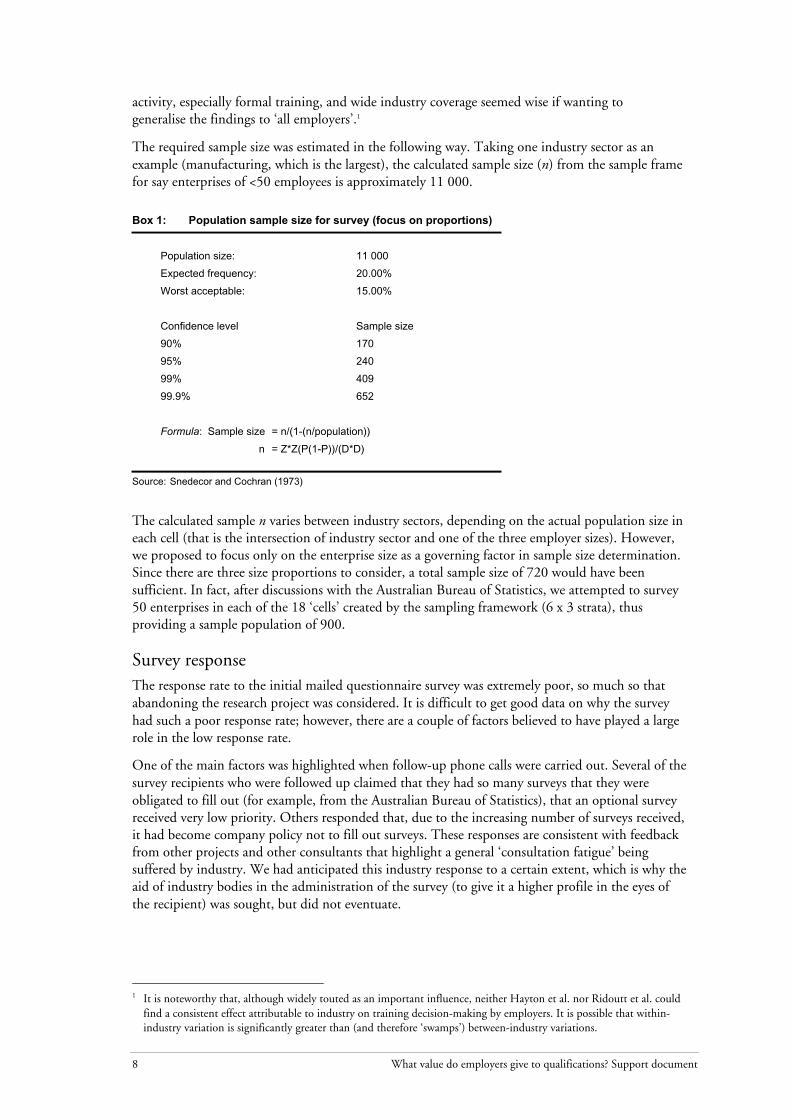
activity, especially formal training, and wide industry coverage seemed wise if wanting togeneralise the findings to ‘all employers’.1
The required sample size was estimated in the following way. Taking one industry sector as anexample (manufacturing, which is the largest), the calculated sample size (n) from the sample framefor say enterprises of <50 employees is approximately 11 000.
Box 1: Population sample size for survey (focus on proportions)
Population size: 11 000
Expected frequency: 20.00%
Worst acceptable: 15.00%
Confidence level Sample size
90% 170
95% 240
99% 409
99.9% 652
Formula: Sample size = n/(1-(n/population))
n = Z*Z(P(1-P))/(D*D)
Source: Snedecor and Cochran (1973)
The calculated sample n varies between industry sectors, depending on the actual population size ineach cell (that is the intersection of industry sector and one of the three employer sizes). However,we proposed to focus only on the enterprise size as a governing factor in sample size determination.Since there are three size proportions to consider, a total sample size of 720 would have beensufficient. In fact, after discussions with the Australian Bureau of Statistics, we attempted to survey50 enterprises in each of the 18 ‘cells’ created by the sampling framework (6 x 3 strata), thusproviding a sample population of 900.
Survey responseThe response rate to the initial mailed questionnaire survey was extremely poor, so much so thatabandoning the research project was considered. It is difficult to get good data on why the surveyhad such a poor response rate; however, there are a couple of factors believed to have played a largerole in the low response rate.
One of the main factors was highlighted when follow-up phone calls were carried out. Several of thesurvey recipients who were followed up claimed that they had so many surveys that they wereobligated to fill out (for example, from the Australian Bureau of Statistics), that an optional surveyreceived very low priority. Others responded that, due to the increasing number of surveys received,it had become company policy not to fill out surveys. These responses are consistent with feedbackfrom other projects and other consultants that highlight a general ‘consultation fatigue’ beingsuffered by industry. We had anticipated this industry response to a certain extent, which is why theaid of industry bodies in the administration of the survey (to give it a higher profile in the eyes ofthe recipient) was sought, but did not eventuate.
1 It is noteworthy that, although widely touted as an important influence, neither Hayton et al. nor Ridoutt et al. could
find a consistent effect attributable to industry on training decision-making by employers. It is possible that within-industry variation is significantly greater than (and therefore ‘swamps’) between-industry variations.

NCVER 9
Another factor that could have had a significant impact on the response rate was the quality of thedatabase used. Upon investigation, it would appear that the survey was not always addressed to theappropriate person in the organisation.
Integral to the decision to complete the research study when faced with the poor response to themailed questionnaire survey was an acceptance that analysis by different factors might need to besacrificed. In the final analysis, between the mailed questionnaire and telephone interview process, atotal of 150 responses were received. A summary of the distribution of the organisations by industrysector is outlined in table 2.
Table 2: Distribution of organisations by industry sector
Number of companies surveyedIndustry sector (ASIC main classifications)
Mailed questionnaire survey(n = 81)*
Telephone interview survey(n = 69)**
Agriculture, forestry and fishing 2 1
Manufacturing 30 30
Construction 6 5
Retail/wholesale trade 3 2
Transport and storage 12 20
Finance and insurance 1 -
Cultural and recreational services 9 -
Education and training 3 7
Electricity, gas and water 1 1
Accommodation, cafes and restaurants 1 2
Communications services 1 3
Property and business services 8 2
Health/community and personal services 3 3
Notes: * Some respondents did not fill in this section of the survey identifying their industry. Hence, the number of industries isless than the sample population
**.In the interview process several respondents took the opportunity to self -identify as belonging to more than oneindustry sector. Hence, the number of industries totals more than the sample population.
ASIC = Australian Standard Industrial Classification
Clearly the two industry sectors, manufacturing and transport and storage, dominate the surveypopulation, accounting for 40% and 21%. All other industry categories combined account foronly 39%.
The study originally intended to survey respondents from a wide range of industries. However,when the research was redesigned, a smaller number of industries were targeted for the telephoneinterview. Consequently, the original industry sectors were collapsed into the following industrygroupings: construction, manufacturing, transport, service and other.
The intention of the project was to have a sample population representative of the states andterritories and also of the industry groups being studied. As can be seen from the accompanyingdata (table 3), the sample population appears to have a strong bias towards New South Wales andVictoria, although proportionately, it is reasonably representative of industry activity in therespective jurisdictions.
The proportional representation of small (48 % and 34%), medium (25% and 29%) and large(26% and 36%) sized enterprises (see table 4) favours the smaller-sized enterprise population.

10 What value do employers give to qualifications? Support document
Table 3: Respondents by state/territory
State/territory Respondents Population
Frequency(n=148)
% %
ACT 2 1.4 1.6
NSW 58 39.2 33.6
NT 1 0.7 1.1
QLD 20 13.5 19.1
SA 9 6.1 7.8
TAS 2 1.4 2.4
VIC 43 29.1 24.6
WA 13 8.8 9.8
Total 148 100.0 100.0
Table 4: Distribution of organisations by enterprise size
Number of organisations surveyedEnterprise size(number ofemployees)
Mailed questionnaire survey(n = 81)
Telephone interview survey(n = 69)
under 20 16 13
20–49 22 11
50–199 21 21
200–500 8 10
> 500 13 15Note: * In the interview process several respondents took the opportunity to self-identify as belonging to more
than one industry sector. Hence, the number of industries totals more than the sample population.
Comment on the sample populationClearly the first question is the size of the sample population and is it sufficient to allow sensibleanalysis. The formula for a standard error, assuming no sample design effect is:
Where p = estimated proportion and
n = sample size
If the same parameters as originally adopted are placed into this formula along with a samplepopulation of 150, then the standard error calculation is 0.057.
While this is not in itself a cause for concern, the obtaining of the sample population itself withthe high level of non-response suggests that a strong bias in the population might exist. What thatbias may be is difficult to assess, but clearly all the proportions highlighted in the findings chapterneed to be interpreted with care. Even statistically significant differences in proportions, whereobtained, would not in this circumstance allow generalisation to the entire population of‘employers’.
Data analysisQuantitativeThe primary purpose of the study was to collect and analyse sufficient data to enable ageneralisation of conclusions on enterprise perspectives on qualifications. The response rate wastherefore disappointing, since it precluded detailed analysis by industry category.
1)1(
−−
npp

NCVER 11
However, the sample population response for most questions, especially those where the mailedquestionnaire and telephone interview data were comparable, was more than acceptable for analysisof ‘enterprise’ perspectives, even by different size categories. This presumes, of course, that therewere not systematic differences of significance between responding and non-responding enterprisesin relation to the factors being investigated by the project.
Analysis in most cases was through simple frequency distributions and cross-tabulations. Whereappropriate, statistical tests were applied to test the significance of observed differences in meansbetween categories.
QualitativeA content analysis of the information collected through interviews was undertaken. To ensure allthe relevant issues were answered, the information was partially ‘processed’ into broad areas ofinterest that mirrored the information requirements relevant to the research questions. These broadareas of interest included:
� attitudes to qualifications and what they mean
� attitudes to assessment
� organisational culture
� approach to risk management
� perceived differences between jobs/roles and competencies in respect to risk.

12 What value do employers give to qualifications? Support document
Appendix B: Sample population
Description of the sample populationAs has previously been described in appendix A, the sample population covered a limited range ofindustries which have been agglomerated into meta-industry groupings for analysis purposes:construction, manufacturing, transport, service and other. The distribution of the meta-industries isgiven below.
Table 5: Distribution of organisations by meta-industry group
Meta-industry type % represented
Construction 7
Manufacturing 38
Service 31
Transport 21
Other 3
A large proportion of respondents were from the private sector, although there was somerepresentation from the public sector (see table 6).
Table 6: Distribution of organisations by sector
Sector % represented
Public sector 3
Public sector commercial organisation 7
Private sector (for profit) 85
Private sector (not for profit) 5
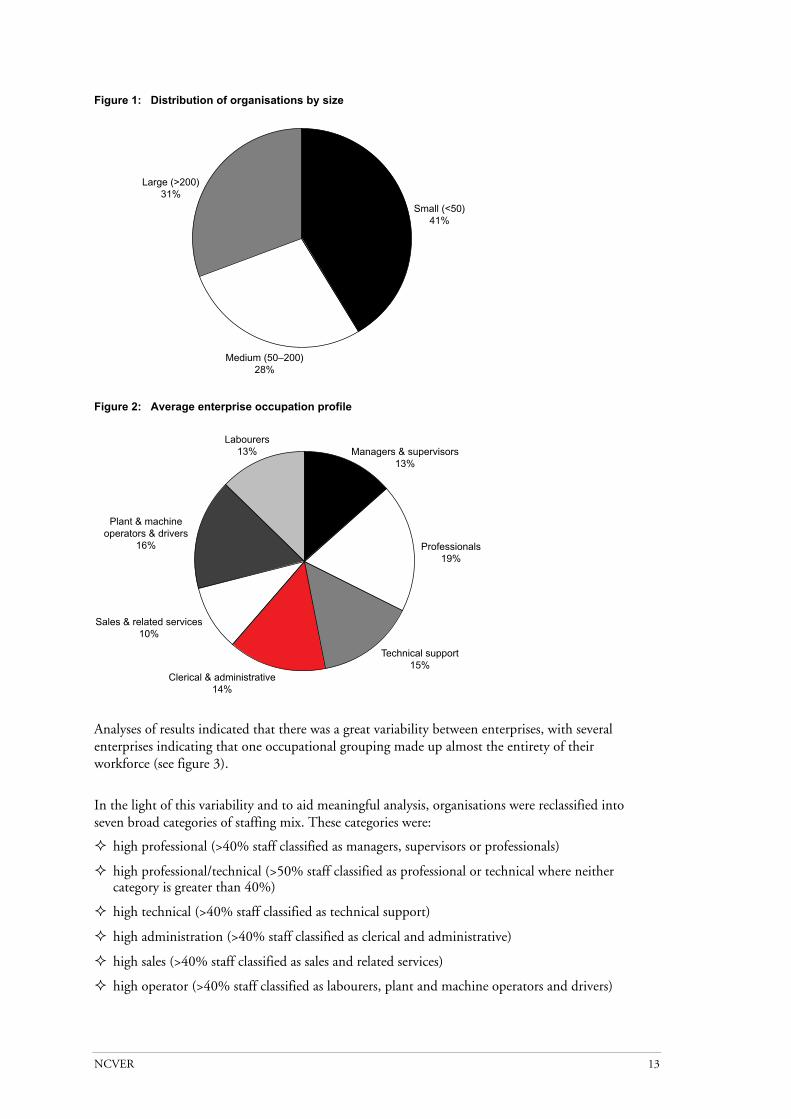
The sample represents organisations of a range of sizes, with fairly even distribution between small,medium and large enterprises (see figure 1).
In order to be able to test the hypothesis that employers may value qualifications differently fordifferent ‘types’ of employee, the organisations were asked to report on their staff numbers byoccupational grouping. From these responses, the ‘average’ enterprise, in terms of workforce mix,was able to be constructed, although such an organisation with the exact blend of occupations setout below may not exist (see figure 2).
NCVER 13
Figure 1: Distribution of organisations by size
Figure 2: Average enterprise occupation profile
Analyses of results indicated that there was a great variability between enterprises, with severalenterprises indicating that one occupational grouping made up almost the entirety of theirworkforce (see figure 3).
In the light of this variability and to aid meaningful analysis, organisations were reclassified intoseven broad categories of staffing mix. These categories were:
� high professional (>40% staff classified as managers, supervisors or professionals)
� high professional/technical (>50% staff classified as professional or technical where neithercategory is greater than 40%)
� high technical (>40% staff classified as technical support)
� high administration (>40% staff classified as clerical and administrative)
� high sales (>40% staff classified as sales and related services)
� high operator (>40% staff classified as labourers, plant and machine operators and drivers)
Large (>200)31%
Medium (50–200)28%
Small (<50)41%
Labourers13%
Plant & machineoperators & drivers
16%
Sales & related services10%
Clerical & administrative14%
Technical support15%
Professionals19%
Managers & supervisors13%

14 What value do employers give to qualifications? Support document
� mixed (the remainder of the organisations, ie those for whom the above circumstances did notapply).
Figure 3: Average and maximum percentage of employee occupation type
The distribution of enterprises (see table 7) showed that the sample favoured high professional, highoperator and mixed organisations, accounting for 73.3% of the sample in total.
Table 7: Distribution of enterprises by nature of the staffing mix
Staffing mix Frequency(n=150)
Proportion of total(%)
High professional 32 21.3
High professional/technical 5 3.3
High technical 20 13.3
High administration 7 4.7
High sales 8 5.3
High operator 45 30.0
Mixed 33 22.0
A number of cross-tabulations between staffing mix and other measures were carried out to furtherdescribe the sample (see tables 8 and 9).
Table 8: Cross-tabulation of staffing mix and meta-industry (%)
Staffing mix Broad industry category
Constructionn=11
Manufacturingn=57
Servicen=47
Transportn=31
High professional 27 4 49 13
Professional/technical 9 4 4
High technical 36 19 9 3
High administration 9 10
High sales 4 13
High operator 9 39 13 45
Mixed 18 32 4 29
0 10 20 30 40 50 60 70 80 90 100
AverageMaximum
Managers & supervisors
Professionals
Technical support
Clerical & administrative
Sales & related services
Plant & machine operators& drivers

NCVER 15
Table 9: Cross-tabulation of staffing mix and enterprise size (%)
Staffing mix Enterprise size
<20n= 26
20–50n=34
51–200n=43
201–500n=19
>500n=28
High professional 31 26 16 21 14
Professional/technical 8 5 4
High technical 12 12 21 16 4
High administration 6 7 7
High sales 9 7 5 4
High operator 19 26 30 32 43
Mixed 31 21 19 21 25
The sample seemed to favour organisations with high proportions of full-time employees, the‘average’ enterprise full-time participation rate being 78.8%, and casual, part-time and contract/sessional work accounting for less than 10% each (see figure 4).
Figure 4: Profile of ‘average’ sample enterprise population by employment status
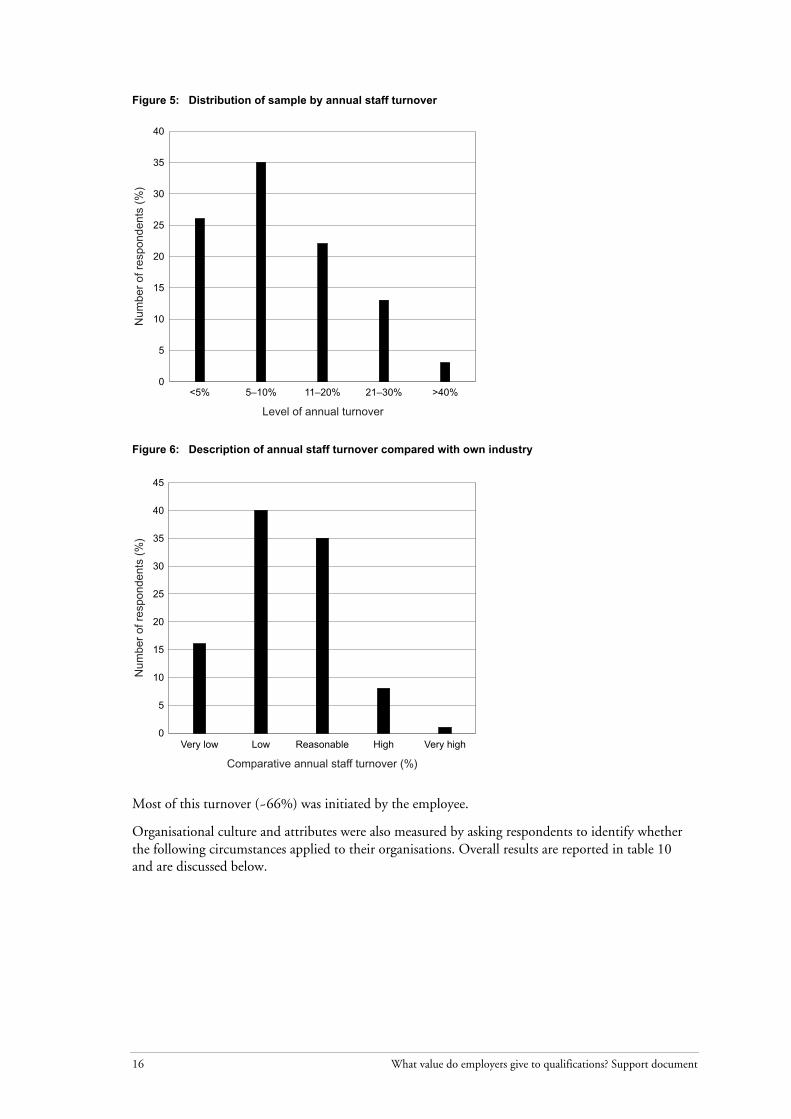
Several measures of organisation culture were attempted, including personnel turnover. Turnoverwas generally under 20% (see figure 5) and is seen by the respondents as being reasonable or low fortheir industry (see figure 6).
0
10
20
30
40
50
60
70
80
90
100
Contract/sessional
Casual Part timeFull time
16 What value do employers give to qualifications? Support document
Figure 5: Distribution of sample by annual staff turnover
Figure 6: Description of annual staff turnover compared with own industry
Most of this turnover (~66%) was initiated by the employee.
Organisational culture and attributes were also measured by asking respondents to identify whetherthe following circumstances applied to their organisations. Overall results are reported in table 10and are discussed below.
0
5
10
15
20
25
30
35
40
>40%21–30%11–20%5–10%<5%
Level of annual turnover
Num
ber
of r
espo
nden
ts (
%)
0
5
10
15
20
25
30
35
40
45
Very highHighReasonableLowVery low
Comparative annual staff turnover (%)
Num
ber
of r
espo
nden
ts (
%)

NCVER 17
Table 10: Prevalence of specific enterprise attributes
Enterprise attributes Proportion of enterprises (%)indicating they have the attribute
n=150
a) high technology 37
b) leading edge practitioner 37
c) leading innovator 50
e) in an organisation where change to culture/practices is drivenby a major customer
25
f) currently in, or emerging from a recent significant structuralorganisation change
43
g) feeling the effects of a recent discrete organisation change 25
h) subject to significant technical change 21
i) in a period of sustained organisational growth 52
j) in a period of continued organisational/industrial decline 9
k) in a period of organisational consolidation 42
l) significantly exposed to global markets 34
m) in an industry with significant supply chainmanagement/integration
37
A number of these attributes were clustered to construct measures of enterprise innovation, changeand growth.
Level of innovation was constructed from the cluster of responses to high technology, leading edgepractitioner and leading innovator attributes. Where all three circumstances were present, theorganisation was labelled high, where two were present, they were considered medium and less thantwo as low (see table 11).
Table 11: Prevalence of specific enterprise attributes
Level of innovation Respondents (%)(n=148)
Low 34
Medium 47
High 18
A second construct, level of change, was derived from identification with the followingcircumstances:
� in an organisation where change to culture/practices is driven by a major customer
� currently in, or emerging from a recent significant structural organisation change
� feeling the effects of a recent discrete organisation change
� subject to significant technical change.
Respondents were grouped into low, medium, high levels of change, where respondents identifiedwith fewer than two, two, more than two of the above circumstances respectively.
Table 12: Distribution of organisations by level of change experienced
Level of change Frequency (%)(n=148)
Low 65
Medium 21
High 14

18 What value do employers give to qualifications? Support document
There was a non-significant trend for higher levels of change to be associated with higher levels ofinnovation, as shown in figure 7.
Figure 7: Organisational innovation at different levels of change experienced by organisation (n = 148)
A third construct aimed at measuring enterprise and industry level of growth or decline was derivedas a result of identification with the following items:
� in a period of sustained organisational growth
� in a period of continued organisational/industrial decline
� in a period of organisational consolidation.
A large proportion of enterprises (68%) self-identified as being in a period of sustainedorganisational growth (interestingly, this includes 16% who indicated that their industry was indecline), and only 5% regarded themselves as being in a period of organisational or industry declineonly (table 13).
Table 13: Distribution of organisations by level of growth experienced
Level of growth % enterprises(n=148)
Organisational growth only 36
Organisational growth + organisational/industry decline 16
Organisational growth + organisational consolidation 16
Organisational consolidation only 23
Organisational consolidation + organisation/industry decline 3
Organisation/industry decline only 5
0
10
20
30
40
50
60
70
80
90
100High innovation
Medium innovation
Low innovation
High changeMedium changeLow change
Num
ber
of r
espo
nden
ts (
%)

NCVER 19
These conditions of growth were cross-tabulated with levels of innovation to give the followingresults.
Table 14: Cross-tabulation of innovation by level of growth experienced (%)
Innovation Level of growth (n=148)
Growth(n=54)
Growth +decline(n=23)
Growth +consolidation
(n=24)
Consolidation(n=34)
Consolidation+ decline
(n=5)
Decline(n=8)
Low 35 39 29 32 40 38
Medium 50 52 33 50 40 50
High 15 9 38 18 20 13
The growth circumstance that seems to correlate with high levels of innovation is a period ofsustained growth AND a period of consolidation. Among the enterprises that responded to thesurvey, those in growth, in organisational growth plus industry decline, and in organisation orindustry decline, were least likely to be high innovators (see table 14).
20 What value do employers give to qualifications? Support document
Appendix C: Survey questionnaire

������ � � � � �������������
�
����������������� ���������� ������
� ����������� ���������
������������ ��������������� ������������������������ ��������
�
� ����� � �������� ������������ ����������� � ��� � ! �" #��� �����������������
����������������������������������������������������������� ����������
����������
�����
$��������������%��� ������&�����������'� �%�" ����������(���
������������� ������� ��� ������������� ������������������������������������� ��������� ���������������������������������������������������������������� �!"�
��#������������ �������������������������������$�
�%���$� ����������� �������������������� � &�'$� ���� � ��� ��� ���������������������
� �!�"���� �� # �$�#�%�&'�#&( �������(����$����)��"������* �������������������"���"�������)����� � ��� *��+�������,���-����.�+���������+����������.��,��/��������+�0������������������� ��� �� ��������������������������� ��������������
�� � �� ��� �������������� ��� ����� ������������� ��������������� � ���� ��������
�
��
���������� ���� �������������������������������������� ���������
�� � �����������) ** � ! ������������� � ����������

���� ���������� � �� �����������������
+������,$�� -����������������������������
,.� -����������������$�� 000000000000000000000000000000000000000000000000000000000000000000000000000000000000000 ��,�� �� ������$��������� ������������������������� ���������� ����������� � � ���� ���������� ������������������� �������!�������"���� � �� ��#�!���������������������������������� ���������� �#�$����������%������ ������ �������&'�������� ��&����%������������������ ��&���� ��������������&����(���� ��� �)�� ����������*+��� � � � � � � �
�)+�����+�1�.�+���+�����.�,�)� �� $��)� ��$���.����+�)� �� 2����+���1�)������3���+� �������+������ �� (,���������+��� ���������+��� �� �����������1���.������+�����+����� ��'+�����+��������+�)�� �� ��������������+����� ��4������������+����� �� �+���+������-���������+����� �������+������+��+����������+����� �� �����,���������������+����� ��2������� �� ��+�����������,�+���+����� ��
�-��������0������������.��5 5 5 5 005 5 5 5 5 5 5 5 5 5 5 5 5 5 5 5 5 5 5 5 5 5 5 5 5 5 ��,/� �������������������������������������� ��������������������������0��������� ����������������������� ��������+�
��-��������+� ����-��������+������+�����+)�������� ���+����������+��.�+��+�.��� ���+����������+������.�+��+�.��� �� �,�+�������������.��� ��5 5 5 5 5 5 5 5 5 5 5 5 5 5 5 00� �
������������������������������������������� �����������0�
#�� ��1�� ��
,�� ���������������������2 �
�"�������)��������+)�������6��7�����/��������*�� ��-3�
��"�����+���.�������8�����+)�������6� ��
��9.���+���.�������8�����+)�������1�����5 �
�"������+���)������������+���6��7�����/��������*�� ��-3�
��"����������������+)�������6� ��
��
���� ���������� � �� �����������������
9.����������������+)�������1����,��,����..���5 0�
�"��������������+���6� ��-3�
��"�������������+����6� ��
�,!�� ,����'����������������������� ������������������������,����������� 0���
�, �������������� ��+�
�"� ������,������ ��
�"� ���8�*�� ��
�"� *�8���� ��
"� ���8*��� ��
"� ��+���,���*��� ��
�,4� ,����'����������������������������,���������������������������������������������0��
�����-��.#�,������������������������������ ��� �������"���� � �� ������/����� ���%�� ����������������������#�!�������������������������0��������� %������ ���� �������� ����������� ���������� ����������������������1#�2��������� ��������������������������������������������������������������������)�������� ����������#�3����4���������0� ��������������������#��5#���������������������������.667 ��
�"� $���)�+��:������+���+���������+��������3�,���)���+������+�),��)�+������-�����
;�
�"� �+�.�����������<����)���+�1������������1���������1����0����������3�,�������.�����,����=�������-����+������-�����
;�
�"� '��,����������+�����������<�����,����������+��������������,���������+����1����,����1����0��
;�
"� ���+������������+���������������3�+<�)����+�)���+�������+���������+���)����+��������������+����+������
;�
"� &����������+��������+�����������������..1��,���������1����,����������������+���1�-������������)�+���+��
;�
�"� ������:����,������+���+�����+��+������������3�,�+����+������-����.�+����+���)��,���+��������+������>����������+���+�1����������,�������
;�
�"� ?�-��+�+�������,�+�+������3�+<�+�����������������<������+�������3,����3�+<����+�����������,�������
;�
�,�+�>������������+-���,�+�.��������
5 5 5 5 5 5 5 5 5 5 5 5 5 5 5 5 5 5 5 5 5 5 5 5 5 00�
�
;�
�, � -��������������5������������������������������������������ ������� �� ����������
����������������5���������������������������0��� ��������������.667+#� � � � � � �
�"� .���8������+������� ;�
�"� ��+�8������+������� ;�
�"� �������� ;�
"� ����+���� ;�
"� ��,�+�������������.���5 5 5 5 5 5 5 5 5 5 5 5 5 5 5 5 5 5 005 �
;�
�

���� ���������� � �� �����������������
,�� ,�����5�������������������������������� �������������������������� ������������ ��������������������0��, ��������������������������� ��+�
�����������+����3�+��
��.��+�������+����3�+��
������+�+����)+��������
���������)+������������,�����,������+�����(�+<�������)+���������
�� �,�+��++��)������������������.����5 5 5 5 5 5 5 5 5 5 5 5 5 5 5 5 5 5 5 5 5 5 5 5 5 5 00�
��
#�����+��3,����,���++��)��������+����
��,�� 6������������������������5������������������������������ ������ ������ ������������ ��
������������������0���������..�����;��
����;�8���;�
��*��8��*;�
�����8�*�;�
���������*;�
����@��<��3�
����,.�� 7������������������������������������������/����������������������������������
������ ������� 8����� ��� ����������� ��� ������ ������ ��� ������ ������ ����� 90����� �� �������������� ����� ������� �� ����������� ��� �%�� ������������������� �������������� �������������4 �0��������#�!������ ����������������������� ��������������������� ��������������������%������������������� ������������������������������ ��#��" ������������� �������������+��
�A*��
�*8���
���8����
���8 ���
�B ���
�� �� C� � *�
��:������������������� ������������������� � ��������������"�;���5������������������������������������������������� ������8�����������������������������������������9���� ��� �������������������5����������������������������"��" ������������� �����������������
�D�+��?�3�
�?�3�
��������-���?������
��),��
�D�+���),��
�� �� C� � *�
��
1<$������������������������� ����=�����������>����
������������
����

���� ���������� � �� �����������������
,..� 6��� ���������������������������������������������������������������������������� ���������������������������������������0��, ��������������������������� ����������� ��+�
�"� ,),����,����)�� ��
�"� ����)��)���+�������+�������+���)�E���������.����+�)@������������������� ��
�"� ����)��������+�������3��+�����1���)��1��+��������� ��
"� ������+)��������3,�+���,��)�������������+�=��+��������+��-��)�+����-������F�+��������+�
��
"� ��++�������1��+����+)�)�.+�����+�������)�.�������+����+����+)���������,��)�������3��G�)1�+��������)1���+)�+1����0��
��
�"� .����)��,���..������.���+��������+�����+)���������,��)������+������������.��2 1��,��)���.�)���+�����1���/�����1����0��
��
�"� ��-F��������)�.��������,������,��)��������3��/��������+������)1���3��+�������+�����+��������.�+��+�������.��+�������+���+������
��
�"� ������+���.����������+)����������)+�3�,� ��
�"� ������+���.����������+)���������=����+�������� ��
)"� ������+���.��+)��������������������� ��
5"� �)�.��������"��������)��-�����+<���� ��
�"� ���������+��3�,��)�.�������������,�������)�����=���)+����� ��
�"� ��,�+�������������.���
5 5 5 5 5 5 5 5 5 5 5 5 5 5 5 5 5 5 5 5 00�
��
�
+������<$�� ?������ �����������������������<.� 6��������������������� �������������������������� ������������������������0��, �����������
���������������� ��+�
�
�"� �)+�������.�++��-��������+�����+��/��������
�
��
�"� ����������������������+���)�/���.�������>����������'�42��+��/����������,�������+�.�����1�������1����������������
��
�"� �������1�H��<���H1����0��+����-�������+���)�-������)�+))�)���+�.�������.�������������
��
"� ��+�.�������.������������+���,�+�+���)������+����.�+���+���������������+���
�
��
"� ����+���+���)��3�+����)�,�������-������+��)�/���.������I��3�+��.+�������+����+��+�.��������-�����
��
�"� ��+�.�������.���,������,����������)0�D�21�?����)���+�.����1��&���+����+��������� ��
�"� ��,�+�������������.���
5 5 5 5 5 5 5 5 5 5 5 5 5 5 5 5 5 5 5 5 5 5 5 5 5 5 5 5 5 5 5 �
��
��
�

���� ���������� � �� �����������������
1��$�&���������������������@��������������A������������������ ������������������������������� ������������� � ������������ ����������
����������������������������������;,&(�������������� �"��
�<�� B��������������������������,CC����5��������� ��������������������������������
������������������� ������������ 0��
J������
#�1�5 ������������������H������.�+����/���.������������+.�+���,�+�F�-��
��
��</� ����������������������������������������������������������������������������������������
����������0���������� ��� ����������� ��������������� �������������� ��������#�8������������������������� ����#�!�������������������������������������%�������� ���9������� �����9#+�
�
� &������D����������������$�
;���������������8�����������������9�
(��������E�
����� ����
����������
(��������E�
����� ����
��������
?���
����������
����������
1���
����������
1���
����������
�"� ����)�+��:������+���+�� � � � � � �
�"� �+�.���������� � � � � � �
�"� ���,����������+��������� � � � � � �
"� ���+������������+����� � � � � � �
"� �����������+��������+����� � � � � � �
�"� ������:����,������+���+�����+��+��
� � � � � �
�"� ��-��+�+�������,�+�+������3�+<�+��
� � � � � �
�"� ��,�+�8�����������+-�� � � � � � �
�
���� ���������� � �� �����������������
�<�� :������������������5������������������������������8:3F9� ����������������
�������������������������5����0�
�� �
;�������:3F� ��������
?���
����������
����������
1���
����������
1���
����������
�"� ��������.�+��,����++�������.���+���<���������.��,���+)��������
� � � �
�"� ���+��+���=����������3����������� � � � �
�"� ����������3�,�+��������������������,����,�:���.������3�� � � � �
"� ���������+���)��������+���������������������� � � � �
"� �����<���+��������������� � � � �
�"� ������+������������.�+�����+�����:���,�+�-���.��� � � � �
�"� ����+������3�+<�+�������������������������+��������..���+����+�
� � � �
�"� �,�+��������.���$�������6������������.���5 5 5 5 5 5 5 5 5 5 5 5 5 5 5 00�
� � � �
����<!� :������������������������������������������������������������� ������������������
����������������������������������������8:3F9� ������������� ����������0��
�� �
;�������:3F�B��������
?���
����������
����������
1���
����������
1���
����������
�"� � ��������.�+��,����++�������.���+���<���������.��,���+)��������
� � � �
�"� � ���+��+���=����������3����������� � � � �
�"� � ����������3�,�+��������������������,����,�:���.������3�� � � � �
"� � ���������+���)��������+���������������������� � � � �
"� � �����<���+���������������� � � � �
�"� � ������+������������.�+�����+�����:���,�+�-���.��� � � � �
�"� � ����+������3�+<�+�������������������������+��������..���+����+�
� � � �
�"� � �,�+��������.���$�������6������������.���5 5 5 5 5 5 5 5 5 5 5 5 5 5 5 00�
� � � �
���

���� ���������� � �� �����������������
<4� 6����������������������5�����������������������8�����������5�����������������������5�����������������������������������������5���������������������� ���������������������������5�����������������������������G�������������5��-:H+����5����������������590���������������� �������������5������������� �������������������"�
�� "���� ������� ��� � ���� ������ �� ������������ ���� ���������������������� ��#�
�
����������������5����������3��5�1����� 3��5� ��������������������������������
I�������� ?�������������
����������
��<�#��-�+������
���
� � �
��<�#��-�+������
����
� � �
��<�#��-�+�C����
����
� � �
��< � ������������������������������5������� ����� �����������������������������������������
����������������������������������5�������������������������0��������������� ����������������� ������ �� ������������ ���������� ��������������+�
�
� ��������������������5��������������������������$�
3��5�1����� ?�������������
���������� 1�������������
1�������������
��<�#��-�+��� � � � �
��<�#��-�+��� � � � �
��<�#��-�+�C� � � � �
��<�� ������������������������������5������� ����� �����������������������������������������
����5������'�������� �����������������5����������������������������������� ������������������0�
���������������������5��'�������� �
�����������$�
3��5�1�����
?���
����������
����������
1���
����������
1���
����������
��<�#��-�+��� � � � �
��<�#��-�+��� � � � �
��<�#��-�+�C� � � � �

���� ���������� � �� �����������������
�<�� 6������5���5���G�����������������������������������������������������5���������
����������������������������������������������������@������A����������5������������������������������5���G�����������������������0�������������������������������������������������������������������+�
����������� ������������������������<����F�)���������+���.I��+���<��,���������.�����,�+�3�+<�+=���+�����+���+��
��
�������� �8������9���������������������������������+����+���������������+�������.�������������)������)+��������+���+�-���,��+<���
��
'���������������������������-������"��+����+�)���+�������������+��+���)��+)������������-���+������)�����.�+���.���+�.�������+���,�+�/���.���������
��
����������������������������������5���5���G�������0���
�
���� ���������� � �� �����������������
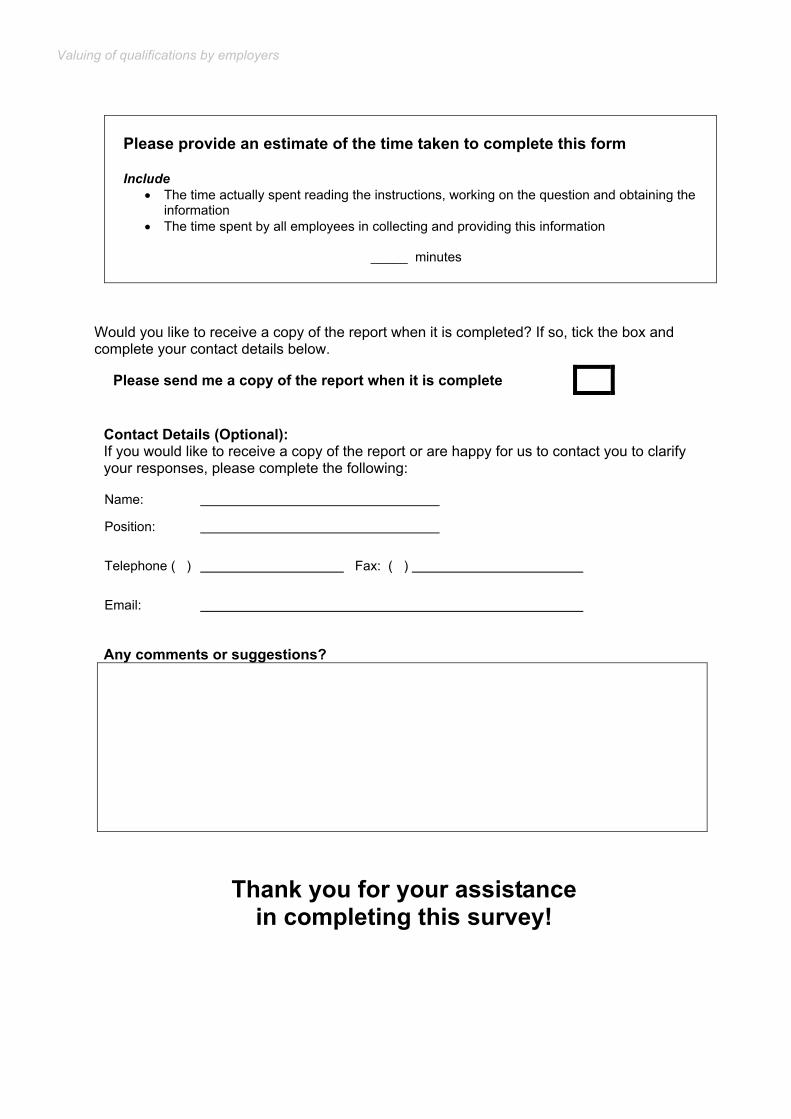
��%�������� �����������������������5�����������������������������
�� ',���������������������+���)��,�����+������1�3�+<�)�����,��/�����������-����)��,���.�+������
�� ',������������-��������������������������)�����+���)��,���.�+�������
KKKKK���������
��
�
( ���������<�����+��������������.��,��+���+��3,���������������6�9.���1���<��,��-�"����������������+���������������-���30�
%������ ���������������������������������������
��
I�������B������8-�������9$�9.�����3�����<�����+��������������.��,��+���+���+��+��,�����.�+�������������������������+.�����+�+��������1������������������,��.����3�)L��
���� #���L����� � � � � � �
������L�� � � � � � �
'����,����������� � � � ���4�"L��������� � � � �
2���L�� � � � � � � � � � �
�,������������������������0������������
��
;���5�����������������������������������������������J�

NCVER 31
Appendix D: Telephone survey

Section A: Organisation characteristics
A1 Organisation name: ………………………………..………………….
State or territory of interviewee: ……………………………………….
A2 What is your industry type? (tick all applicable)
Agriculture, forestry & fishing Manufacturing
Construction Retail trade
Transport & storage Finance & insurance
Cultural & recreational services Education
Electricity, gas & water Wholesale trade
Accommodation, cafes, restaurants Communication services
Property & business services Personal & other services
Other: Please specify ……………………………......................
A3 Which one of the following best describes your organisation? (Tick one)
Public sector
Public sector commercial organisation
Private sector (for profit)
Private sector (not for profit)
Other (specify)………………………………
A5 For this survey, we are seeking information on your Australian operationsonly. Approximately how many employees does your organisation have?Tick one)
Less than 20
20–50
51–200
201–500
More than 500
A6 The following is a list of mutually exclusive categories of employee. Pleasegive approximately how many employees you have in the followingcategories:
Managers & supervisors
Professionals (people with a specific technical/discipline based responsibility – degree,ie accountants, engineers)
Technical support (technicians, electricians, mechanics, etc – trades ordiploma/certificate qualified.)
Clerical and admin
Sales and related services (ie sales staff, phone sales, technical sales and service, notrepair)
Plant & machine operators and drivers (ie people with direct responsibility for operatingthe production process – plant operators, plant technicians)
Labourers and related workers (unskilled personnel, predominantly physical work)
Other – (please describe function) and use in B3
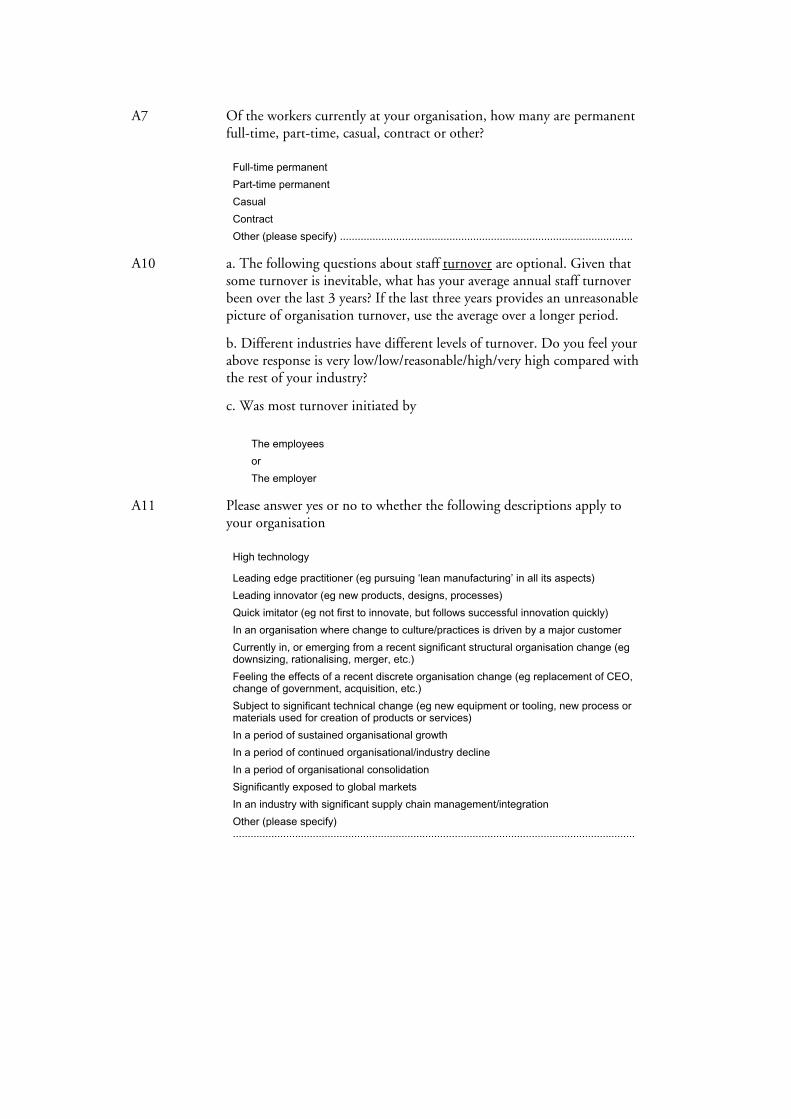
A7 Of the workers currently at your organisation, how many are permanentfull-time, part-time, casual, contract or other?
Full-time permanent
Part-time permanent
Casual
Contract
Other (please specify) ...................................................................................................
A10 a. The following questions about staff turnover are optional. Given thatsome turnover is inevitable, what has your average annual staff turnoverbeen over the last 3 years? If the last three years provides an unreasonablepicture of organisation turnover, use the average over a longer period.
b. Different industries have different levels of turnover. Do you feel yourabove response is very low/low/reasonable/high/very high compared withthe rest of your industry?
c. Was most turnover initiated by
The employees
or
The employer
A11 Please answer yes or no to whether the following descriptions apply toyour organisation
High technology
Leading edge practitioner (eg pursuing ‘lean manufacturing’ in all its aspects)
Leading innovator (eg new products, designs, processes)
Quick imitator (eg not first to innovate, but follows successful innovation quickly)
In an organisation where change to culture/practices is driven by a major customer
Currently in, or emerging from a recent significant structural organisation change (egdownsizing, rationalising, merger, etc.)
Feeling the effects of a recent discrete organisation change (eg replacement of CEO,change of government, acquisition, etc.)
Subject to significant technical change (eg new equipment or tooling, new process ormaterials used for creation of products or services)
In a period of sustained organisational growth
In a period of continued organisational/industry decline
In a period of organisational consolidation
Significantly exposed to global markets
In an industry with significant supply chain management/integration
Other (please specify)........................................................................................................................................

Section B: Value and use of qualifications
B1 Which of the following list does your organisation consider to be a‘qualification’?
Degrees (including post graduate degrees) conferred by a university or equivalent
TAFE, RTO or equivalent and trades qualifications certificates, diplomas, advanceddiplomas
Llicences, ‘tickets’, etc provided by non training bodies (eg rigging certificates ofcompetence)
Certificates of attendance or other recognition provided for participation in a course
Industry training awards (eg hospital based nursing qualifications; awards fromindustrial or professional bodies)
Certificates of school achievement (eg. VCE, Leaving Certificate, HSC or matriculation)
Are there any qualifications we have missed out? (Specify and tick)
If (a) a degree is not considered a qualification:
B1a Why is a degree not considered a qualification?
If (b) TAFE or trades qualifications are not considered a qualification:
B1b Why is a TAFE or trades quals not considered a qualification?
For the remainder of this survey, the term ‘QUALIFICATIONS’ refers to formal qualificationsgranted by a recognised educational and training organisation such as a university, TAFE,RTO etc.
B3a The researchers are testing the idea that different categories of workersmight have different requirements for skills & qualifications. Is this thecase for your organisation? Categories might includemanagers/professionals/technicians etc or quite different, like on basis oftasks performed, new versus existing workers, high versus low risk or someother factor? How do you differentiate between skills and formalqualifications required?
B3 In your organisation, how important are formal qualifications for thefollowing category of employees? Are they Essential/Important/Notimportant/Not applicable? If essential, is this because of regulatoryrequirements, company policy or both?
Managers & supervisors
Professionals
Technical support people (trades staff)
Clerical and administration
Sales and related services
Plant & machine operators and drivers
Labourers (unskilled) workers
Other – if identified in A6 ..............................................................................................
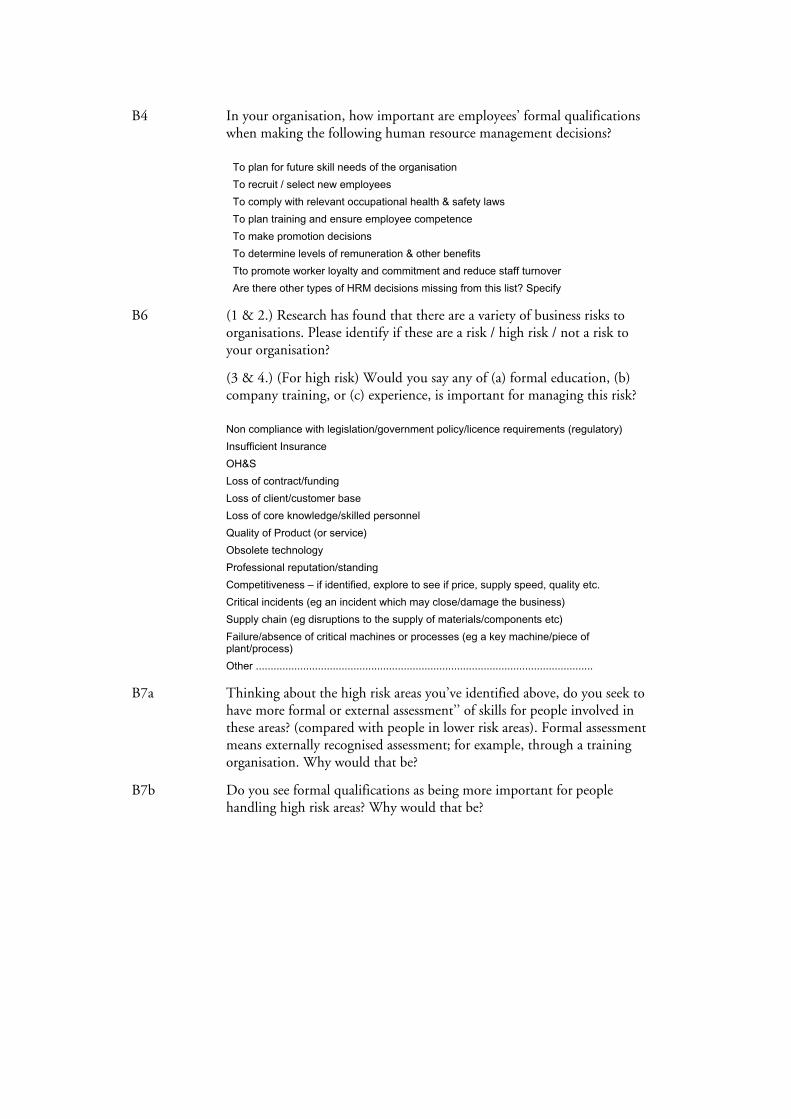
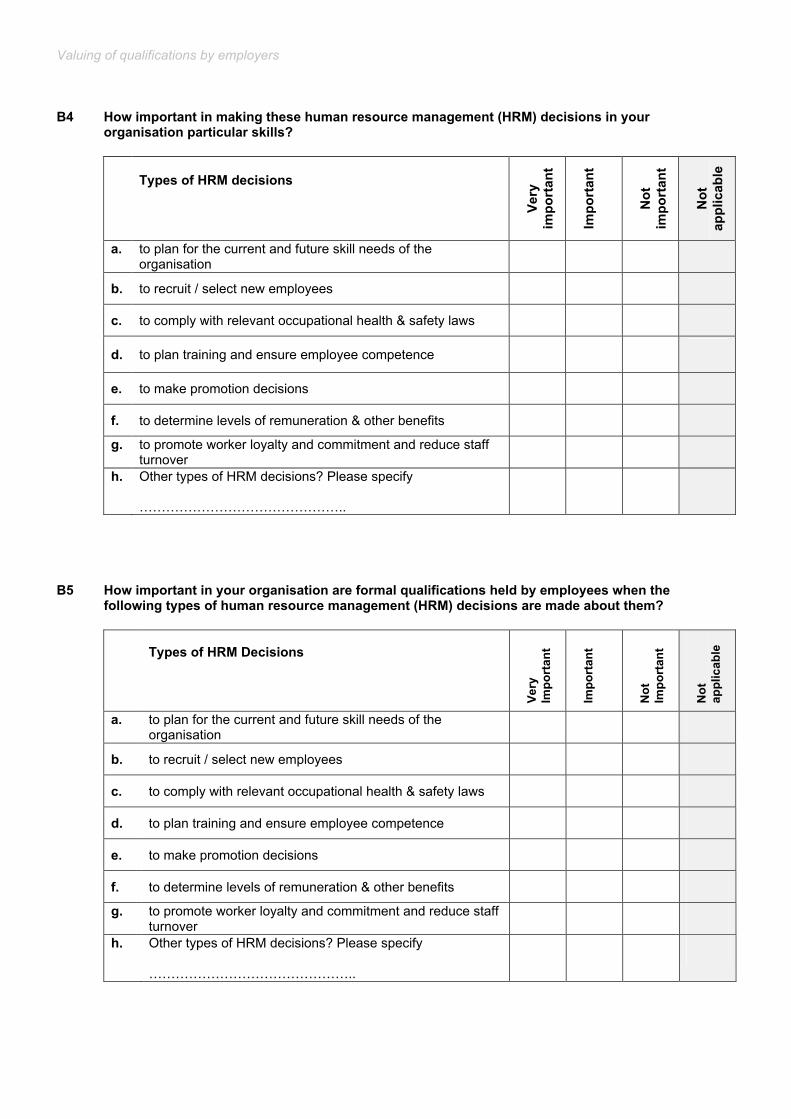
B4 In your organisation, how important are employees’ formal qualificationswhen making the following human resource management decisions?
To plan for future skill needs of the organisation
To recruit / select new employees
To comply with relevant occupational health & safety laws
To plan training and ensure employee competence
To make promotion decisions
To determine levels of remuneration & other benefits
Tto promote worker loyalty and commitment and reduce staff turnover
Are there other types of HRM decisions missing from this list? Specify
B6 (1 & 2.) Research has found that there are a variety of business risks toorganisations. Please identify if these are a risk / high risk / not a risk toyour organisation?
(3 & 4.) (For high risk) Would you say any of (a) formal education, (b)company training, or (c) experience, is important for managing this risk?
Non compliance with legislation/government policy/licence requirements (regulatory)
Insufficient Insurance
OH&S
Loss of contract/funding
Loss of client/customer base
Loss of core knowledge/skilled personnel
Quality of Product (or service)
Obsolete technology
Professional reputation/standing
Competitiveness – if identified, explore to see if price, supply speed, quality etc.
Critical incidents (eg an incident which may close/damage the business)
Supply chain (eg disruptions to the supply of materials/components etc)
Failure/absence of critical machines or processes (eg a key machine/piece ofplant/process)
Other ..................................................................................................................
B7a Thinking about the high risk areas you’ve identified above, do you seek tohave more formal or external assessment’’ of skills for people involved inthese areas? (compared with people in lower risk areas). Formal assessmentmeans externally recognised assessment; for example, through a trainingorganisation. Why would that be?
B7b Do you see formal qualifications as being more important for peoplehandling high risk areas? Why would that be?


![An Arranged [1]](https://img.pdfslide.us/doc/110x75/577cdb111a28ab9e78a73cb8/an-arranged-1.jpg)