Embed Size (px)
Citation preview
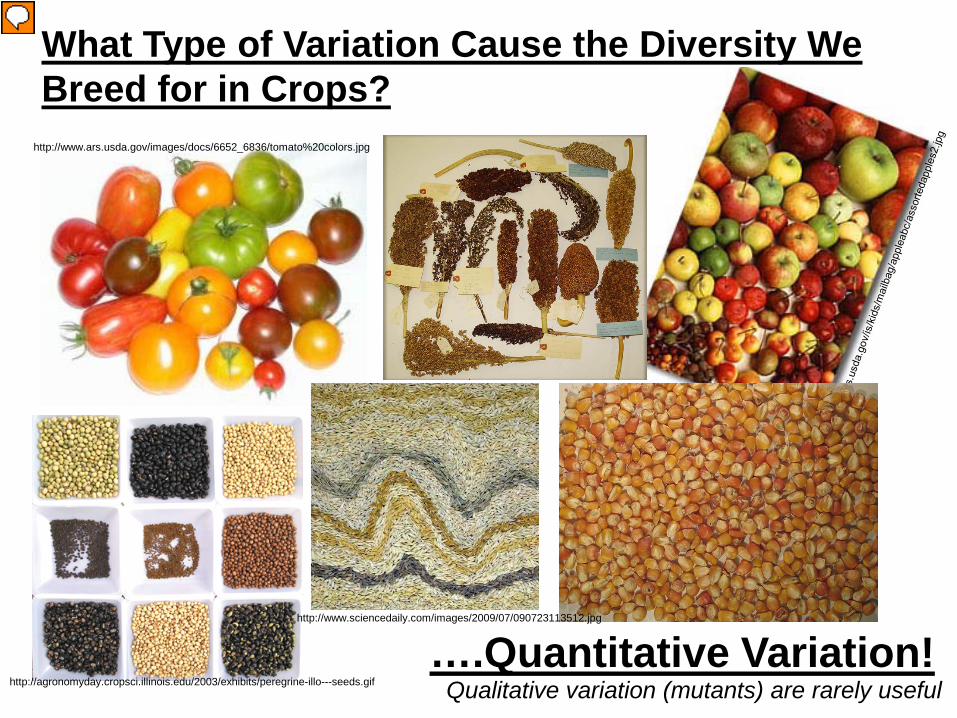
What Type of Variation Cause the Diversity We Breed for in Crops?
….Quantitative Variation!
http://www.ars.usda.gov/images/docs/6652_6836/tomato%20colors.jpg
http://agronomyday.cropsci.illinois.edu/2003/exhibits/peregrine-illo---seeds.gif
http://www.sciencedaily.com/images/2009/07/090723113512.jpg
Qualitative variation (mutants) are rarely useful
Agro 643 - Review: statistics concepts
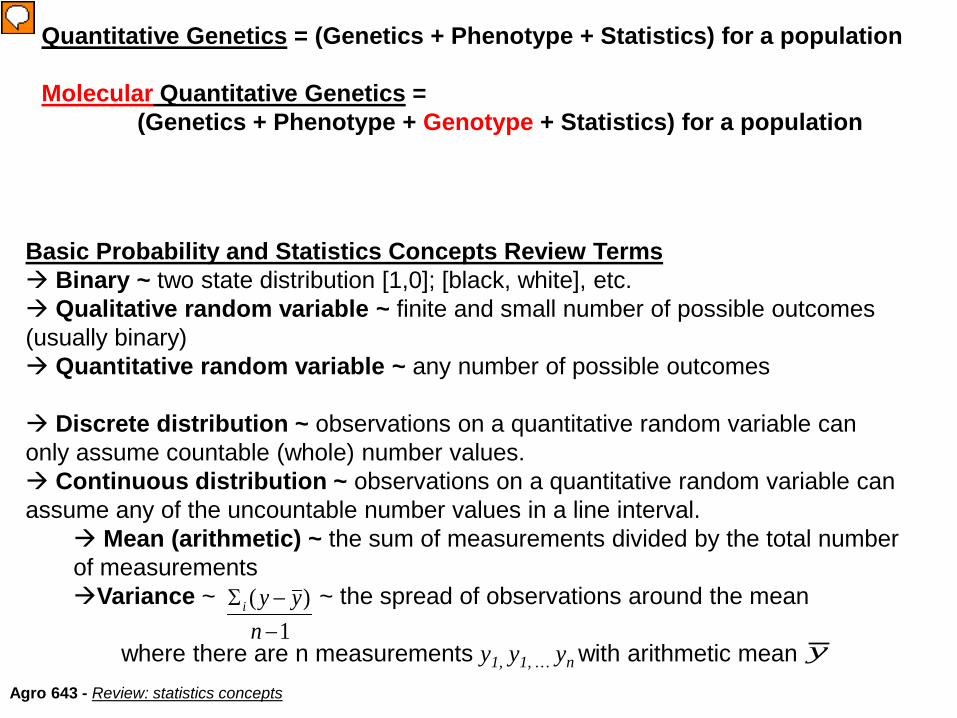
Quantitative Genetics = (Genetics + Phenotype + Statistics) for a population
Molecular Quantitative Genetics = (Genetics + Phenotype + Genotype + Statistics) for a population
Basic Probability and Statistics Concepts Review Terms Binary ~ two state distribution [1,0]; [black, white], etc. Qualitative random variable ~ finite and small number of possible outcomes (usually binary) Quantitative random variable ~ any number of possible outcomes
Discrete distribution ~ observations on a quantitative random variable can only assume countable (whole) number values. Continuous distribution ~ observations on a quantitative random variable can assume any of the uncountable number values in a line interval.
Mean (arithmetic) ~ the sum of measurements divided by the total number of measurementsVariance ~ ~ the spread of observations around the mean
where there are n measurements y1, y1, … yn with arithmetic mean1
)(−−Σ
nyyi
y

Genetic Models Additive model for height
Mean Base Height = 50cm Mean Allele a value = 0cm Mean Allele A value = 5cm
Individual AdditiveHeight
aa 50cmaA or Aa 55cmAA 60cm
Agro 643 - Review: genetics and statistics concepts
AA = 60cmAa = 55cmAa = 50cm

Quantitative Genetic Models for Means and Variances
What is a genetic model? Concrete, mathematical way to discuss the variation in a population
Why do we use these mathematical genetic models? Teaching tools, understanding is needed for later concepts Calculate gain from selection Useful for people who are designing new breeding methods and analyses “Glossy Papers” (Hallaur, 2006 – Cornell University)
Even though we talk about “allele frequencies” it is abstract and based on phenotypic information not molecular markers … though it can and is applied to markers too!
Agro 643 - Genetic Models for Means

Agro 643 - Review: statistics concepts
If only it were so simple…

Agro 643 - Review: statistics concepts
Normal DistributionFirst introduced by French mathematician A. DeMoivre in 1733 who called it the ‘exponential bell shaped curve’. German mathematician K.F. Gauss made it famous so it is called a ‘Gaussian distribution’. Because we believe (often incorrectly to simplify things) that it is found everywhere (thanks Central Limit Theorem) we now call it a normal distribution.
),(~ 2σµNX
60cm55cm50cm
Could be caused by:Other genesEnvironmental effectsGenetic by environmental
interaction (G x E)Random error
- disease- drought- soil differences- other biotic / abiotic- random chance
Num
ber o
f ind
ivid
uals

Agro 643 - Review: statistics concepts
Basic Probability and Statistics Concepts Review
Central Limit Theorem ~
1.
2.
3. When n is large, the sampling distribution of Y will be approximately normal, with approximation becoming more precise as n increases.
4. When the population distribution is normal, the sampling distribution of Y is exactly normal for any sample size n
Where Y can equal either the mean: or the sum of all y1, y1, … yn observations: Σi yn
And μy is the mean of the sample And σy is the standard deviation of the sample (the standard error)
uy=µ
ny /σσ =
y

Agro 643 - Review: genetics and statistics concepts
Basic Genetics and Statistics Concepts Review
Genetic Models – 100 F2 individuals measured for height. m genes at 50% frequency have value of 40cm/ m ... our expectation
One Additive Gene Two Additive Genes Three Additive Genes
Four Additive Genes Five Additive Genes Six Additive Genes
Height
Freq
uenc
y
50 60 70 80 90
050
000
1000
0015
0000
2000
00
Height
Freq
uenc
y
50 60 70 80 90
050
000
1000
0015
0000
2000
002
Height
Freq
uenc
y
50 60 70 80 90
0e+0
01e
+05
2e+0
53e
+05
4e+0
55e
Height
Freq
uenc
y
50 60 70 80 90
0e+0
01e
+05
2e+0
53e
+05
Height
Freq
uenc
y
50 60 70 80 90
050
000
1000
0015
0000
2000
0025
0000
300
Height
Freq
uenc
y
50 60 70 80 90
050
000
1000
0015
0000
2000
0025
0000
1 1
2
1 1
6
4 4
1 1
1 11 1 1 1
7056 56
29 29
201515
6 6
8 810 10
45 45
120 120
210 210252
924792 792
495 495
220220
66 6612 12
R: #Genetic Ratios Based on Calculation

Basic Genetics and Statistics Concepts Review
Central Limit Therom – As the number of independent random variables (genes involved in a phenotype) approaches infinity, the sum of these approaches normality
Height
Den
sity
55 60 65 70 75 80 85
0.00
0.02
0.04
0.06
0.08
Ten Additive Genes
Agro 643 - Review: genetics and statistics concepts

Height
Freq
uenc
y
60 65 70 75 80
05
1015
2025
Genetic Models – 100 individuals (n) measured for height. m genes at 50% frequency have value of 40cm/ m ... Reality...
(one simulated draw of 100 individuals for each scenario)
One Additive Gene Two Additive Genes Three Additive Genes
Four Additive Genes Five Additive Genes Six Additive Genes
Height
Freq
uenc
y
50 55 60 65 70 75 80
05
1015
2025
11
3
58
13
2123
25
Height
Freq
uenc
y
50 60 70 80 90
05
1015
2025
1 114
13
2125
13
21
Height
Freq
uenc
y
50 60 70 80 90
05
1015
2025
30
1 17
14
3125
21
Height
Freq
uenc
y
50 60 70 80 90
05
1015
2025
3035
5 6
25
3529
Height
Freq
uenc
y
50 60 70 80 90
010
2030
4050
27
52
21
2145
1112
2225
18
Agro 643 - Review: genetics and statistics concepts R: #Based on probability - Possible Sample Observations

Genetic Models – Something similar can also be observed if using limited draws using a normal distribution function.
Agro 643 - Review: genetics and statistics concepts

Agro 643 - Phenotypic Quantitative Genetics - Review: statistics concepts
Basic Genetics Models
Individual AdditiveHeight
DominanceHeight
OverdominanceHeight
aa 50cm 50cm 50cm
aA or Aa 55cm 55cm 55cm
AA 60cm 55cm 50cm

Quantitative Genetic Models for Means and Variances
ASSUMPTIONSHardy Weinberg Equilibrium (Hartl and Clark, 1997)
- The organism is diploid.- Reproduction is sexual.- Generations are non-overlapping.- The gene under consideration has two alleles.- The allele frequencies are identical in males and females.- Mating is random.- Population size is very large (in theory, infinite – no genetic drift).- Migration is negligible.- Mutation can be ignored.- Natural selection does not affect the alleles under consideration.
Additionally:No selection (e.g. human based, or flowering time difference to pollen competition)Single Locus
- No Epistasis- No Linkage
Genetic Effects ONLY- No E or G*E
Agro 643 - Genetic Models for Means

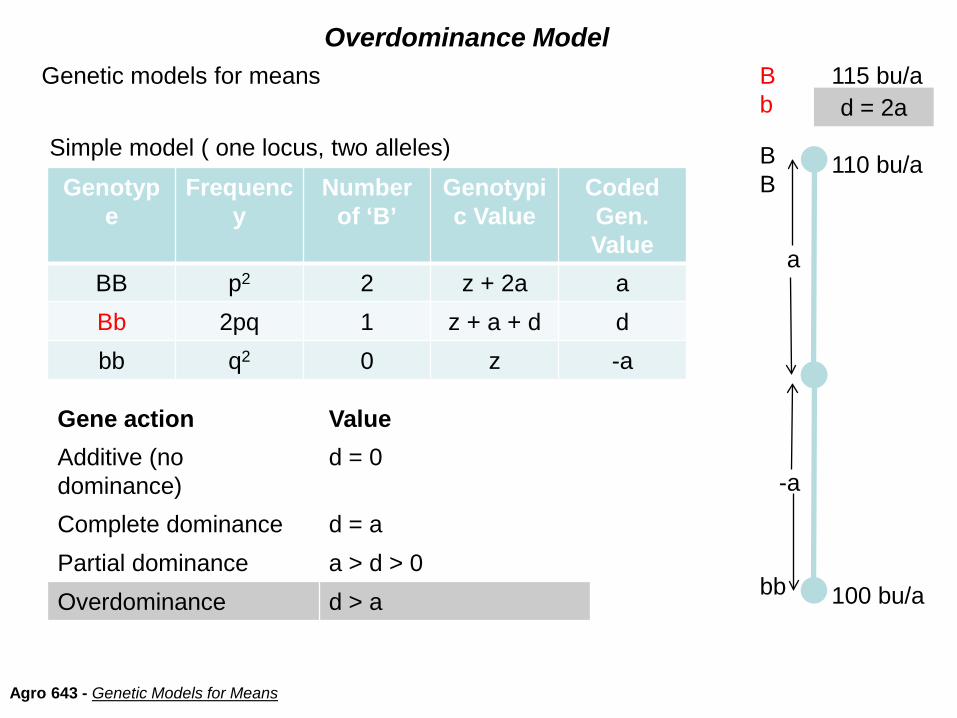
Genetic models for means
Simple model ( one locus, two alleles)
Genotype
Frequency
Numberof ‘B’
Genotypic Value
Coded Gen. Value
BB p2 2 z + 2a aBb 2pq 1 z + a + d dbb q2 0 z -a
BB
bb
Bb
110 bu/a
105 bu/a
100 bu/a
Gene action ValueAdditive (no dominance)
d = 0
Complete dominance d = aPartial dominance a > d > 0Overdominance d > a
a
-a
Additive Model
Agro 643 - Genetic Models for Means

Genetic models for means
Simple model ( one locus, two alleles)
Genotype
Frequency
Numberof ‘B’
Genotypic Value
Coded Gen. Value
BB p2 2 z + 2a aBb 2pq 1 z + a + d dbb q2 0 z -a
BB
bb
Bb
110 bu/a
100 bu/a
Gene action ValueAdditive (no dominance)
d = 0
Complete dominance d = aPartial dominance a > d > 0Overdominance d > a
a
-a
Complete Dominance Model
Agro 643 - Genetic Models for Means

Genetic models for means
Simple model ( one locus, two alleles)
Genotype
Frequency
Numberof ‘B’
Genotypic Value
Coded Gen. Value
BB p2 2 z + 2a aBb 2pq 1 z + a + d dbb q2 0 z -a
BB
bb
Bb
110 bu/a
107.5 bu/a
100 bu/a
Gene action ValueAdditive (no dominance)
d = 0
Complete dominance d = aPartial dominance a > d > 0Overdominance d > a
d = ½ aa
-a
Partial Dominance Model
Agro 643 - Genetic Models for Means
Genetic models for means
Simple model ( one locus, two alleles)
Genotype
Frequency
Numberof ‘B’
Genotypic Value
Coded Gen. Value
BB p2 2 z + 2a aBb 2pq 1 z + a + d dbb q2 0 z -a
BB
bb
Bb
110 bu/a
115 bu/a
100 bu/a
Gene action ValueAdditive (no dominance)
d = 0
Complete dominance d = aPartial dominance a > d > 0Overdominance d > a
d = 2a
a
-a
Overdominance Model
Agro 643 - Genetic Models for Means

Genotype
Frequency
Numberof ‘B’
Genotypic Value
Coded Gen. Value
BB p2 2 z + 2a aBb 2pq 1 z + a + d dbb q2 0 z -a
Extended to a population the mean of the population reflects the proportional value of its individuals. Thus, it depends on both allele frequency and level of dominance.
aqpqdapX 22 2 −+=Population
Mean =
p (B) q (b) a d0.5 0.5 2 2 10.5 0.5 2 1 0.50.7 0.3 2 2 1.640.7 0.3 2 1 1.220.3 0.7 2 2 0.440.3 0.7 2 1 -0.38
X
pqdq)a(pX 2+−=
Which reduces to:pqd)aq(pX 222 +−=
Which reduces to:
Population Genetic Mean
Agro 643 - Genetic Models for Means
R: #C
alculate population means

An alleles average effect is dependent on population allele frequency and allele effect.
Additive (no dominance) - d=0, a=2Complete dominance - d=2, a=2Partial dominance - d=1, a=2Overdominance - d=2, a=1(*Note ‘a’ value is shown lower to fit the same scale)
Genetic Models for Means
Agro 643 - Genetic Models for Means
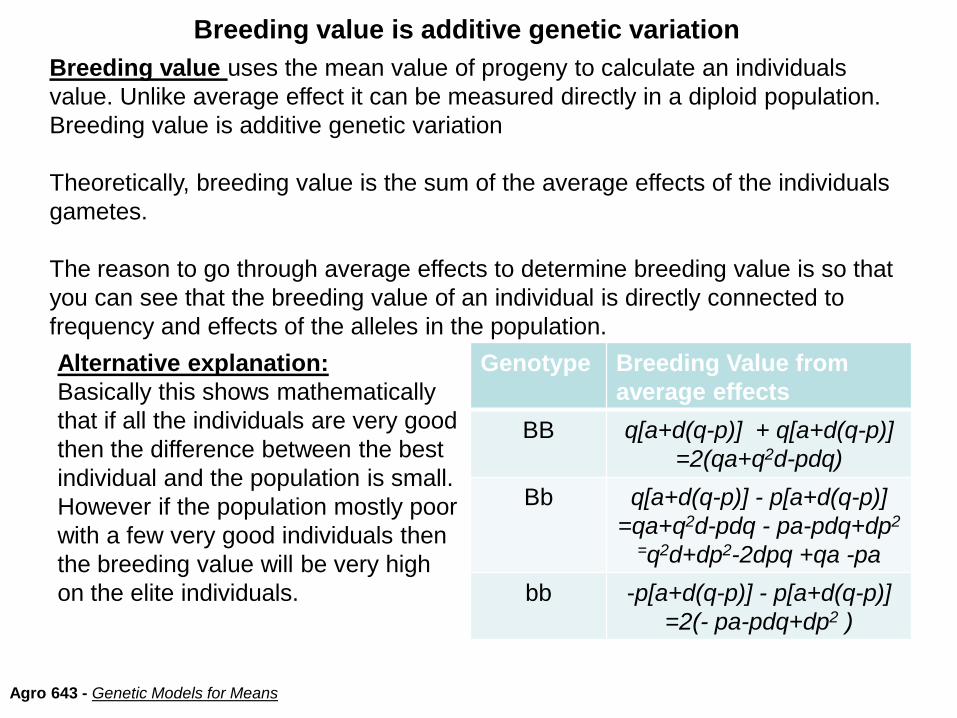
Breeding value uses the mean value of progeny to calculate an individuals value. Unlike average effect it can be measured directly in a diploid population. Breeding value is additive genetic variation
Theoretically, breeding value is the sum of the average effects of the individuals gametes.
The reason to go through average effects to determine breeding value is so that you can see that the breeding value of an individual is directly connected to frequency and effects of the alleles in the population.
Genotype Breeding Value from average effects
BB q[a+d(q-p)] + q[a+d(q-p)] =2(qa+q2d-pdq)
Bb q[a+d(q-p)] - p[a+d(q-p)]=qa+q2d-pdq - pa-pdq+dp2
=q2d+dp2-2dpq +qa -pabb -p[a+d(q-p)] - p[a+d(q-p)]
=2(- pa-pdq+dp2 )
Breeding value is additive genetic variation
Agro 643 - Genetic Models for Means
Alternative explanation:Basically this shows mathematically that if all the individuals are very good then the difference between the best individual and the population is small. However if the population mostly poor with a few very good individuals then the breeding value will be very high on the elite individuals.

Dominance deviation is the difference between the genotypic value (what we observe) and the breeding value (which we must calculate)
Dominance deviation = Genotypic value – Breeding Valued = G – a
Or G = a + dGenotypic value = Breeding Value + Dominance deviation
Genotype Genotypic (G) value
G - population mean
G - population mean ( insert α = a + d (q-p)
BB a = a - a(p-q) +2dpq= 2q(a-pd)
= 2q(a-pd)= 2q(α-qd)
Bb d = d - a(p-q) +2dpq= a(q-p) + d(1-2pq)
= a(q-p) + d(1-2pq)= α (q-p) + 2pqd
bb -a = -a - a(p-q) +2dpq= 2p(a+qd)
= 2p(a+qd)= 2p(α+pd)
The Dominance Deviation is Caused by Dominance Effects
Agro 643 - Genetic Models for Means

Has Dominance Heterosis Increased in Maize?Few studies have looked at if heterosis has increased in maize over time.
The one study I am aware of:DUVICK, D. N., 1999 Heterosis: feeding people and protecting natural resources, pp. 19–29 in The Genetics and Exploitation of Heterosis in Crops, edited by J. G. COORS and S. PANDEY. ASA-CSSA-SSSA Societies, Madison, WIShows:
Agro 643 – Heterosis in maize
Single Cross Yield
Mid Parent Value

Genetic Models for Means Summary- Dominance causes differences between genotypic values and breeding values
When intermating in a diverse HWE population:- Recessive homozygotes (-/-) give progenies that appear much better than themselves with most progeny (+/-)
- Heterozygotes (+/-) look better than their progeny as they produce (-/-)
-Dominant homozygotes (+/+) give progenies that can appear slightly better than themselves with (+/+) progeny and (+/-).
- Slope of the regression line is the average effect of a gene substitution α = α1 –α2
- Breeding values and population mean are on the regression line
- Regression depends on gene frequency and effects
Agro 643 - Genetic Models for Means

For Inbreeding, A Way to Think About Genetic Means Across Different Generations
P1 = m + aP2 = m – aF1 = m + dF2 = m + ½dFn = m +(½)n-1dBC11 = m + ½a + ½dBCn1 = m + [1-(1/2) n]a +(½)n dBC12 = m - ½a + ½dBCn2 = m - [1-(1/2) n]a +(½)n d
P1
P2
d
-a
a
m
d/2
d/4d/8
F1
F2
F3F4
Agro 643 - Genetic Models for Variances

Agro 643 - Genetic Models for Variances
Genetic Models for VariancesThe expected population mean of the next generation indicates how much variance is in the population for breeding improvement through selection.
While the red and the blue populations below have the same mean and are the same size, they have different variances for height.
If we select the top 10% of plants to produce a new generation (assuming additive effects only).
σ= 5, σ = 10
R: Population Mean and Variance Normal Distribution

Agro 643 - Genetic Models for Variances
Genetic Models for VariancesThe expected population variance indicates how much variance is in the population for breeding improvement (selection) . This is a function of allele frequency as well as additive and dominant effects.
2222222 ]2)[(2 pqdaqpaqpqdap +−−−+=σPopulation Variance =
])21()(2[2 222 dpqadpqapq −+−+=σ
Thus, when p=q= ½ then our expected σ2 = ½ a2 + ¼ d2
]))5.0)(5.0(21()5.05.0(2)[5.0)(5.0(2 222 dada −+−+=σ
])5.1()[5.0( 222 da −+=σ
The total genetic variance can be broken down into additive and dominance deviation 222
DAG σσσ +=
22222 4])([2 dqpdpqapqG +−+=σ

The Genetic Variance for All Models is a Function of Allele Frequency The expected population mean indicates how much variance is in the population for breeding improvement (selection) .
σG2
σd2 = σa
2 = 2
Com
plet
e do
min
ance
σG2
σd2 = 0
σa2 = 2
Add
itive
(no
dom
inan
ce)
Extr
eme
Ove
rdom
inan
ceσG
2
σd2 = 1000
σa2 = 1
Ove
rdom
inan
ce
σG2
σd2 = 2
σa2 = 1
Agro 643 - Genetic Models for Variances

Sources of Genetic Variance in Different Inbred Generations
σa2 Total
σa2 Between
σa2 Within
σd2 Total
σd2 Between
σd2 Within
F - inbreeding Coefficient
*Genetic variance between inbred families increase and within families decreases with inbreeding
*Total genetic variance doubles from F=0 to F=1
*When F=1 all variance is additive
Agro 643 - Genetic Models for Variances
NOTE: Should be discrete (points) not a continuous line graph…only shown for clarity

Genetic Models for Variances
Back to Reality … Why does this not work for your population?- Random Mating ( Impossible)
- Epitasis effect ( Gets very complex )
- Genes Independent / no linkage ( Impossible)
- No selection ( Near impossible - no matter how hard you try)
- Environmental effects
- Population size
Agro 643 - Genetic Models for Variances

Population Genetics: Genetic DriftThis is much easier to observe using simulations…
N = 10 N = 100
N = 1000
Ten simulations each with p=.5
Agro 643 - Review: population genetics
Agro 643 - Review: statistics concepts
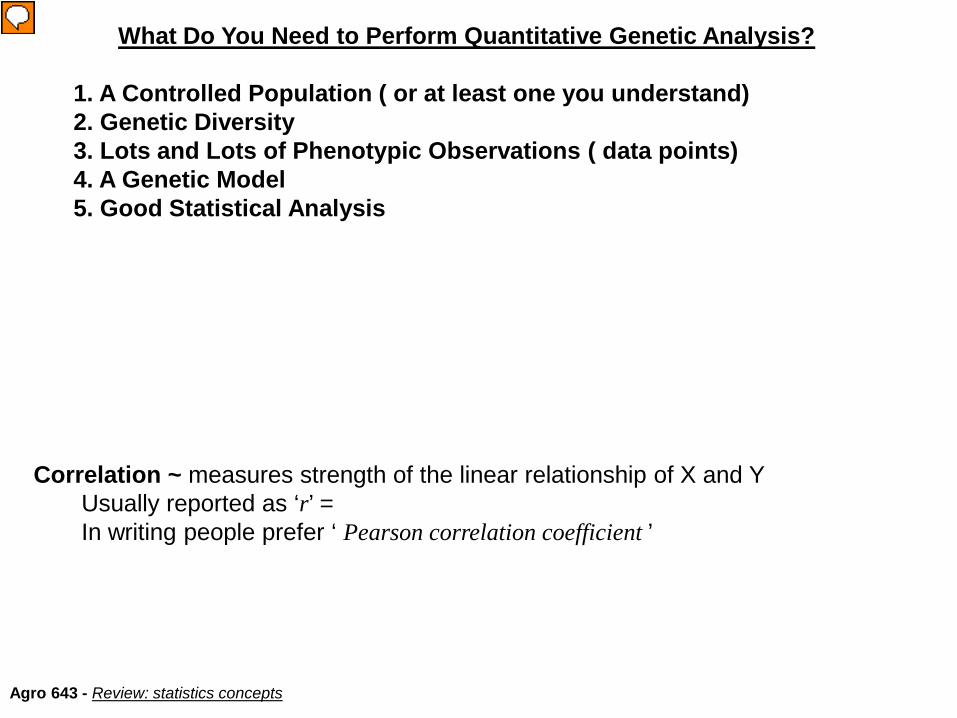
What Do You Need to Perform Quantitative Genetic Analysis?
1. A Controlled Population ( or at least one you understand)2. Genetic Diversity3. Lots and Lots of Phenotypic Observations ( data points)4. A Genetic Model5. Good Statistical Analysis
Correlation ~ measures strength of the linear relationship of X and YUsually reported as ‘r’ = In writing people prefer ‘ Pearson correlation coefficient ’

Agro 643 - Review: statistics concepts
Heritability - Parent Offspring Regression
Correlation ~ measures strength of the linear relationship of X and YUsually reported as ‘r’ = In writing people prefer ‘ Pearson correlation coefficient ’
http://www.biology.duke.edu/rausher/heritability.JPGHeritability ~ The amount of phenotypic variation attributable to genetics

“Citing the well-known correlation between obese dogs and their owners, Marc kept his
New-Year’s resolution to get fit”
Causation can not be deduced from correlation!

Agro 643 - Review: probability theory and statistics
What is Random?What is Significant?Meeting an acquaintance in the backstreets of Venice?
iPod shuffle playing three Jay-Z songs in a row?
Height and flowering time being correlated?
Winning at slots?

Agro 643 - Phenotypic Quantitative Genetics - Review: statistics concepts
Hypothesis Testing
Null hypothesis is True
Null hypothesis is False
Reject the Null Hypothesis
Type 1 Error!α
Fail to Reject the Null Hypothesis
Type 2 Error!β
Type III error: provides the right answer to the wrong question (discrepancy between the research focus and the research question )

All Breeders Need Genetic Diversity…
…What Does Genetic Diversity Mean to You?
Agro 643 - Review: population genetics
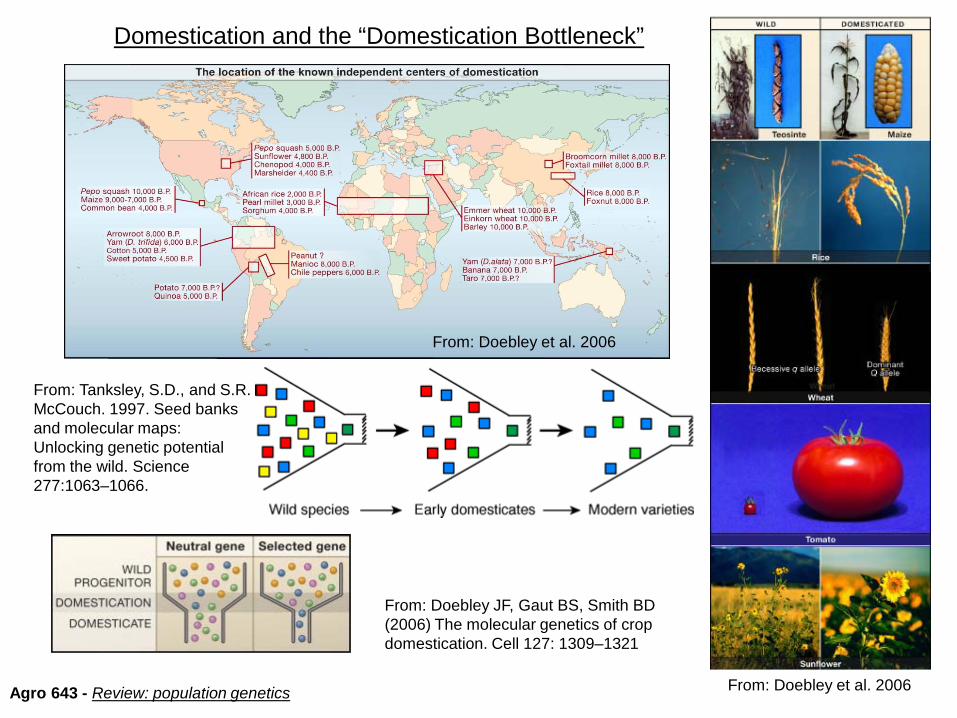
Domestication and the “Domestication Bottleneck”
Agro 643 - Review: population genetics
From: Doebley JF, Gaut BS, Smith BD (2006) The molecular genetics of crop domestication. Cell 127: 1309–1321
From: Tanksley, S.D., and S.R. McCouch. 1997. Seed banks and molecular maps: Unlocking genetic potential from the wild. Science 277:1063–1066.
From: Doebley et al. 2006
From: Doebley et al. 2006

Genetic Diversity – What does it mean?
Diversity is a relative term:In this class we will use genetic diversity when referring to many diversity levels. Similarly geneticists and breeders mean different things when talking about diversity. Make sure it is clear at what level we are interested in!
Genetic diversity (GD) of all wild and cultivated wheat
GD of all cultivated wheat
GD in Elite TAMU material
GD in KSU program
GD in TAMU program
GD in MSU program
GD in a specific bi-parental derived population
Agro 643 - Review: population genetics