Embed Size (px)
Citation preview

Re-evaluating media
What the evidence reveals about the true worth of
media for brand advertisers

Contents
3 Introduction
4 Key takeouts
5 Implications
6 How the study was done
7 Findings in detail
8 most important attributes of an advertising medium
9 How each medium performs against attributes
20 overall performance ranking
21 Future of media
22 Appendices
22 appendix 1: secondary research sources
22 appendix 2: secondary research scoring framework
23 appendix 3: secondary research evidence

intRoduCtion
the media landscape has
undergone a seismic shift over the
last decade with latest data from
the advertising association and
WaRC showing that online media1
accounted for an unprecedented
51% of advertising spend in 2016.
at ebiquity alarm bells have been
ringing for some time. our analytics
work is repeatedly showing that
advertisers are not getting return on
online investment and our concerns
about transparency in programmatic
advertising have been well
documented.
so the time felt right when the
Radiocentre came to us for an
independent, impartial and robust
re-evaluation of the value of online
and offline media.
it meant that we could take a step
back to re-assess what qualities
are required from an advertising
medium to deliver a campaign that
grows the brand in the long term.
our study – ‘re-evaluating media’ –
set out to do the following:
1. identify what advertisers and
agencies consider to be the most
important attributes in delivering
a brand-building campaign
2. evaluate how each medium
performs against these attributes
through a comprehensive review
of published research and
ebiquity’s proprietary data sets
3. Contrast this with views gathered
from interviews with over 100
advertisers and agencies on how
they see each medium perform
4. Produce an overall ranking of
relative value of each medium
based on the evidence that we
have collected
5. get a sense of where advertisers
and agencies see the industry
going.
the findings reveal that it is time for
the industry to re-evaluate media
decisions to optimise advertising
budgets.
Finally, i’d like to thank all our
interviewees who gave up their
valuable time to take part in this study.
morag Blazey, managing Principal
ebiquity | intel
Re-evaluating Media
3
1. Online media defined as internet, broadcaster VOD, digital newsbrands and digital magazines, Advertising Association and WARC 2016.

Key taKeoutsThe five most important media attributes for growing
a brand in the longer term are:
1. targeting the right people in the right place at the
right time
2. increasing campaign Roi
3. triggering a positive emotional response
4. increasing brand salience
5. maximising campaign reach.
Judged against these TV and radio are top overall.
Combining our evidence scores from all 12 attributes firmly
places tv as the best performing medium, followed by
radio, newspapers, magazines and out of home. online
display is the weakest performer.
With the exception of tv, advertisers undervalue
traditional media, especially radio. they overrate the value
of online video and paid social.
there is a clear disconnect between the scale of
investment in online media and the value it delivers.
Re-evaluating the media mix may help advertisers better
achieve long-term brand growth.
Re-evaluating Media
4 5

Re-evaluating Media
5
imPliCationsebiquity’s view on the implications of the findings.
Re-evaluate the media mix
there is strong evidence from this research that digital
advertising, especially online display, is not performing as
well as other media in delivering the qualities required for
a long-term brand-building campaign. this is at odds with
the scale of investment in online advertising. advertisers
should re-evaluate the media mix to ensure they are using
the most effective combination of media for their brand.
tv and radio stand out as ticking all the boxes for a
brand-building campaign but radio, it would seem, is
undervalued by advertisers and agencies. used creatively,
radio is a cost-effective way of extending reach, building
brand salience and optimising Roi.
Targeting – getting the balance right
targeting is the single most important attribute of a brand-
building campaign. advertisers quite rightly see digital
media excelling for their highly sophisticated targeting
potential. our view is that there is a balance to achieve
here because conventional targeting is still effective. P&g
discussed how they had taken granular targeting too far
when marc Pritchard (Chief marketing officer) said he was
scaling back Facebook spend: “We targeted too much,
and we went too narrow,” “and now we’re looking at: What
is the best way to get the most reach but also the right
precision?”2
Be in control of programmatic
the research has highlighted some concerns about
programmatic targeting. We’ve been calling for greater
accountability and transparency in programmatic trading
for some time. our advice to clients is to be in control
of how they allocate, audit, and manage programmatic
spend, vendors, data, and technology.
Media owners need to prove it works
traditional media, and notably radio, have a robust
body of research evidence to prove the medium works.
there is little such research for online media and this is
something we think the online industry should invest in.
it will be in everyone’s interest to get a true perspective
on the effectiveness of online advertising and build
understanding of how to get the very best from the
platform.
Keep improving creativity
no matter how effective the medium, the key to success
is good creative. a key theme running across the research
is the need for advertisers to strike the right balance
between creatively integrating campaigns across media
and optimising them for each platform.
2. The Wall Street Journal 17/8/16.

HoW tHe study Was done
We conducted primary and secondary research between
october 2017 and January 2018.
Primary research
We carried out a total of 116 in-depth telephone interviews
with advertisers and agencies.
• Advertisers n=68 marketers and media experts in
companies spending £2m+ on advertising in the last year.
• Agencies n=48 media buying agencies (n=30), full
service agencies (n=13) and creative agencies (n=5).
interviewees were not informed that the research was
commissioned by the Radiocentre. all research was carried
out in accordance with the Code of Conduct of the market
Research society.
Secondary research
We searched over 50 sources and reviewed more than 75
published reports to find supporting evidence on how well
a medium performs. to qualify for inclusion the research
study had to be recent (i.e. most published since 2010) with
a transparent methodology and in the public domain.
We supplemented this with analysis of ebiquity’s
proprietary data – norms from our data pools on CPt, profit
Roi and other effectiveness measures. We also accessed
industry tools such as iPa touchpoints for reach and
frequency analysis.
Assessing performance on each attribute
We developed scoring criteria to rate media performance
on each attribute. the approach to this varied depending
on the attribute and nature of data available:
• straightforward comparison of data (e.g. CPt)
• objective assessment of structural capabilities (e.g. yes,
yes with limitations, no)
• score allocated objectively based on combining findings
from a range of research studies.
the scoring was applied and validated by a team of
ebiquity experts.
Full details of the secondary research sources and
scoring framework we used can be found in the
appendices of this report.
The media channels we evaluated
• Cinema
• Direct mail – direct mail and door drops
• Magazines – print
• Newspapers – print
• Online display – non-video display and banner ads
• Online video – all video formats including youtube and
broadcaster vod
• Out of home – all formats – roadside, airports, rail, point
of sale etc.
• Radio – broadcast
• Social media – paid advertising on Facebook, twitter etc.
• TV – all formats excluding broadcaster vod
Re-evaluating Media
6

Findings in detail
7

most imPoRtant attRiButes oF an adveRtising medium
Targetability is rated as the most important attribute
advertisers and advertising agencies face a wide array
of choices when it comes to selecting the right medium
for a brand-building campaign.
We wanted to understand which attributes they consider
to be most important and which media they perceive to
meet those requirements best.
Relative importance was evaluated using maxdiff
analysis where interviewees were asked to trade off
the most and least important attributes in a number of
different combinations.
overall, the ability to target the right people in the
right place at the right time is rated as the single most
important attribute of an advertising medium.
agencies rate targeting as the most important attribute,
full stop. For advertisers the ability of a campaign to
trigger a positive emotional response is just ahead. not
surprisingly, brand salience is particularly important for
advertisers in the FmCg sector.
Return on investment is, of course, right up there for both
advertisers and agencies, with maximising campaign
reach also deemed valuable.
other qualities, like being able to guarantee a safe
environment and production costs, while still important
considerations in their own right, were not seen to be as
important when people were forced to make the choice
between attributes.
Re-evaluating Media
8
Most important attributes of an advertising medium
Q. Thinking now about selecting the right media mix to deliver a campaign that grows your brand in the longer term, we’d like to ask you ten very short questions about the importance
of different attributes of an advertising medium. For each question I will read out four attributes, please tell me which one is most important and which one is least important. Relative
importance calculated using MaxDiff analysis. Base: n=116.
Targets the right people in the right place at the right time
Increases campaign ROI
Triggers a positive emotional response
Increases brand salience
Maximises campaign reach
Gets your ads noticed
Low cost audience delivery
Builds campaign frequency
Guarantees a safe environment
Short-term sales response
Transparent third party audience measurement
Low production cost
Average preference Index = 100
Relative importance (index)
250
232
231
226
113
60
34
25
12
9
7
1

HoW eaCH medium PeRFoRms against attRiButes
Targets the right people in the right place at the right time
Online addressability shapes advertiser perceptions of targeting capabilities
ebiquity’s objective analysis of whether an advertising
medium can target audiences across a number of
different axes puts radio at the top of the list. our
analysis shows that radio is the most flexible medium
as it can be used to target audiences by geography,
demographics, context, time of day, day of week and,
to a more limited extent, addressably for listeners on
connected devices.
But for advertisers and agencies it is clear that targeting
now mostly means individualised, addressable targeting,
hence direct mail and paid social media scored highest
in terms of perception.
“Direct mail allows for very accurate targeting.”
media buying agency
“With social media we have the exact data on who we
are reaching...so we are able to focus our message to
them.” advertiser, household/home
Radio, by contrast, is generally perceived as relatively broad
brush, although highly rated by advertisers looking to target
contextually – for example, reaching drive-time audiences.
“Radio doesn’t target a very specific focused audience.”
advertiser, utilities
Re-evaluating Media
9
Targets the right people in the right place at the right time
What the evidence says
1 Radio 9
2 = Social media (paid) 8
2 = TV 8
4 = Online display 7
4 = Cinema 7
6 = Direct mail 6
6 = Out of home 6
6 = Online video 6
9 Newspapers 5
10 Magazines 3
EVIDENCE Ebiquity’s score based on whether a medium can be bought by geography,
demographics, day of week. time of day, contextually, addressably (each scored 0–2
where 0=no, 1=yes with limitations, 2=yes). See Appendix 3 for full details on how this
ranking has been calculated.
What advertisers and agencies say
1 Direct mail 4.0
2 Social media (paid) 3.9
3 = TV 3.7
3 = Online video 3.7
5 Online display 3.6
6 Cinema 3.2
7 = Out of home 3.1
7 = Magazines 3.1
9 = Radio 3.0
9 = Newspapers 3.0
PERCEPTION Mean score. Q. Using a scale of 1–5 where 5 is ‘very good’ and 1 is ‘very
poor’, please rate each medium for its ability to target the right people in the right
place at the right time. Base: n=20.
increases campaign Roi
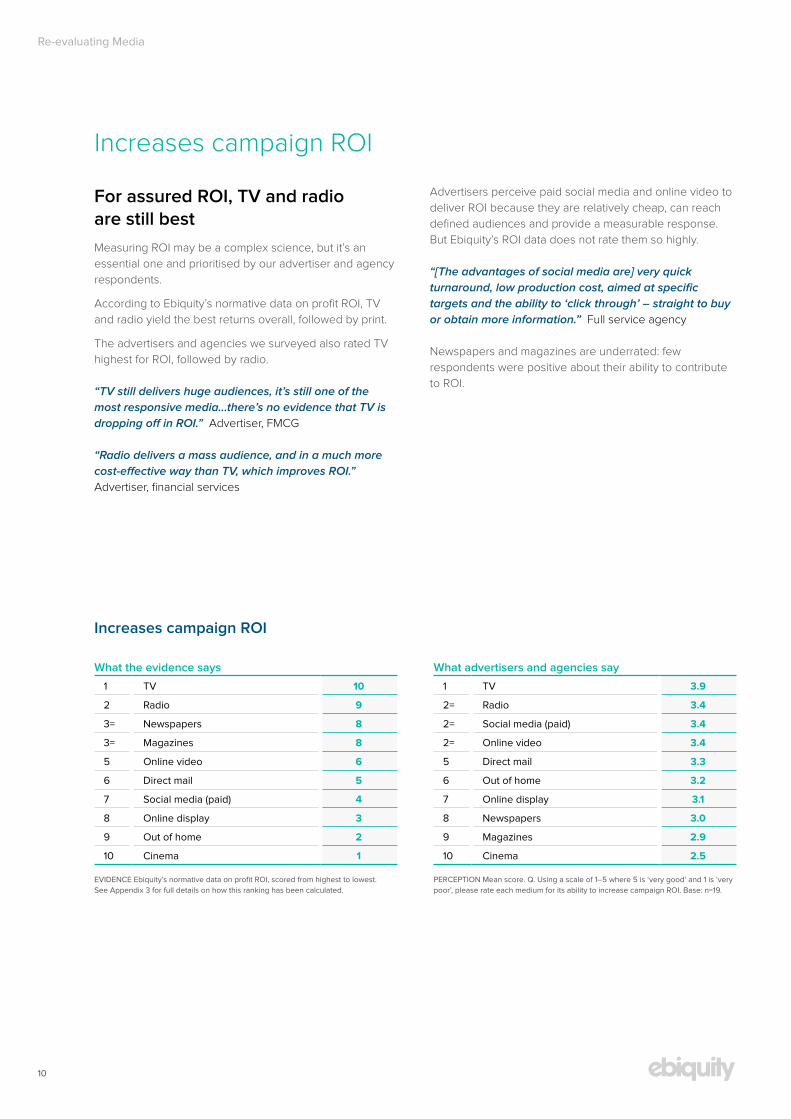
For assured ROI, TV and radio are still best
measuring Roi may be a complex science, but it’s an
essential one and prioritised by our advertiser and agency
respondents.
according to ebiquity’s normative data on profit Roi, tv
and radio yield the best returns overall, followed by print.
the advertisers and agencies we surveyed also rated tv
highest for Roi, followed by radio.
“TV still delivers huge audiences, it’s still one of the
most responsive media…there’s no evidence that TV is
dropping off in ROI.” advertiser, FmCg
“Radio delivers a mass audience, and in a much more
cost-effective way than TV, which improves ROI.”
advertiser, financial services
advertisers perceive paid social media and online video to
deliver Roi because they are relatively cheap, can reach
defined audiences and provide a measurable response.
But ebiquity’s Roi data does not rate them so highly.
“[The advantages of social media are] very quick
turnaround, low production cost, aimed at specific
targets and the ability to ‘click through’ – straight to buy
or obtain more information.” Full service agency
newspapers and magazines are underrated: few
respondents were positive about their ability to contribute
to Roi.
Re-evaluating Media
10
Increases campaign ROI
What the evidence says
1 TV 10
2 Radio 9
3= Newspapers 8
3= Magazines 8
5 Online video 6
6 Direct mail 5
7 Social media (paid) 4
8 Online display 3
9 Out of home 2
10 Cinema 1
EVIDENCE Ebiquity’s normative data on profit ROI, scored from highest to lowest.
See Appendix 3 for full details on how this ranking has been calculated.
What advertisers and agencies say
1 TV 3.9
2= Radio 3.4
2= Social media (paid) 3.4
2= Online video 3.4
5 Direct mail 3.3
6 Out of home 3.2
7 Online display 3.1
8 Newspapers 3.0
9 Magazines 2.9
10 Cinema 2.5
PERCEPTION Mean score. Q. Using a scale of 1–5 where 5 is ‘very good’ and 1 is ‘very
poor’, please rate each medium for its ability to increase campaign ROI. Base: n=19.

triggers a positive emotional response
Traditional media have the emotional edge
For brand love, and laughs, turn to traditional media for the
greatest impact.
this is what we concluded from a thorough assessment of
existing research, and advertisers and agencies agreed,
for the most part.
“With cinema you have a captive audience in front of a
huge screen with good sound. This gives off a powerful
emotional atmosphere that is focused directly at
people.”
advertiser, household/home
tv, similarly, was perceived to engage people more
emotionally than most other media channels.
advertisers see the advantage of radio in that it tends to
be consumed in the listener’s personal space and feels
like there’s a one-on-one connection with the presenter
or the music.
“Radio is such a personal medium. The reach tends
to be in the home, which immediately gives it an
emotional edge. A good creative can really trigger an
emotional response using the imagination and
emotions with words and music.”
Full service agency
the online environment generally is just not considered
a good medium for emotional response. most advertisers
and agencies did think online video can be quite effective
but there was no evidence of this in the secondary
research we analysed.
Re-evaluating Media
11
Triggers a positive emotional response
What the evidence says
1 Cinema 10
2= TV 9
2= Radio 9
2= Magazines 9
5= Newspapers 8
5= Out of home 8
7 Direct mail 7
8 Social media (paid) 6
9= Online display 3
9= Online video 3
EVIDENCE Secondary research findings on emotional connection and seamless
experience, scored from high to low on strength of evidence. See Appendix 3 for full
details on how this ranking has been calculated.
What advertisers and agencies say
1 Cinema 4.3
2 TV 4.1
3 Online video 3.7
4 Radio 3.4
5= Social media (paid) 3.1
5= Magazines 3.1
7 Out of home 2.9
8 Newspapers 2.6
9 Direct mail 2.4
10 Online display 2.3
PERCEPTION Mean score. Q. Using a scale of 1–5 where 5 is ‘very good’ and 1 is ‘very
poor’, please rate each medium for its ability to trigger a positive emotional response.
Base: n=20.

increases brand salience
TV is the star medium for building brand salience
all advertisers and agencies questioned rated tv as either
fairly or very good on this score. two other visual media –
out of home and cinema – made up their top three.
“If you want to hit a ton of people in a creative way and
get your message across, there’s really no better way
than TV. It’s expensive but it does the job.”
advertiser, telecoms/technology
Cinema is valued for its big screen aura and impact.
“Advertising is not as cluttered as on TV: the average
audience will see 6 adverts in a film…whereas in
the same time on TV the audience will probably see
approximately 40 adverts. This makes the adverts in the
cinema far more memorable.”
advertiser, FmCg
as for the secondary evidence, this elusive attribute is the
subject of a number of comparative studies across the
industry including media in Focus (iPa, 2017), metrics that
matter (magnetic, 2016) and Building Box office Brands
(dCm, 2016).
the published studies back up tv’s top spot for increasing
salience, but rank newspapers, magazines and radio
higher up the table.
online display emerges as relatively ineffective for brand
salience.
“It’s really hard to make a static display ad interesting
or engaging now – people are just not interested and
actively do not want them interfering with their viewing.”
Full service agency
Re-evaluating Media
12
Increases brand salience
What the evidence says
1 TV 10
2= Newspapers 8
2= Magazines 8
2= Radio 8
5= Direct mail 5
5= Online video 5
7 Out of home 5
8= Cinema 4
8= Online display 4
8= Social media (paid) 4
EVIDENCE Secondary research on brand salience. Scoring based on average rank
from multiple comparative studies. See Appendix 3 for full details on how this ranking
has been calculated.
What advertisers and agencies say
1 TV 4.6
2 Out of home 3.8
3 Cinema 3.7
4= Social media (paid) 3.4
4= Magazines 3.4
6 Online video 3.3
7 Radio 3.1
8 Newspapers 3.0
9 Online display 2.7
10 Direct mail 2.6
PERCEPTION Mean score. Q. Using a scale of 1–5 where 5 is ‘very good’ and 1 is
‘very poor’, please rate each medium for its ability to increase brand salience. Base:
n=19.

maximises campaign reach
Out of home, TV and radio are right for reach
need to reach a mass target audience? the evidence
(derived from iPa touchpoints and industry sources) backs
up advertisers’ and agencies’ views that out of home, tv
and radio are most effective.
“TV is just the medium which people consume more
than any other medium. Other platforms cost more
for the numbers you reach.”
media buying agency
“Touchpoint run on all adults, radio reaches 90 per
cent. After TV and out of home it is the best in
maximising reach.”
Full service agency
Maximises campaign reach
What the evidence says
1 Out of home 10
2 TV 9
3 Radio 8
4= Direct mail 7
4= Newspapers 7
6 Magazines 6
7 Social media (paid) 5
8 Online display 3
9 Online video 2
10 Cinema 1
EVIDENCE Standalone and incremental reach based on typical scenarios using IPA
Touchpoints and industry sources. Scored from high to low. See Appendix 3 for full
details on how this ranking has been calculated.
What advertisers and agencies say
1 TV 4.5
2 Out of home 3.7
3= Radio 3.2
3= Social media (paid) 3.2
3= Online display 3.2
6 Newspapers 3.1
7 Online video 3.0
8 Direct mail 2.9
9 Magazines 2.6
10 Cinema 2.2
PERCEPTION Mean score. Q. Using a scale of 1–5 where 5 is ‘very good’ and 1 is ‘very
poor’, please rate each medium for its ability to maximise campaign reach. Base: n=19.
Builds campaign frequency
Radio delivers on frequency
When it comes to frequency, out of home and radio
perform best on the evidence (again, iPa touchpoints
and industry sources).
advertisers and agencies clearly rate radio most highly
for building frequency.
“Using radio is effective because…the advert can be
repeated frequently at a certain time of day. You also get
a good mass reach with radio.”
advertiser, FmCg
“Because people are habitual in their listening habits.
Frequency therefore is high. It is a good way to drive
frequency cost-effectively.”
advertiser, retail
Builds campaign frequency
What the evidence says
1 Out of home 10
2 Radio 9
3 Newspapers 8
4 TV 7
5 Social media (paid) 6
6= Magazines 5
6= Online display 5
8 Online video 3
9 Cinema 2
10 Direct mail 1
EVIDENCE Standalone and incremental frequency based on typical scenarios using
IPA Touchpoints and industry sources. Scored from high to low. See Appendix 3 for
full details on how this ranking has been calculated.
What advertisers and agencies say
1 Radio 4.3
2= Out of home 3.7
2= Social media (paid) 3.7
4 TV 3.6
5 Newspapers 3.5
6 Online display 3.3
7 Online video 3.2
8 Magazines 2.3
9 Direct mail 2.2
10 Cinema 1.7
PERCEPTION Mean score. Q. Using a scale of 1–5 where 5 is ‘very good’ and 1 is
‘very poor’, please rate each medium for its ability to build campaign frequency. Base:
n=19.
Re-evaluating Media
13

gets your ads noticed
Advertisers value a captive audience
many factors go into getting ads noticed. our research
took into account stature and standout, memorability
(retention rates), amplification and level of ad avoidance.
advertisers and agencies are the first to recognise that
standout creative is key but when it comes to selecting
media channels, the ability to deliver a captive audience is
consistently valued.
interviewees liked cinema because you have a captive
audience who want to be there; out of home because it
captures people in-car or on the tube or train where there’s
not a lot else to do; and online video because people have
to watch the ad to access the content.
overall, respondents and the evidence rated tv and
cinema most highly for getting ads noticed.
“TV…has more impact as people are chilling out in front
of it and are focusing on what they’re seeing.”
advertiser, financial services
By contrast, online display performs relatively poorly not
helped by viewability issues and the rise of ad blockers.
“It’s become so prevalent now that people just sort
of automatically click away from ads and aren’t
noticing them as much. We’ve certainly seen that in
the performance of our online display campaigns…it’s
harder and harder to get noticed.”
advertiser, travel
Re-evaluating Media
14
Gets your ads get noticed
What the evidence says
1 Cinema 9
2 TV 7
3= Out of home 6
3= Radio 6
5= Newspapers 5
5= Magazines 5
5= Online video 5
5= Social media (paid) 5
9 Direct mail 4
10 Online display 3
EVIDENCE Based on score for ad avoidance, stature and standout, memorability and
amplification from secondary research and Ebiquity’s data on retention rates. Scored
from high to low. See Appendix 3 for full details on how this ranking has been calculated.
What advertisers and agencies say
1 TV 4.3
2 Cinema 4.2
3 Out of home 3.7
4 Social media (paid) 3.4
5 Online video 3.3
6 Radio 3.2
7 Magazines 2.8
8 Direct mail 2.7
9 Newspapers 2.5
10 Online display 2.3
PERCEPTION Mean score. Q. Using a scale of 1–5 where 5 is ‘very good’ and 1 is ‘very
poor’, please rate each medium for its ability to get ads noticed. Base: n=20.

Re-evaluating Media
15
low cost audience delivery
Advertisers undervalue radio’s low media cost
Based on ebiquity’s data, radio delivers the lowest media
cost per thousand by a distance.
But advertisers and agencies are failing to recognise this,
and persist in believing social and online deliver the most
cost-efficient reach.
“Social media is just a really cheap way of getting
your message out there en masse.”
advertiser, financial services
Low cost audience delivery
What the evidence says
1 Radio 10
2 Out of home 9
3 Newspapers 8
4 Social media (paid) 7
5 Online display 6
6 TV 5
7 Magazines 4
8 Online video 3
9 Cinema 2
10 Direct mail 1
EVIDENCE CPTs from Ebiquity’s data pool. Scored from lowest cost to highest cost.
See Appendix 3 for full details on how this ranking has been calculated.
What advertisers and agencies say
1= Social media (paid) 4.2
1= Online video 4.2
1= Online display 4.2
4 TV 3.6
5 Radio 3.5
6 Newspapers 3.4
7 Out of home 3.1
8 Direct mail 3.0
9 Magazines 2.8
10 Cinema 2.1
PERCEPTION Mean score. Q. Using a scale of 1–5 where 5 is ‘very good’ and 1 is ‘very
poor’, please rate each medium for its ability to deliver low cost audiences. Base: n=19.
low production cost
Low production cost is online display’s key strength
low production cost is one of online display’s redeeming
strengths, as ads can be easily produced, even in-house.
Radio’s cost effectiveness is supported by evidence from
aa/WaRC data when we assessed production cost as a
percentage of media cost.
“It’s relatively cheap to produce a radio ad and you can
get good mass reach for the cost.”
advertiser, FmCg
Low production cost
What the evidence says
1 Online display 10
2 Radio 9
3 Social media (paid) 8
4= Newspapers 6
4= Magazines 6
6 Out of home 5
7= Online video 3
7= TV 3
7= Cinema 3
10 Direct mail 1
EVIDENCE AA/WARC data on production cost as a % of media spend, with
assumptions made for media not covered. Scored from lowest cost to highest cost.
See Appendix 3 for full details on how this ranking has been calculated.
What advertisers and agencies say
1 Online display 4.3
2= Radio 4.0
2= Social media (paid) 4.0
4 Newspapers 3.6
5 Magazines 3.3
6 Online video 3.2
7 Out of home 2.9
8 Direct mail 2.7
9 Cinema 1.9
10 TV 1.8
PERCEPTION Mean score. Q. Using a scale of 1–5 where 5 is ‘very good’ and 1 is ‘very
poor’, please rate each medium for its ability to deliver low production cost. Base: n=19.

guarantees a safe environment
Online and social media safety concerns are widely recognised
advertisers are clearly very wary of social media and
online channels, because of the lack of control over
surrounding content.
our research indicates they are justified in their
perceptions, with online and social media scoring poorly
for safety; tv, cinema and radio perform very well.
according to the Cmo Council (2017), a quarter of the
world’s marketers have reported specific examples
of where their digital advertising appeared alongside
offensive and compromising content.
“From a brand-building perspective, online is not a
good medium because you don’t know who will
see it and what is around it to influence the reaction
to your brand.”
media buying agency
advertisers cite the high level of regulation and control
over editorial environment in cinema, tv and radio as
reasons why they trust these media to deliver a safe
environment.
With cinema, advertisers can choose an exact film and
location. Radio and tv are both seen as well regulated.
“Most brands provide a safe environment which is
built in for advertisers. Ads have to be vetted and adhere
to the code and there is control over the
editorial environment too.”
media buying agency
Re-evaluating Media
16
Guarantees a safe environment
What the evidence says
1 Cinema 10
2= Radio 9
2= TV 9
4= Direct mail 7
4= Magazines 7
4= Out of home 7
7 Newspapers 6
8= Online display 2
8= Online video 2
8= Social media (paid) 2
EVIDENCE Score applied for safety of the editorial and advertising environment.
Based on secondary research and Ebiquity knowledge. Scored from safest to unsafest
environment. See Appendix 3 for full details on how this ranking has been calculated.
What advertisers and agencies say
1 TV 4.4
2 Cinema 4.2
3 Radio 4.0
4 Direct mail 3.9
5 Magazines 3.4
6= Newspapers 3.3
6= Out of home 3.3
8 Online video 2.0
9 Online display 1.9
10 Social media (paid) 1.8
PERCEPTION Mean score. Q. Using a scale of 1–5 where 5 is ‘very good’ and 1 is ‘very
poor’, please rate each medium for its ability to guarantee a safe environment. Base:
n=19.

short-term sales response
TV and radio top for delivering short-term sales uplift
short-term sales response is certainly not a complete
measure of campaign Roi, but there are times when a
short-term sales uplift is exactly what advertisers are
looking for.
and once again tv and radio are seen to deliver, both
on the evidence and in the minds of the advertisers and
agencies surveyed.
“We run econometrics on television advertising and we
find that in the short, medium and long term television
pays back out.” advertiser, travel
“We have run four radio campaigns this year and we
immediately saw an uplift in sales.” advertiser, FmCg
our findings combined a review of existing research and
ebiquity proprietary data on sales activation performance,
ranked direct mail third after tv and radio for its ability to
generate short-term sales.
advertisers and agencies also value paid social media and
online display for quick results but these perceptions are
not backed up by the evidence.
“Online display is effective if you want to move more
closely at the point of purchase…people are just about to
make a purchase basically.”
advertiser, financial services
Re-evaluating Media
17
Short-term sales response
What the evidence says
1 TV 10
2 Radio 9
3 Direct mail 8
4= Newspapers 7
4= Magazines 7
6 Online video 6
7 Social media (paid) 4
8 Online display 4
9 Out of home 3
10 Cinema 1
EVIDENCE Ebiquity data and secondary research. Scored from highest evidence
of short-term sales response to lowest. See Appendix 3 for full details on how this
ranking has been calculated.
What advertisers and agencies say
1 TV 4.2
2= Radio 3.6
2= Online display 3.6
2= Social media (paid) 3.6
5 Online video 3.4
6 Direct mail 3.3
7 Out of home 3.1
8 Newspapers 2.8
9 Magazines 2.4
10 Cinema 2.2
PERCEPTION Mean score. Q. Using a scale of 1–5 where 5 is ‘very good’ and 1 is ‘very
poor’, please rate each medium for its ability to deliver short-term sales response.
Base: n=20.

transparent third party audience measurement
Detailed instant feedback online seduces advertisers
When it comes to audience measurement, interviewees
rated online and social media highly for the ability to measure
response instantly and in great detail, even allowing tweaking
of a campaign while it’s running, if desired.
“There are so many tools available to measure responses
and therefore the success of your campaign when using
social media – and that is a priority for clients.”
Full service agency
our objective analysis, however, rated online and social
measurement less highly on the basis that there is no
single, transparent and fully independent measurement
tool verified by third parties, and ongoing issues with fake
followers and bots which have yet to be satisfactorily
addressed.
most other media have transparent measurement tools
overseen by a JiC (Joint industry Committee), including,
most recently, direct mail. Post-campaign delivery reports
which verify impacts delivered versus planned are
available for tv, radio and outdoor among others.
Re-evaluating Media
18
Transparent third party audience measurement
What the evidence says
1= Newspapers 9
1= Magazines 9
1= TV 9
1= Radio 9
1= Out of home 9
6 Direct mail 7
7= Cinema 6
7= Online display 6
7= Social media (paid) 6
10 Online video 5
EVIDENCE Secondary research and Ebiquity knowledge. Scoring based on
transparency, single industry currency, third party governance and post-campaign
delivery reporting. Scored from high to low. See Appendix 3 for full details on how this
ranking has been calculated.
What advertisers and agencies say
1= Online video 3.7
1= Online display 3.7
3 TV 3.6
4 Social media (paid) 3.5
5 Direct mail 3.1
6= Radio 2.9
6= Newspapers 2.9
6= Cinema 2.9
9 Magazines 2.8
10 Out of home 2.5
PERCEPTION Mean score. Q. Using a scale of 1–5 where 5 is ‘very good’ and 1 is ‘very
poor’, please rate each medium for its ability to deliver transparent third party audience
measurement. Base: n=19.

19
oveRall PeRFoRmanCe RanKing

Re-evaluating Media
20
oveRall PeRFoRmanCe RanKing
Combining all the attributes puts TV and radio top
We took all the attributes advertisers look for in media
channels and weighted them by their importance, to see
which media channels deliver the best value overall.
tv came out on top but other traditional media are
undervalued by advertisers and agencies.
the performance of radio, which ranks a close second
behind tv on the evidence, was one of the most
strikingly undervalued, coming in only sixth in the overall
ranking, according to the advertisers and agencies we
interviewed. magazines were bottom of the pile whereas
objective research places them fourth.
Conversely, advertisers and agencies notably over-rated
the performance of online video and social media.
the performance of out of home and direct mail was
assessed fairly realistically, as too was online display
which performed poorly in terms of both perception and
evidence.
Overall weighted score – all 12 attributes combined
What the evidence says
1 TV 107.1
2 Radio 103.2
3 Newspapers 87.8
4 Magazines 79.5
5 Out of home 71.7
6 Direct mail 67.0
7 Social media 65.8
8 Cinema 61.4
9 Online video 57.6
10 Online display 50.0
EVIDENCE Based on sum of scores for all 12 attributes with importance weights
applied.
What advertisers and agencies say
1 TV 48.9
2 Online video 41.6
3 Social media 41.3
4 Out of home 39.6
5 Cinema 39.1
6 Radio 38.9
7= Newspapers 36.3
7= Direct mail 36.3
9 Online display 35.5
10 Magazines 35.1
PERCEPTION Based on sum of mean score across all 12 attributes, with importance
weights applied. Base: n=116 (each respondent rated 2 attributes).

FutuRe oF media
Offline media will continue to play a crucial role in an increasingly digital world
most interviewees (86%) think the shift in advertising
budgets towards digital will continue in the long term.
they see it as part of a bigger trend as consumer
behaviour changes and media continues to digitalise.
and they believe that measurability issues will be
addressed and will improve.
However, a not insignificant minority (14%) think online
budgets will slow or decline.
“Questions are being asked with regard to safety,
advert fraud and digital blocking so I think it will
decline somewhat.”
advertiser, household/home
“People are now waking up to the fact that it’s not
delivering what it says it is. I think there are issues
with ‘businesses marking their own homework’ and
measurements provided by people who have an
interest in their success. GDPR is going to become
an issue as well.”
advertiser, financial services
“Digital is just not as interesting as it was five years
ago – and that is a fact. We need a whole new model of
communication.”
media buying agency
interviewees say that offline media will continue to be
important.
“Marketing is ultimately about the mix and the layering of
all the touchpoints. It is about getting the proportions right
to be most effective.”
advertiser, FmCg
they are optimistic about the future for tv and radio but
have concerns about print.
“Radio’s never going to go away, commuter radio is just
extremely valuable.”
advertiser, telecoms/technology
“I think that press and magazines are in a pretty
desperate place…they need to think of clever ways to
make the offline and online elements work together.”
media buying agency
Final thoughts
Digital advertising will continue to grow but offline
media will remain an important part of the media
schedule.
There is no doubt that digital providers need to
address measurement and transparency issues.
to optimise advertising budgets, advertisers should
avoid being seduced by trends or swayed by instinct
and make considered media decisions based on
evidence and proof of what works for them.
Re-evaluating Media
21

aPPendiCes
Appendix 1: secondary research sources
All Media Cinema Newspapers Magazines Online/social media
Direct mail Out of home Radio TV
advertising association
ad Research Foundation*
Cmo Council
iPa*
isBa*
mediatel
WaRC
WFa*
digital Cinema media
Pearl & dean
global Cinema ad. association
Cinema advertising association
newsworks
Reuters
news international
guardian media group
dow Jones
associated Press
magnetic media
PPa
Conde nast
time inc.
Bauer
iaB*
inskin
emarketer*
aol
uKaoP
uKom
oFCom
JiCWeBs
youtube
dma*
Royal mail marketReach
JiCmail
outsmart
Route
oaa
Posterscope
Primesight
JCdecaux
Clear Channel
exterion
Radiocentre thinkbox
Channel 4
itv
BskyB
* content behind a paywall could not be accessed
Appendix 2: secondary research scoring frameworkattribute maximum score importance weighting*
Targets the right people in the right place at the right time 10 2.50
Increases campaign ROI 10 2.32
Triggers a positive emotional response 10 2.31
Increases brand salience 10 2.26
Maximises campaign reach 10 1.13
Gets your ads noticed 10 0.60
Low cost audience delivery 10 0.34
Builds campaign frequency 10 0.25
Guarantees a safe environment 10 0.12
Short-term sales response 10 0.09
Transparent third party audience measurement 10 0.07
Low production cost 10 0.01
* based on findings from maxdiff analysis of 116 respondents
Re-evaluating Media
22

Appendix 3: secondary research evidence
Targets the right people in the right place at the right time
definition: ability of the medium to target in this way
scoring criteria: 0 – no 1 – yes with limitations 2 – yes
evidence: How the medium is bought (ebiquity knowledge)
medium geography demographics day of week time of day Contextual addressable total score (weighted/10)
Cinema 2 2 2 1 1 0 7
Direct mail 2 2 1 0 0 2 6
Magazines 0 2 0 0 1 0 3
Newspapers 2 1 2 0 1 0 5
Online display 1 1 2 2 1 1 7
Online video 1 1 1 1 2 1 6
Out of home 2 1 1 1 2 0 6
Radio 2 2 2 2 2 1 9
Social media 2 2 1 1 2 2 8
TV 1 2 2 2 1 1 8
* note: online display and video may be scored ‘yes with limitations’ because the basis for programmatic targeting varies from first party data-driven to assumption-based. online video scores take into account that there is variation in targeting ability depending on online video partner (e.g. broadcaster vod does not allow day of week targeting).
Increases campaign ROI
definition: Proven to increase overall campaign Roi (return on media investment)
scoring criteria: 0–10, where 10 is the highest Roi and 0 the lowest
evidence: Published research/ebiquity norms
medium evidence score
Cinema Royal Mail MarketReach: The Private Life of Mail – Mail In The Home, Heart & Head (2015)• RRoi (revenue return on investment) is between £2–3 – 5th place
DCM: Building Box Office Brands Volume II (2016)• By increasing spend to the recommended level of 2.7%, campaigns could deliver £3.70 RRoi for every £1 spent on the
overall media campaign
1
Direct mail Royal Mail MarketReach: The Private Life of Mail – Mail In The Home, Heart & Head (2015)
• Campaigns including mail were 27% more likely to deliver top-ranking sales performance and 40% more likely to deliver top-level acquisition levels
• When mail was included, the total comms Roi jumped 12% – from £4.22 to £4.73
• RRoi (revenue return on investment) for direct mail is over £4 – 2nd place (equal to tv)
• RRoi (revenue return on investment) for door drops is £3 – 4th place
5
Magazines Royal Mail MarketReach: The Private Life of Mail – Mail In The Home, Heart & Head (2015)• RRoi (revenue return on investment) for print is over £6 – 1st place
Radiocentre: Radio the ROI Multiplier (2013)• average RRoi (revenue return on investment) for magazines is £5.80 – 3rd place
Ebiquity database (2014–17): £1.44 Profit ROI (print combined) – 3rd place
8
Newspapers Royal Mail MarketReach: The Private Life of Mail – Mail In The Home, Heart & Head (2015) • RRoi (revenue return on investment) for print is over £6 – 1st place
Radiocentre: Radio the ROI Multiplier (2013) • average RRoi (revenue return on investment) for press is £5.80 – 3rd place
Newsworks: The ROI Study (2016) • Print newsbrands boost total campaign Roi by 2.8 times (retail sector) 70% (automotive sector) and by up to 5.7 times (finance)
Ebiquity database (2014–17): £1.44 Profit ROI (print combined) – 3rd place
8
Online display
Royal Mail MarketReach: The Private Life of Mail – Mail In The Home, Heart & Head (2015)• RRoi (revenue return on investment) is less than £2 – 6th place
Radiocentre: Radio the ROI Multiplier (2013)• average RRoi (revenue return on investment) for online is £4.90 – 4th place
Ebiquity database (2014–17):- £0.82 Profit ROI – 6th place
3
Continued overleaf
Re-evaluating Media
23

medium evidence score
Online video
• no published secondary dataEbiquity database (2014–17): £1.21 Profit ROI – 4th place
6
Out of home Royal Mail MarketReach: The Private Life of Mail – Mail In The Home, Heart & Head (2015)• RRoi (revenue return on investment) is £3 – 4th placeRadiocentre: Radio the ROI Multiplier (2013)• average RRoi (revenue return on investment) for ooH is £2.00 – 5th placeEbiquity database (2014–17): £0.57 Profit ROI – 7th place
2
Radio Royal Mail MarketReach: The Private Life of Mail – Mail In The Home, Heart & Head (2015)• RRoi (revenue return on investment) for radio is £4 – 3rd placeRadiocentre: Radio the ROI Multiplier (2013)• average campaign RRoi (revenue return on investment) is £7.70 – 2nd place• When radio’s % share of media budget rises to over 20% campaign RRoi rises to £8.20 Ebiquity database (2014–17): £1.61 Profit ROI – 2nd place
9
Social media Facebook Consumer Mix Model, Kantar WorldPanel (2017)• on average, the return on pounds spent on Facebook was £1.79Ebiquity database (2014–17): £1.14 (based on <50 data points) – 5th place
4
TV Royal Mail MarketReach: The Private Life of Mail – Mail In The Home, Heart & Head (2015)• RRoi (revenue return on investment) is over £4 – 2nd place (equal to dm)Radiocentre: Radio the ROI Multiplier (2013)• average RRoi (revenue return on investment) for tv is £8.70 – 1st placeEbiquity database (2014–17): £1.73 Profit ROI – 1st place
10
Triggers a positive emotional response
definition: Emotional connection. ability to trigger a positive emotional response (mood)
scoring criteria: 0–5 where 5 is strong evidence of the ad triggering a positive emotional response and 0 where there is least emotional response
evidence: Published research
Seamless experience non-interruptive seamless part of the media experience
0–5, where 5 is most seamless and least interruptive and 0 is least seamless and most interruptive
Published research/ebiquity knowledge
Emotional connection
medium evidence score
Cinema Reel Happiness: Understanding the emotions of cinemagoers (2015)• People are consistently happier in the cinema than when consuming other media (2011–15). depending on time of day, cinema goers can be up to 50% happier than the average population at the same time
DCM: The Bigger Picture (2014) • Cinema audiences are four times more likely to be emotionally engaged than a television audience
5
Direct mail Royal Mail MarketReach: The Private Life of Mail – Mail In The Home, Heart & Head (2015)• People place value on things they can touch. 57% of respondents claim that receiving mail makes them feel more valued.
38% of respondents say that the physical properties of mail influence how they feel about the sender
Royal Mail MarketReach: This Time It’s Personal (2015)• valued mail creates internal feelings (‘better informed’ 66%) directly transactional (tempted by product/service 48%) and
some related to the relationship with the sender. 20% of respondents associated 9 or more emotional responses to their item
Outsmart: The Customer Journey (2012)• 51% of dm and door drop ad encounters generated a ‘feel response’ – 360 out of 710 (6th place)
3
Magazines Magnetic: Moments that matter (2015)• magazines make people happy. at the moment of magazine consumption, subjective wellbeing measure (based on Paul
dolan’s Pleasure/Purpose principle) moves up by +6%. magazine media satisfies both ‘pleasure’ and ‘purpose’
Thinkbox: Killer Charts (2017)• 2% of people said magazine ads ‘made you feel emotional’ (5th place) and 4% of ads make you laugh (4th place)
Outsmart: The Customer Journey (2012)57% of magazine ad encounters generated a ‘feel response’ – 312 out of 547 (4th place)
4
Newspapers Thinkbox: Killer Charts (2017)• 6% of people said newspaper ads ‘made you feel emotional’ (2nd place) and 5% make you laugh (3rd place)
Outsmart: The Customer Journey (2012)• 60% of newspaper ad encounters generated a ‘feel response’ – 316 out of 531 (3rd place)
3
Continued overleaf
Re-evaluating Media
24

medium evidence score
Online display
Outsmart: The Customer Journey (2012)• 49% of online ad encounters generated a ‘feel response’ – 382 out of 775 (last place)
1
Online video
Outsmart: The Customer Journey (2012)• 49% of online ad encounters generated a ‘feel response’ – 382 out of 775 (last place)
2
Out of home Outsmart: The Customer Journey (2012) • 62% of ooH ad encounters generated a ‘feel response’ – 1,195 out of 1,914 (2nd place)
Thinkbox: Killer Charts (2017) • 1% of people said ooH ads ‘made you feel emotional’ (last place) and 3% make you laugh (last place)
3
Radio Radiocentre: The Emotional Multiplier (2011) • vs tv and online, radio has the biggest influence on people’s happiness and energy, and on more occasions • mood-boosting effect of radio extends into the ad break generating 30% higher levels of positive engagement
Thinkbox: Killer Charts (2017) • 5% of people agreed you are most likely to find ads that ‘made you feel emotional’ on radio (4th place) and 7% ‘make you
laugh’ (5th place)
Outsmart: The Customer Journey (2012) • 80% of radio ad encounters generated a ‘feel’ response – 214 out of 267 (1st place)
5
Social media no published secondary research specific to social media. score based on ebiquity view that emotional connection with social media ads is better than online display or video
3
TV Thinkbox: Killer Charts (2017) and TV Ad Nation (2016)• tv ads are most likely to make you feel emotional (58%) (1st place) and most likely to make you laugh (1st place)
Outsmart: The Customer Journey (2012)• 52% of tv ad encounters generated a ‘feel’ response – 1191 out of 2293 (5th place)
5
Seamless experience
medium evidence score
Cinema no specific evidence but advertising is a seamless part of the cinema experience 5
Direct mail no specific evidence but Royal mail research shows that mail is valued and kept, implying that mail is not considered intrusive or interruptive (Royal mail marketReach: the Private life of mail – mail in the Home, Heart & Head (2015))
4
Magazines Magnetic: Moments that Matter (2015)• 80% of people believe advertising in magazines doesn’t distract from the experience
• 35% of people believe ads are welcomed in magazines
5
Newspapers Magnetic: Moments that Matter (2015)• 82% of people believe advertising in newsbrands doesn’t distract from the experience• 21% of people believe ads are welcomed in newsbrands
5
Online display
Teads: Why People Block Ads (2016)• over 3 in 4 people say that intrusive ads were the largest motivator for installing ad blockers
CMO Council: How Brands Annoy Fans (2017)• When asked does brand advertising detract from your enjoyment of the content you consume online – 43% said yes • intrusive pop up ads were the digital ad format found most irritating (22%)• ‘text only ads that ask you to click through to something’ and ‘ads that come up before the page you wanted’ were rated
the third most irritating digital format (10%)
2
Online video
Teads: Why People Block Ads (2016)• over 3 in 4 people say that intrusive ads were the largest motivator for installing ad blockers• Pre-roll is the most intrusive video format 52% of people who have ad blockers installed rate pre-roll as the most intrusive
video format (vs. 24% for native video)
CMO Council: How Brands Annoy Fans (2017)• When asked does brand advertising detract from your enjoyment of the content you consume online – 43% said yes • auto-playing video ads were rated as the second most irritating digital format (17%)
1
Out of home Does not interrupt every day activities 5
Radio Radiocentre: Getting Vocal (2017)• 27% of amazon echo users say the ads feel very natural vs. 10% say they feel very interruptive
4
Social media CMO Council: How Brands Annoy Fans (2017)• When asked does brand advertising detract from your enjoyment of the content you consume online – 43% said yes
no research evidence specific to social media
3
TV Relatively seamless but ad breaks do interrupt the programme 4
Re-evaluating Media
25

Increases brand salience
definition: enhances long-term brand equity and the degree to which the brand is noticed or thought about in a buying situation
scoring criteria: 0–10 where 10 is strong evidence of the medium increasing brand salience and 0 is where there is no evidence. average rankings from comparative studies used to determine relative placement
evidence: Published research
medium evidence score
Cinema DCM: Building Box Office Brands Vol II (2016)• Cinema delivers an average impact of 2.9% on brand salience (1st place)• Cinema delivers an average impact of 2.5% on brand love (1st place)• Cinema delivers an average impact of 4% on brand consideration (1st place)
Magnetic: Why Being Different Still Makes a Difference (2016)• in an average campaign cinema delivers a 3.62% uplift in brand affinity/love (1st place)
Magnetic: Metrics that Matter (2016)• vs all other media cinema is the 7th most effective at moving brand perceptions of brand relevancy• vs all other media cinema is the least effective at driving brand quality perceptions
IPA: Media in Focus (2017) • When adding cinema to the media mix, a 2% increase in average number of vl business effects is seen (last place)
4
Direct mail Royal Mail MarketReach: This Time it’s Personal (2015)• mail valued by customers reminded them about the brand (60%), kept the brand top of mind (60%), made them think about
buying (58%) and made them think positively about the brand (57%)IPA: Media in Focus (2017)• When dm is added to the media mix, a 10% increase in average number of vl business effects is seen (5th place)
5
Magazines DCM: Building Box Office Brands Vol II (2016)• magazines deliver an average impact of 1.8% on brand salience (3rd place)• magazines deliver an average impact of 0.6% on brand love (5th place)• magazines deliver an average impact of 2.2% on brand consideration (2nd place)
Magnetic: Why Being Different Still Makes a Difference (2016)• magazines deliver a 1.15% uplift in brand salience (3rd place)• magazines deliver a 1.53% uplift in brand affinity/love (3rd place)• magazines deliver a 0.83% uplift in brand ‘meeting needs’ (3rd place)
Magnetic: Metrics that Matter (2016)• vs all other media magazines are most able to move brand perceptions of brand relevancy • vs all other media magazines are the 2nd most effective at driving brand quality perceptions
Clear Channel: The Power of OOH on Consideration (2016)• Press is the 5th most impactful media on brand consideration (1.44 positive score)
IPA: Media in Focus (2017)When press is added to the media mix a 15% increase in average number of vl business effects is seen (4th place)
8
Newspapers DCM: Building Box Office Brands Vol II (2016)• newspapers deliver an average impact of 1.1% on brand salience (5th place)• newspapers deliver an average impact of 1.1% on brand love (3rd place)• newspapers deliver an average impact of 0.9% on brand consideration (3rd place)
Magnetic: Why Being Different still Makes a Difference (2016)• newspapers deliver a 0.74% uplift in brand salience (5th place)• newspapers deliver a 1.01% uplift in brand affinity/love (4th place)
Clear Channel: The Power of OOH on Consideration (2016)• Press is the 5th most impactful media on brand consideration (1.44 positive score)
Magnetic: Metrics that Matter (2016)• vs all other media newsbrands are the 4th most effective at moving brand perceptions of brand relevancy• vs all other media newsbrands are the 3rd most effective at driving brand quality perceptions
Newsworks: IPA Databank Study (2017)• Campaigns using newsbrands are 43% more likely to deliver market share growth• Campaigns using newsbrands are more than twice as likely to deliver an increase in customer loyalty
IPA: Media in Focus (2017)• When press is added to the media mix a 15% increase in average number of vl business effects is seen (4th place)
8
Online display
DCM: Building Box Office Brands Vol II (2016)• online display delivers an average impact of 0.8% on brand salience (7th place)• online display delivers an average impact of 0.4% on brand love (6th place)• online display delivers an average impact of 0.5% on brand consideration (5th place)
Magnetic: Why Being Different Still Makes a Difference (2016)• online display delivers a 0.28% uplift in brand salience (6th place)• online display delivers a 0.21% uplift in brand affinity/love (7th place)• online display delivers a 0.47% uplift in brand ‘meeting needs’ (4th place)
Clear Channel: The Power of OOH on Consideration (2016)• online is the 4th most impactful media on brand consideration (1.52 positive score)
IAB: Impact study (2016) • online display has positive effect on both brand awareness and favourability – uplift in both
IPA: Media in Focus (2017); and IPA: Effectiveness in the Digital Era (2016)• When online display is added to the media mix a 12% increase in average number of vl business effects is seen (5th place)
4
Continued overleaf
Re-evaluating Media
26

medium evidence score
Online video
DCM: Building Box Office Brands Vol II (2016)• online video delivers an average impact of 0.8% on brand salience (8th place)• online video delivers an average impact of 1.4% on brand love (2nd place)• online video delivers an average impact of 0.4% on brand consideration (6th place)
IPA: Media in Focus (2017)• online video is now a powerful and efficient brand-building medium, and is more effective than other forms of online display
IPA Effectiveness in the digital era, 2016 • Broadcaster vod makes tv more effective – increase in average no. vl business effects 36% tv with Bvod, compared
to 27% tv without Bvod
Facebook, Nielsen 173 brand effect studies (2017)• From the moment a video ad was viewed (even before one second), lift happened across ad recall, brand awareness and
purchase consideration
5
Out of home DCM: Building Box Office Brands Vol II (2016)• ooH delivers an average impact of 0.9% on awareness (6th place)• ooH delivers an average impact of 0.9% on brand love (4th place)• ooH delivers an average impact of 0.7% on brand consideration (4th place)
Magnetic: Why Being Different still Makes a Difference (2016)• ooH delivers a 0.26% uplift in brand salience (7th place)• ooH delivers a 1.89% uplift in brand affinity/love (2nd place)
Clear Channel: The Power of OOH on Consideration (2016)• ooH is the number one most impactful media on brand consideration (1.72 positive score)
Magnetic: Metrics that Matter (2016)• vs all other media ooH is the least effective at moving brand perceptions of brand relevancy• vs all other media ooH is the 7th most effective at driving brand quality perceptions
IPA: Media in Focus (2017) Thinkbox: Killer Charts (2017) • When ooH is added to the media mix a 20% increase in average number of vl business effects is seen – 2nd place
5
Radio Radiocentre: The Brand Multiplier (2016)• average network size (category entry points – a range of occasions, needs and feelings which influence brand purchase)
increased by +29% vs control for audio + audio visual compared to +23% for audio visual alone
Radiocentre: Radiogauge (2017)• average consideration index 132 (vs those not exposed to radio ads) across 290 brand-building radio campaigns • average relevance index 141 (vs those not exposed to radio ads) across 290 brand-building radio campaigns
DCM: Building Box Office Brands Vol II (2016)• Radio delivers an average impact of 1.2% on awareness (4th place)• Radio delivers an average impact of 0.9% on brand love (4th place)• Radio delivers an average impact of 0.7% on brand consideration (4th place)
Magnetic: Why Being Different still Makes a Difference (2016)• Radio delivers a 0.85% uplift in brand salience (4th place)• Radio delivers a 0.43% uplift in brand affinity/love (6th place)
Clear Channel: The Power of OOH on Consideration (2016)• Radio is the 3rd most impactful media on brand consideration (1.69 positive score)
Magnetic: Metrics that Matter (2016)• vs all other media radio is the 8th most effective at moving brand perceptions of brand relevancy• vs all other media radio is the 4th most effective at driving brand quality perceptions
IPA: Media in Focus (2017)• When radio is added to the media mix a 17% increase in average number of vl business effects is seen (3rd place)
8
Social media Magnetic: Metrics that Matter (2016)• vs all other media social media is the 3rd most effective at moving brand perceptions of brand relevancy• vs all other media social media is the 8th most effective at driving brand quality perceptions
IPA: Media in Focus (2017)• When paid social is added to the media mix a 7% increase in average number of vl business effects is seen (7th place)
Facebook, Nielsen 173 brand effect studies (2017)From the moment a video ad was viewed (even before one second), lift happened across ad recall, brand awareness and purchase consideration
4
TV DCM: Building Box Office Brands Vol II (2016)• tv delivers an average impact of 2.6% on awareness per person reached (2nd place)• tv delivers an average impact of 1.4% on brand love per person reached (2nd place)• tv delivers an average impact of 0.7% on brand consideration per person reached (4th place)
Magnetic: Why Being Different Still Makes a Difference (2016)• tv delivers a 1.22% uplift in brand salience (2nd place)• tv delivers a 1% uplift in brand affinity/love (5th place)
Clear Channel: The Power of OOH on Consideration (2016)• tv is the 2nd most impactful media on brand consideration (1.71 positive score)
Magnetic: Metrics that Matter (2016)• vs all other media tv is the 2nd most effective at moving brand perceptions of brand relevancy• vs all other media tv is the most effective at driving brand quality perceptions
Thinkbox: Killer Charts (2017); and IPA: Effectiveness in the Digital Era (2016)• When tv is added to the media mix a 29% increase in average number of vl business effects is seen (1st place)
10
Re-evaluating Media
27

Maximises campaign reach/builds campaign frequency
definition: maximises 1+ campaign reach (either as a primary driver of reach or extending reach of other media)
scoring criteria: 0–10 where 10=highest, 0 = lowest
evidence: standalone reach/frequency (50% of score) – industry sources/iPa touchpoints, based on a typical heavyweight 4 week campaignincremental reach/frequency (50% of score) – iPa touchpoints. Based on typical scenarios:a. Base of tv (£1.5m) with incremental gain of moving 20% budgetB. Base of radio (£600k) with incremental gain of moving 50% budget
Builds frequency (ots/otH) as a single medium or in a multi-media campaign
0–10 where 0=highest, 0 = lowest
Maximises campaign reach Builds campaign frequency
medium solus reach incremental reach (a)
incremental reach (B)
score solus freq. incremental freq. (a)
incremental freq. (B)
score
Cinema 12.2% 80.6% 62.0% 1 1.2 5.4 5.9 2
Direct mail 100.0% 82.0% 65,0% 7 1.0 5.2 4.5 1
Magazines 44.0% 83.5% 68.3% 6 2.0 6.3 6.6 5
Newspapers 63.0% 88.8% 80.3% 7 11.0 6.8 6.7 8
Online display 16.3% 81.3% 63.8% 3 3.3 5.9 6.3 5
Online video 15.3% 81,3% 62.9% 2 1.5 5.5 5.9 3
Out of home 86.5% 90.9% 80,4% 10 21.2 6.8 6.7 10
Radio 76.0% 90.5% 67.6%* 8 12.0 8.5 10.5* 9
Social media 22.3% 82.0% 66.0% 5 4.8 6.4 6.9 6
TV 84.0% 80.2%* 79.5% 9 13.0 6.6* 5.7 7
*excluded from calculation for a fair comparison
Gets your ads noticed
definition: level of ad avoidance extent to which consumers can deliberately ignore or avoid seeing the ads
scoring criteria: 0–3 where 3 is evidence to show lowest level of ad avoidance and 0 where there is the highest ad avoidance
evidence: secondary research/ ebiquity knowledge
stature and stand out medium’s sheer physical size, scale and viewability
0–2 where 2 is biggest size and scale and 0 is minimal size or standout during ad exposure
secondary research/ ebiquity knowledge
memorability medium’s ability to make ad/brand message, audio, or visual memorable and easy to recall
0–3 where 3 is the best memorability and 0 is the lowest
secondary research/ ebiquity proprietary data
amplification medium’s ability to get audience talking and sharing your message on and offline
0–2 where 2 is strongest evidence of amplification and 0 where there is little or no amplification
secondary research
Ad avoidance
medium evidence score
Cinema Radiocentre: You Can’t Close Your Ears (2006)• Cinema (and radio) has the joint lowest hard avoid levels (18%), cinema has the highest engagement score (33).
Reinforces the theory that the ads are part of the cinema experience3
Direct mail Royal Mail MarketReach, Door Drop Stats Refresh, Illuminas (2014)• 92% of all people say they read door drops that get delivered to their homes
Royal Mail MarketReach, Ethnographic Quant, Trinity McQueen (2014)• mail open rates range from 71% for a brochure purchased from before, 60% for an addressed letter about a product/
service to 54% for a brochure they have not purchased from before or an unaddressed leaflet
1
Magazines Radiocentre: You Can’t Close Your Ears (2006)at 34%, magazine hard avoidance levels are higher than average but will vary widely according to the relationship between reader and magazine
1
Newspapers Radiocentre: You Can’t Close Your Ears (2006)• newspapers have the highest hard avoidance levels (37%) and lowest engagement score (15)
1
Online display
IAB: Ad blocking software – consumer usage and attitudes (2017)• 22.1% of total online population are using ad blocking software
Teads: Why People Block Ads (2016)• When asked which type of ads do you use your ad blocker to remove – 84% said pop-up, 45% said display ads
1
Continued overleaf
Re-evaluating Media
28

medium evidence score
Online video IAB: Ad blocking software – consumer usage and attitudes (2017)• 22.1% of total online population are using ad blocking software
Teads: Why People Block Ads (2016)• When asked which type of ads do you use your ad blocker to remove – 84% said pop-up, 40% said pre-roll
1
Out of home no published research but it is extremely difficult to deliberately avoid outdoor ads 2
Radio Radiocentre: You Can’t Close Your Ears (2006)
• Radio has the joint lowest hard avoid levels (18%) and an “inattentiveness” score of 64% 2
Social media no published research, ad blockers don’t block social media ads but social media ads can be scrolled past very quickly 1
TV Radiocentre: You Can’t Close Your ears (2006)• 31% hard avoid levels – 3rd highest after newspapers and magazines
Thinkbox/BARB (2016)• People skip the majority of ads in playback viewing (which are not counted and hence free to advertisers), but there’s no
sign that people are deliberately recording tv in order to skip ads. levels of playback on equivalent BBC content are very similar to commercial tv
1
Stature and standout
medium evidence score
Cinema DCM: Engagement Study – The Bigger Picture (2014)• a digital quality screen the size of two double-decker buses and dolby surround sound – audiences take more in
2
Direct mail ebiquity opinion 1
Magazines ebiquity opinion 1
Newspapers ebiquity opinion 1
Online display
Meetrics: viewability report (Q3 2017)• 52% of uK online ad impressions met the definition of viewability from the media Rating Council and iaB (at least 50% of
the surface of an online ad has to appear in the visible area of the browser for at least 1 second)0
Online video
Meetrics: viewability report (Q3 2017)• as above
1
Out of home ebiquity opinion 2
Radio ebiquity opinion 1
Social media ebiquity opinion 1
TV ebiquity opinion 1
Memorability
medium evidence score
Cinema DCM: Engagement Study – The Bigger Picture (2014)• 13% of the cinema cell spontaneously recalled seeing advertising vs 1.6% on tv. Cinema 8 times the ad recall of tv alone• From an unbranded creative still 71% of cinema respondents recognised the ads vs. 35% of the tv sample. Cinema
delivered twice the ad recognition of tv aloneEbiquity database: retention rates circa 80% (top tier)
3
Direct mail Royal Mail MarketReach: The Private Life of Mail – Mail In The Home, Heart & Head (2015)• 80% of respondents said they could remember seeing or reading some mail sent to them in the last four weeksEbiquity database: retention rates 30–50% (3rd tier)
1
Magazines no published researchEbiquity database: retention rates circa 50–70% (2nd tier)
2
Newspapers no published researchEbiquity database: retention rates circa 50–70% (2nd tier)
2
Online display
no published researchEbiquity database: retention rates circa 30% (4th tier)
1
Online video
no published researchEbiquity database: retention rates circa 50–70% (2nd tier)
2
Continued overleaf
Re-evaluating Media
29

Re-evaluating Media
30
medium evidence score
Out of home no published researchEbiquity database: retention rates circa 50–70% (2nd tier)
2
Radio Radiocentre Multiplier Study Ad Awareness (2000) • Radio was, on average, three-fifths as efficient as tv at driving advertising awareness
Ebiquity database: retention rates circa 50–70% (2nd tier)
2
Social media no published researchEbiquity database: retention rates circa 30% (4th tier)
1
TV no published researchEbiquity database: retention rates circa 80% (top tier)
3
Amplification
medium evidence score
Cinema Clear Channel: The Power of OOH on Consideration (2016)• Cinema is 2nd most effective media in driving conversation
1
Direct mail Royal Mail MarketReach: The Private Life of Mail (2015)• an average of 23% of all mail is shared between people in a household
Royal Mail MarketReach: This Time it’s Personal (2015)• as a result of receiving mail 18% of people recommended their product/service to friends/family and 33% talk to others/
discussed it
1
Magazines Clear Channel: The Power of OOH on Consideration (2016)• Press is third most effective media in driving conversation
Thinkbox: Killer Charts (2017)• 7% of people said they are likely to find ads that they talk about (face to face or on the phone) in magazines (5th place)
Magnetic: Rules of Attraction (2015)1 in 2 magazine readers often share adverts with friends and family
1
Newspapers Clear Channel: The Power of OOH on Consideration (2016) • Press is 3rd most effective media in driving conversation
Thinkbox: Killer Charts (2017)• 8% of people said they are likely to find ads that they talk about (face to face or on the phone) in newspapers (4th place)
1
Online display
Clear Channel: The Power of OOH on Consideration (2016)• online is the 4th most effective media in driving conversation
1
Online video
Clear Channel: The Power of OOH on Consideration (2016)• online is 4th most effective media in driving conversation
1
Out of home Thinkbox: Killer Charts (2017)• 3% of people said they are likely to find ads that they talk about (face to face or on the phone) out of home (7th place)
0
Radio Radiocentre: Audio Now (2014)• Brand fame – extent to which people have talked about the brand, campaigns that had used radio had a far stronger fame
effect than those which did not
Thinkbox: Killer Charts (2017)• 7% of people said they are likely to find ads that they talk about (face to face or on the phone) on the radio (6th place)
1
Social media no published research but social media is designed for consumers to share and amplify 2
TV Clear Channel: The Power of OOH on Consideration (2016)• tv is the most effective media in driving conversation
Thinkbox: Killer Charts (2017)• 53% of people said they are likely to find ads that they talk about (face to face or on the phone) on tv (1st place)
Thinkbox: TV Ad Effectiveness: A Brand’s Best Friend (2014); and Killer Charts (2017).• tv advertising drives 51% of marketing-generated conversations (1st place)• tv drives word of mouth for a number of weeks after initial activity
2

Re-evaluating Media
31
Low cost audience delivery/low production cost
definition: low cost audience delivery – media cost per thousand
scoring criteria: 10 = lowest cost – 1 = highest cost
evidence: ebiquity proprietary data
low production cost – production as a % of media cost 10 = lowest cost – 1 = highest cost secondary research, aa/WaRC 2016
audience delivery cost Production cost
medium all adults CPt score Production cost % score assumptions
Cinema £24.07 2 N/A 3 Production cost assumed to be same as TV
Direct mail £44.80 1 N/A 1CPT Royal Mail ratecard (addressed mail and door drop) with an assumed 20% discount applied.Production cost assumed to be most expensive
Magazines £6.87 4 4.3% (all print) 6
Newspapers£3.44
(nationals)8 4.3% (all print) 6
Online display £4.22 6 7.1% (all online) 10 Production cost assumed to be cheapest
Online video £23.42 3 7.1% (all online) 3 Production cost assumed to be same as TV
Out of home £3.03 9 5.6% 5
Radio £1.54 10 2.7% 9
Social media £3.61 7 N/A 8Production cost assumed to be more expensive than online display as more executions needed
TV £5.76 5 14% 3
Guarantees a safe environment
definition: ad appears in an environment that is third party regulated, ad is guaranteed not to appear in an inappropriate context
scoring criteria: 0–10, where 10 is safest environment and 0 is least safe environment (up to 5 points for editorial environment and 5 points for advertising environment)
evidence: secondary research/ebiquity knowledge
medium evidence score
Cinema Editorial: BBFC – regulates all films shown in uK cinemasAdvertising: Cinema advertising association self-regulates using the asa CaP code
10
Direct mail Editorial: the direct marketing Commission (dmC) oversees and enforces the direct marketing association (dma)’s CodeAdvertising: self-regulated, asa CaP code
7
Magazines Editorial: independent Press standards organisationAdvertising: self-regulated, asa CaP code
7
Newspapers Editorial: independent Press standards organisationAdvertising: self-regulated, asa CaP code
6
Online display
Editorial: isPa Code of Practice – applies to members only,internet Watch Foundation (monitors for child abuse)Advertising: self-regulated, iaB digital advertising Policy guide/asa CaP code
JICWEBS guidelines for online brand safetyadvertisers must subscribe to third party ad verification
CMO Council, Brand protection from digital content infection (2017)• a quarter of the world’s marketers have reported specific examples of where their digital advertising appeared alongside
offensive and compromising content• 72% of brand advertisers engaged in programmatic buying are concerned about brand integrity and digital display placement
2
Online video
Editorial: ofcom regulate broadcaster vod, BBFC has some involvement with providers of streamed filmssee online display aboveAdvertising: see online display above
2
Continued overleaf

medium evidence score
Out of home Editorial: department for Communities and local government and local planning controlsAdvertising: self-regulated, asa CaP code
7
Radio Editorial: ofcom regulated Advertising: self-regulated, Radiocentre, asa BCaP code
9
Social media Editorial: self-moderated, providers are under increasing criticism for failing to moderate contentAdvertising: self-regulated using asa CaP code which covers paid and earned social. JiCWeBs guidelines for online brand safety. advertisers must subscribe to third party ad verification
see online display for further evidence
2
TV Editorial: ofcom regulatedAdvertising: self-regulated via broadcaster-funded copy clearance body Clearcast, follows asa BCaP code
9
Short-term sales response
definition: ability to activate sales in the short term
scoring criteria: 0–10 where 10 is strong evidence of the medium delivering short-term sales response and 0 where there is no evidence
evidence: secondary research/ebiquity knowledge (econometric modelling)
medium evidence score
Cinema no published secondary research, score based on ebiquity knowledge from econometric modelling 1
Direct mail Outsmart: The Customer Journey (2012)• 54% of dm and door drop encounters generated a ‘do’ response (2nd place)
Thinkbox: Killer Charts (2017) • dm and door drop accounts for 8% of media-driven sales (4th place)
Royal Mail MarketReach: The Private Life of Mail – Mail In The Home, Heart & Head (2015) • When compared to using email on its own, adding mail saw 13% more consumers visit a sender’s website, 21% more made
purchases, 35% more redeemed coupons or vouchers
Royal Mail/IPA Touchpoints (2015)• in response to direct mail 49% used a voucher or coupon/27% bought something/26% renewed a service/subscription
Royal Mail MarketReach, Mail and Digital Part 2, (2014)• as a result of receiving mail 92% of people are driven online, 87% make online purchases, 86% connect with businesses
8
Magazines Outsmart: The Customer Journey (2012)• 49% of magazine encounters generated a ‘do’ response (4th place)• 25% of encounters with press generated search (online & mobile) (3rd place)
Thinkbox: Killer Charts (2017)• Print accounts for 8% of media driven sales (3rd place)
Magnetic: Rules of Attraction (2015)81% of people have bought an item or visited a place after reading about it in a magazine
7
Newspapers Outsmart: The Customer Journey (2012)• 49% of newspaper encounters generated a ‘do’ response (4th place)• 25% of encounters with press generated search (online and mobile) (3rd place)
Thinkbox: Killer Charts (2017)• Print accounts for 8% of media-driven sales (3rd place)
7
Online display
Outsmart: The Customer Journey (2012)• 47% of online encounters generated a ‘do’ response (5th place)• 21% of encounters with online generated search (online and mobile) (1st place)
Thinkbox: Killer Charts (2017)• online display accounts for 12% of media-driven sales (2nd place)
4
Online video
Outsmart: The Customer Journey (2012)• 47% of online encounters generated a ‘do’ response (5th place)• 21% of encounters with online generated search (online and mobile) (1st place)
6
Continued overleaf
Re-evaluating Media
32

medium evidence score
Out of home Outsmart: Outperform (2016)• across all campaigns (35) 9% took brand action on smartphone per campaign
Outsmart: The Customer Journey (2012)• two-thirds of people have searched the web as a direct result of an ooH ad• 1 in 3 people have bought because of ooH advertising• 53% of ooH encounters generated a ‘do’ response (3rd place)• 27% of encounters with ooH generated search (online and mobile) (2nd place)
Thinkbox: Killer Charts (2017)• outdoor (combined with radio) accounts for 4% of media-driven sales (5th place)
3
Radio Radiocentre: Sales Multiplier (2003)• Radio advertising creates an average sales uplift of 9%• Radio advertising creates an average sales uplift of 2.2% per 100 radio ratings
Radiocentre: The Online Multiplier (2010)• those exposed to the radio campaign were 52% more likely to include the brand name in their internet browsing. 58%
went online within 24 hours of exposure
Outsmart: The Customer Journey (2012)• 61% of radio encounters generated a ‘do’ response (1st place)
Thinkbox: Killer Charts (2017)• Radio (combined with outdoor) accounts for 4% of media-driven sales (5th place)
9
Social media no published secondary research, score based on ebiquity knowledge from econometric modelling 4
TV Outsmart: The Customer Journey (2012)• 34% of tv encounters generated a ‘do’ response (6th place)• 18% of encounters with tv generated search (online and mobile) (4th place)
Thinkbox: Killer Charts (2017)• tv accounts for 33% of media-driven sales (1st place)• 47% of website visits generated from paid media were from tv
10
Transparent third party audience measurement
definition: audience measurement tool (survey) is fully transparent and is verified by third parties (JiC). transparent post-campaign delivery reports are provided
scoring criteria: 0–10, where 10 is the audience measurement is fully transparent and third party verified and 0 is no transparency or third party verification
evidence: secondary research/ ebiquity knowledge
medium evidence score
Cinema • Cinema admissions are monitored by Comscore (transparent methodology as census of all cinemas)• Cinemas feed admissions data to contractors for campaign delivery reports
• demographic data collected through survey-based tools such as Fame survey• very little information about the tools online so lacking in transparency• measurement tools overseen by the Cinema advertising association and industry representatives from film exhibitors and
distributors
6
Direct mail • a Joint industry Committee (JiC) JiCmail has recently been formed and is backed by buyer and seller organisations including the dma, iPa, isBa, Royal mail and Whistl. it has set up a panel-based survey tool to measure audiences and deliver media planning metrics to provide an industry currency. methodology is fully transparent on website. not yet established in the industry
• Royal mail has aBC accreditation for its Customer summary report, including auditable proof of delivery. little information available on Royal mail website
7
Magazines • aBC – print verification• nRs (amP – from Feb 2018) is governed by the Publishers audience measurement Company (PamCo) whose stakeholders are the
news media association, Professional Publishers association and the institute of Practitioners in advertising. the board also has representation from the incorporated society of British advertisers (isBa). methodology and questionnaire are fully transparent
• JiCReg – local newspaper readership (print and online) • no post-campaign delivery reports – campaign impacts have to be derived by agency or third party from nRs data
9
Newspapers • as magazines above 9
Online display
• no single measurement tool (Comscore and nielsen are main providers), not fully independent, some third party governance, some transparency on methodology
• uKom (governed by iaB and aoP) sets and governs the uK industry standard for online audience measurement but is not yet classed as a JiC. uKom only oversees Comscore’s methodology. nielsen’s methodology is approved by their media Research Council (no transparency on members of the council)
• aBC – digital verification• Post-campaign delivery reports available via media owner stats, agency ad server stats, as well as via independent third
parties (e.g. audience verification, ad verification). no single source industry standard
6
Continued overleaf
Re-evaluating Media
33

Re-evaluating Media
34
medium evidence score
Online video • see online display above• Broadcast vod not currently measured by BaRB. youtube provides audience analytic tool• Post-campaign delivery – limited media owner stats only for Broadcaster vod; for non-broadcaster vod, with variable
detail – via media owner stats, agency adserver stats, as well as via independent third parties (e.g. audience verification, ad verification)
5
Out of home • Route a Joint industry Currency (JiC). Route is independent of any special interests. its board of directors has an equal representation from the buyers and sellers of the medium. methodology is transparent
• digital ooH relies on media owner logs to verify that copy was played and share of voice achieved. Route via the outdoor specialists, provides post-campaign delivery reports
9
Radio • RaJaR ltd (Radio Joint audience Research) is a JiC and is jointly owned by the BBC and by the Radiocentre (the trade body representing the vast majority of Commercial Radio stations in the uK). overseen by a board and a technical man-agement group (tmg) made up of representatives of the BBC, commercial radio and the advertising community
• RaJaR is survey-based, methodology is fully transparent
• J-et is the industry trading platform and provides post-campaign delivery reports
9
Social media • Facebook/instagram, twitter all provide audience analytic tools, Comscore and nielsen also cover social media audience measurement (see online display). no single measurement tool or JiC
• Post-campaign delivery reports available via social media platforms own data or third parties (e.g. ad verification)
6
TV • BaRB is an independent JiC funded by the BBC and commercial broadcasters, methodology is transparent on website• BaRB does not cover broadcast vod. BaRB project dovetail currently in development will allow integrated audience
measurement across tv, PC and tablet• BaRB provides post-campaign delivery reports
9

Re-evaluating Media
35
about ebiquityebiquity is a leading independent marketing and media consultancy.
Registered office: CityPoint, 1 Ropemaker street, london, eC2y 9aW
t. 020 7650 9600 www.ebiquity.com www.linkedin.com/company/ebiquity-plc/
about RadiocentreRadiocentre is the industry body for commercial radio. Radiocentre works on behalf of stakeholders who represent 90% of commercial radio in terms of listening and revenue.
Registered office: 6th floor, 55 new oxford street, london, WC1a 1Bs
t. 020 7010 0600 www.radiocentre.org www.linkedin.com/company/radiocentre/

ebiquity.com @ebiquityglobal blog.ebiquity.com [email protected]