Embed Size (px)
Citation preview

What the data can tell us?
1
1 NCPS Feb 2017
Mr Gerry Kelliher, Business Intelligence, National Clinical Programme in Surgery [email protected] // 087 124 0759

2 NCPS use HIPE data for reports - Confidential
Surgery Discharges between 2010 and 2015 (including Acute and Elective admissions for surgery or surgical care
excludes obstetrics, maternity hospitals, hospices and rehab units)
Note: New 2015 surgical procedure map table reapplied to all yearly analysis 2010 … 2015
Comparing 2015 to 2010
54,032 more cases treated in 2015
87,561 less bed days needed
122,172 less overnight stay bed days but
69,222 more day cases require 34,611 more day bed days
Without these improvements
An extra 54,032 more cases in 2015
Would require 242,372 more bed days
Or 2 more model 3 hospitals
Dedicated to surgery

We DID great
• Data Informed Decision making in delivering quality improvement as iterative cycles
– Leveraging HIPE data
• Projected population changes and their impact on activity and bed requirement
– Leveraging CSO data combine with HIPE data
3
3 NCPS uses HIPE & CSO data Feb 2017
“Facts do not cease to exist because they are ignored” – Aldous Huxley

4
4 NCPS Feb 2017
D M A I C
Define the problem or area you want to focus on
NQAIS summary report, …
Measure what is happening now, Variance analysis
NQAIS Plots, Grid, …
Analyse the problem, Ishikawa (root cause analysis),
Pick & scope the Quality Improvement initiative
Data driven decision making, …
Implement quality improvement initiative
Control Verify desired impact, adjust as necessary &
sustain NQAIS …
People working together deliver Quality
Improvement

5 NCPS uses HIPE data Feb 2017
Total Hip Replacement – Elective discharge Volumes and AvLOS by quarter 2010 to 2015
AvLOS: 8.8 7.7 8.7 6.3 5.6 5.5
AvLOS: 8.5 8.4 6.6 6.4 6.0 5.5 AvLOS: 8.7 7.9 5.3 5.1 5.2 5.8
AvLOS: 9.1 8.4 5.1 4.7 4.7 4.6
Avg. 1 day less
Trending upwards
Quality Improvement
variance
Hospital 1 Hospital 2
Hospital 3 Hospital 4

6 NCPS Feb 2017
60% Nat.
Target
60% Nat.
Target
Elective Lap Chole. day case rate 4 individual hospitals by Qtr 2010 … 2015 M4 – above target M4 (with associate M2’s) – off target
M2S (highest volume) – off target M3 (best improver) – above target
Quality Improvement
variance

7 NCPS uses HIPE data Feb 2017
ProcDesc (Code) Inpat BDU AvLOS Inpat BDU AvLOS
Laparoscopic appendicectomy (3057200) 3,760 11,802 3.1 76 142 1.9 71 3,907
Appendicectomy (3057100) 437 2,240 5.1 12 51 4.3 4 453
Grand Total 4,197 14,042 3.3 88 193 2.2 75 4,360
Acute Elective
Day CasesTotal
Discharges
National Laparoscopic and Open Appendicectomy volumes & AvLOS by Hospital, 2015 - Adults
Hospital Groups
Individual Hospital
NQAIS Surgery enables tracking of Comparative AvLOS by Hospital, Acute AvLOS from Nov’15 to Oct’16
2.36 4.00
3.84
2.52
Quality Improvement
variance

8
8 NCPS uses HIPE data Feb 2017
1.64 day difference In AVLOS
1.32 day difference In AVLOS
M4 – Higher AvLOS (4.0) M3 – Lower AvLOS (2.36)
M3 – Higher AvLOS (3.84) M3 – Lower AvLOS (2.52)
Acute Lap & Open Appendectomy volumes & AvLOS by Qtr, 2015
Same Hospital Group
Same Hospital Group

9 NCPS uses HIPE data Feb 2017
NQAIS Surgery can be used to support process improvement – 4 consultants – Tonsil DC rate
0.0% Clinician 1
Clinician 2
Clinician 3
Clinician 4
Dec’15-Nov’16
0.5%
Quality Improvement opportunity - variance
18.9%
54.8%

Variance analysis – Red bed days
10 NCPS uses HIPE data Feb 2017
D M A I C
People working together deliver Quality
Improvement Decision Making After Informed Choices

Ireland’s population is increasing and ageing.
Will increasing population age impact on capacity?
Ireland population census of 2011 Projected to 2040 by gender and age
Ireland population census of 2011 Projected by age in five year increments
Age Bands
6 million
5 million
4 million
3 million
2 million
1 million
11
11 NCPS uses CSO data Feb 2017 11
5.0 5.3
4.7/4.8
5.6
20.2% increase

Age Bands
Age Bands
2015 Bed Days Used by age band projected 2015 discharges by age band projected
12
12 NCPS uses HIPE and CSO data in combination Feb 2017
We can see the impact of population change on hospital bed resources Using HIPE actuals for 2015 & CSO population projections 2011
Note: actual stay LOS & 0.5 days for same day / day cases
52.6% increase 86.3% increase Specialties: All surgical, medical, paediatric and other specialties

Age Bands
2015 Bed Days Used by age band projected 2015 discharges by age band projected
13 NCPS uses HIPE and CSO data in combination Feb 2017
What does Surgery look like Using HIPE actuals for 2015 & CSO population projections
Specialties: All surgical specialties
47.5% increase 73.2% increase

Age Bands
Age Bands
2015 Bed Days Used by age band projected 2015 discharges by age band projected
14
14 NCPS uses HIPE and CSO data in combination Feb 2017
What does General Surgery look like Using HIPE actuals for 2015 & CSO population projections
Specialties: Breast Surgery, Gastro-Intestinal Surgery, General Surgery, Hepato-Biliary Surgery and Vascular Surgery
42.9% increase 70.4% increase
Age Bands

Age Bands
Age Bands
2015 Bed Days Used by age band projected 2015 discharges by age band projected
15
15 NCPS uses HIPE and CSO data in combination Feb 2017
What does Trauma Orthopaedic Surgery look like Using HIPE actuals for 2015 & CSO population projections
Specialties: Orthopaedic and Paediatric Orthopaedic Surgery
48.8% increase 105.5% increase

Age Bands
Age Bands
2015 Bed Days Used by age band projected 2015 discharges by age band projected
16
16 NCPS uses HIPE and CSO data in combination Feb 2017
What does Gynaecology look like Using HIPE actuals for 2015 & CSO population projections
Specialties: Orthopaedic and Paediatric Orthopaedic Surgery
16.6% increase 27.5% increase
Age Bands
Age Bands
2015 Bed Days Used by age band projected 2015 discharges by age band projected
17
17 NCPS uses HIPE and CSO data in combination Feb 2017
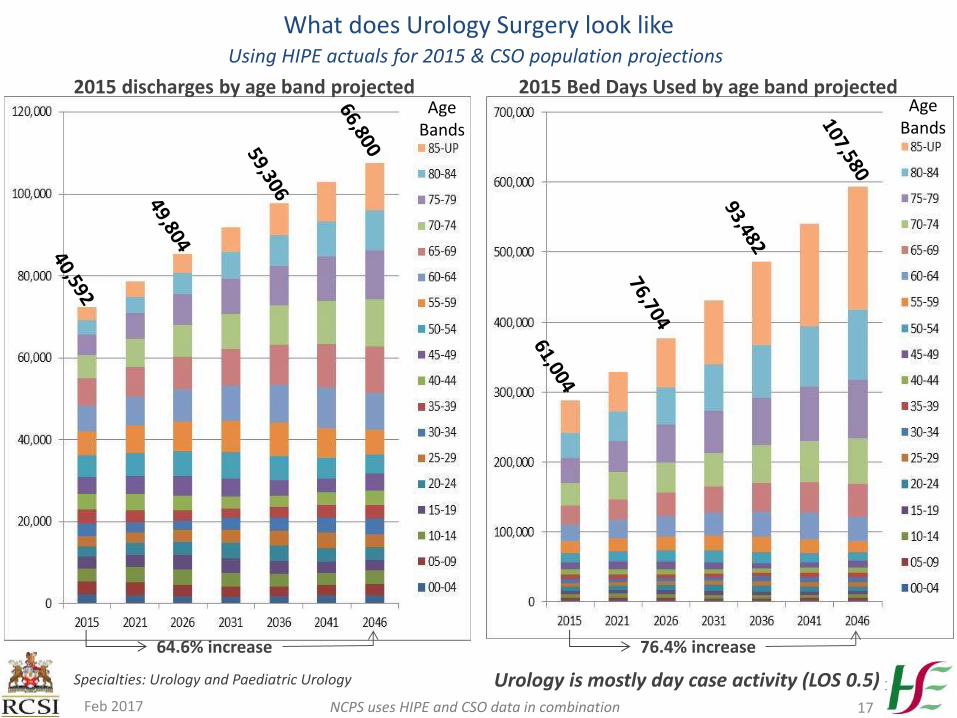
What does Urology Surgery look like Using HIPE actuals for 2015 & CSO population projections
Specialties: Urology and Paediatric Urology
64.6% increase 76.4% increase
Urology is mostly day case activity (LOS 0.5)

Age Bands
Age Bands
2015 Bed Days Used by age band projected 2015 discharges by age band projected
18 NCPS uses HIPE and CSO data in combination Feb 2017
What does Otolaryngology (ENT) Surgery look like Using HIPE actuals for 2015 & CSO population projections
Specialties: Otolaryngology (ENT) and Paediatric ENT
25.6% increase 43.2% increase
Otolaryngology is mostly day case activity (LOS 0.5)

Surgery Demand into the future
• There will be a 47.5% surgery patients due to demographic pressures by 2046 (BDU 73.2%)
• Not all specialties will be impacted at the same rate
– Capacity planning
– Workforce alignment
• Needs further analysis because
– Initial analysis crude
– Does not anticipate technology advancement, etc
– Includes external migration trends but not internal (eg. urbanisation)
– Are there differing demand growths by Sex, Procedure and/or Diagnosis, … ?
19 NCPS Feb 2017

How do we configure our hospital for surgery in the future?
• Issues
– Trauma & Emergency
– Cancer treatment and other elective/planned activity
– Hospital Groups and CHO’s
• Location of service relative to the population?
– Surgical team’s
• What is a reasonable on-call rota?
• What is a reasonable workload?
– Trolleys v. Waiting lists v. Bed Occupancy (100% ?)
– Budgetary limitations
– The socio-political game
20 NCPS Feb 2017

NCPS 21 Feb 2017- Use HSE data
Information Decision Making
Action
Review and Control
Measure
“We DID great”
We have seen Data Informed Decision making in Quality Improvement.
People working together deliver Quality
Improvement
Thank You
• Any Questions?
Mr Gerry Kelliher, Business Intelligence, National Clinical Programme in Surgery [email protected] // 087 124 0759
22 NCPS Feb 2017

Backup slides
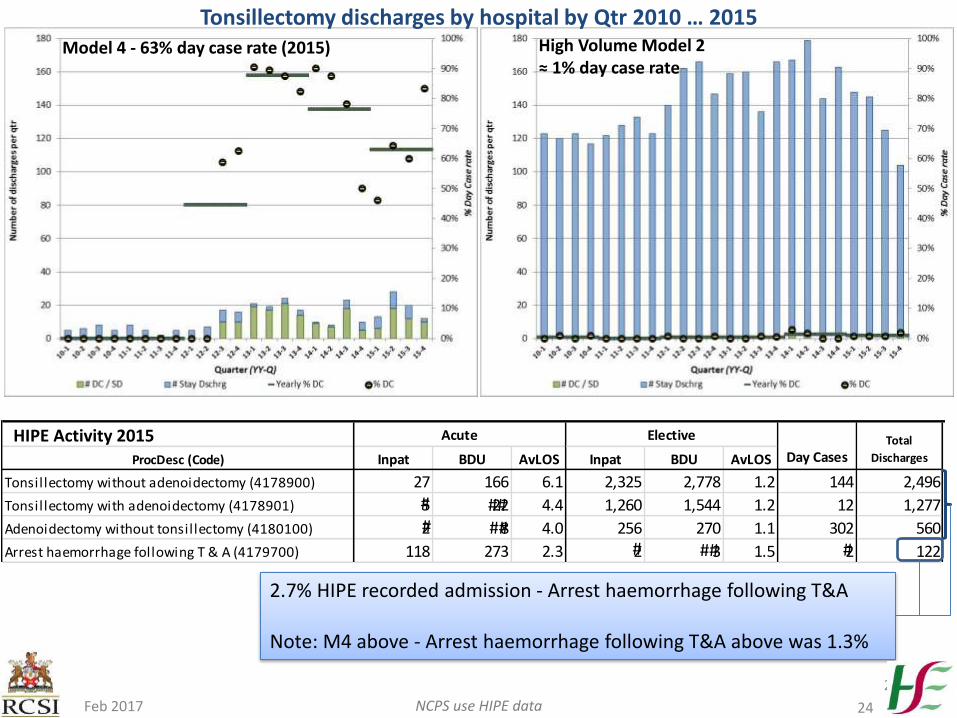
Tonsillectomy discharges by hospital by Qtr 2010 … 2015
ProcDesc (Code) Inpat BDU AvLOS Inpat BDU AvLOS
Tonsillectomy without adenoidectomy (4178900) 27 166 6.1 2,325 2,778 1.2 144 2,496
Tonsillectomy with adenoidectomy (4178901) 5 22 4.4 1,260 1,544 1.2 12 1,277
Adenoidectomy without tonsillectomy (4180100) 2 8 4.0 256 270 1.1 302 560
Arrest haemorrhage following T & A (4179700) 118 273 2.3 2 3 1.5 2 122
Acute Elective
Day CasesTotal
Discharges
2.7% HIPE recorded admission - Arrest haemorrhage following T&A Note: M4 above - Arrest haemorrhage following T&A above was 1.3%
High Volume Model 2 ≈ 1% day case rate
Model 4 - 63% day case rate (2015)
HIPE Activity 2015
24
24 NCPS use HIPE data Feb 2017
# ## # ##
# ## #

Age Bands
Age Bands
2015 Bed Days Used by age band projected 2015 discharges by age band projected
25 NCPS uses HIPE and CSO data in combination Feb 2017
What does Adult Medicine look like Using HIPE actuals for 2015 & CSO population projections
Specialties: All Adult Medicine Specialties
68.4% increase 113.8% increase

Age Bands
Age Bands
2015 Bed Days Used by age band projected 2015 discharges by age band projected
26
26 NCPS uses HIPE and CSO data in combination Feb 2017
What does Obstetrics & Gynaecology Surgery look like Using HIPE actuals for 2015 & CSO population projections
Specialties: Gynaecology, Obstetrics, and Obstetric/Gynaecology (not all surgical in nature)
14.3% increase 15.5% increase

Age Bands
Age Bands
2015 Bed Days Used by age band projected 2015 discharges by age band projected
27 NCPS uses HIPE and CSO data in combination Feb 2017
What does Geriatric Medicine look like Using HIPE actuals for 2015 & CSO population projections
Specialties: All Adult Medicine Specialties
131.8% increase 170.3% increase
? ? ? ?

NQAIS – a complex story – simply told
• Clinically focused
• Easily learnt & understood (user friendly)
• Important signals visible at a glance
• ~3 months in arrears, refreshed monthly
28
Split by Procedure within Surgical Specialty
NCP / HIU / HIPE / OpenApp -> NQAIS
Split by CCS for diagnoses within
CCS group
NQAIS database
HIU process HIPE data
It is available to you
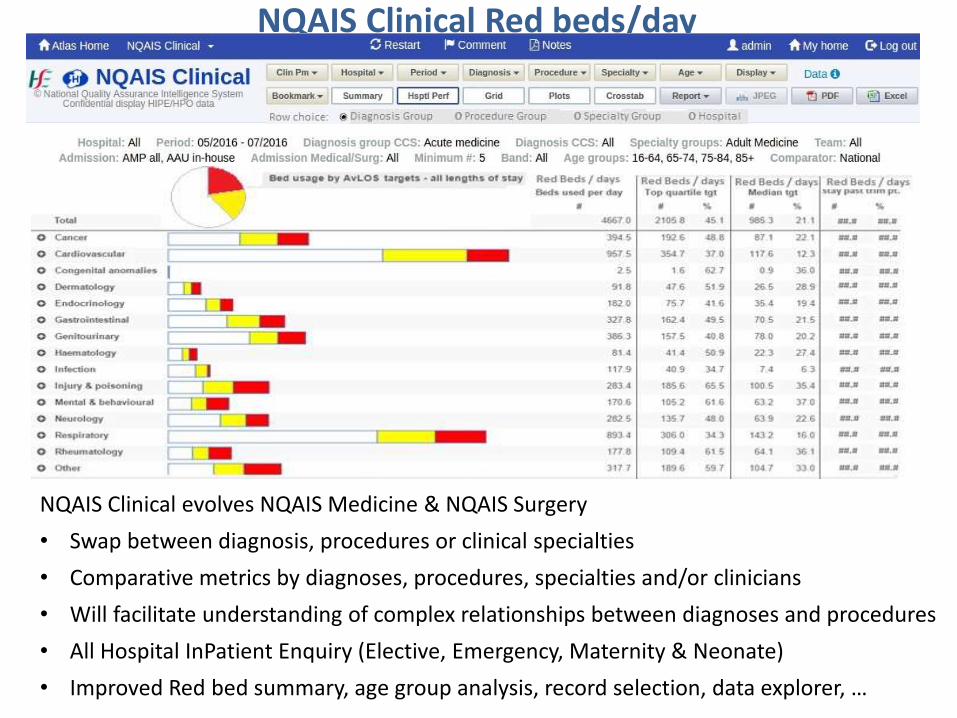
NQAIS Clinical Red beds/day
NQAIS Clinical evolves NQAIS Medicine & NQAIS Surgery
• Swap between diagnosis, procedures or clinical specialties
• Comparative metrics by diagnoses, procedures, specialties and/or clinicians
• Will facilitate understanding of complex relationships between diagnoses and procedures
• All Hospital InPatient Enquiry (Elective, Emergency, Maternity & Neonate)
• Improved Red bed summary, age group analysis, record selection, data explorer, …