Embed Size (px)
Citation preview

What science can doAstraZeneca Annual Report and Form 20-F Information 2019

Financial Statements
Auditors’ Report 162
Consolidated Statements 168
Group Accounting Policies 172
Notes to the Group Financial Statements 179
Group Subsidiaries and Holdings 227
Company Statements 231
Company Accounting Policies 233
Notes to the Company Financial Statements 234
Group Financial Record 236
Key
KJ Key Judgement
SE ignificant sti ates
160 AstraZeneca Annual Report & Form 20-F Information 2019 / Corporate Governance
The Directors are responsible for preparing this Annual Report and Form 20-F Information and the Group and Parent Company Financial Statements in accordance with applicable law and regulations.
Company law requires the Directors to prepare Group and Parent Company Financial Statements for each �nancial year. Under that law they are required to prepare the Group Financial Statements in accordance with IFRSs as issued by the IASB and adopted by the EU, and applicable law, and have elected to prepare the Parent Company Financial Statements in accordance with UK Accounting Standards, including FRS 101 ‘Reduced Disclosure Framework’ and applicable law.
Under company law, the Directors must not approve the Financial Statements unless they are satis�ed that they give a true and fair view of the state of affairs of the Group and Parent Company and of their pro�t or loss for that period. In preparing each of the Group and Parent Company Financial Statements, the Directors are required to:
> select suitable accounting policies and then apply them consistently
> make judgements and estimates that are reasonable and prudent
> for the Group Financial Statements, state whether they have been prepared in accordance with IFRSs as adopted by the EU
> for the Parent Company Financial Statements, state whether FRS 101 has
been followed, subject to any material departures disclosed and explained in the Parent Company Financial Statements
> prepare the Financial Statements on the going concern basis unless it is inappropriate to presume that the Group and the Parent Company will continue in business.
The Directors are responsible for keeping adequate accounting records that are suf�cient to show and explain the Parent Company’s transactions and disclose with reasonable accuracy at any time the �nancial position of the Parent Company and enable them to ensure that its Financial Statements comply with the Companies Act 2006. They have general responsibility for taking such steps as are reasonably open to them to safeguard the assets of the Group and to prevent and detect fraud and other irregularities.
Under applicable law and regulations, the Directors are also responsible for preparing a Directors’ Report, Strategic Report, Directors’ Remuneration Report, Corporate Governance Report and Audit Committee Report that comply with that law and those regulations.
The Directors are responsible for the maintenance and integrity of the corporate and �nancial information included on our website. Legislation in the UK governing the preparation and dissemination of Financial Statements may differ from legislation in other jurisdictions.
Directors’ responsibility statement pursuant to DTR 4The Directors con�rm that to the best of our knowledge:
> the Financial Statements, prepared in accordance with the applicable set of accounting standards, give a true and fair view of the assets, liabilities, �nancial position and pro�t or loss of the Company and the undertakings included in the consolidation taken as a whole
> the Directors’ Report includes a fair review of the development and performance of the business and the position of the issuer and the undertakings included in the consolidation taken as a whole, together with a description of the principal risks and uncertainties that they face.
On behalf of the Board of Directors on 14 February 2020Pascal SoriotDirector
The Directors are responsible for establishing and maintaining adequate internal control over �nancial reporting. AstraZeneca’s internal control over �nancial reporting is designed to provide reasonable assurance over the reliability of �nancial reporting and the preparation of consolidated Financial Statements in accordance with generally accepted accounting principles.
Due to its inherent limitations, internal control over �nancial reporting may not prevent or detect misstatements. Projections of any evaluation of effectiveness to future periods are subject to the risks that controls may become inadequate because of changes in conditions or that the degree of compliance with the policies or procedures may deteriorate.
The Directors assessed the effectiveness of AstraZeneca’s internal control over �nancial reporting as at 31 December 2019 based on the criteria set forth by the Committee of Sponsoring Organizations of the Treadway Commission in Internal Control-Integrated Framework (2013). Based on this assessment, the Directors believe that, as at 31 December 2019, the internal control over �nancial reporting is effective based on those criteria.
PricewaterhouseCoopers LLP, an independent registered public accounting �rm, has audited the effectiveness of internal control over �nancial reporting as at 31 December 2019 and has issued an unquali�ed report thereon.
Directors’ Annual Report on Internal Controls over Financial Reporting
Preparation of the Financial Statements and irectors es onsibi ities
161AstraZeneca Annual Report & Form 20-F Information 2019 / Financial Statements
Financial S
tatements
Report on the audit of the financia state entsOpinionIn our opinion:
> AstraZeneca PLC’s Group Financial Statements and Parent Company Financial Statements (the “�nancial statements”) give a true and fair view of the state of the Group’s and of the Parent Company’s affairs as at 31 December 2019 and of the Group’s pro�t and cash �ows for the year then ended;
> the Group Financial Statements have been properly prepared in accordance with International Financial Reporting Standards (IFRSs) as adopted by the European Union;
> the Parent Company Financial Statements have been properly prepared in accordance with United Kingdom Generally Accepted Accounting Practice (United Kingdom Accounting Standards, comprising FRS 101 “Reduced Disclosure Framework”, and applicable law); and
> the �nancial statements have been prepared in accordance with the requirements of the Companies Act 2006 and, as regards the Group Financial Statements, Article 4 of the IAS Regulation.
We have audited the �nancial statements, included within the Annual Report and Form 20-F Information 2019 (the “Annual Report”), which comprise: the Consolidated Statement of Financial Position as at 31 December 2019, the Consolidated Statement of Comprehensive Income for the year ended 31 December 2019, the Consolidated Statement of Cash Flows for the year ended 31 December 2019, the Consolidated Statement of Changes in Equity for the year ended 31 December 2019, the Group Accounting Policies and the Notes to the Group Financial Statements, the Company Balance Sheet as at 31 December 2019, the Company Statement of Changes in Equity for the year ended 31 December 2019, the Company Accounting Policies and the Notes to the Company Financial Statements.
Our opinion is consistent with our reporting to the Audit Committee.
Separate opinion in relation to IFRSs as issued by the IASBAs explained in the Group Accounting Policies, the Group, in addition to applying IFRSs as adopted by the European Union, has also applied IFRSs as issued by the International Accounting Standards Board (IASB).
In our opinion, the Group Financial Statements have been properly prepared in accordance with IFRSs as issued by the IASB.
Basis for opinionWe conducted our audit in accordance with International Standards on Auditing (UK) (“ISAs (UK)”) and applicable law. Our responsibilities under ISAs (UK) are further described in the Auditors’ responsibilities for the audit of the �nancial statements section of our report. We believe that the audit evidence we have obtained is suf�cient and appropriate to provide a basis for our opinion.
IndependenceWe remained independent of the Group in accordance with the ethical requirements that are relevant to our audit of the �nancial statements in the UK, which includes the FRC’s Ethical Standard, as applicable to listed public interest entities, and we have ful�lled our other ethical responsibilities in accordance with these requirements.
To the best of our knowledge and belief, we declare that non-audit services prohibited by the FRC’s Ethical Standard were not provided to the Group or the Parent Company.
Other than those disclosed in note 30 to the Group Financial Statements, we have provided no non-audit services to the Group or the Parent Company in the period from 1 January 2019 to 31 December 2019.
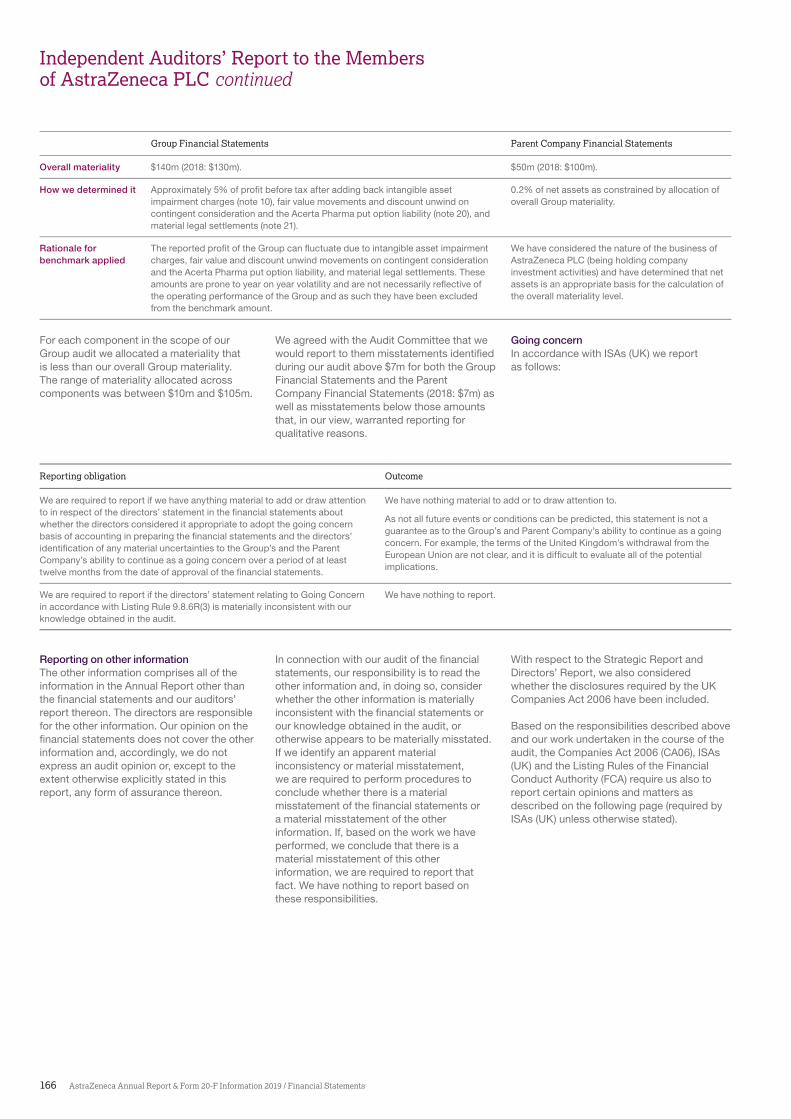
Our audit approachOverviewMateriality > Overall Group materiality: $140m (2018: $130m), based on approximately 5% of pro�t before tax after adding back intangible asset impairment charges (note 10), fair value movements and discount unwind on contingent consideration and the Acerta Pharma put option liability (note 20), and material legal settlements (note 21).
> Overall Parent Company materiality: $50m (2018: $100m), representing 0.2% of net assets as constrained by the allocation of overall Group materiality.
Audit scope > We identi�ed ten reporting components which required a full scope audit of their complete �nancial information, either due to their size or risk characteristics. These components are the principal operating units in the US, UK, Sweden, China, Japan, France, Germany and Brazil as well as the Parent Company and AstraZeneca Treasury Limited.
> We also identi�ed a further nine reporting components which had one or more individual balances that were considered signi�cant to the Group’s Financial Statements. For these components our work was solely focussed on revenue, accounts receivable, inventory, research and development expense or property, plant and equipment, as appropriate.
> Audit procedures were performed centrally over certain shared service functions for transaction processing, IT and in relation to various Group functions, including taxation, pensions, goodwill, intangible assets (excluding software), other investments, and litigation matters, as well as the consolidation.
> Taken together, the above procedures accounted for 88% of the Group’s revenue and over 77% of the Group’s absolute pro�t before tax.
Key audit matters > Recognition and measurement of accruals for certain rebates and returns in the US
> Assessment of the recoverability of the carrying value of intangible assets (product, marketing and distribution rights and other intangible assets)
> Recognition and measurement of litigation provisions and contingent liabilities
> Recognition and measurement of uncertain tax positions
> Valuation of the Group’s de�ned bene�t obligations
In 2019, accounting for externalisation and collaboration arrangements was not considered to be a key audit matter due to the nature of the arrangements entered into in 2019.
The scope of our auditAs part of designing our audit, we determined materiality and assessed the risks of material misstatement in the �nancial statements.
Capability of the audit in detecting irregularities, including fraudBased on our understanding of the Group and the industry in which it operates, we identi�ed that the principal risks of non-compliance with laws and regulations related to patent protection, product safety, competition law and environmental matters (see note 29), and we considered the extent to which non-compliance might have a material effect on the Group Financial Statements. We also considered those laws and regulations that have a direct impact on the preparation of the �nancial statements such as the Companies Act 2006 and tax legislation. We evaluated management’s incentives and opportunities for fraudulent manipulation of the �nancial statements (including the risk of override of controls), and determined that the principal risks were related to posting inappropriate journal entries to manipulate �nancial results and potential management bias in accounting estimates. The Group engagement team shared this risk assessment with the component auditors so that they could include appropriate audit procedures in response to such risks in their work. Audit procedures performed by the Group engagement team and/or component auditors included:
Independent Auditors’ Report to the Members of stra eneca
162 AstraZeneca Annual Report & Form 20-F Information 2019 / Financial Statements
> Discussions with management, internal audit, the Deputy Chief Compliance Of�cer and the Group’s General Counsel and Deputy General Counsels, including consideration of known or suspected instances of non-compliance with laws and regulations and fraud;
> Evaluation and testing of the operating effectiveness of management’s controls designed to prevent and detect irregularities;
> Assessment of matters reported on the Group’s whistleblowing helpline and the results of management’s investigation of such matters;
> Challenging assumptions made by management in their signi�cant accounting estimates, in particular in relation to the recognition and measurement of certain rebate and return accruals, the impairment of intangible assets (excluding goodwill and software assets), the recognition and measurement of litigation provisions and contingent liabilities, the recognition and measurement of uncertain tax positions, and the valuation of the de�ned bene�t obligations (see related key audit matters below); and
> Identifying and testing journal entries, in particular any journal entries posted with unusual account combinations, journals posted by senior management and consolidation journals.
There are inherent limitations in the audit procedures described above, and the further removed non-compliance with laws and regulations is from the events and transactions re�ected in the �nancial statements, the less likely we would become aware of it. Also, the risk of not detecting a material misstatement due to fraud is higher than the risk of not detecting one resulting from error, as fraud may involve deliberate concealment by, for example, forgery or intentional misrepresentations, or through collusion.
Key audit mattersKey audit matters are those matters that, in the auditors’ professional judgement, were of most signi�cance in the audit of the �nancial statements of the current period and include the most signi�cant assessed risks of material misstatement (whether or not due to fraud) identi�ed by the auditors, including those which had the greatest effect on: the overall audit strategy; the allocation of resources in the audit; and directing the efforts of the engagement team. These matters, and any comments we make on the results of our procedures thereon, were addressed in the context of our audit of the �nancial statements as a whole, and in forming our opinion thereon, and we do not provide a separate opinion on these matters. This is not a complete list of all risks identi�ed by our audit.
Key audit matter How our audit addressed the key audit matter
Recognition and measurement of accruals for certain rebates and returns in the USRefer to page 121 (Audit Committee Report), page 173 (Accounting Policies) and page 180 and 199 (note 1 and 20) in the Group Financial Statements.
In the US the Group sells to customers under various commercial and government mandated contracts and reimbursement arrangements that include rebates for certain products, of which the most signi�cant are Medicare Part D, Managed Care and Medicaid (and similar state programmes). In addition, sales arrangements provide a right of return.
Rebates and returns provided to customers under these arrangements are accounted for as variable consideration, estimated at the time of sale using the expected value method, and recognised as a reduction in revenue, for which unsettled amounts are accrued. Management has determined an accrual of $3,383m to be necessary at 31 December 2019.
Estimating future rebates and return arrangements is complex and establishing an appropriate accrual requires signi�cant management estimation with respect to the application of the contractual and mandated terms with customers, historical experience and projected market conditions in the US. Changes in these estimates (individually or in combination) can have a signi�cant �nancial impact.
We evaluated the design and tested the operating effectiveness of controls relating to the rebates and returns accrual and over the assumptions used to estimate the accruals for the Medicare Part D, Managed Care and Medicaid (and similar state programmes) rebate arrangements and the returns accruals. We determined that we could rely on these controls for the purposes of our audit.
We obtained management’s calculations for accruals under applicable schemes and assessed management’s calculations by reference to the Group’s stated commercial policies, the terms of the applicable contracts, third party data related to patient enrolment in US government funded bene�t schemes and historical levels of product returns.
We:
> developed an independent expectation of these accruals using third party information on price and market conditions in the US, the terms of the speci�c rebate programs and returns policies, and the historical trend of actual rebate claims paid and returns made;
> compared the independent estimate to management’s estimates recorded by the Group;
> considered the historical accuracy of the Group’s estimates in previous years and the effect of any adjustments to prior years’ accruals in the current year’s results; and
> tested a sample of rebate claims and returns processed by the Group, including evaluating those claims for consistency with the contractual and mandated terms of the Group’s arrangements.
Based on the procedures performed, we did not identify any material misstatements in the accruals.
We also evaluated the appropriateness of the disclosures in Note 1 and Note 20 which we considered appropriate.
163AstraZeneca Annual Report & Form 20-F Information 2019 / Financial Statements
Financial S
tatements
Independent Auditors’ Report to the Members of stra eneca continued
Key audit matter How our audit addressed the key audit matter
Assessment of the recoverability of the carrying value of intangible assets (product, marketing and distribution rights and other intangible assets)Refer to page 122 (Audit Committee Report), page 175 (Accounting Policies) and page 190 (note 10) in the Group Financial Statements.
The Group has product, marketing and distribution rights and other intangible assets (hereafter the intangible assets) totalling $20,601m at 31 December 2019. Those assets under development and not available for use are tested annually for impairment and other intangible assets are tested when there is an indication of impairment.
The recoverability of the carrying values of intangible assets is contingent on future cash �ows and/or the outcome of research and development (R&D) activities. There is a risk that the assets will be impaired if those cash �ows or R&D outcomes are not in line with expectations. The projections in management’s impairment models contain a number of signi�cant estimates including the outcome of R&D activities, the probability of technical and regulatory success, and the amount and timing of projected future cash �ows (in particular peak year sales and sales erosion curves). Changes in these assumptions could have an impact on the recoverable amount of intangible assets.
We evaluated the design and tested the operating effectiveness of controls over management’s assessment of the impairment of intangible assets. We determined that we could rely on these controls for the purposes of our audit.
For those assets or cash generating units which we selected based on our risk assessment to be in scope for our audit, we:
> tested management’s process for determining the recoverable amount; > evaluated the appropriateness of the methodology used in the impairment
models; > tested the completeness and accuracy of the models as well as the underlying
data used in the models, including ensuring that the cash �ows reconcile to the Board approved Long Range Plan; and
> evaluated the signi�cant assumptions used by management in determining future cash �ows, including the probability of technical and regulatory success, peak year sales and sales erosion curves.
In evaluating the reasonableness of management’s assumptions we:
> compared signi�cant assumptions (including management’s probability of technical and regulatory success, peak year sales assumptions and sales erosion curves) to external data and benchmarks;
> performed a retrospective comparison of forecasted revenue to actual past performance; and
> performed sensitivity analyses.
We utilised our in-house valuation experts to assess the valuation techniques used and to assist with the evaluation of other key assumptions for higher risk assets (primarily probability of technical and regulatory success).
As a result of our work, we determined that the impairment charge of $1,031m recorded for intangible assets was reasonable.
We considered the disclosures in note 10 of the Group Financial Statements, including sensitivity analysis based on reasonably possible downsides. We are satis�ed that these disclosures are appropriate.
Recognition and measurement of litigation provisions and contingent liabilitiesRefer to page 122 (Audit Committee Report), page 178 (Accounting Policies) and page 200 and 220 (note 21 and 29) in the Group Financial Statements
The Group is engaged in a number of legal actions, including patent litigation, product liability, anti-trust and related litigation. At 31 December 2019 the Group held provisions of $642m in respect of legal claims and disclosed the more signi�cant legal matters in note 29. Determining the likelihood and magnitude of an unfavourable outcome in these matters involves signi�cant management judgement. Accordingly, unexpected adverse outcomes could signi�cantly impact the Group’s reported pro�t and balance sheet position.
We evaluated the design and tested the operating effectiveness of controls in respect of the recognition and measurement of litigation matters and related disclosures. We determined that we could rely on these controls for the purposes of our audit.
We obtained and evaluated letters of audit inquiry with internal and external legal counsel. We evaluated the reasonableness of management’s assessment regarding whether (a) it is probable that a liability exists and (b) a reliable estimate can be made of the likely outcome.
We considered management’s judgements on the level of provisioning to be reasonable. We also evaluated the disclosures in Note 21 and Note 29, which we considered appropriate.
Recognition and measurement of uncertain tax positionsRefer to page 122 (Audit Committee Report), page 175 (Accounting Policies) and page 224 (note 29) in the Group Financial Statements
The Group operates in a complex multinational tax environment and is subject to a range of tax risks, leading to uncertain tax positions which arise in the normal course of business, including transaction related tax matters, transfer pricing arrangements and a number of audits and discussions with tax authorities.
At 31 December 2019 the Group recorded provisions of $1,027m in respect of these uncertain tax positions. As disclosed in Note 29, accruals can be built up over a long period of time but the ultimate resolution of tax exposures usually occurs at a point in time, and given the inherent uncertainties in management’s assessments of the outcomes of these exposures there could, in future periods, be adjustments to these provisions that have a material positive or negative effect on the results in any particular period.
We evaluated the design and tested the operating effectiveness of controls in respect of the recognition and measurement of uncertain tax positions. We determined that we could rely on these controls for the purposes of our audit.
With the assistance of our local and international tax specialists, we tested the information used in the determination of whether uncertain tax positions arise and the calculation of the liability for those uncertain tax positions by jurisdiction, including management’s assessment of the technical merits of tax positions (including where relevant evaluating any advice received from the Group’s external advisors) and estimates of the amount of tax bene�t expected to be sustained.
We assessed the completeness of management’s assessment of both the identi�cation of uncertain tax positions and possible outcomes of each uncertain tax position. We also evaluated the status and results of tax audits and enquiries from the relevant tax authorities.
We noted that the assumptions and judgements that are required to formulate the provisions mean that there is a range of possible outcomes. However, from the evidence obtained, we considered the level of provisioning to be acceptable in the context of the Group Financial Statements taken as a whole.
We considered the disclosures in note 29 of the Group Financial Statements. We are satis�ed that these disclosures are appropriate.
164 AstraZeneca Annual Report & Form 20-F Information 2019 / Financial Statements
Key audit matter How our audit addressed the key audit matter
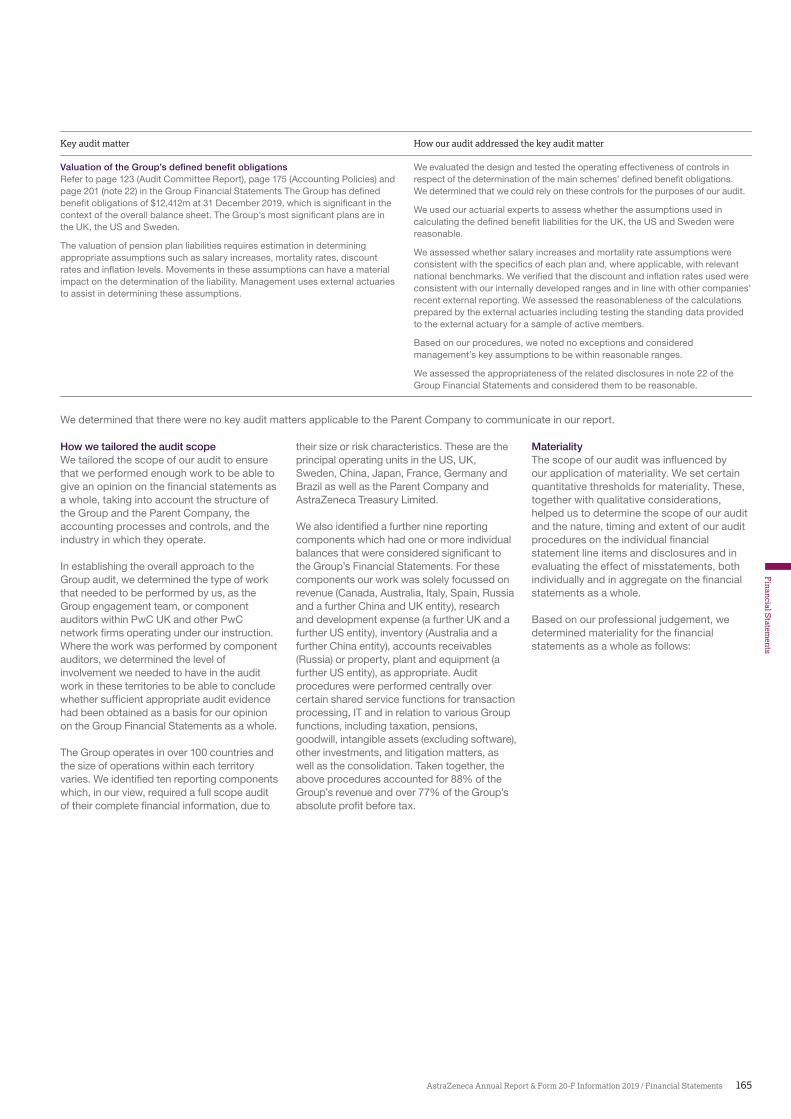
Valuation of the Group’s defined benefit obligationsRefer to page 123 (Audit Committee Report), page 175 (Accounting Policies) and page 201 (note 22) in the Group Financial Statements The Group has de�ned bene�t obligations of $12,412m at 31 December 2019, which is signi�cant in the context of the overall balance sheet. The Group’s most signi�cant plans are in the UK, the US and Sweden.
The valuation of pension plan liabilities requires estimation in determining appropriate assumptions such as salary increases, mortality rates, discount rates and in�ation levels. Movements in these assumptions can have a material impact on the determination of the liability. Management uses external actuaries to assist in determining these assumptions.
We evaluated the design and tested the operating effectiveness of controls in respect of the determination of the main schemes’ de�ned bene�t obligations. We determined that we could rely on these controls for the purposes of our audit.
We used our actuarial experts to assess whether the assumptions used in calculating the de�ned bene�t liabilities for the UK, the US and Sweden were reasonable.
We assessed whether salary increases and mortality rate assumptions were consistent with the speci�cs of each plan and, where applicable, with relevant national benchmarks. We veri�ed that the discount and in�ation rates used were consistent with our internally developed ranges and in line with other companies’ recent external reporting. We assessed the reasonableness of the calculations prepared by the external actuaries including testing the standing data provided to the external actuary for a sample of active members.
Based on our procedures, we noted no exceptions and considered management’s key assumptions to be within reasonable ranges.
We assessed the appropriateness of the related disclosures in note 22 of the Group Financial Statements and considered them to be reasonable.
We determined that there were no key audit matters applicable to the Parent Company to communicate in our report.
How we tailored the audit scopeWe tailored the scope of our audit to ensure that we performed enough work to be able to give an opinion on the �nancial statements as a whole, taking into account the structure of the Group and the Parent Company, the accounting processes and controls, and the industry in which they operate.
In establishing the overall approach to the Group audit, we determined the type of work that needed to be performed by us, as the Group engagement team, or component auditors within PwC UK and other PwC network �rms operating under our instruction. Where the work was performed by component auditors, we determined the level of involvement we needed to have in the audit work in these territories to be able to conclude whether suf�cient appropriate audit evidence had been obtained as a basis for our opinion on the Group Financial Statements as a whole.
The Group operates in over 100 countries and the size of operations within each territory varies. We identi�ed ten reporting components which, in our view, required a full scope audit of their complete �nancial information, due to
their size or risk characteristics. These are the principal operating units in the US, UK, Sweden, China, Japan, France, Germany and Brazil as well as the Parent Company and AstraZeneca Treasury Limited.
We also identi�ed a further nine reporting components which had one or more individual balances that were considered signi�cant to the Group’s Financial Statements. For these components our work was solely focussed on revenue (Canada, Australia, Italy, Spain, Russia and a further China and UK entity), research and development expense (a further UK and a further US entity), inventory (Australia and a further China entity), accounts receivables (Russia) or property, plant and equipment (a further US entity), as appropriate. Audit procedures were performed centrally over certain shared service functions for transaction processing, IT and in relation to various Group functions, including taxation, pensions, goodwill, intangible assets (excluding software), other investments, and litigation matters, as well as the consolidation. Taken together, the above procedures accounted for 88% of the Group’s revenue and over 77% of the Group’s absolute pro�t before tax.
MaterialityThe scope of our audit was in�uenced by our application of materiality. We set certain quantitative thresholds for materiality. These, together with qualitative considerations, helped us to determine the scope of our audit and the nature, timing and extent of our audit procedures on the individual �nancial statement line items and disclosures and in evaluating the effect of misstatements, both individually and in aggregate on the �nancial statements as a whole.
Based on our professional judgement, we determined materiality for the �nancial statements as a whole as follows:
165AstraZeneca Annual Report & Form 20-F Information 2019 / Financial Statements
Financial S
tatements
Independent Auditors’ Report to the Members of stra eneca continued
For each component in the scope of our Group audit we allocated a materiality that is less than our overall Group materiality. The range of materiality allocated across components was between $10m and $105m.
Reporting on other informationThe other information comprises all of the information in the Annual Report other than the �nancial statements and our auditors’ report thereon. The directors are responsible for the other information. Our opinion on the �nancial statements does not cover the other information and, accordingly, we do not express an audit opinion or, except to the extent otherwise explicitly stated in this report, any form of assurance thereon.
We agreed with the Audit Committee that we would report to them misstatements identi�ed during our audit above $7m for both the Group Financial Statements and the Parent Company Financial Statements (2018: $7m) as well as misstatements below those amounts that, in our view, warranted reporting for qualitative reasons.
In connection with our audit of the �nancial statements, our responsibility is to read the other information and, in doing so, consider whether the other information is materially inconsistent with the �nancial statements or our knowledge obtained in the audit, or otherwise appears to be materially misstated. If we identify an apparent material inconsistency or material misstatement, we are required to perform procedures to conclude whether there is a material misstatement of the �nancial statements or a material misstatement of the other information. If, based on the work we have performed, we conclude that there is a material misstatement of this other information, we are required to report that fact. We have nothing to report based on these responsibilities.
Going concernIn accordance with ISAs (UK) we report as follows:
With respect to the Strategic Report and Directors’ Report, we also considered whether the disclosures required by the UK Companies Act 2006 have been included.
Based on the responsibilities described above and our work undertaken in the course of the audit, the Companies Act 2006 (CA06), ISAs (UK) and the Listing Rules of the Financial Conduct Authority (FCA) require us also to report certain opinions and matters as described on the following page (required by ISAs (UK) unless otherwise stated).
Reporting obligation Outcome
We are required to report if we have anything material to add or draw attention to in respect of the directors’ statement in the �nancial statements about whether the directors considered it appropriate to adopt the going concern basis of accounting in preparing the �nancial statements and the directors’ identi�cation of any material uncertainties to the Group’s and the Parent Company’s ability to continue as a going concern over a period of at least twelve months from the date of approval of the �nancial statements.
We have nothing material to add or to draw attention to.
As not all future events or conditions can be predicted, this statement is not a guarantee as to the Group’s and Parent Company’s ability to continue as a going concern. For example, the terms of the United Kingdom’s withdrawal from the European Union are not clear, and it is dif�cult to evaluate all of the potential implications.
We are required to report if the directors’ statement relating to Going Concern in accordance with Listing Rule 9.8.6R(3) is materially inconsistent with our knowledge obtained in the audit.
We have nothing to report.
Group Financial Statements Parent Company Financial Statements
Overall materiality $140m (2018: $130m). $50m (2018: $100m).
How we determined it Approximately 5% of pro�t before tax after adding back intangible asset impairment charges (note 10), fair value movements and discount unwind on contingent consideration and the Acerta Pharma put option liability (note 20), and material legal settlements (note 21).
0.2% of net assets as constrained by allocation of overall Group materiality.
Rationale for benchmark applied
The reported pro�t of the Group can �uctuate due to intangible asset impairment charges, fair value and discount unwind movements on contingent consideration and the Acerta Pharma put option liability, and material legal settlements. These amounts are prone to year on year volatility and are not necessarily re�ective of the operating performance of the Group and as such they have been excluded from the benchmark amount.
We have considered the nature of the business of AstraZeneca PLC (being holding company investment activities) and have determined that net assets is an appropriate basis for the calculation of the overall materiality level.
166 AstraZeneca Annual Report & Form 20-F Information 2019 / Financial Statements
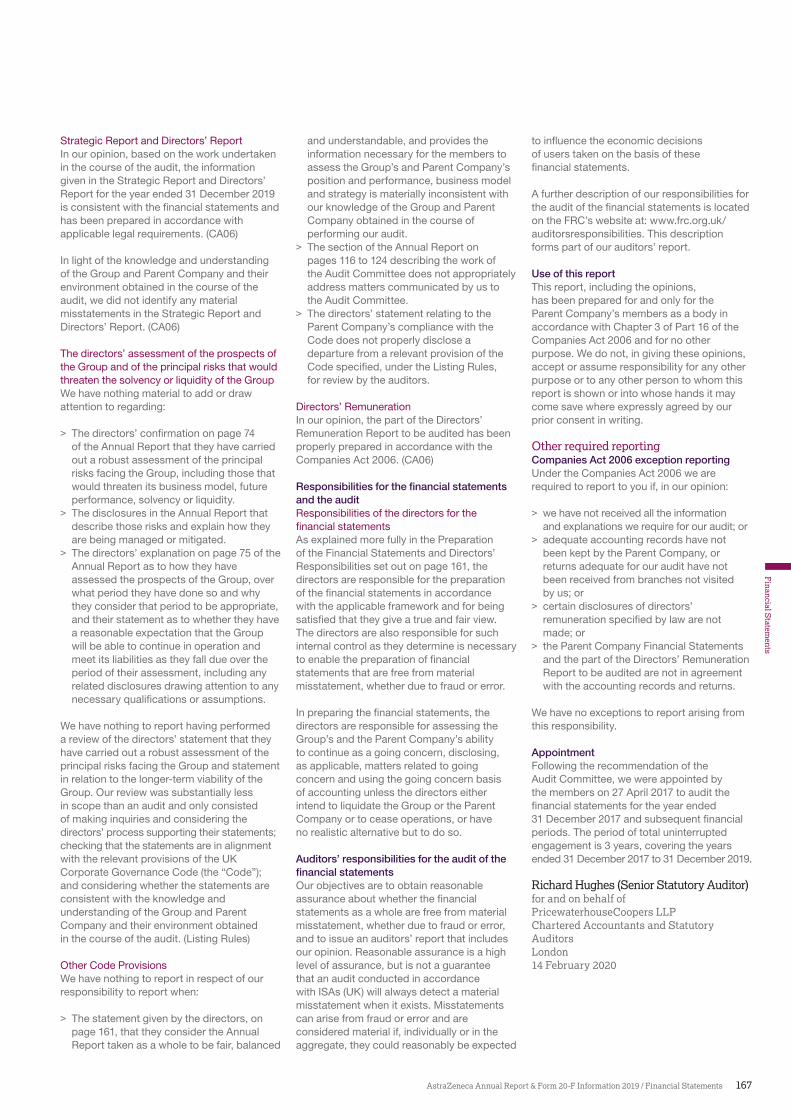
Strategic Report and Directors’ ReportIn our opinion, based on the work undertaken in the course of the audit, the information given in the Strategic Report and Directors’ Report for the year ended 31 December 2019 is consistent with the �nancial statements and has been prepared in accordance with applicable legal requirements. (CA06)
In light of the knowledge and understanding of the Group and Parent Company and their environment obtained in the course of the audit, we did not identify any material misstatements in the Strategic Report and Directors’ Report. (CA06)
The directors’ assessment of the prospects of the Group and of the principal risks that would threaten the solvency or liquidity of the GroupWe have nothing material to add or draw attention to regarding:
> The directors’ con�rmation on page 74 of the Annual Report that they have carried out a robust assessment of the principal risks facing the Group, including those that would threaten its business model, future performance, solvency or liquidity.
> The disclosures in the Annual Report that describe those risks and explain how they are being managed or mitigated.
> The directors’ explanation on page 75 of the Annual Report as to how they have assessed the prospects of the Group, over what period they have done so and why they consider that period to be appropriate, and their statement as to whether they have a reasonable expectation that the Group will be able to continue in operation and meet its liabilities as they fall due over the period of their assessment, including any related disclosures drawing attention to any necessary quali�cations or assumptions.
We have nothing to report having performed a review of the directors’ statement that they have carried out a robust assessment of the principal risks facing the Group and statement in relation to the longer-term viability of the Group. Our review was substantially less in scope than an audit and only consisted of making inquiries and considering the directors’ process supporting their statements; checking that the statements are in alignment with the relevant provisions of the UK Corporate Governance Code (the “Code”); and considering whether the statements are consistent with the knowledge and understanding of the Group and Parent Company and their environment obtained in the course of the audit. (Listing Rules)
Other Code ProvisionsWe have nothing to report in respect of our responsibility to report when:
> The statement given by the directors, on page 161, that they consider the Annual Report taken as a whole to be fair, balanced
and understandable, and provides the information necessary for the members to assess the Group’s and Parent Company’s position and performance, business model and strategy is materially inconsistent with our knowledge of the Group and Parent Company obtained in the course of performing our audit.
> The section of the Annual Report on pages 116 to 124 describing the work of the Audit Committee does not appropriately address matters communicated by us to the Audit Committee.
> The directors’ statement relating to the Parent Company’s compliance with the Code does not properly disclose a departure from a relevant provision of the Code speci�ed, under the Listing Rules, for review by the auditors.
Directors’ RemunerationIn our opinion, the part of the Directors’ Remuneration Report to be audited has been properly prepared in accordance with the Companies Act 2006. (CA06)
Responsibilities for the financial statements and the auditResponsibilities of the directors for the �nancial statementsAs explained more fully in the Preparation of the Financial Statements and Directors’ Responsibilities set out on page 161, the directors are responsible for the preparation of the �nancial statements in accordance with the applicable framework and for being satis�ed that they give a true and fair view. The directors are also responsible for such internal control as they determine is necessary to enable the preparation of �nancial statements that are free from material misstatement, whether due to fraud or error.
In preparing the �nancial statements, the directors are responsible for assessing the Group’s and the Parent Company’s ability to continue as a going concern, disclosing, as applicable, matters related to going concern and using the going concern basis of accounting unless the directors either intend to liquidate the Group or the Parent Company or to cease operations, or have no realistic alternative but to do so.
Auditors’ responsibilities for the audit of the financial statementsOur objectives are to obtain reasonable assurance about whether the �nancial statements as a whole are free from material misstatement, whether due to fraud or error, and to issue an auditors’ report that includes our opinion. Reasonable assurance is a high level of assurance, but is not a guarantee that an audit conducted in accordance with ISAs (UK) will always detect a material misstatement when it exists. Misstatements can arise from fraud or error and are considered material if, individually or in the aggregate, they could reasonably be expected
to in�uence the economic decisions of users taken on the basis of these �nancial statements.
A further description of our responsibilities for the audit of the �nancial statements is located on the FRC’s website at: www.frc.org.uk/auditorsresponsibilities. This description forms part of our auditors’ report.
Use of this reportThis report, including the opinions, has been prepared for and only for the Parent Company’s members as a body in accordance with Chapter 3 of Part 16 of the Companies Act 2006 and for no other purpose. We do not, in giving these opinions, accept or assume responsibility for any other purpose or to any other person to whom this report is shown or into whose hands it may come save where expressly agreed by our prior consent in writing.
Other required reportingCompanies Act 2006 exception reportingUnder the Companies Act 2006 we are required to report to you if, in our opinion:
> we have not received all the information and explanations we require for our audit; or
> adequate accounting records have not been kept by the Parent Company, or returns adequate for our audit have not been received from branches not visited by us; or
> certain disclosures of directors’ remuneration speci�ed by law are not made; or
> the Parent Company Financial Statements and the part of the Directors’ Remuneration Report to be audited are not in agreement with the accounting records and returns.
We have no exceptions to report arising from this responsibility.
AppointmentFollowing the recommendation of the Audit Committee, we were appointed by the members on 27 April 2017 to audit the �nancial statements for the year ended 31 December 2017 and subsequent �nancial periods. The period of total uninterrupted engagement is 3 years, covering the years ended 31 December 2017 to 31 December 2019.
Richard Hughes (Senior Statutory Auditor)for and on behalf of
rice aterhouse oo ers Chartered Accountants and Statutory Auditors
ondon14 February 2020
167AstraZeneca Annual Report & Form 20-F Information 2019 / Financial Statements
Financial S
tatements

168 AstraZeneca Annual Report & Form 20-F Information 2019 / Financial Statements
Consolidated Statement of Comprehensive Incomefor the year ended 31 December
2019 2018 2017Notes $m $m $m
Product Sales 1 23,565 21,049 20,152
Collaboration Revenue 1 819 1,041 2,313
Total Revenue 24,384 22,090 22,465
Cost of sales (4,921) (4,936) (4,318)
Gross profit 19,463 17,154 18,147
Distribution costs (339) (331) (310)
Research and development expense 2 (6,059) (5,932) (5,757)
Selling, general and administrative costs 2 (11,682) (10,031) (10,233)
Other operating income and expense 2 1,541 2,527 1,830
Operating profit 2,924 3,387 3,677
Finance income 3 172 138 113
Finance expense 3 (1,432) (1,419) (1,508)
Share of after tax losses in associates and joint ventures 11 (116) (113) (55)
Profit before tax 1,548 1,993 2,227
Taxation 4 (321) 57 641
Profit for the period 1,227 2,050 2,868
Other comprehensive income:
Items that will not be reclassified to profit or loss:
Remeasurement of the defined benefit pension liability 22 (364) (46) (242)
Net losses on equity investments measured at fair value through other comprehensive income (28) (171) –
Fair value movements related to own credit risk on bonds designated as fair value through profit and loss (5) 8 (9)
Tax on items that will not be reclassified to profit or loss 4 21 56 16
(376) (153) (235)
Items that may be reclassified subsequently to profit or loss:
Foreign exchange arising on consolidation 23 40 (450) 536
Foreign exchange arising on designating borrowings in net investment hedges 23 (252) (520) 505
Fair value movements on cash flow hedges (101) (37) 311
Fair value movements on cash flow hedges transferred to profit and loss 52 111 (315)
Fair value movements on derivatives designated in net investment hedges 23 35 (8) (48)
Costs of hedging (47) (54) –
Amortisation of loss on cash flow hedge – 1 1
Net available for sale (losses) taken to equity – – (83)
Tax on items that may be reclassified subsequently to profit or loss 4 38 51 (33)
(235) (906) 874
Other comprehensive (loss)/income for the period, net of tax (611) (1,059) 639
Total comprehensive income for the period 616 991 3,507
Profit attributable to:
Owners of the Parent 1,335 2,155 3,001
Non-controlling interests 26 (108) (105) (133)
Total comprehensive income attributable to:
Owners of the Parent 723 1,097 3,640
Non-controlling interests 26 (107) (106) (133)
Basic earnings per $0.25 Ordinary Share 5 $1.03 $1.70 $2.37
Diluted earnings per $0.25 Ordinary Share 5 $1.03 $1.70 $2.37
Weighted average number of Ordinary Shares in issue (millions) 5 1,301 1,267 1,266
Diluted weighted average number of Ordinary Shares in issue (millions) 5 1,301 1,267 1,267
Dividends declared and paid in the period 25 3,579 3,539 3,543
All activities were in respect of continuing operations.
$m means millions of US dollars.
169
Financial S
tatements
AstraZeneca Annual Report & Form 20-F Information 2019 / Consolidated Statements
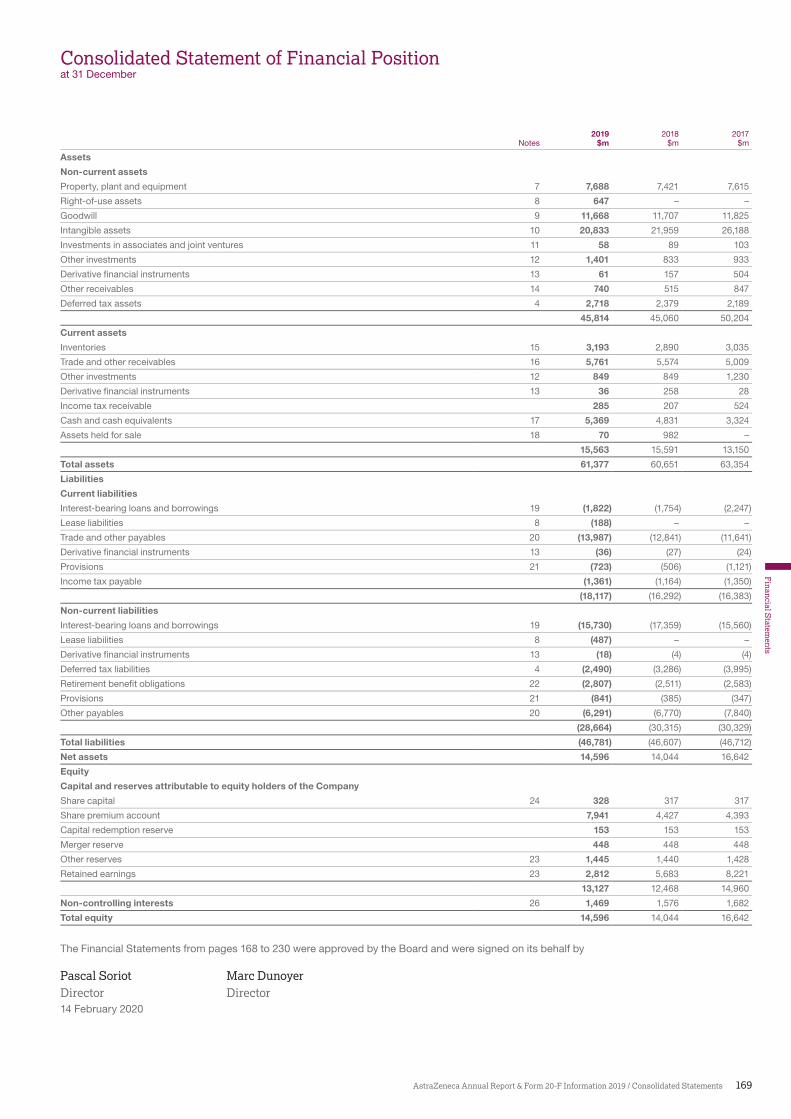
Consolidated Statement of Financial Positionat 31 December
2019 2018 2017Notes $m $m $m
Assets
Non-current assets
Property, plant and equipment 7 7,688 7,421 7,615
Right-of-use assets 8 647 – –
Goodwill 9 11,668 11,707 11,825
Intangible assets 10 20,833 21,959 26,188
Investments in associates and joint ventures 11 58 89 103
Other investments 12 1,401 833 933
Derivative financial instruments 13 61 157 504
Other receivables 14 740 515 847
Deferred tax assets 4 2,718 2,379 2,189
45,814 45,060 50,204
Current assets
Inventories 15 3,193 2,890 3,035
Trade and other receivables 16 5,761 5,574 5,009
Other investments 12 849 849 1,230
Derivative financial instruments 13 36 258 28
Income tax receivable 285 207 524
Cash and cash equivalents 17 5,369 4,831 3,324
Assets held for sale 18 70 982 –
15,563 15,591 13,150
Total assets 61,377 60,651 63,354
Liabilities
Current liabilities
Interest-bearing loans and borrowings 19 (1,822) (1,754) (2,247)
Lease liabilities 8 (188) – –
Trade and other payables 20 (13,987) (12,841) (11,641)
Derivative financial instruments 13 (36) (27) (24)
Provisions 21 (723) (506) (1,121)
Income tax payable (1,361) (1,164) (1,350)
(18,117) (16,292) (16,383)
Non-current liabilities
Interest-bearing loans and borrowings 19 (15,730) (17,359) (15,560)
Lease liabilities 8 (487) – –
Derivative financial instruments 13 (18) (4) (4)
Deferred tax liabilities 4 (2,490) (3,286) (3,995)
Retirement benefit obligations 22 (2,807) (2,511) (2,583)
Provisions 21 (841) (385) (347)
Other payables 20 (6,291) (6,770) (7,840)
(28,664) (30,315) (30,329)
Total liabilities (46,781) (46,607) (46,712)
Net assets 14,596 14,044 16,642
Equity
Capital and reserves attributable to equity holders of the Company
Share capital 24 328 317 317
Share premium account 7,941 4,427 4,393
Capital redemption reserve 153 153 153
Merger reserve 448 448 448
Other reserves 23 1,445 1,440 1,428
Retained earnings 23 2,812 5,683 8,221
13,127 12,468 14,960
Non-controlling interests 26 1,469 1,576 1,682
Total equity 14,596 14,044 16,642
The Financial Statements from pages 168 to 230 were approved by the Board and were signed on its behalf by
Pascal Soriot Marc DunoyerDirector Director14 February 2020
170 AstraZeneca Annual Report & Form 20-F Information 2019 / Financial Statements
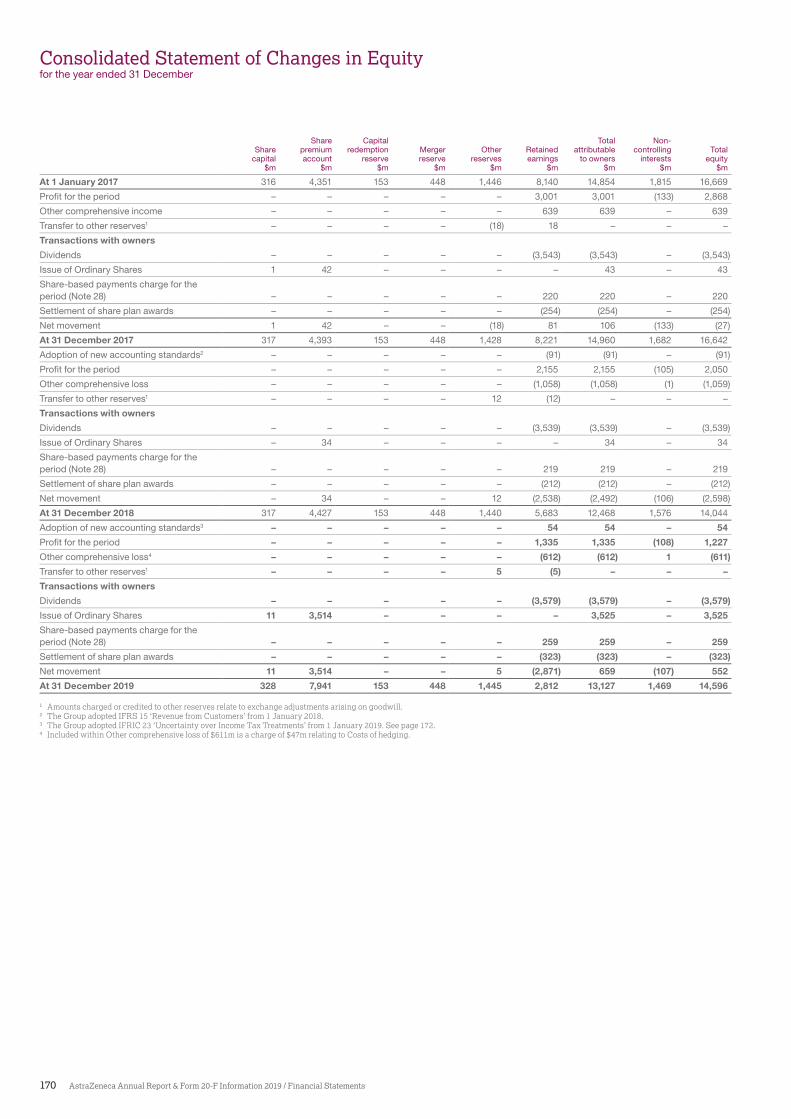
Consolidated Statement of Changes in Equityfor the year ended 31 December
Share Capital Total Non-Share premium redemption Merger Other Retained attributable controlling Total
capital account reserve reserve reserves earnings to owners interests equity$m $m $m $m $m $m $m $m $m
At 1 January 2017 316 4,351 153 448 1,446 8,140 14,854 1,815 16,669
Profit for the period – – – – – 3,001 3,001 (133) 2,868
Other comprehensive income – – – – – 639 639 – 639
Transfer to other reserves1 – – – – (18) 18 – – –
Transactions with owners
Dividends – – – – – (3,543) (3,543) – (3,543)
Issue of Ordinary Shares 1 42 – – – – 43 – 43
Share-based payments charge for the period (Note 28) – – – – – 220 220 – 220
Settlement of share plan awards – – – – – (254) (254) – (254)
Net movement 1 42 – – (18) 81 106 (133) (27)
At 31 December 2017 317 4,393 153 448 1,428 8,221 14,960 1,682 16,642
Adoption of new accounting standards2 – – – – – (91) (91) – (91)
Profit for the period – – – – – 2,155 2,155 (105) 2,050
Other comprehensive loss – – – – – (1,058) (1,058) (1) (1,059)
Transfer to other reserves1 – – – – 12 (12) – – –
Transactions with owners
Dividends – – – – – (3,539) (3,539) – (3,539)
Issue of Ordinary Shares – 34 – – – – 34 – 34
Share-based payments charge for the period (Note 28) – – – – – 219 219 – 219
Settlement of share plan awards – – – – – (212) (212) – (212)
Net movement – 34 – – 12 (2,538) (2,492) (106) (2,598)
At 31 December 2018 317 4,427 153 448 1,440 5,683 12,468 1,576 14,044
Adoption of new accounting standards3 – – – – – 54 54 – 54
Profit for the period – – – – – 1,335 1,335 (108) 1,227
Other comprehensive loss4 – – – – – (612) (612) 1 (611)
Transfer to other reserves1 – – – – 5 (5) – – –
Transactions with owners
Dividends – – – – – (3,579) (3,579) – (3,579)
Issue of Ordinary Shares 11 3,514 – – – – 3,525 – 3,525
Share-based payments charge for the period (Note 28) – – – – – 259 259 – 259
Settlement of share plan awards – – – – – (323) (323) – (323)
Net movement 11 3,514 – – 5 (2,871) 659 (107) 552
At 31 December 2019 328 7,941 153 448 1,445 2,812 13,127 1,469 14,596
1 Amounts charged or credited to other reserves relate to exchange adjustments arising on goodwill.2 The Group adopted IFRS 15 ‘Revenue from Customers’ from 1 January 2018.3 The Group adopted IFRIC 23 ‘Uncertainty over Income Tax Treatments’ from 1 January 2019. See page 172.4 Included within Other comprehensive loss of $611m is a charge of $47m relating to Costs of hedging.
171
Financial S
tatements
AstraZeneca Annual Report & Form 20-F Information 2019 / Consolidated Statements
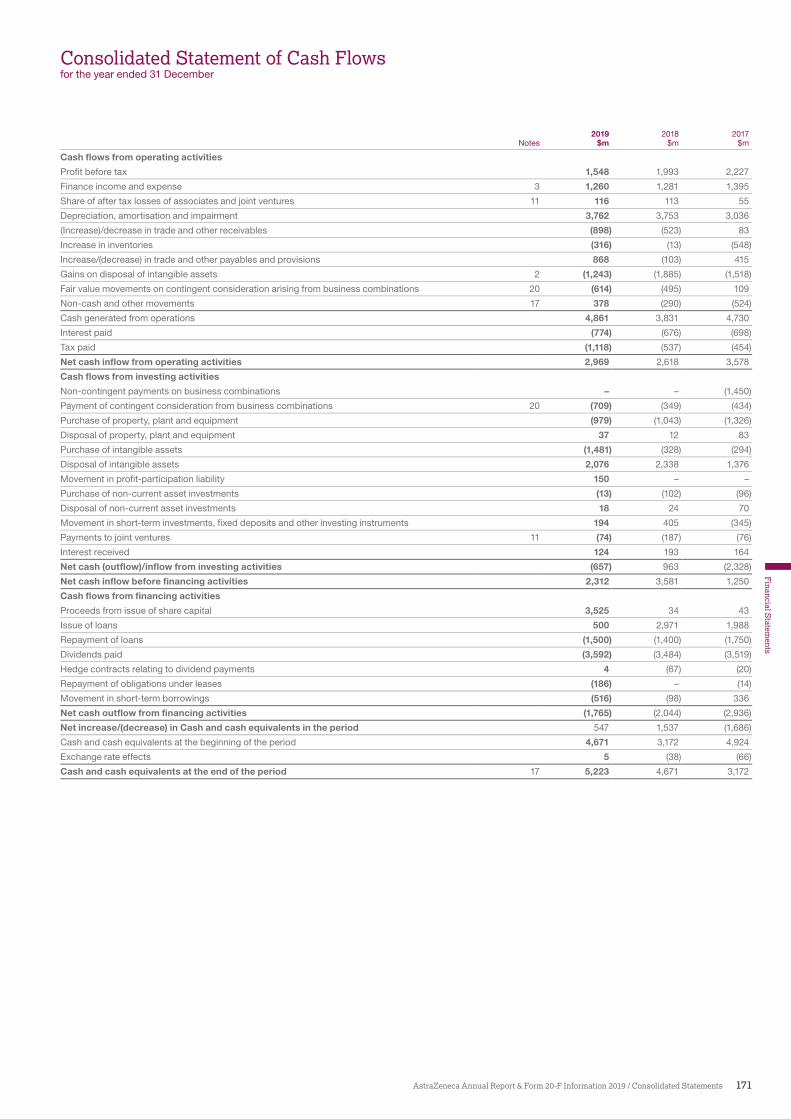
Consolidated Statement of Cash Flowsfor the year ended 31 December
2019 2018 2017Notes $m $m $m
Cash flows from operating activities
Profit before tax 1,548 1,993 2,227
Finance income and expense 3 1,260 1,281 1,395
Share of after tax losses of associates and joint ventures 11 116 113 55
Depreciation, amortisation and impairment 3,762 3,753 3,036
(Increase)/decrease in trade and other receivables (898) (523) 83
Increase in inventories (316) (13) (548)
Increase/(decrease) in trade and other payables and provisions 868 (103) 415
Gains on disposal of intangible assets 2 (1,243) (1,885) (1,518)
Fair value movements on contingent consideration arising from business combinations 20 (614) (495) 109
Non-cash and other movements 17 378 (290) (524)
Cash generated from operations 4,861 3,831 4,730
Interest paid (774) (676) (698)
Tax paid (1,118) (537) (454)
Net cash inflow from operating activities 2,969 2,618 3,578
Cash flows from investing activities
Non-contingent payments on business combinations – – (1,450)
Payment of contingent consideration from business combinations 20 (709) (349) (434)
Purchase of property, plant and equipment (979) (1,043) (1,326)
Disposal of property, plant and equipment 37 12 83
Purchase of intangible assets (1,481) (328) (294)
Disposal of intangible assets 2,076 2,338 1,376
Movement in profit-participation liability 150 – –
Purchase of non-current asset investments (13) (102) (96)
Disposal of non-current asset investments 18 24 70
Movement in short-term investments, fixed deposits and other investing instruments 194 405 (345)
Payments to joint ventures 11 (74) (187) (76)
Interest received 124 193 164
Net cash (outflow)/inflow from investing activities (657) 963 (2,328)
Net cash inflow before financing activities 2,312 3,581 1,250
Cash flows from financing activities
Proceeds from issue of share capital 3,525 34 43
Issue of loans 500 2,971 1,988
Repayment of loans (1,500) (1,400) (1,750)
Dividends paid (3,592) (3,484) (3,519)
Hedge contracts relating to dividend payments 4 (67) (20)
Repayment of obligations under leases (186) – (14)
Movement in short-term borrowings (516) (98) 336
Net cash outflow from financing activities (1,765) (2,044) (2,936)
Net increase/(decrease) in Cash and cash equivalents in the period 547 1,537 (1,686)
Cash and cash equivalents at the beginning of the period 4,671 3,172 4,924
Exchange rate effects 5 (38) (66)
Cash and cash equivalents at the end of the period 17 5,223 4,671 3,172
172 AstraZeneca Annual Report & Form 20-F Information 2019 / Financial Statements
Group Accounting Policies
Basis of accounting and preparation of financia infor ationThe Consolidated Financial Statements have been prepared under the historical cost convention, modi�ed to include revaluation to fair value of certain �nancial instruments as described below, in accordance with the Companies Act 2006 and International Financial Reporting Standards (IFRSs) as adopted by the EU (adopted IFRSs) in response to the IAS regulation (EC 1606/2002). The Consolidated Financial Statements also comply fully with IFRSs as issued by the International Accounting Standards Board (IASB).
IFRS 3AstraZeneca had proposed to adopt the October 2018 update to IFRS 3, which changed the de�nition of a business, from 1 January 2019, and has previously published interim �nancial statements on this basis. This was done on the basis that it was considered highly probable that the amendment would be endorsed by the European Commission during 2019 before its effective date of 1 January 2020 with early adoption permitted, following a recommendation from the European Financial Reporting Advisory Group (EFRAG), the association set up to provide advice to the European Commission on whether newly issued or revised IFRSs meet the criteria for endorsement for use in the EU.
The change in de�nition of a business within IFRS 3 introduces an optional concentration test to perform a simpli�ed assessment of whether an acquired set of activities and assets is or is not a business on a transaction by transaction basis. This change was expected to provide more reliable and comparable information about certain transactions as it provides more consistency in accounting in the pharmaceutical industry for substantially similar transactions that under the previous de�nition may have been accounted for in different ways despite limited differences in substance.
During the year, the EFRAG amended its guidance on the expected date of endorsement, and the European Commission is expected to endorse the change during 2020, with application required for accounting periods beginning on or after 1 January 2020. Accordingly this amendment has not been applied in the Consolidated Financial Statements, however this has not resulted in a different accounting treatment for any transactions undertaken during the year when compared with the amended version of IFRS 3, pending endorsement.
IFRS 16IFRS 16 ‘Leases’ is effective for accounting periods beginning on or after 1 January 2019 and replaces IAS 17 ‘Leases’. It eliminates the classi�cation of leases as either operating leases or �nance leases and, instead, introduces a single lessee accounting model. The adoption of IFRS 16 resulted in the Group recognising lease liabilities, and corresponding ‘right-of-use’ assets for arrangements that were previously classi�ed as operating leases.
The Group’s principal lease arrangements are for property, most notably a portfolio of of�ce premises, and for a global car �eet, utilised primarily by our sales and marketing teams. The Group has adopted IFRS 16 using a modi�ed retrospective approach with the cumulative effect of initially applying the standard as an adjustment to the opening balance of retained earnings at 1 January 2019. The standard permits a choice on initial adoption, on a lease-by-lease basis, to measure the right-of-use asset at either its carrying amount as if IFRS 16 had been applied since the commencement of the lease, or an amount equal to the lease liability, adjusted for accruals or prepayments. The Group has elected to measure the right-of-use asset equal to the lease liability, with the result of no net impact on opening retained earnings and no restatement of prior period comparatives.
Initial adoption resulted in the recognition of right-of-use assets of $722m and lease liabilities of $720m. The weighted average incremental borrowing rate applied to the lease liabilities on 1 January 2019 was 3%.
The Group is using one or more practical expedients on transition to leases previously classi�ed as operating leases, including electing to not apply the retrospective treatment to leases for which the term ends within 12 months of initial application, electing to apply a single discount rate to portfolios of leases with similar characteristics, reliance on previous assessments on whether arrangements contain a lease and whether leases are onerous, excluding initial direct costs from the initial measurement of the right-of-use asset, and using hindsight in determining the lease term where the contract contains options to extend or terminate the lease.
Judgements made in calculating the initial impact of adoption include determining the lease term where extension or termination options exist. In such instances, all facts and circumstances that may create an economic incentive to exercise an extension option, or not exercise a termination option, have been considered to determine the lease term. Extension periods (or periods after termination options) are only included in the lease term if the lease is reasonably certain to be extended (or not terminated). Estimates include calculating the discount rate which is based on the incremental borrowing rate.
The Group is applying IFRS 16’s low-value and short-term exemptions. While the IFRS 16 opening lease liability is calculated differently from the previous operating lease commitment calculated under the previous standard, there are no material differences between the positions. The adoption of IFRS 16 has had no impact on the Group’s net cash �ows, although a presentation change has been re�ected whereby cash out�ows of $186m are now presented as �nancing, instead of operating. There is an immaterial bene�t to Operating pro�t and a corresponding increase in Finance expense from the presentation of a portion of lease costs as interest costs. Pro�t before tax, taxation and EPS have not been materially impacted.
IFRIC 23IFRIC 23 ‘Uncertainty Over Income Tax Treatments’ is effective for accounting periods beginning on or after 1 January 2019 and provides further clari�cation on how to apply the recognition and measurement requirements in IAS 12 ‘Income Taxes’. It is applicable where there is uncertainty over income tax treatments. The EU endorsed IFRIC 23 on 24 October 2018. The adoption of IFRIC 23 has principally resulted in an adjustment in the value of tax liabilities because IFRIC 23 requires the Group to measure the effect of uncertainty on income tax positions using either the most likely amount or the expected value amount depending on which method is expected to better re�ect the resolution of the uncertainty.
The Group has retrospectively applied IFRIC 23 from 1 January 2019 recognising the cumulative effect of initially applying the interpretation as decreases to income tax payable of $51m and to trade and other payables of $3m, and a corresponding adjustment to the opening balance of retained earnings of $54m. There is no restatement of the comparative information as permitted in the interpretation.
IFRS 9, IAS 39, IFRS 7The Group has early adopted the amendments to IFRS 9 ‘Financial Instruments’, IAS 39 ‘Financial Instruments: Recognition and Measurement’ and IFRS 7 ‘Financial Instruments: Disclosures’. These relate to interbank offered rates (IBORs) reform and were endorsed by the EU on 6 January 2020. The replacement of benchmark interest rates such as LIBOR and other IBORs is a priority for global regulators. The amendments provide relief from applying speci�c hedge accounting requirements to hedge relationships directly affected by IBOR reform and have the effect that IBOR reform should generally not cause hedge accounting to terminate. There is no �nancial impact from the early adoption of these amendments.
173
Financial S
tatements
AstraZeneca Annual Report & Form 20-F Information 2019 / Group Accounting Policies
The Group has one IFRS 9 designated hedge relationship that is potentially impacted by IBOR reform: our euro 300m cross currency interest rate swap in a fair value hedge relationship with euro 300m of our euro 750m 0.875% 2021 non-callable bond. This swap references three month USD LIBOR and uncertainty arising from the Group’s exposure to IBOR reform will cease when the swap matures in 2021. The implications on the wider business of IBOR reform will be assessed during 2020.
Collaboration RevenueEffective from 1 January 2019, the Group updated the presentation of an element of Total Revenue within the Statement of Comprehensive Income and changed the classi�cation of some income to re�ect the increasing importance of collaborations to AstraZeneca. Historically, Externalisation Revenue formed part of Total Revenue and only included income arising from collaborative transactions involving AstraZeneca’s medicines, whether internally developed or previously acquired. Such income included upfront consideration, milestone receipts, pro�t share income and royalties, as well as other income from collaborations. The updated category of Collaboration Revenue includes all income previously included within Externalisation Revenue, as well as income of a similar nature arising from transactions where AstraZeneca has acquired an interest in a medicine and as part of the acquisition entered into an active collaboration with the seller. This change is a result of the growing importance of collaborations to AstraZeneca. Income arising from all collaborations, other than product sales, will be recognised within the Collaboration Revenue element of Total Revenue. Historically there has been no collaboration income arising from such acquisitions, and therefore no prior year restatement of �nancial results is required as a result of this change.
Income from disposals of assets and businesses including royalties and milestones, where the Group does not retain a signi�cant continued interest, continue to be recorded in Other Operating Income and Expense.
The Consolidated Financial Statements are presented in US dollars, which is the Company’s functional currency.
In preparing their individual �nancial statements, the accounting policies of some overseas subsidiaries do not conform with IASB issued IFRSs. Therefore, where appropriate, adjustments are made in order to present the Consolidated Financial Statements on a consistent basis.
Basis for preparation of Financial Statements on a going concern basisThe Group has considerable �nancial resources available. As at 31 December 2019, the Group has $10.4bn in �nancial resources (cash and cash equivalent balances of $5.4bn, $0.9bn of liquid �xed income securities and undrawn committed bank facilities of $4.1bn, of which $3.4bn is available until April 2022, $0.5bn is available until November 2020 (extendable to November 2021) and $0.2bn is available until December 2020, with only $2.0bn of borrowings due within one year). The Group’s revenues are largely derived from sales of products which are covered by patents which provide a relatively high level of resilience and predictability to cash in�ows, although government price interventions in response to budgetary constraints are expected to continue to adversely affect revenues in many of our mature markets. However, we anticipate new revenue streams from both recently launched medicines and products in development, and the Group has a wide diversity of customers and suppliers across different geographic areas. Consequently, the Directors believe that, overall, the Group is well placed to manage its business risks successfully. Accordingly, they continue to adopt the going concern basis in preparing the Annual Report and Financial Statements.
Estimates and judgementsThe preparation of the Financial Statements in conformity with generally accepted accounting principles requires management to make estimates and judgements that affect the reported amounts of assets and liabilities at the date of the Financial Statements and the reported amounts of revenues and expenses during the reporting period. Actual results could differ from those estimates.
The accounting policy descriptions set out the areas where judgements and estimates need exercising, the most signi�cant of which include the following Key Judgements KJ and Signi�cant Estimates SE :
> revenue recognition – see Revenue Accounting Policy on page 174 KJ and Note 1 on page 180 SE
> expensing of internal development expenses – see Research and Development Policy on page 174 KJ
> impairment reviews of Intangible assets – see Note 10 on page 191 SE
> useful economic life of Intangibles assets – see Research and Development Policy on page 175 KJ and Note 10 on page 192 SE
> business combinations and Goodwill (and Contingent consideration arising from business combinations) – see Business Combinations and Goodwill Policy on page 177 KJ and Note 20 on page 200 SE
> litigation liabilities – see Litigation and Environmental Liabilities within Note 29 on page 221 KJ
> operating segments – see Note 6 on page 186 KJ
> employee bene�ts – see Note 22 on page 207 SE
> taxation – see Taxation Policy on page 175, Note 29 on page 225 KJ and Note 29 on page 224 SE
Financial risk management policies are detailed in Note 27 to the Financial Statements from page 210.
AstraZeneca’s management considers the following to be the most important accounting policies in the context of the Group’s operations.
RevenueRevenues comprise Product Sales and Collaboration Revenue.
Product Sales are revenues arising from contracts with customers. Collaboration Revenue arises from other contracts, however, the recognition and measurement principles of IFRS 15 ‘Revenue from Contracts with Customers’ are applied as set out below.
Prior to 1 January 2018, the Group applied IAS 18 ‘Revenue’. On adoption of IFRS 15 on 1 January 2018, there was no material impact on the revenue streams from the supply of goods and associated rebates and returns provisions or Collaboration Revenue. The timing of the recognition of Product Sales and the basis for the estimates of sales deductions under IFRS 15 are consistent with those adopted under IAS 18.
Revenues exclude inter-company revenues and value-added taxes.
Product Sales Product Sales represent net invoice value less estimated rebates, returns and chargebacks, which are considered to be variable consideration and include signi�cant estimates. Sales are recognised when the control of the goods has been transferred to a third party. This is usually when title passes to the customer, either on shipment or on receipt of goods by the customer, depending on local trading terms. In markets where returns are signi�cant, estimates of returns are accounted for at the point revenue is recognised. Revenue is not recognised in full until it is highly probable that a signi�cant reversal in the amount of cumulative revenue recognised will occur.
Rebates are amounts payable or credited to a customer, usually based on the quantity or value of Product Sales to the customer for speci�c products in a certain period. Product sales rebates, which relate to Product Sales that occur over a period of time, are normally issued retrospectively.
174 AstraZeneca Annual Report & Form 20-F Information 2019 / Financial Statements
Group Accounting Policies continued
At the time Product Sales are invoiced, rebates and deductions that the Group expects to pay, are estimated. These rebates typically arise from sales contracts with government payers, third party managed care organisations, hospitals, long-term care facilities, group purchasing organisations and various state programmes.
For the markets where returns are signi�cant, we estimate the quantity and value of goods which may ultimately be returned at the point of sale. Our returns accruals are based on actual experience over the preceding 12 months for established products together with market-related information such as estimated stock levels at wholesalers and competitor activity which we receive via third-party information services. For newly launched products, we use rates based on our experience with similar products or a predetermined percentage.
When a product faces generic competition, particular attention is given to the possible levels of returns and, in cases where the circumstances are such that the level of Product Sales are considered highly probable to reverse, revenues are only recognised when the right of return expires, which is generally on ultimate prescription of the product to patients.
The methodology and assumptions used to estimate rebates and returns are monitored and adjusted regularly in the light of contractual and legal obligations, historical trends, past experience and projected market conditions. Once the uncertainty associated with returns is resolved, revenue is adjusted accordingly.
Under certain collaboration agreements which include a pro�t sharing mechanism, our recognition of Product Sales depends on which party acts as principal in sales to the end customer. In the cases where AstraZeneca acts as principal, we record 100% of sales to the end customer.
Collaboration Revenue Collaboration Revenue includes income from collaborative arrangements where either the Group has sold certain rights associated with those products, but retains a signi�cant ongoing economic interest or has acquired a signi�cant interest from a third party. Signi�cant interest can include ongoing supply of �nished goods, participation in pro�t share arrangements or direct interest from sales of medicines.
These arrangements may include development arrangements, commercialisation arrangements and collaborations. Income may take the form of upfront fees, milestones, pro�t sharing and royalties and includes pro�t share income arising from sales made as principal by a collaboration partner.
KJ Timing of recognition of clinical and regulatory milestones is considered to be a key judgement. There can be signi�cant uncertainty over whether it is highly probable that there would not be a signi�cant reversal of revenue in respect of speci�c milestones if these are recognised before they are triggered due to them being subject to the actions of third parties. In general, where the triggering of a milestone is subject to the decisions of third parties (e.g. the acceptance or approval of a �ling by a regulatory authority), the Group does not consider that the threshold for recognition is met until that decision is made.
Where Collaboration Revenue arises from the licensing of the Group’s own intellectual property, the licences we grant are typically rights to use intellectual property which do not change during the period of the licence and therefore related non-conditional revenue is recognised at the point the license is granted and variable consideration as soon as recognition criteria are met. Those licences are generally unique and therefore when there are other performance obligations in the contract, the basis of allocation of the consideration makes use of the residual approach as permitted by IFRS 15.
These arrangements typically involve the receipt of an upfront payment, which the contract attributes to the license of the intangible assets, and ongoing receipts, which the contract attributes to the sale of the product we manufacture. In cases where the transaction has two or more components, we account for the delivered item (for example, the transfer of title to the intangible asset) as a separate unit of accounting and record revenue on delivery of that component, provided that we can make a reasonable estimate of the fair value of the undelivered component.
Where non-contingent amounts are payable over one year from the effective date of a contract, an assessment is made as to whether a signi�cant �nancing component exists, and if so, the fair value of this component is deferred and recognised over the period to the expected date of receipt.
Where control of a right to use an intangible asset passes at the outset of an arrangement, revenue is recognised at the point in time control is transferred. Where the substance of an arrangement is that of a right to access rights attributable to an intangible asset, revenue is recognised over time, normally on a straight-line basis over the life of the contract.
Where the fair market value of the undelivered component (for example, a manufacturing agreement) exceeds the contracted price for that component, we defer an appropriate element of the upfront consideration and amortise this over the performance period. However, where the fair market value of the
undelivered component is equal to or lower than the contracted price for that component, we treat the whole of the upfront amount as being attributable to the delivered intangible assets and recognise that part of the revenue upon delivery. No element of the contracted revenue related to the undelivered component is ordinarily allocated to the sale of the intangible asset. This is because the contracted revenue relating to the undelivered component is contingent on future events (such as sales) and cannot be recognised until either receipt of the amount is highly probable or where the consideration is received for a licence of intellectual property, on the occurrence of the related sales.
Where the Group provides ongoing services, revenue in respect of this element is recognised over the duration of those services. Where the arrangement meets the de�nition of a licence agreement, sales milestones and sales royalties are recognised when achieved by applying the royalty exemption under IFRS 15. All other milestones and sales royalties are recognised when considered it is highly probable there will not be a signi�cant reversal of income. The determination requires estimates to be made in relation to future Product Sales.
Where Collaboration Revenue is recorded and there is a related Intangible asset, an appropriate amount of that intangible asset is charged to Cost of sales based on an allocation of cost or value to the rights that have been sold.
Cost of salesCost of sales are recognised as the associated revenue is recognised. Cost of sales include manufacturing costs, royalties payable on revenues recognised, movements in provisions for inventories, inventory write-offs and impairment charges in relation to manufacturing assets. Cost of sales also includes partner pro�t shares arising from collaborations, and foreign exchange gains and losses arising from business trading activities.
Research and developmentResearch expenditure is recognised in pro�t in the year in which it is incurred.
KJ Internal development expenditure is capitalised only if it meets the recognition criteria of IAS 38 ‘Intangible Assets’. This is considered a key judgement. Where regulatory and other uncertainties are such that the criteria are not met, the expenditure is charged to pro�t and loss and this is almost invariably the case prior to approval of the drug by the relevant regulatory authority. Where, however, recognition criteria are met, Intangible assets are capitalised and amortised on a straight-line basis over their useful economic lives from product launch. At 31 December 2019, no amounts have met the recognition criteria.

175
Financial S
tatements
AstraZeneca Annual Report & Form 20-F Information 2019 / Group Accounting Policies
Payments to in-license products and compounds from third parties for new research and development projects (in process research and development) generally take the form of upfront payments, milestones and royalty payments. Where payments made to third parties represent consideration for future research and development activities, an evaluation is made as to the nature of the payments. Such payments are expensed if they represent compensation for sub-contracted research and development services not resulting in a transfer of intellectual property. By contrast, payments are capitalised if they represent compensation for the transfer of identi�able intellectual property developed at the risk of the third party. Development milestone payments relating to identi�able intellectual property are capitalised as the milestone is triggered. Any upfront or milestone payments for research activities where there is no associated identi�able intellectual property are expensed. Assets capitalised are amortised, on a straight-line basis, over their useful economic lives from product launch.
KJ The determination of useful economic life is considered to be a key judgement. On product launch, the Group makes a judgement as to the expected useful economic life using our detailed long-term risk-adjusted sales projections compiled annually across the Group and approved by the Board, and for assets where the useful economic life extends beyond this period, appropriately reviewed, risk-adjusted sales projections.
The useful economic life can extend beyond patent expiry as dependent upon the nature of the product and the complexity of the development and manufacturing process. Signi�cant sales can often be achieved post patent expiration.
Intangible assetsIntangible assets are stated at cost less provision for amortisation and impairments. Intangible assets relating to products in development are subject to impairment testing annually. All Intangible assets are tested for impairment when there are indications that the carrying value may not be recoverable. The determination of the recoverable amounts include key estimates which are highly sensitive to, and depend upon, key assumptions as detailed in Note 10 to the Financial Statements from page 190.
Impairment reviews have been carried out on all Intangible assets that are in development (and not being amortised), all major intangible assets acquired during the year and all other intangible assets that have had indications of impairment during the year. Recoverable amount is determined as the higher of value in use or fair value less costs to sell using a discounted cash �ow calculation, where the products’ expected cash �ows are
risk-adjusted over their estimated remaining useful economic life. The determination of the recoverable amounts include signi�cant estimates which are highly sensitive and depend upon key assumptions as detailed in Note 10 to the Financial Statements from page 190. Sales forecasts and speci�c allocated costs (which have both been subject to appropriate senior management review and approval) are risk-adjusted and discounted using appropriate rates based on our post-tax weighted average cost of capital or for fair value less costs to sell, an impairment rate for a market participant. Our weighted average cost of capital re�ects factors such as our capital structure and our costs of debt and equity.
Any impairment losses are recognised immediately in pro�t. Intangible assets relating to products which fail during development (or for which development ceases for other reasons) are also tested for impairment and are written down to their recoverable amount (which is usually nil).
If, subsequent to an impairment loss being recognised, development restarts or other facts and circumstances change indicating that the impairment is less or no longer exists, the value of the asset is re-estimated and its carrying value is increased to the recoverable amount, but not exceeding the original value, by recognising an impairment reversal in pro�t.
Joint arrangements and associatesThe Group has arrangements over which it has joint control and which qualify as joint operations or joint ventures under IFRS 11 ‘Joint Arrangements’. For joint operations, the Group recognises its share of revenue that it earns from the joint operations and its share of expenses incurred. The Group also recognises the assets associated with the joint operations that it controls and the liabilities it incurs under the joint arrangement. For joint ventures and associates, the Group recognises its interest in the joint venture or associate as an investment and uses the equity method of accounting.
oyee benefitsThe Group accounts for pensions and other employee bene�ts (principally healthcare) under IAS 19 ‘Employee Bene�ts’ and recognises all actuarial gains and losses immediately through Other comprehensive income. In respect of de�ned bene�t plans, obligations are measured at discounted present value while plan assets are measured at fair value. Given the extent of the assumptions used to determine these values, these are considered to be signi�cant estimates. The operating and �nancing costs of such plans are recognised separately in pro�t, current service costs are spread systematically over the lives of employees and �nancing costs are recognised in full in the periods in which they arise. Remeasurements of the net de�ned bene�t pension liability, including actuarial gains and losses, are recognised immediately in Other comprehensive income.
Where the calculation results in a surplus to the Group, the recognised asset is limited to the present value of any available future refunds from the plan or reductions in future contributions to the plan. Payments to de�ned contribution plans are recognised in pro�t as they fall due.
TaxationThe current tax payable is based on taxable pro�t for the year. Taxable pro�t differs from reported pro�t because taxable pro�t excludes items that are either never taxable or tax deductible or items that are taxable or tax deductible in a different period. The Group’s current tax assets and liabilities are calculated using tax rates that have been enacted or substantively enacted by the reporting date.
KJ Deferred tax is provided using the balance sheet liability method, providing for temporary differences between the carrying amounts of assets and liabilities for �nancial reporting purposes and the amounts used for taxation purposes. Deferred tax assets are recognised to the extent that it is probable that future taxable pro�t will be available against which the asset can be utilised. This requires judgements to be made in respect of the availability of future taxable income.
No deferred tax asset or liability is recognised in respect of temporary differences associated with investments in subsidiaries and branches where the Group is able to control the timing of reversal of the temporary differences and it is probable that the temporary differences will not reverse in the foreseeable future.
The Group’s Deferred tax assets and liabilities are calculated using tax rates that are expected to apply in the period when the liability is settled or the asset realised based on tax rates that have been enacted or substantively enacted by the reporting date.
Accruals for tax contingencies require management to make judgements of potential exposures in relation to tax audit issues. Tax bene�ts are not recognised unless the tax positions will probably be accepted by the tax authorities. This is based upon management’s interpretation of applicable laws and regulations and the expectation of how the tax authority will resolve the matter. Once considered probable of not being accepted, management reviews each material tax bene�t and re�ects the effect of the uncertainty in determining the related taxable result.
Accruals for tax contingencies are measured using either the most likely amount or the expected value amount depending on which method the entity expects to better predict the resolution of the uncertainty.
176 AstraZeneca Annual Report & Form 20-F Information 2019 / Financial Statements
Group Accounting Policies continued
Further details of the estimates and assumptions made in determining our recorded liability for transfer pricing contingencies and other tax contingencies are included in Note 29 to the Financial Statements on page 225.
Share-based paymentsAll plans are assessed and have been classi�ed as equity settled. The grant date fair value of employee share plan awards is calculated using a Monte Carlo model. In accordance with IFRS 2 ‘Share-based Payment’, the resulting cost is recognised in pro�t over the vesting period of the awards, being the period in which the services are received. The value of the charge is adjusted to re�ect expected and actual levels of awards vesting, except where the failure to vest is as a result of not meeting a market condition. Cancellations of equity instruments are treated as an acceleration of the vesting period and any outstanding charge is recognised in pro�t immediately.
Property, plant and equipmentThe Group’s policy is to write off the difference between the cost of each item of Property, plant and equipment and its residual value over its estimated useful life on a straight-line basis. Assets under construction are not depreciated.
Reviews are made annually of the estimated remaining lives and residual values of individual productive assets, taking account of commercial and technological obsolescence as well as normal wear and tear. It is impractical to calculate average asset lives exactly. However, the total lives range from approximately 10 to 50 years for buildings, and three to 15 years for plant and equipment. All items of Property, plant and equipment are tested for impairment when there are indications that the carrying value may not be recoverable. Any impairment losses are recognised immediately in pro�t.
Borrowing costsThe Group has no borrowing costs with respect to the acquisition or construction of qualifying assets. All other borrowing costs are recognised in pro�t as incurred and in accordance with the effective interest rate method.
LeasesAccounting policy applied until 1 January 2019 (IAS 17)Leases are classi�ed as �nance leases if they transfer substantively all the risks and rewards incidental to ownership, otherwise they are classi�ed as operating leases. Assets and liabilities arising on �nance leases are initially recognised at fair value or, if lower, the present value of the minimum lease payments. The discount rate used in calculating the present value of the minimum lease payments is the interest rate implicit in the lease. Finance charges under �nance leases are allocated
to each reporting period so as to produce a constant periodic rate of interest on the remaining balance of the �nance liability. Rentals under operating leases are charged to pro�t and loss on a straight-line basis.
Accounting policy applied from 1 January 2019 (IFRS 16)The Group’s lease arrangements are principally for property, most notably a portfolio of of�ce premises and employee accommodation, and for a global car �eet, utilised primarily by our sales and marketing teams.
The lease liability and corresponding right-of-use asset arising from a lease are initially measured on a present value basis. Lease liabilities include the net present value of the following lease payments:
> �xed payments, less any lease incentives receivable
> variable lease payments that depend on an index or a rate, initially measured using the index or rate as at the commencement date
> the exercise price of a purchase option if the Group is reasonably certain to exercise that option
> payments of penalties for terminating the lease, if the lease term re�ects the Group exercising that option, and
> amounts expected to be payable by the Group under residual value guarantees.
Right-of-use assets are measured at cost comprising the following:
> the amount of the initial measurement of lease liability
> any lease payments made at or before the commencement date less any lease incentives received
> any initial direct costs, and> restoration costs.
Judgements made in calculating the lease liability include assessing whether arrangements contain a lease and determining the lease term. Lease terms are negotiated on an individual basis and contain a wide range of different terms and conditions. Property leases will often include an early termination or extension option to the lease term. Fleet management policies vary by jurisdiction and may include renewal of a lease until a measurement threshold, such as mileage, is reached. Extension and termination options have been considered when determining the lease term, along with all facts and circumstances that may create an economic incentive to exercise an extension option, or not exercise a termination option. Extension periods (or periods after termination options) are only included in the lease term if the lease is reasonably certain to be extended (or not terminated).
The lease payments are discounted using incremental borrowing rates, as in the majority of leases held by the Group the interest rate implicit in the lease is not readily identi�able. Calculating the discount rate is an estimate made in calculating the lease liability. This rate is the rate that the Group would have to pay to borrow the funds necessary to obtain an asset of similar value to the right-of-use asset in a similar economic environment with similar terms, security and conditions. To determine the incremental borrowing rate, the Group uses a risk-free interest rate adjusted for credit risk, adjusting for terms speci�c to the lease including term, country and currency.
The Group is exposed to potential future increases in variable lease payments that are based on an index or rate, which are initially measured as at the commencement date, with any future changes in the index or rate excluded from the lease liability until they take effect. When adjustments to lease payments based on an index or rate take effect, the lease liability is reassessed and adjusted against the right-of-use asset.
Lease payments are allocated between principal and �nance cost. The �nance cost is charged to the Consolidated Statement of Comprehensive Income over the lease period so as to produce a constant periodic rate of interest on the remaining balance of the liability for each period.
Payments associated with short-term leases of Property, plant and equipment and all leases of low-value assets are recognised on a straight-line basis as an expense in the Consolidated Statement of Comprehensive Income. Short-term leases are leases with a lease term of 12 months or less. Low-value leases are those where the underlying asset value, when new, is $5,000 or less and includes IT equipment and small items of of�ce furniture.
Contracts may contain both lease and non-lease components. The Group allocates the consideration in the contract to the lease and non-lease components based on their relative stand-alone prices.
Right-of-use assets are generally depreciated over the shorter of the asset’s useful life and the lease term on a straight-line basis. If the Group is reasonably certain to exercise a purchase option, the right-of-use asset is depreciated over the underlying asset’s useful life. It is impractical to calculate average asset lives exactly. However, the total lives range from approximately 10 to 50 years for buildings, and three to 15 years for motor vehicles and other assets.
There are no material lease agreements under which the Group is a lessor.
177
Financial S
tatements
AstraZeneca Annual Report & Form 20-F Information 2019 / Group Accounting Policies
Business combinations and goodwill
KJ The determination of whether an acquired set of assets and activities is a business or an asset can be judgemental. Management uses a number of factors to make this determination, which are primarily focused on whether the acquired set of assets and activities are capable of being managed for the purpose of providing a return. Key determining factors include the stage of development of any assets acquired, the readiness and ability of the acquired set to produce outputs and the presence of key experienced employees capable of conducting activities required to develop or manufacture the assets. Typically, the specialised nature of many pharmaceutical assets and processes is such that until assets are substantively ready for production and promotion, there are not the required processes for a set of assets and activities to meet the de�nition of a business in IFRS 3.
On the acquisition of a business, fair values are attributed to the identi�able assets and liabilities. Attributing fair values is a judgement. Contingent liabilities are also recorded at fair value unless the fair value cannot be measured reliably, in which case the value is subsumed into goodwill. Where the Group fully acquires, through a business combination, assets that were previously held in joint operations, the Group has elected not to uplift the book value of the existing interest in the asset held in the joint operation to fair value at the date full control is taken. Where fair values of acquired contingent liabilities cannot be measured reliably, the assumed contingent liability is not recognised but is disclosed in the same manner as other contingent liabilities.
Where not all of the equity of a subsidiary is acquired, the non-controlling interest is recognised either at fair value or at the non-controlling interest’s proportionate share of the net assets of the subsidiary, on a case-by-case basis. Put options over non-controlling interests are recognised as a �nancial liability, with a corresponding entry in either retained earnings or against non-controlling interest reserves on a case-by-case basis.
The timing and amount of future contingent elements of consideration is considered a key estimate. Contingent consideration, which may include development and launch milestones, revenue threshold milestones and revenue-based royalties, is fair valued at the date of acquisition using decision-tree analysis with key inputs including probability of success, consideration of potential delays and revenue projections based on the Group’s internal forecasts. Unsettled amounts of consideration are held at fair value within payables with changes in fair value recognised immediately in pro�t.
Goodwill is the difference between the fair value of the consideration and the fair value of net assets acquired.
Goodwill arising on acquisitions is capitalised and subject to an impairment review, both annually and when there is an indication that the carrying value may not be recoverable.
The Group’s policy up to and including 1997 was to eliminate Goodwill arising upon acquisitions against reserves. Under IFRS 1 ‘First-time Adoption of International Financial Reporting Standards’ and IFRS 3 ‘Business Combinations’, such Goodwill will remain eliminated against reserves.
SubsidiariesA subsidiary is an entity controlled, directly or indirectly, by AstraZeneca PLC. Control is regarded as the exposure or rights to the variable returns of the entity when combined with the power to affect those returns.
The �nancial results of subsidiaries are consolidated from the date control is obtained until the date that control ceases.
InventoriesInventories are stated at the lower of cost and net realisable value. The �rst in, �rst out or an average method of valuation is used. For �nished goods and work in progress, cost includes directly attributable costs and certain overhead expenses (including depreciation). Selling expenses and certain other overhead expenses (principally central administration costs) are excluded. Net realisable value is determined as estimated selling price less all estimated costs of completion and costs to be incurred in selling and distribution.
Write-downs of inventory occur in the general course of business and are recognised in cost of sales for launched or approved products and research and development costs for products in development.
Assets held for saleNon-current assets are classi�ed as assets held for sale when their carrying amount is to be recovered principally through a sale transaction and a sale is considered highly probable. A sale is usually considered highly probable only when an appropriate level of management has committed to the sale.
Assets held for sale are stated at the lower of carrying amount and fair value less costs to sell. Where there is a partial transfer of a non-current asset to held for sale, an allocation of value is made between the current and non-current portions of the asset based on the relative value of the two portions, unless there is a methodology that better re�ects the asset to be disposed of.
Assets held for sale are not depreciated or amortised.
Trade and other receivablesFinancial assets included in Trade and other receivables are recognised initially at fair value. The Group holds the Trade receivables with the objective to collect the contractual cash �ows and therefore measures them subsequently at amortised cost using the effective interest rate method, less any impairment losses.
Trade receivables that are subject to debt factoring arrangements are derecognised if they meet the conditions for derecognition detailed in IFRS 9 ‘Financial Instruments’.
Trade and other payablesFinancial liabilities included in Trade and other payables are recognised initially at fair value. Subsequent to initial recognition they are measured at amortised cost using the effective interest rate method. Contingent consideration payables are held at fair value within level 3 of the fair value hierarchy as de�ned in Note 12.
Financial instrumentsThe Group’s �nancial instruments include lease liabilities, Trade and other receivables and payables, liabilities for contingent consideration and put options under business combinations, and rights and obligations under employee bene�t plans which are dealt with in speci�c accounting policies.
The Group’s other �nancial instruments include:
> Cash and cash equivalents> Fixed deposits> Other investments> Bank and other borrowings> Derivatives
Cash and cash equivalentsCash and cash equivalents comprise cash in hand, current balances with banks and similar institutions, and highly liquid investments with maturities of three months or less when acquired. They are readily convertible into known amounts of cash and are held at amortised cost under the hold to collect classi�cation, where they meet the hold to collect ‘solely payments of principal and interest’ test criteria under IFRS 9. Those not meeting these criteria are held at fair value through pro�t and loss.
Fixed depositsFixed deposits, principally comprising funds held with banks and other �nancial institutions, are initially measured at fair value, plus direct transaction costs, and are subsequently measured at amortised cost using the effective interest rate method at each reporting date. Changes in carrying value are recognised in pro�t.
178 AstraZeneca Annual Report & Form 20-F Information 2019 / Financial Statements
Group Accounting Policies continued
Other investmentsAccounting policy applied until 31 December 2017 (IAS 39)Until 31 December 2017, the investments were classi�ed as available for sale, initially measured at fair value (including direct transaction costs) and subsequently remeasured to fair value at each reporting date. Changes in carrying value due to changes in exchange rates on monetary available for sale investments or impairments were recognised in pro�t within Other operating income and expense. All other changes in fair value were recognised in Other comprehensive income.
Accounting policy applied from 1 January 2018 (IFRS 9)On adoption of IFRS 9 on 1 January 2018 the available for sale classi�cation category was eliminated. Investments previously classi�ed as available for sale are now classi�ed as fair value through pro�t or loss, unless the Group makes an irrevocable election at initial recognition for certain non-current equity investments to present changes in fair value in Other comprehensive income. If this election is made, there is no subsequent reclassi�cation of fair value gains and losses to pro�t and loss following the derecognition of the investment. The following reclassi�cations were made on 1 January 2018:
Reclassi�cation from available for sale to at fair value through Other comprehensive incomeThese investments were reclassi�ed from available for sale to assets at fair value through Other comprehensive income. The investments primarily relate to biotech companies and are held to access science rather than to liquidate and realise gains.
Reclassi�cation from available for sale to at fair value through pro�t or lossThese investments were reclassi�ed from available to sale to assets at fair value through pro�t and loss. The investments primarily relate to short-term assets invested as part of our cash management strategy to maximise gains on our liquid resources.
Bank and other borrowingsThe Group uses derivatives, principally interest rate swaps, to hedge the interest rate exposure inherent in a portion of its �xed interest rate debt. In such cases the Group will either designate the debt as fair value through pro�t or loss when certain criteria are met or as the hedged item under a fair value hedge.
If the debt instrument is designated as fair value through pro�t or loss, the debt is initially measured at fair value (with direct transaction costs being included in pro�t as an expense) and is remeasured to fair value at each reporting date with changes in carrying value being recognised in pro�t (along with changes in the fair value of the related derivative), with the exception of changes in the fair value of the debt instrument relating to own credit risk which are recorded in Other comprehensive income in accordance with IFRS 9. Such a designation has been made where this signi�cantly reduces an accounting mismatch which would result from recognising gains and losses on different bases.
If the debt is designated as the hedged item under a fair value hedge, the debt is initially measured at fair value (with direct transaction costs being amortised over the life of the debt) and is remeasured for fair value changes in respect of the hedged risk at each reporting date with changes in carrying value being recognised in pro�t (along with changes in the fair value of the related derivative).
If the debt is designated in a cash �ow hedge, the debt is measured at amortised cost (with gains or losses taken to pro�t and direct transaction costs being amortised over the life of the debt). The related derivative is remeasured for fair value changes at each reporting date with the portion of the gain or loss on the derivative that is determined to be an effective hedge recognised in Other comprehensive income. The amounts that have been recognised in Other comprehensive income are reclassi�ed to pro�t in the same period that the hedged forecast cash �ows affect pro�t. The reclassi�cation adjustment is included in Finance expense in the Consolidated Statement of Comprehensive Income.
Other interest-bearing loans are initially measured at fair value (with direct transaction costs being amortised over the life of the loan) and are subsequently measured at amortised cost using the effective interest rate method at each reporting date. Changes in carrying value are recognised in pro�t.
DerivativesDerivatives are initially measured at fair value (with direct transaction costs being included in pro�t as an expense) and are subsequently remeasured to fair value at each reporting date. Changes in carrying value are recognised in pro�t.
Foreign currenciesForeign currency transactions, being transactions denominated in a currency other than an individual Group entity’s functional currency, are translated into the relevant functional currencies of individual Group entities at average rates for the relevant monthly accounting periods, which approximate to actual rates.
Monetary assets and liabilities arising from foreign currency transactions are retranslated at exchange rates prevailing at the reporting date. Exchange gains and losses on loans and on short-term foreign currency borrowings and deposits are included within Finance expense. Exchange differences on all other foreign currency transactions are recognised in Operating pro�t in the individual Group entity’s accounting records.
Non-monetary items arising from foreign currency transactions are not retranslated in the individual Group entity’s accounting records.
In the Consolidated Financial Statements, income and expense items for Group entities with a functional currency other than US dollars are translated into US dollars at average exchange rates, which approximate to actual rates, for the relevant accounting periods. Assets and liabilities are translated at the US dollar exchange rates prevailing at the reporting date. Exchange differences arising on consolidation are recognised in Other comprehensive income.
If certain criteria are met, non-US dollar denominated loans or derivatives are designated as net investment hedges of foreign operations. Exchange differences arising on retranslation of net investments, and of foreign currency loans which are designated in an effective net investment hedge relationship, are recognised in Other comprehensive income in the Consolidated Financial Statements. Foreign exchange derivatives hedging net investments in foreign operations are carried at fair value. Effective fair value movements are recognised in Other comprehensive income, with any ineffectiveness taken to pro�t. Gains and losses accumulated in the translation reserve will be recycled to pro�t when the foreign operation is sold.
Litigation and environmental liabilitiesAstraZeneca is involved in legal disputes, the settlement of which may involve cost to the Group. Provision is made where an adverse outcome is probable and associated costs, including related legal costs, can be estimated reliably. In other cases, appropriate disclosures are included. Determining the timing of recognition of when an adverse outcome is probable is considered a key judgement, refer to Note 29 to the Financial Statements on page 221.
179
Financial S
tatements
AstraZeneca Annual Report & Form 20-F Information 2019 / Group Accounting Policies
Where it is considered that the Group is more likely than not to prevail, or in the rare circumstances where the amount of the legal liability cannot be estimated reliably, legal costs involved in defending the claim are charged to pro�t as they are incurred.
Where it is considered that the Group has a valid contract which provides the right to reimbursement (from insurance or otherwise) of legal costs and/or all or part of any loss incurred or for which a provision has been established, the best estimate of the amount expected to be received is recognised as an asset only when it is virtually certain.
AstraZeneca is exposed to environmental liabilities relating to its past operations, principally in respect of soil and groundwater remediation costs. Provisions for these costs are made when there is a present obligation and where it is probable that expenditure on remedial work will be required and a reliable estimate can be made of the cost. Provisions are discounted where the effect is material.
ImpairmentThe carrying values of non-�nancial assets, other than Inventories and Deferred tax assets, are reviewed at least annually to determine whether there is any indication of impairment. For Goodwill, Intangible assets under development and for any other assets where such indication exists, the asset’s recoverable amount is estimated based on the greater of its value in use and its fair value less cost to sell. In assessing the recoverable amount, the estimated future cash �ows, adjusted for the risks speci�c to each asset, are discounted to their present value using a discount rate that re�ects current market assessments of the time value of money, the general risks affecting the pharmaceutical industry and other risks speci�c to each asset. For the purpose of impairment testing, assets are grouped together into the smallest group of assets that generates cash in�ows from continuing use that are largely independent of the cash �ows of other assets. Impairment losses are recognised immediately in pro�t.
International accounting transitionOn transition to using adopted IFRSs in the year ended 31 December 2005, the Group took advantage of several optional exemptions available in IFRS 1 ‘First-time Adoption of International Financial Reporting Standards’. The major impacts which are of continuing importance are detailed below:
> Business combinations – IFRS 3 ‘Business Combinations’ has been applied from 1 January 2003, the date of transition, rather than being applied fully retrospectively. As a result, the combination of Astra and Zeneca is still accounted for as a merger, rather than through purchase accounting. If purchase accounting had been adopted, Zeneca would have been deemed to have acquired Astra.
> Cumulative exchange differences – the Group chose to set the cumulative exchange difference reserve at 1 January 2003 to nil.
Applicable accounting standards and inter retations issued but not yet ado tedAt the date of authorisation of these �nancial statements, the following amendments were in issue but not yet adopted by the Group:
> amendments to IAS 1 ‘Presentation of Financial Statements’ and IAS 8 ‘Accounting Policies, Changes in Accounting Estimates and Errors’ – endorsed by the EU on 29 November 2019
> amendments to IFRS 3 ‘Business Combinations’, effective for periods beginning on or after 1 January 2020 – not amended by the EU.
The above amendments and interpretations are not expected to have a signi�cant impact on the Group’s net results.
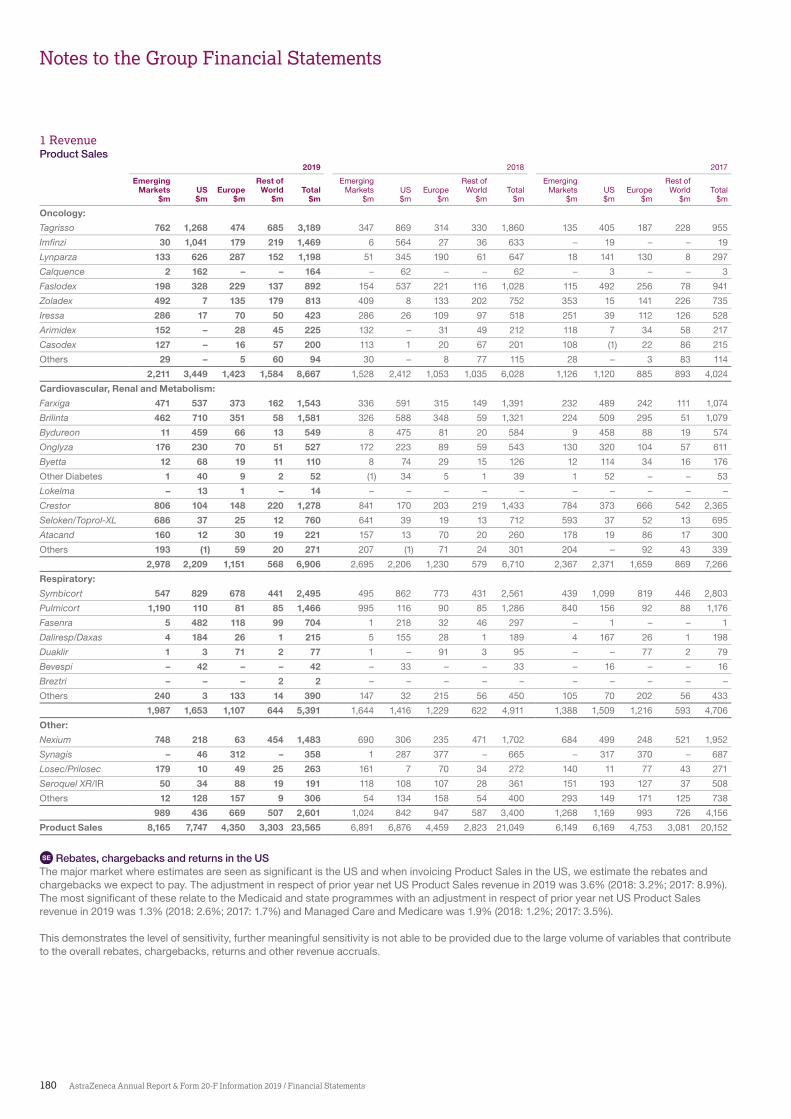
180 AstraZeneca Annual Report & Form 20-F Information 2019 / Financial Statements
Notes to the Group Financial Statements
1 RevenueProduct Sales
2019 2018 2017
Emerging Rest of Emerging Rest of Emerging Rest ofMarkets US Europe World Total Markets US Europe World Total Markets US Europe World Total
$m $m $m $m $m $m $m $m $m $m $m $m $m $m $m
Oncology:
Tagrisso 762 1,268 474 685 3,189 347 869 314 330 1,860 135 405 187 228 955
Imfinzi 30 1,041 179 219 1,469 6 564 27 36 633 – 19 – – 19
Lynparza 133 626 287 152 1,198 51 345 190 61 647 18 141 130 8 297
Calquence 2 162 – – 164 – 62 – – 62 – 3 – – 3
Faslodex 198 328 229 137 892 154 537 221 116 1,028 115 492 256 78 941
Zoladex 492 7 135 179 813 409 8 133 202 752 353 15 141 226 735
Iressa 286 17 70 50 423 286 26 109 97 518 251 39 112 126 528
Arimidex 152 – 28 45 225 132 – 31 49 212 118 7 34 58 217
Casodex 127 – 16 57 200 113 1 20 67 201 108 (1) 22 86 215
Others 29 – 5 60 94 30 – 8 77 115 28 – 3 83 114
2,211 3,449 1,423 1,584 8,667 1,528 2,412 1,053 1,035 6,028 1,126 1,120 885 893 4,024
Cardiovascular, Renal and Metabolism:
Farxiga 471 537 373 162 1,543 336 591 315 149 1,391 232 489 242 111 1,074
Brilinta 462 710 351 58 1,581 326 588 348 59 1,321 224 509 295 51 1,079
Bydureon 11 459 66 13 549 8 475 81 20 584 9 458 88 19 574
Onglyza 176 230 70 51 527 172 223 89 59 543 130 320 104 57 611
Byetta 12 68 19 11 110 8 74 29 15 126 12 114 34 16 176
Other Diabetes 1 40 9 2 52 (1) 34 5 1 39 1 52 – – 53
Lokelma – 13 1 – 14 – – – – – – – – – –
Crestor 806 104 148 220 1,278 841 170 203 219 1,433 784 373 666 542 2,365
Seloken/Toprol-XL 686 37 25 12 760 641 39 19 13 712 593 37 52 13 695
Atacand 160 12 30 19 221 157 13 70 20 260 178 19 86 17 300
Others 193 (1) 59 20 271 207 (1) 71 24 301 204 – 92 43 339
2,978 2,209 1,151 568 6,906 2,695 2,206 1,230 579 6,710 2,367 2,371 1,659 869 7,266
Respiratory:
Symbicort 547 829 678 441 2,495 495 862 773 431 2,561 439 1,099 819 446 2,803
Pulmicort 1,190 110 81 85 1,466 995 116 90 85 1,286 840 156 92 88 1,176
Fasenra 5 482 118 99 704 1 218 32 46 297 – 1 – – 1
Daliresp/Daxas 4 184 26 1 215 5 155 28 1 189 4 167 26 1 198
Duaklir 1 3 71 2 77 1 – 91 3 95 – – 77 2 79
Bevespi – 42 – – 42 – 33 – – 33 – 16 – – 16
Breztri – – – 2 2 – – – – – – – – – –
Others 240 3 133 14 390 147 32 215 56 450 105 70 202 56 433
1,987 1,653 1,107 644 5,391 1,644 1,416 1,229 622 4,911 1,388 1,509 1,216 593 4,706
Other:
Nexium 748 218 63 454 1,483 690 306 235 471 1,702 684 499 248 521 1,952
Synagis – 46 312 – 358 1 287 377 – 665 – 317 370 – 687
Losec/Prilosec 179 10 49 25 263 161 7 70 34 272 140 11 77 43 271
Seroquel XR/IR 50 34 88 19 191 118 108 107 28 361 151 193 127 37 508
Others 12 128 157 9 306 54 134 158 54 400 293 149 171 125 738
989 436 669 507 2,601 1,024 842 947 587 3,400 1,268 1,169 993 726 4,156
Product Sales 8,165 7,747 4,350 3,303 23,565 6,891 6,876 4,459 2,823 21,049 6,149 6,169 4,753 3,081 20,152
SE Rebates, chargebacks and returns in the US The major market where estimates are seen as signi�cant is the US and when invoicing Product Sales in the US, we estimate the rebates and chargebacks we expect to pay. The adjustment in respect of prior year net US Product Sales revenue in 2019 was 3.6% (2018: 3.2%; 2017: 8.9%). The most signi�cant of these relate to the Medicaid and state programmes with an adjustment in respect of prior year net US Product Sales revenue in 2019 was 1.3% (2018: 2.6%; 2017: 1.7%) and Managed Care and Medicare was 1.9% (2018: 1.2%; 2017: 3.5%).
This demonstrates the level of sensitivity, further meaningful sensitivity is not able to be provided due to the large volume of variables that contribute to the overall rebates, chargebacks, returns and other revenue accruals.
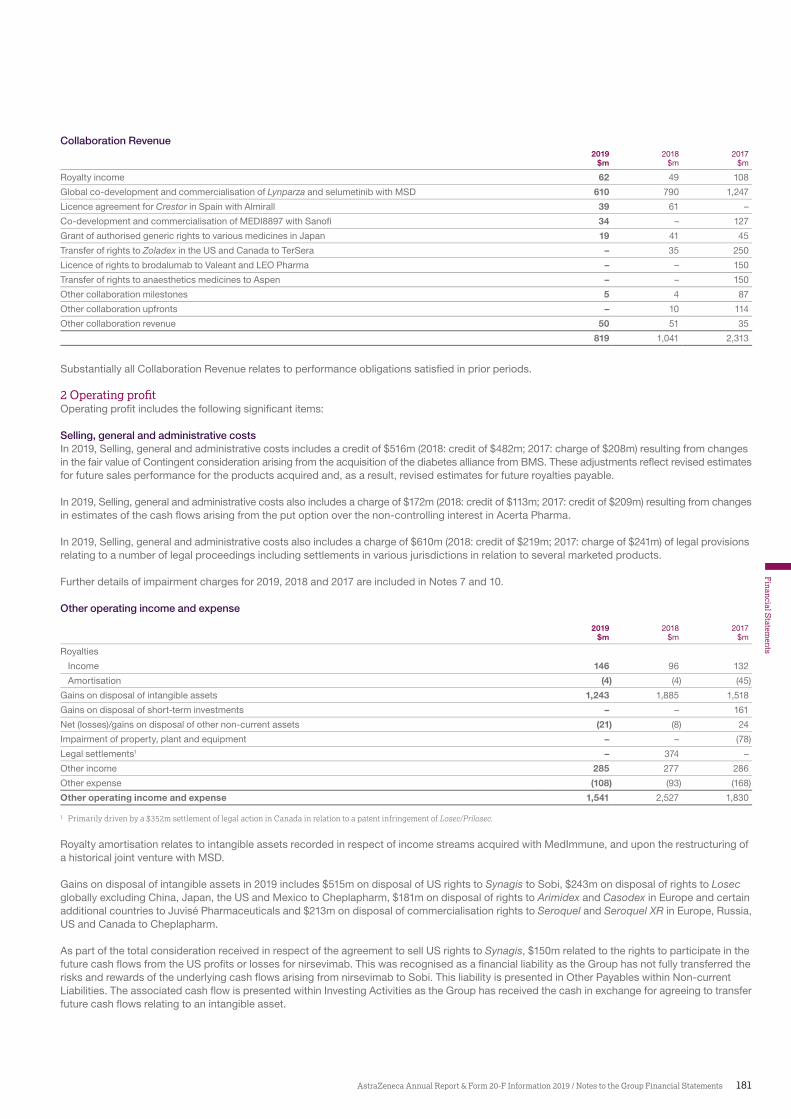
181AstraZeneca Annual Report & Form 20-F Information 2019 / Notes to the Group Financial Statements
Financial S
tatements
Collaboration Revenue2019 2018 2017
$m $m $m
Royalty income 62 49 108
Global co-development and commercialisation of Lynparza and selumetinib with MSD 610 790 1,247
Licence agreement for Crestor in Spain with Almirall 39 61 –
Co-development and commercialisation of MEDI8897 with Sanofi 34 – 127
Grant of authorised generic rights to various medicines in Japan 19 41 45
Transfer of rights to Zoladex in the US and Canada to TerSera – 35 250
Licence of rights to brodalumab to Valeant and LEO Pharma – – 150
Transfer of rights to anaesthetics medicines to Aspen – – 150
Other collaboration milestones 5 4 87
Other collaboration upfronts – 10 114
Other collaboration revenue 50 51 35
819 1,041 2,313
Substantially all Collaboration Revenue relates to performance obligations satis�ed in prior periods.
erating rofitOperating pro�t includes the following signi�cant items:
Selling, general and administrative costsIn 2019, Selling, general and administrative costs includes a credit of $516m (2018: credit of $482m; 2017: charge of $208m) resulting from changes in the fair value of Contingent consideration arising from the acquisition of the diabetes alliance from BMS. These adjustments re�ect revised estimates for future sales performance for the products acquired and, as a result, revised estimates for future royalties payable.
In 2019, Selling, general and administrative costs also includes a charge of $172m (2018: credit of $113m; 2017: credit of $209m) resulting from changes in estimates of the cash �ows arising from the put option over the non-controlling interest in Acerta Pharma.
In 2019, Selling, general and administrative costs also includes a charge of $610m (2018: credit of $219m; 2017: charge of $241m) of legal provisions relating to a number of legal proceedings including settlements in various jurisdictions in relation to several marketed products.
Further details of impairment charges for 2019, 2018 and 2017 are included in Notes 7 and 10.
Other operating income and expense
2019 2018 2017$m $m $m
Royalties
Income 146 96 132
Amortisation (4) (4) (45)
Gains on disposal of intangible assets 1,243 1,885 1,518
Gains on disposal of short-term investments – – 161
Net (losses)/gains on disposal of other non-current assets (21) (8) 24
Impairment of property, plant and equipment – – (78)
Legal settlements1 – 374 –
Other income 285 277 286
Other expense (108) (93) (168)
Other operating income and expense 1,541 2,527 1,830
1 Primarily driven by a $352m settlement of legal action in Canada in relation to a patent infringement of Losec/Prilosec.
Royalty amortisation relates to intangible assets recorded in respect of income streams acquired with MedImmune, and upon the restructuring of a historical joint venture with MSD.
Gains on disposal of intangible assets in 2019 includes $515m on disposal of US rights to Synagis to Sobi, $243m on disposal of rights to Losec globally excluding China, Japan, the US and Mexico to Cheplapharm, $181m on disposal of rights to Arimidex and Casodex in Europe and certain additional countries to Juvisé Pharmaceuticals and $213m on disposal of commercialisation rights to Seroquel and Seroquel XR in Europe, Russia, US and Canada to Cheplapharm.
As part of the total consideration received in respect of the agreement to sell US rights to Synagis, $150m related to the rights to participate in the future cash �ows from the US pro�ts or losses for nirsevimab. This was recognised as a �nancial liability as the Group has not fully transferred the risks and rewards of the underlying cash �ows arising from nirsevimab to Sobi. This liability is presented in Other Payables within Non-current Liabilities. The associated cash �ow is presented within Investing Activities as the Group has received the cash in exchange for agreeing to transfer future cash �ows relating to an intangible asset.
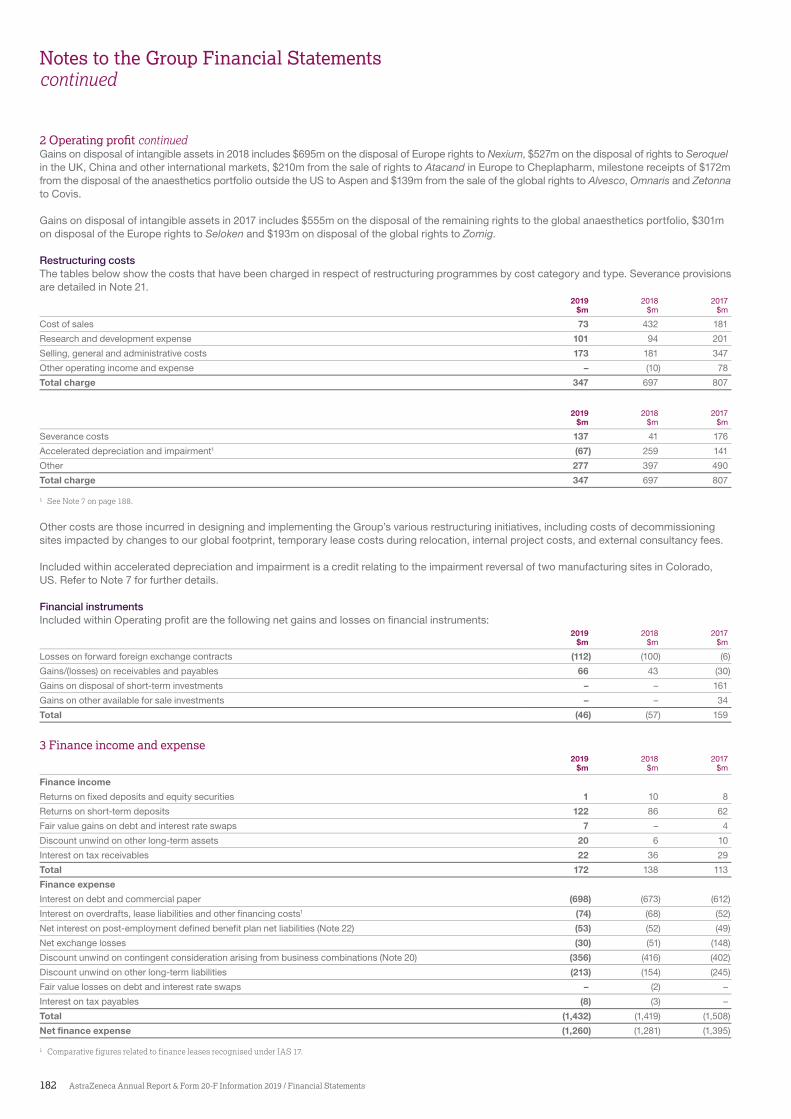
182 AstraZeneca Annual Report & Form 20-F Information 2019 / Financial Statements
Notes to the Group Financial Statementscontinued
Gains on disposal of intangible assets in 2018 includes $695m on the disposal of Europe rights to Nexium, $527m on the disposal of rights to Seroquel in the UK, China and other international markets, $210m from the sale of rights to Atacand in Europe to Cheplapharm, milestone receipts of $172m from the disposal of the anaesthetics portfolio outside the US to Aspen and $139m from the sale of the global rights to Alvesco, Omnaris and Zetonna to Covis.
Gains on disposal of intangible assets in 2017 includes $555m on the disposal of the remaining rights to the global anaesthetics portfolio, $301m on disposal of the Europe rights to Seloken and $193m on disposal of the global rights to Zomig.
Restructuring costsThe tables below show the costs that have been charged in respect of restructuring programmes by cost category and type. Severance provisions are detailed in Note 21.
2019 2018 2017$m $m $m
Cost of sales 73 432 181
Research and development expense 101 94 201
Selling, general and administrative costs 173 181 347
Other operating income and expense – (10) 78
Total charge 347 697 807
2019 2018 2017$m $m $m
Severance costs 137 41 176
Accelerated depreciation and impairment1 (67) 259 141
Other 277 397 490
Total charge 347 697 807
1 See Note 7 on page 188.
Other costs are those incurred in designing and implementing the Group’s various restructuring initiatives, including costs of decommissioning sites impacted by changes to our global footprint, temporary lease costs during relocation, internal project costs, and external consultancy fees.
Included within accelerated depreciation and impairment is a credit relating to the impairment reversal of two manufacturing sites in Colorado, US. Refer to Note 7 for further details.
Financial instrumentsIncluded within Operating pro�t are the following net gains and losses on �nancial instruments:
2019 2018 2017$m $m $m
Losses on forward foreign exchange contracts (112) (100) (6)
Gains/(losses) on receivables and payables 66 43 (30)
Gains on disposal of short-term investments – – 161
Gains on other available for sale investments – – 34
Total (46) (57) 159
3 Finance income and expense2019 2018 2017
$m $m $m
Finance income
Returns on fixed deposits and equity securities 1 10 8
Returns on short-term deposits 122 86 62
Fair value gains on debt and interest rate swaps 7 – 4
Discount unwind on other long-term assets 20 6 10
Interest on tax receivables 22 36 29
Total 172 138 113
Finance expense
Interest on debt and commercial paper (698) (673) (612)
Interest on overdrafts, lease liabilities and other financing costs1 (74) (68) (52)
Net interest on post-employment defined benefit plan net liabilities (Note 22) (53) (52) (49)
Net exchange losses (30) (51) (148)
Discount unwind on contingent consideration arising from business combinations (Note 20) (356) (416) (402)
Discount unwind on other long-term liabilities (213) (154) (245)
Fair value losses on debt and interest rate swaps – (2) –
Interest on tax payables (8) (3) –
Total (1,432) (1,419) (1,508)
Net finance expense (1,260) (1,281) (1,395)
1 Comparative figures related to finance leases recognised under IAS 17.
erating rofit continued
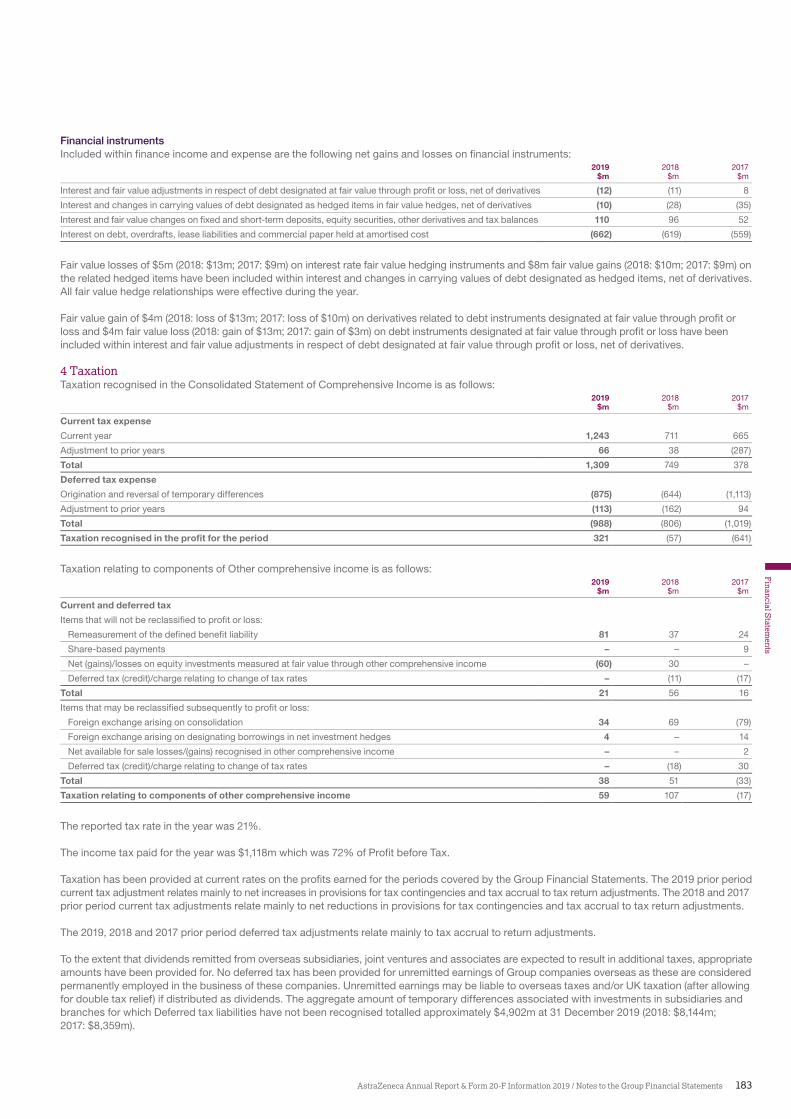
183AstraZeneca Annual Report & Form 20-F Information 2019 / Notes to the Group Financial Statements
Financial S
tatements
Financial instrumentsIncluded within �nance income and expense are the following net gains and losses on �nancial instruments:
2019 2018 2017$m $m $m
Interest and fair value adjustments in respect of debt designated at fair value through profit or loss, net of derivatives (12) (11) 8
Interest and changes in carrying values of debt designated as hedged items in fair value hedges, net of derivatives (10) (28) (35)
Interest and fair value changes on fixed and short-term deposits, equity securities, other derivatives and tax balances 110 96 52
Interest on debt, overdrafts, lease liabilities and commercial paper held at amortised cost (662) (619) (559)
Fair value losses of $5m (2018: $13m; 2017: $9m) on interest rate fair value hedging instruments and $8m fair value gains (2018: $10m; 2017: $9m) on the related hedged items have been included within interest and changes in carrying values of debt designated as hedged items, net of derivatives. All fair value hedge relationships were effective during the year.
Fair value gain of $4m (2018: loss of $13m; 2017: loss of $10m) on derivatives related to debt instruments designated at fair value through pro�t or loss and $4m fair value loss (2018: gain of $13m; 2017: gain of $3m) on debt instruments designated at fair value through pro�t or loss have been included within interest and fair value adjustments in respect of debt designated at fair value through pro�t or loss, net of derivatives.
4 TaxationTaxation recognised in the Consolidated Statement of Comprehensive Income is as follows:
2019 2018 2017$m $m $m
Current tax expense
Current year 1,243 711 665
Adjustment to prior years 66 38 (287)
Total 1,309 749 378
Deferred tax expense
Origination and reversal of temporary differences (875) (644) (1,113)
Adjustment to prior years (113) (162) 94
Total (988) (806) (1,019)
Taxation recognised in the profit for the period 321 (57) (641)
Taxation relating to components of Other comprehensive income is as follows:2019 2018 2017
$m $m $m
Current and deferred tax
Items that will not be reclassified to profit or loss:
Remeasurement of the defined benefit liability 81 37 24
Share-based payments – – 9
Net (gains)/losses on equity investments measured at fair value through other comprehensive income (60) 30 –
Deferred tax (credit)/charge relating to change of tax rates – (11) (17)
Total 21 56 16
Items that may be reclassified subsequently to profit or loss:
Foreign exchange arising on consolidation 34 69 (79)
Foreign exchange arising on designating borrowings in net investment hedges 4 – 14
Net available for sale losses/(gains) recognised in other comprehensive income – – 2
Deferred tax (credit)/charge relating to change of tax rates – (18) 30
Total 38 51 (33)
Taxation relating to components of other comprehensive income 59 107 (17)
The reported tax rate in the year was 21%.
The income tax paid for the year was $1,118m which was 72% of Pro�t before Tax.
Taxation has been provided at current rates on the pro�ts earned for the periods covered by the Group Financial Statements. The 2019 prior period current tax adjustment relates mainly to net increases in provisions for tax contingencies and tax accrual to tax return adjustments. The 2018 and 2017 prior period current tax adjustments relate mainly to net reductions in provisions for tax contingencies and tax accrual to tax return adjustments.
The 2019, 2018 and 2017 prior period deferred tax adjustments relate mainly to tax accrual to return adjustments.
To the extent that dividends remitted from overseas subsidiaries, joint ventures and associates are expected to result in additional taxes, appropriate amounts have been provided for. No deferred tax has been provided for unremitted earnings of Group companies overseas as these are considered permanently employed in the business of these companies. Unremitted earnings may be liable to overseas taxes and/or UK taxation (after allowing for double tax relief) if distributed as dividends. The aggregate amount of temporary differences associated with investments in subsidiaries and branches for which Deferred tax liabilities have not been recognised totalled approximately $4,902m at 31 December 2019 (2018: $8,144m; 2017: $8,359m).
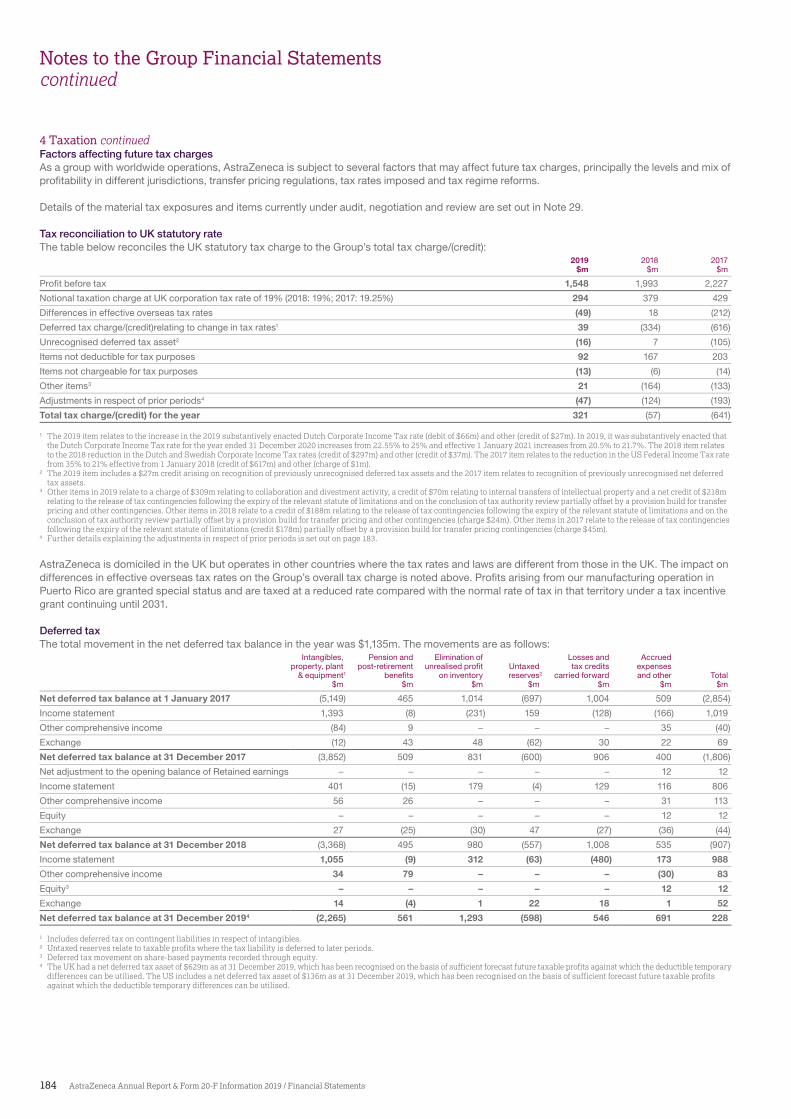
184 AstraZeneca Annual Report & Form 20-F Information 2019 / Financial Statements
Notes to the Group Financial Statementscontinued
Factors affecting future tax chargesAs a group with worldwide operations, AstraZeneca is subject to several factors that may affect future tax charges, principally the levels and mix of pro�tability in different jurisdictions, transfer pricing regulations, tax rates imposed and tax regime reforms.
Details of the material tax exposures and items currently under audit, negotiation and review are set out in Note 29.
Tax reconciliation to UK statutory rateThe table below reconciles the UK statutory tax charge to the Group’s total tax charge/(credit):
2019 2018 2017$m $m $m
Profit before tax 1,548 1,993 2,227
Notional taxation charge at UK corporation tax rate of 19% (2018: 19%; 2017: 19.25%) 294 379 429
Differences in effective overseas tax rates (49) 18 (212)
Deferred tax charge/(credit)relating to change in tax rates1 39 (334) (616)
Unrecognised deferred tax asset2 (16) 7 (105)
Items not deductible for tax purposes 92 167 203
Items not chargeable for tax purposes (13) (6) (14)
Other items3 21 (164) (133)
Adjustments in respect of prior periods4 (47) (124) (193)
Total tax charge/(credit) for the year 321 (57) (641)
1 The 2019 item relates to the increase in the 2019 substantively enacted Dutch Corporate Income Tax rate (debit of $66m) and other (credit of $27m). In 2019, it was substantively enacted that the Dutch Corporate Income Tax rate for the year ended 31 December 2020 increases from 22.55% to 25% and effective 1 January 2021 increases from 20.5% to 21.7%. The 2018 item relates to the 2018 reduction in the Dutch and Swedish Corporate Income Tax rates (credit of $297m) and other (credit of $37m). The 2017 item relates to the reduction in the US Federal Income Tax rate from 35% to 21% effective from 1 January 2018 (credit of $617m) and other (charge of $1m).
2 The 2019 item includes a $27m credit arising on recognition of previously unrecognised deferred tax assets and the 2017 item relates to recognition of previously unrecognised net deferred tax assets.
3 Other items in 2019 relate to a charge of $309m relating to collaboration and divestment activity, a credit of $70m relating to internal transfers of intellectual property and a net credit of $218m relating to the release of tax contingencies following the expiry of the relevant statute of limitations and on the conclusion of tax authority review partially offset by a provision build for transfer pricing and other contingencies. Other items in 2018 relate to a credit of $188m relating to the release of tax contingencies following the expiry of the relevant statute of limitations and on the conclusion of tax authority review partially offset by a provision build for transfer pricing and other contingencies (charge $24m). Other items in 2017 relate to the release of tax contingencies following the expiry of the relevant statute of limitations (credit $178m) partially offset by a provision build for transfer pricing contingencies (charge $45m).
4 Further details explaining the adjustments in respect of prior periods is set out on page 183.
AstraZeneca is domiciled in the UK but operates in other countries where the tax rates and laws are different from those in the UK. The impact on differences in effective overseas tax rates on the Group’s overall tax charge is noted above. Pro�ts arising from our manufacturing operation in Puerto Rico are granted special status and are taxed at a reduced rate compared with the normal rate of tax in that territory under a tax incentive grant continuing until 2031.
Deferred taxThe total movement in the net deferred tax balance in the year was $1,135m. The movements are as follows:
Intangibles, Pension and Elimination of Losses and Accruedproperty, plant post-retirement unrealised profit Untaxed tax credits expenses
& equipment1 benefits on inventory reserves2 carried forward and other Total$m $m $m $m $m $m $m
Net deferred tax balance at 1 January 2017 (5,149) 465 1,014 (697) 1,004 509 (2,854)
Income statement 1,393 (8) (231) 159 (128) (166) 1,019
Other comprehensive income (84) 9 – – – 35 (40)
Exchange (12) 43 48 (62) 30 22 69
Net deferred tax balance at 31 December 2017 (3,852) 509 831 (600) 906 400 (1,806)
Net adjustment to the opening balance of Retained earnings – – – – – 12 12
Income statement 401 (15) 179 (4) 129 116 806
Other comprehensive income 56 26 – – – 31 113
Equity – – – – – 12 12
Exchange 27 (25) (30) 47 (27) (36) (44)
Net deferred tax balance at 31 December 2018 (3,368) 495 980 (557) 1,008 535 (907)
Income statement 1,055 (9) 312 (63) (480) 173 988
Other comprehensive income 34 79 – – – (30) 83
Equity3 – – – – – 12 12
Exchange 14 (4) 1 22 18 1 52
Net deferred tax balance at 31 December 20194 (2,265) 561 1,293 (598) 546 691 228
1 Includes deferred tax on contingent liabilities in respect of intangibles.2 Untaxed reserves relate to taxable profits where the tax liability is deferred to later periods.3 Deferred tax movement on share-based payments recorded through equity.4 The UK had a net deferred tax asset of $629m as at 31 December 2019, which has been recognised on the basis of sufficient forecast future taxable profits against which the deductible temporary
differences can be utilised. The US includes a net deferred tax asset of $136m as at 31 December 2019, which has been recognised on the basis of sufficient forecast future taxable profits against which the deductible temporary differences can be utilised.
4 Taxation continued
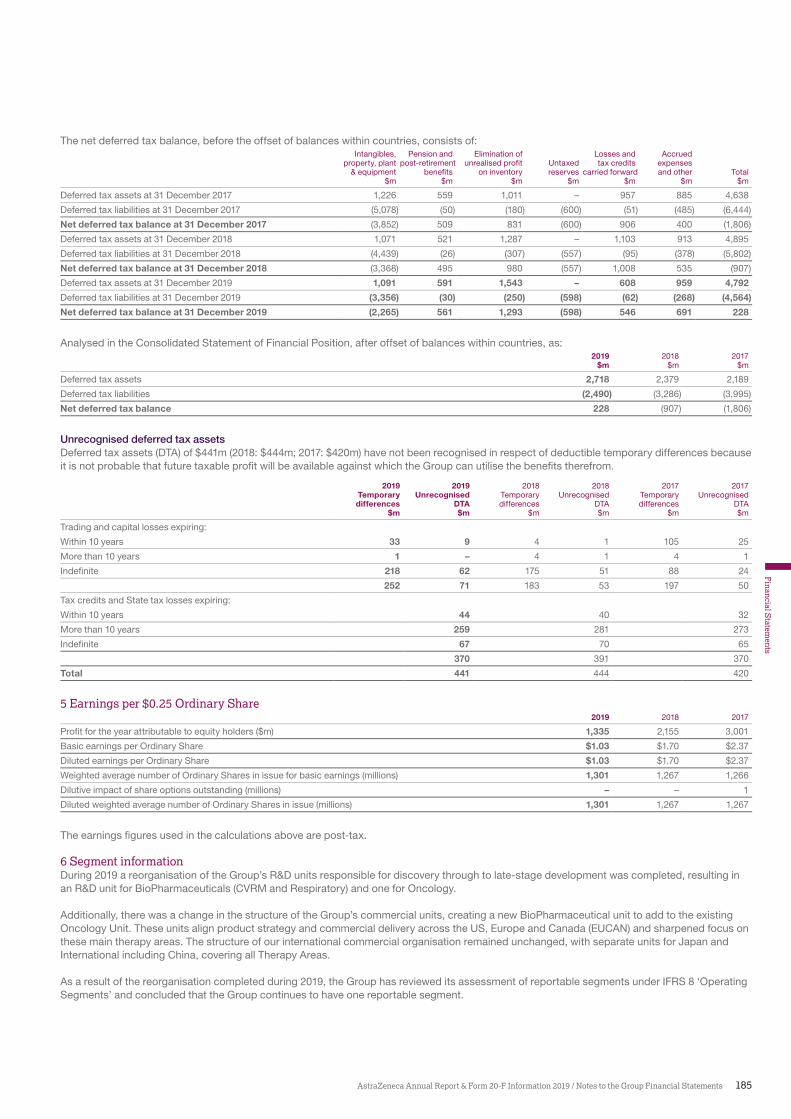
185AstraZeneca Annual Report & Form 20-F Information 2019 / Notes to the Group Financial Statements
Financial S
tatements
The net deferred tax balance, before the offset of balances within countries, consists of:Intangibles, Pension and Elimination of Losses and Accrued
property, plant post-retirement unrealised profit Untaxed tax credits expenses& equipment bene�ts on inventory reserves carried forward and other Total
$m $m $m $m $m $m $m
Deferred tax assets at 31 December 2017 1,226 559 1,011 – 957 885 4,638
Deferred tax liabilities at 31 December 2017 (5,078) (50) (180) (600) (51) (485) (6,444)
Net deferred tax balance at 31 December 2017 (3,852) 509 831 (600) 906 400 (1,806)
Deferred tax assets at 31 December 2018 1,071 521 1,287 – 1,103 913 4,895
Deferred tax liabilities at 31 December 2018 (4,439) (26) (307) (557) (95) (378) (5,802)
Net deferred tax balance at 31 December 2018 (3,368) 495 980 (557) 1,008 535 (907)
Deferred tax assets at 31 December 2019 1,091 591 1,543 – 608 959 4,792
Deferred tax liabilities at 31 December 2019 (3,356) (30) (250) (598) (62) (268) (4,564)
Net deferred tax balance at 31 December 2019 (2,265) 561 1,293 (598) 546 691 228
Analysed in the Consolidated Statement of Financial Position, after offset of balances within countries, as:2019 2018 2017
$m $m $m
Deferred tax assets 2,718 2,379 2,189
Deferred tax liabilities (2,490) (3,286) (3,995)
Net deferred tax balance 228 (907) (1,806)
Unrecognised deferred tax assetsDeferred tax assets (DTA) of $441m (2018: $444m; 2017: $420m) have not been recognised in respect of deductible temporary differences because it is not probable that future taxable pro�t will be available against which the Group can utilise the bene�ts therefrom.
2019 2019 2018 2018 2017 2017Temporary Unrecognised Temporary Unrecognised Temporary Unrecogniseddifferences DTA differences DTA differences DTA
$m $m $m $m $m $m
Trading and capital losses expiring:
Within 10 years 33 9 4 1 105 25
More than 10 years 1 – 4 1 4 1
Indefinite 218 62 175 51 88 24
252 71 183 53 197 50
Tax credits and State tax losses expiring:
Within 10 years 44 40 32
More than 10 years 259 281 273
Indefinite 67 70 65
370 391 370
Total 441 444 420
5 Earnings per $0.25 Ordinary Share2019 2018 2017
Profit for the year attributable to equity holders ($m) 1,335 2,155 3,001
Basic earnings per Ordinary Share $1.03 $1.70 $2.37
Diluted earnings per Ordinary Share $1.03 $1.70 $2.37
Weighted average number of Ordinary Shares in issue for basic earnings (millions) 1,301 1,267 1,266
Dilutive impact of share options outstanding (millions) – – 1
Diluted weighted average number of Ordinary Shares in issue (millions) 1,301 1,267 1,267
The earnings �gures used in the calculations above are post-tax.
6 Segment informationDuring 2019 a reorganisation of the Group’s R&D units responsible for discovery through to late-stage development was completed, resulting in an R&D unit for BioPharmaceuticals (CVRM and Respiratory) and one for Oncology.
Additionally, there was a change in the structure of the Group’s commercial units, creating a new BioPharmaceutical unit to add to the existing Oncology Unit. These units align product strategy and commercial delivery across the US, Europe and Canada (EUCAN) and sharpened focus on these main therapy areas. The structure of our international commercial organisation remained unchanged, with separate units for Japan and International including China, covering all Therapy Areas.
As a result of the reorganisation completed during 2019, the Group has reviewed its assessment of reportable segments under IFRS 8 ‘Operating Segments’ and concluded that the Group continues to have one reportable segment.
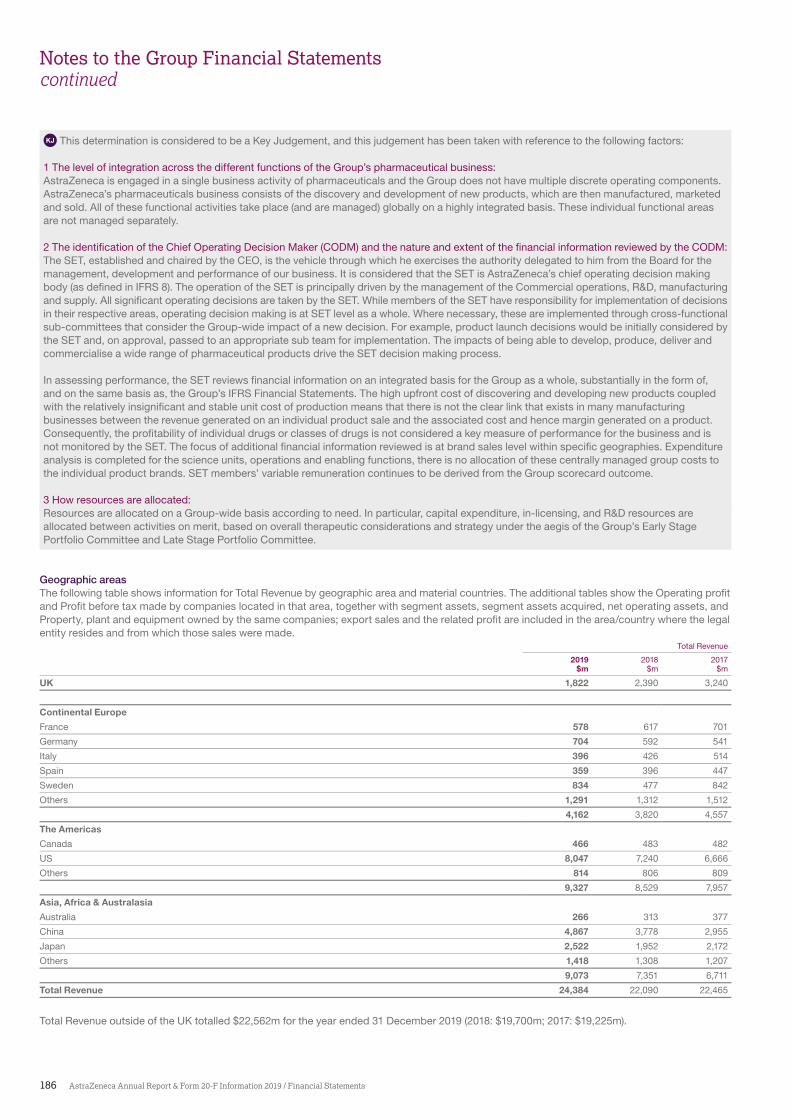
186 AstraZeneca Annual Report & Form 20-F Information 2019 / Financial Statements
Notes to the Group Financial Statementscontinued
KJ This determination is considered to be a Key Judgement, and this judgement has been taken with reference to the following factors:
1 The level of integration across the different functions of the Group’s pharmaceutical business:AstraZeneca is engaged in a single business activity of pharmaceuticals and the Group does not have multiple discrete operating components. AstraZeneca’s pharmaceuticals business consists of the discovery and development of new products, which are then manufactured, marketed and sold. All of these functional activities take place (and are managed) globally on a highly integrated basis. These individual functional areas are not managed separately.
2 The identi�cation of the Chief Operating Decision Maker (CODM) and the nature and extent of the �nancial information reviewed by the CODM:The SET, established and chaired by the CEO, is the vehicle through which he exercises the authority delegated to him from the Board for the management, development and performance of our business. It is considered that the SET is AstraZeneca’s chief operating decision making body (as de�ned in IFRS 8). The operation of the SET is principally driven by the management of the Commercial operations, R&D, manufacturing and supply. All signi�cant operating decisions are taken by the SET. While members of the SET have responsibility for implementation of decisions in their respective areas, operating decision making is at SET level as a whole. Where necessary, these are implemented through cross-functional sub-committees that consider the Group-wide impact of a new decision. For example, product launch decisions would be initially considered by the SET and, on approval, passed to an appropriate sub team for implementation. The impacts of being able to develop, produce, deliver and commercialise a wide range of pharmaceutical products drive the SET decision making process.
In assessing performance, the SET reviews �nancial information on an integrated basis for the Group as a whole, substantially in the form of, and on the same basis as, the Group’s IFRS Financial Statements. The high upfront cost of discovering and developing new products coupled with the relatively insigni�cant and stable unit cost of production means that there is not the clear link that exists in many manufacturing businesses between the revenue generated on an individual product sale and the associated cost and hence margin generated on a product. Consequently, the pro�tability of individual drugs or classes of drugs is not considered a key measure of performance for the business and is not monitored by the SET. The focus of additional �nancial information reviewed is at brand sales level within speci�c geographies. Expenditure analysis is completed for the science units, operations and enabling functions, there is no allocation of these centrally managed group costs to the individual product brands. SET members’ variable remuneration continues to be derived from the Group scorecard outcome.
3 How resources are allocated:Resources are allocated on a Group-wide basis according to need. In particular, capital expenditure, in-licensing, and R&D resources are allocated between activities on merit, based on overall therapeutic considerations and strategy under the aegis of the Group’s Early Stage Portfolio Committee and Late Stage Portfolio Committee.
Geographic areasThe following table shows information for Total Revenue by geographic area and material countries. The additional tables show the Operating pro�t and Pro�t before tax made by companies located in that area, together with segment assets, segment assets acquired, net operating assets, and Property, plant and equipment owned by the same companies; export sales and the related pro�t are included in the area/country where the legal entity resides and from which those sales were made.
Total Revenue
2019 2018 2017$m $m $m
UK 1,822 2,390 3,240
Continental Europe
France 578 617 701
Germany 704 592 541
Italy 396 426 514
Spain 359 396 447
Sweden 834 477 842
Others 1,291 1,312 1,512
4,162 3,820 4,557
The Americas
Canada 466 483 482
US 8,047 7,240 6,666
Others 814 806 809
9,327 8,529 7,957
Asia, Africa & Australasia
Australia 266 313 377
China 4,867 3,778 2,955
Japan 2,522 1,952 2,172
Others 1,418 1,308 1,207
9,073 7,351 6,711
Total Revenue 24,384 22,090 22,465
Total Revenue outside of the UK totalled $22,562m for the year ended 31 December 2019 (2018: $19,700m; 2017: $19,225m).
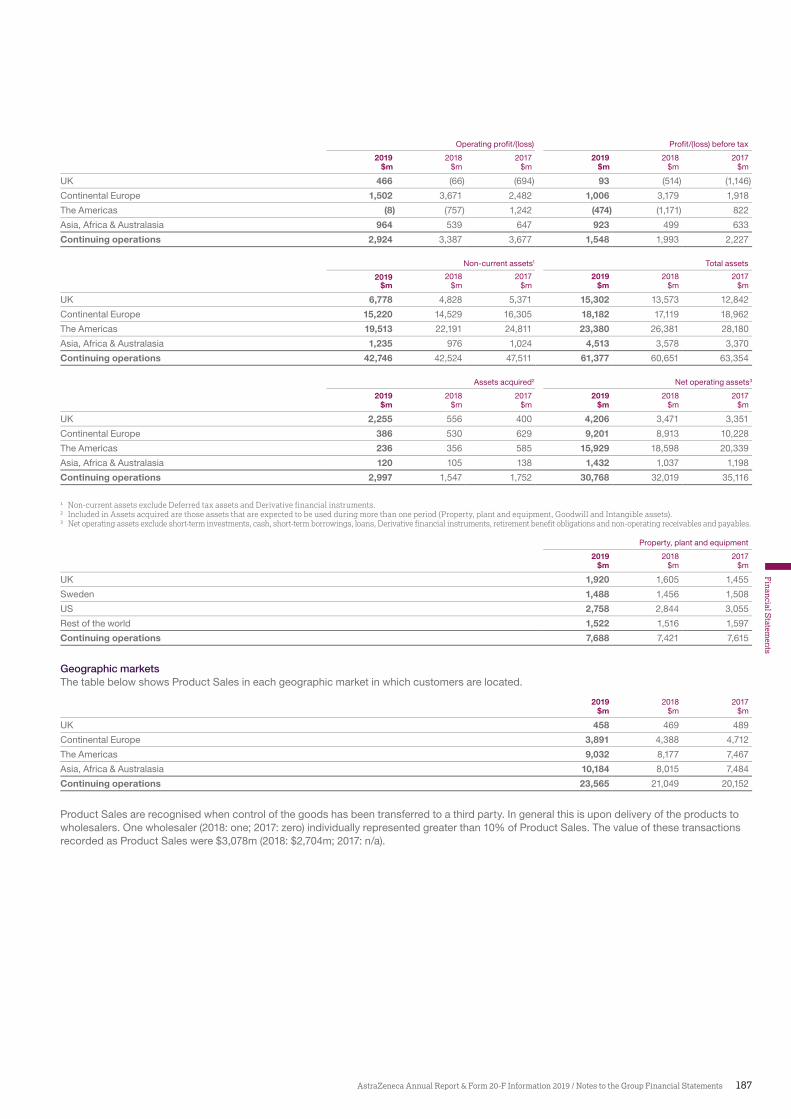
187AstraZeneca Annual Report & Form 20-F Information 2019 / Notes to the Group Financial Statements
Financial S
tatements
Operating profit/(loss) Profit/(loss) before tax
2019 2018 2017 2019 2018 2017$m $m $m $m $m $m
UK 466 (66) (694) 93 (514) (1,146)
Continental Europe 1,502 3,671 2,482 1,006 3,179 1,918
The Americas (8) (757) 1,242 (474) (1,171) 822
Asia, Africa & Australasia 964 539 647 923 499 633
Continuing operations 2,924 3,387 3,677 1,548 1,993 2,227
Non-current assets1 Total assets
2019 2018 2017 2019 2018 2017$m $m $m $m $m $m
UK 6,778 4,828 5,371 15,302 13,573 12,842
Continental Europe 15,220 14,529 16,305 18,182 17,119 18,962
The Americas 19,513 22,191 24,811 23,380 26,381 28,180
Asia, Africa & Australasia 1,235 976 1,024 4,513 3,578 3,370
Continuing operations 42,746 42,524 47,511 61,377 60,651 63,354
Assets acquired2 Net operating assets3
2019 2018 2017 2019 2018 2017$m $m $m $m $m $m
UK 2,255 556 400 4,206 3,471 3,351
Continental Europe 386 530 629 9,201 8,913 10,228
The Americas 236 356 585 15,929 18,598 20,339
Asia, Africa & Australasia 120 105 138 1,432 1,037 1,198
Continuing operations 2,997 1,547 1,752 30,768 32,019 35,116
1 Non-current assets exclude Deferred tax assets and Derivative financial instruments.2 Included in Assets acquired are those assets that are expected to be used during more than one period (Property, plant and equipment, Goodwill and Intangible assets).3 Net operating assets exclude short-term investments, cash, short-term borrowings, loans, Derivative financial instruments, retirement benefit obligations and non-operating receivables and payables.
Property, plant and equipment
2019 2018 2017$m $m $m
UK 1,920 1,605 1,455
Sweden 1,488 1,456 1,508
US 2,758 2,844 3,055
Rest of the world 1,522 1,516 1,597
Continuing operations 7,688 7,421 7,615
Geographic marketsThe table below shows Product Sales in each geographic market in which customers are located.
2019 2018 2017$m $m $m
UK 458 469 489
Continental Europe 3,891 4,388 4,712
The Americas 9,032 8,177 7,467
Asia, Africa & Australasia 10,184 8,015 7,484
Continuing operations 23,565 21,049 20,152
Product Sales are recognised when control of the goods has been transferred to a third party. In general this is upon delivery of the products to wholesalers. One wholesaler (2018: one; 2017: zero) individually represented greater than 10% of Product Sales. The value of these transactions recorded as Product Sales were $3,078m (2018: $2,704m; 2017: n/a).
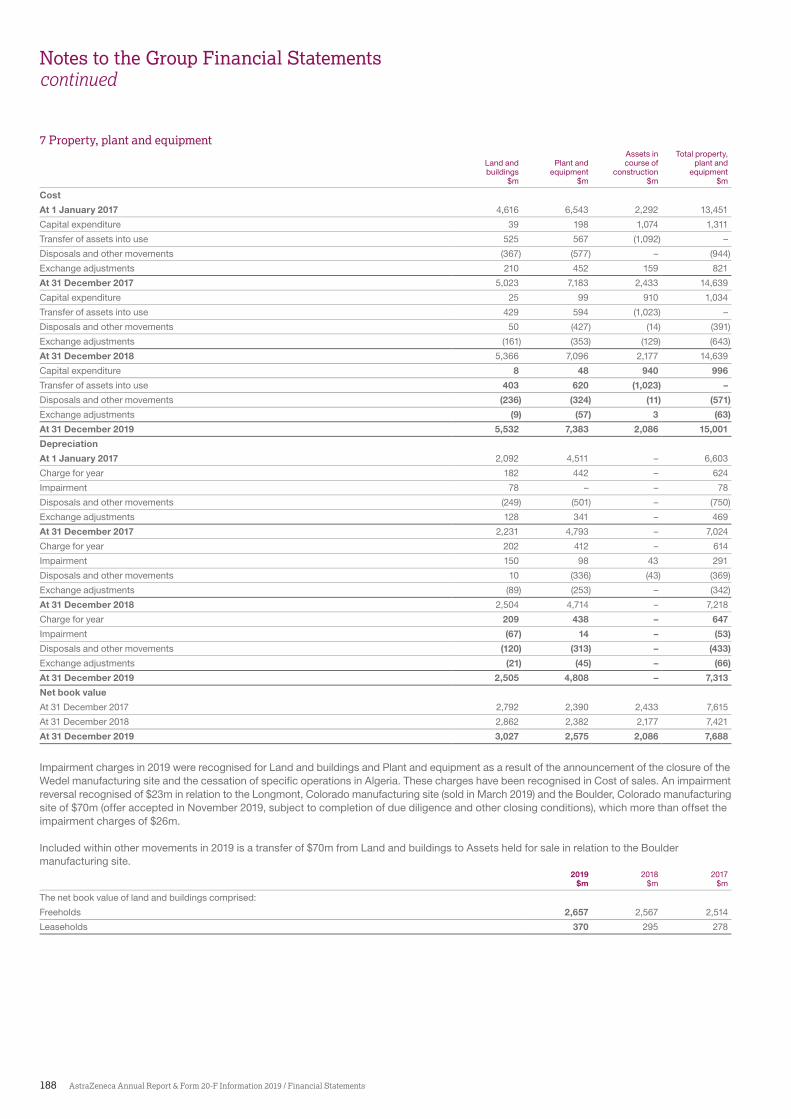
188 AstraZeneca Annual Report & Form 20-F Information 2019 / Financial Statements
Notes to the Group Financial Statementscontinued
7 Property, plant and equipmentAssets in Total property,
Land and Plant and course of plant andbuildings equipment construction equipment
$m $m $m $m
Cost
At 1 January 2017 4,616 6,543 2,292 13,451
Capital expenditure 39 198 1,074 1,311
Transfer of assets into use 525 567 (1,092) –
Disposals and other movements (367) (577) – (944)
Exchange adjustments 210 452 159 821
At 31 December 2017 5,023 7,183 2,433 14,639
Capital expenditure 25 99 910 1,034
Transfer of assets into use 429 594 (1,023) –
Disposals and other movements 50 (427) (14) (391)
Exchange adjustments (161) (353) (129) (643)
At 31 December 2018 5,366 7,096 2,177 14,639
Capital expenditure 8 48 940 996
Transfer of assets into use 403 620 (1,023) –
Disposals and other movements (236) (324) (11) (571)
Exchange adjustments (9) (57) 3 (63)
At 31 December 2019 5,532 7,383 2,086 15,001
Depreciation
At 1 January 2017 2,092 4,511 – 6,603
Charge for year 182 442 – 624
Impairment 78 – – 78
Disposals and other movements (249) (501) – (750)
Exchange adjustments 128 341 – 469
At 31 December 2017 2,231 4,793 – 7,024
Charge for year 202 412 – 614
Impairment 150 98 43 291
Disposals and other movements 10 (336) (43) (369)
Exchange adjustments (89) (253) – (342)
At 31 December 2018 2,504 4,714 – 7,218
Charge for year 209 438 – 647
Impairment (67) 14 – (53)
Disposals and other movements (120) (313) – (433)
Exchange adjustments (21) (45) – (66)
At 31 December 2019 2,505 4,808 – 7,313
Net book value
At 31 December 2017 2,792 2,390 2,433 7,615
At 31 December 2018 2,862 2,382 2,177 7,421
At 31 December 2019 3,027 2,575 2,086 7,688
Impairment charges in 2019 were recognised for Land and buildings and Plant and equipment as a result of the announcement of the closure of the Wedel manufacturing site and the cessation of speci�c operations in Algeria. These charges have been recognised in Cost of sales. An impairment reversal recognised of $23m in relation to the Longmont, Colorado manufacturing site (sold in March 2019) and the Boulder, Colorado manufacturing site of $70m (offer accepted in November 2019, subject to completion of due diligence and other closing conditions), which more than offset the impairment charges of $26m.
Included within other movements in 2019 is a transfer of $70m from Land and buildings to Assets held for sale in relation to the Boulder manufacturing site.
2019 2018 2017$m $m $m
The net book value of land and buildings comprised:
Freeholds 2,657 2,567 2,514
Leaseholds 370 295 278
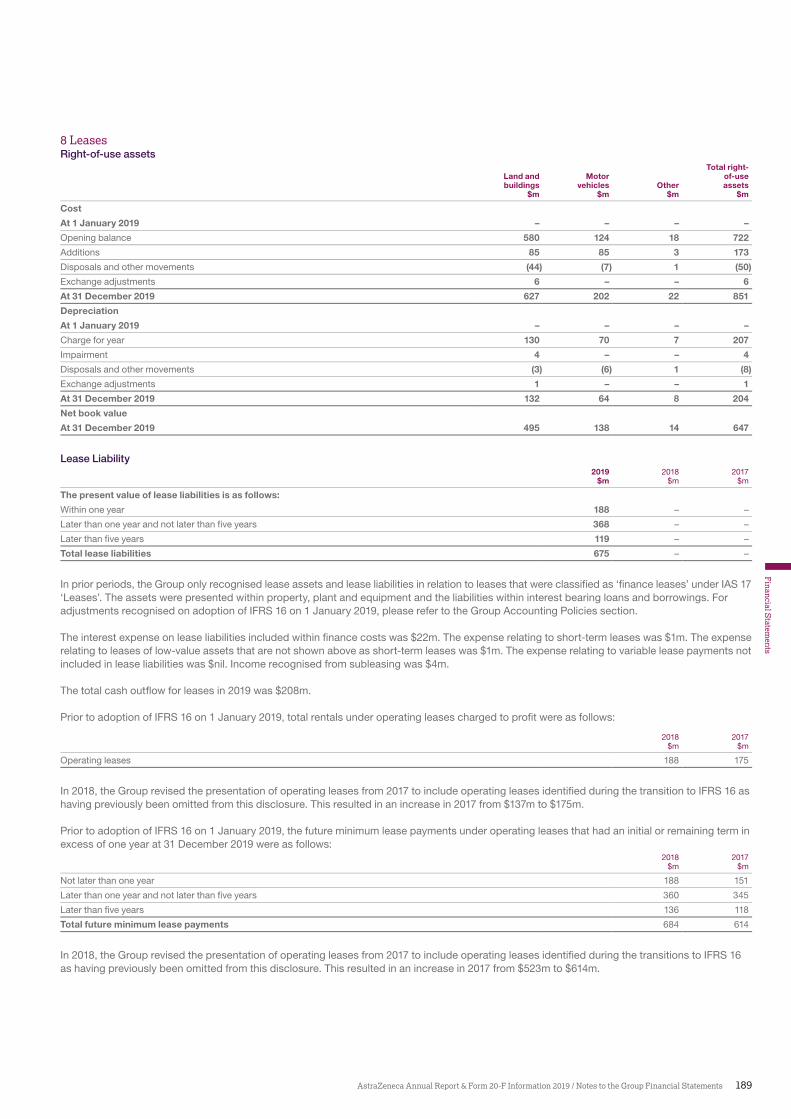
189AstraZeneca Annual Report & Form 20-F Information 2019 / Notes to the Group Financial Statements
Financial S
tatements
8 LeasesRight-of-use assets
Total right-Land and Motor of-usebuildings vehicles Other assets
$m $m $m $m
Cost
At 1 January 2019 – – – –
Opening balance 580 124 18 722
Additions 85 85 3 173
Disposals and other movements (44) (7) 1 (50)
Exchange adjustments 6 – – 6
At 31 December 2019 627 202 22 851
Depreciation
At 1 January 2019 – – – –
Charge for year 130 70 7 207
Impairment 4 – – 4
Disposals and other movements (3) (6) 1 (8)
Exchange adjustments 1 – – 1
At 31 December 2019 132 64 8 204
Net book value
At 31 December 2019 495 138 14 647
Lease Liability2019 2018 2017
$m $m $m
The present value of lease liabilities is as follows:
Within one year 188 – –
Later than one year and not later than five years 368 – –
Later than five years 119 – –
Total lease liabilities 675 – –
In prior periods, the Group only recognised lease assets and lease liabilities in relation to leases that were classi�ed as ‘�nance leases’ under IAS 17 ‘Leases’. The assets were presented within property, plant and equipment and the liabilities within interest bearing loans and borrowings. For adjustments recognised on adoption of IFRS 16 on 1 January 2019, please refer to the Group Accounting Policies section.
The interest expense on lease liabilities included within �nance costs was $22m. The expense relating to short-term leases was $1m. The expense relating to leases of low-value assets that are not shown above as short-term leases was $1m. The expense relating to variable lease payments not included in lease liabilities was $nil. Income recognised from subleasing was $4m.
The total cash out�ow for leases in 2019 was $208m.
Prior to adoption of IFRS 16 on 1 January 2019, total rentals under operating leases charged to pro�t were as follows:
2018 2017$m $m
Operating leases 188 175
In 2018, the Group revised the presentation of operating leases from 2017 to include operating leases identi�ed during the transition to IFRS 16 as having previously been omitted from this disclosure. This resulted in an increase in 2017 from $137m to $175m.
Prior to adoption of IFRS 16 on 1 January 2019, the future minimum lease payments under operating leases that had an initial or remaining term in excess of one year at 31 December 2019 were as follows:
2018 2017$m $m
Not later than one year 188 151
Later than one year and not later than five years 360 345
Later than five years 136 118
Total future minimum lease payments 684 614
In 2018, the Group revised the presentation of operating leases from 2017 to include operating leases identi�ed during the transitions to IFRS 16 as having previously been omitted from this disclosure. This resulted in an increase in 2017 from $523m to $614m.
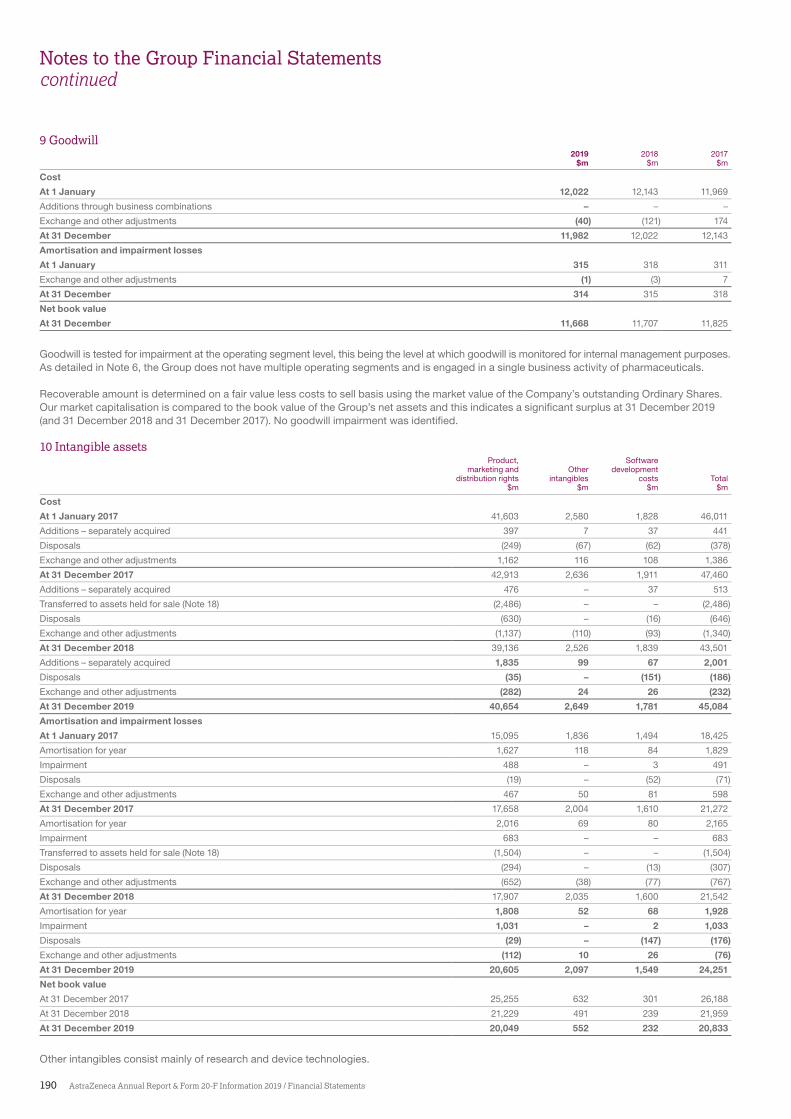
190 AstraZeneca Annual Report & Form 20-F Information 2019 / Financial Statements
Notes to the Group Financial Statementscontinued
9 Goodwill2019 2018 2017
$m $m $m
Cost
At 1 January 12,022 12,143 11,969
Additions through business combinations – – –
Exchange and other adjustments (40) (121) 174
At 31 December 11,982 12,022 12,143
Amortisation and impairment losses
At 1 January 315 318 311
Exchange and other adjustments (1) (3) 7
At 31 December 314 315 318
Net book value
At 31 December 11,668 11,707 11,825
Goodwill is tested for impairment at the operating segment level, this being the level at which goodwill is monitored for internal management purposes. As detailed in Note 6, the Group does not have multiple operating segments and is engaged in a single business activity of pharmaceuticals.
Recoverable amount is determined on a fair value less costs to sell basis using the market value of the Company’s outstanding Ordinary Shares. Our market capitalisation is compared to the book value of the Group’s net assets and this indicates a signi�cant surplus at 31 December 2019 (and 31 December 2018 and 31 December 2017). No goodwill impairment was identi�ed.
10 Intangible assetsProduct, Software
marketing and Other developmentdistribution rights intangibles costs Total
$m $m $m $m
Cost
At 1 January 2017 41,603 2,580 1,828 46,011
Additions – separately acquired 397 7 37 441
Disposals (249) (67) (62) (378)
Exchange and other adjustments 1,162 116 108 1,386
At 31 December 2017 42,913 2,636 1,911 47,460
Additions – separately acquired 476 – 37 513
Transferred to assets held for sale (Note 18) (2,486) – – (2,486)
Disposals (630) – (16) (646)
Exchange and other adjustments (1,137) (110) (93) (1,340)
At 31 December 2018 39,136 2,526 1,839 43,501
Additions – separately acquired 1,835 99 67 2,001
Disposals (35) – (151) (186)
Exchange and other adjustments (282) 24 26 (232)
At 31 December 2019 40,654 2,649 1,781 45,084
Amortisation and impairment losses
At 1 January 2017 15,095 1,836 1,494 18,425
Amortisation for year 1,627 118 84 1,829
Impairment 488 – 3 491
Disposals (19) – (52) (71)
Exchange and other adjustments 467 50 81 598
At 31 December 2017 17,658 2,004 1,610 21,272
Amortisation for year 2,016 69 80 2,165
Impairment 683 – – 683
Transferred to assets held for sale (Note 18) (1,504) – – (1,504)
Disposals (294) – (13) (307)
Exchange and other adjustments (652) (38) (77) (767)
At 31 December 2018 17,907 2,035 1,600 21,542
Amortisation for year 1,808 52 68 1,928
Impairment 1,031 – 2 1,033
Disposals (29) – (147) (176)
Exchange and other adjustments (112) 10 26 (76)
At 31 December 2019 20,605 2,097 1,549 24,251
Net book value
At 31 December 2017 25,255 632 301 26,188
At 31 December 2018 21,229 491 239 21,959
At 31 December 2019 20,049 552 232 20,833
Other intangibles consist mainly of research and device technologies.
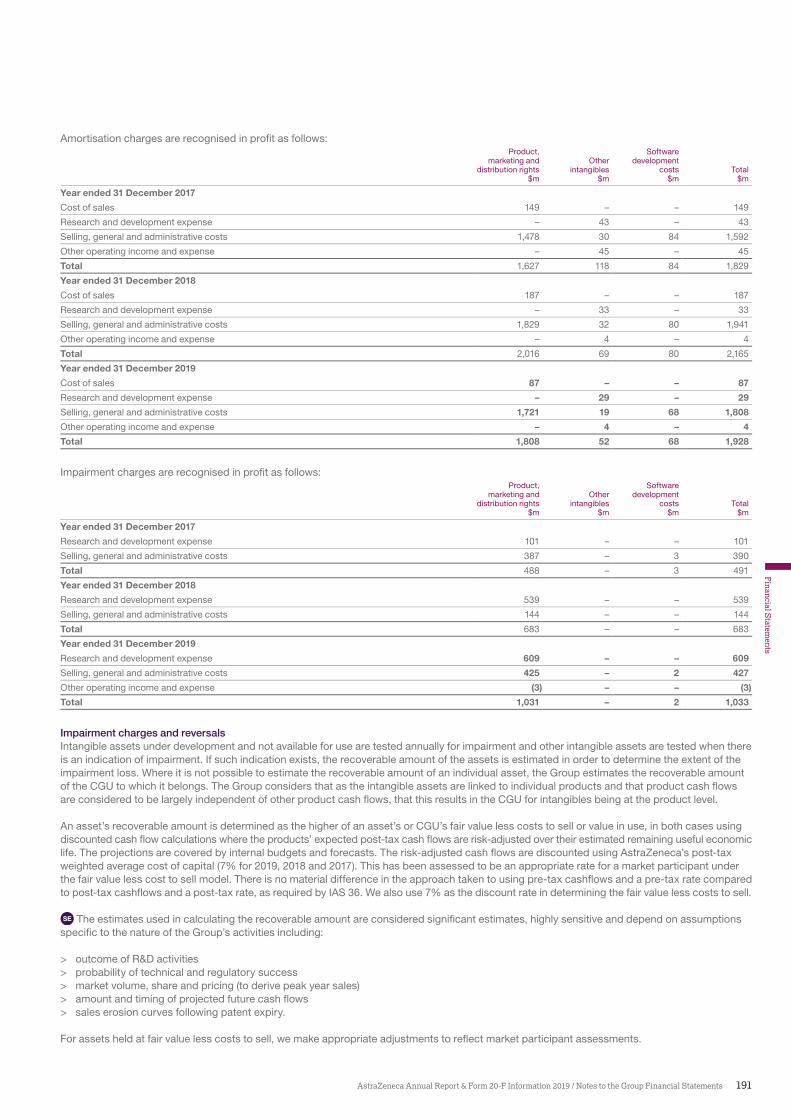
191AstraZeneca Annual Report & Form 20-F Information 2019 / Notes to the Group Financial Statements
Financial S
tatements
Amortisation charges are recognised in pro�t as follows:Product, Software
marketing and Other developmentdistribution rights intangibles costs Total
$m $m $m $m
Year ended 31 December 2017
Cost of sales 149 – – 149
Research and development expense – 43 – 43
Selling, general and administrative costs 1,478 30 84 1,592
Other operating income and expense – 45 – 45
Total 1,627 118 84 1,829
Year ended 31 December 2018
Cost of sales 187 – – 187
Research and development expense – 33 – 33
Selling, general and administrative costs 1,829 32 80 1,941
Other operating income and expense – 4 – 4
Total 2,016 69 80 2,165
Year ended 31 December 2019
Cost of sales 87 – – 87
Research and development expense – 29 – 29
Selling, general and administrative costs 1,721 19 68 1,808
Other operating income and expense – 4 – 4
Total 1,808 52 68 1,928
Impairment charges are recognised in pro�t as follows:Product, Software
marketing and Other developmentdistribution rights intangibles costs Total
$m $m $m $m
Year ended 31 December 2017
Research and development expense 101 – – 101
Selling, general and administrative costs 387 – 3 390
Total 488 – 3 491
Year ended 31 December 2018
Research and development expense 539 – – 539
Selling, general and administrative costs 144 – – 144
Total 683 – – 683
Year ended 31 December 2019
Research and development expense 609 – – 609
Selling, general and administrative costs 425 – 2 427
Other operating income and expense (3) – – (3)
Total 1,031 – 2 1,033
Impairment charges and reversalsIntangible assets under development and not available for use are tested annually for impairment and other intangible assets are tested when there is an indication of impairment. If such indication exists, the recoverable amount of the assets is estimated in order to determine the extent of the impairment loss. Where it is not possible to estimate the recoverable amount of an individual asset, the Group estimates the recoverable amount of the CGU to which it belongs. The Group considers that as the intangible assets are linked to individual products and that product cash �ows are considered to be largely independent of other product cash �ows, that this results in the CGU for intangibles being at the product level.
An asset’s recoverable amount is determined as the higher of an asset’s or CGU’s fair value less costs to sell or value in use, in both cases using discounted cash �ow calculations where the products’ expected post-tax cash �ows are risk-adjusted over their estimated remaining useful economic life. The projections are covered by internal budgets and forecasts. The risk-adjusted cash �ows are discounted using AstraZeneca’s post-tax weighted average cost of capital (7% for 2019, 2018 and 2017). This has been assessed to be an appropriate rate for a market participant under the fair value less cost to sell model. There is no material difference in the approach taken to using pre-tax cash�ows and a pre-tax rate compared to post-tax cash�ows and a post-tax rate, as required by IAS 36. We also use 7% as the discount rate in determining the fair value less costs to sell.
SE The estimates used in calculating the recoverable amount are considered signi�cant estimates, highly sensitive and depend on assumptions speci�c to the nature of the Group’s activities including:
> outcome of R&D activities> probability of technical and regulatory success> market volume, share and pricing (to derive peak year sales)> amount and timing of projected future cash �ows> sales erosion curves following patent expiry.
For assets held at fair value less costs to sell, we make appropriate adjustments to re�ect market participant assessments.
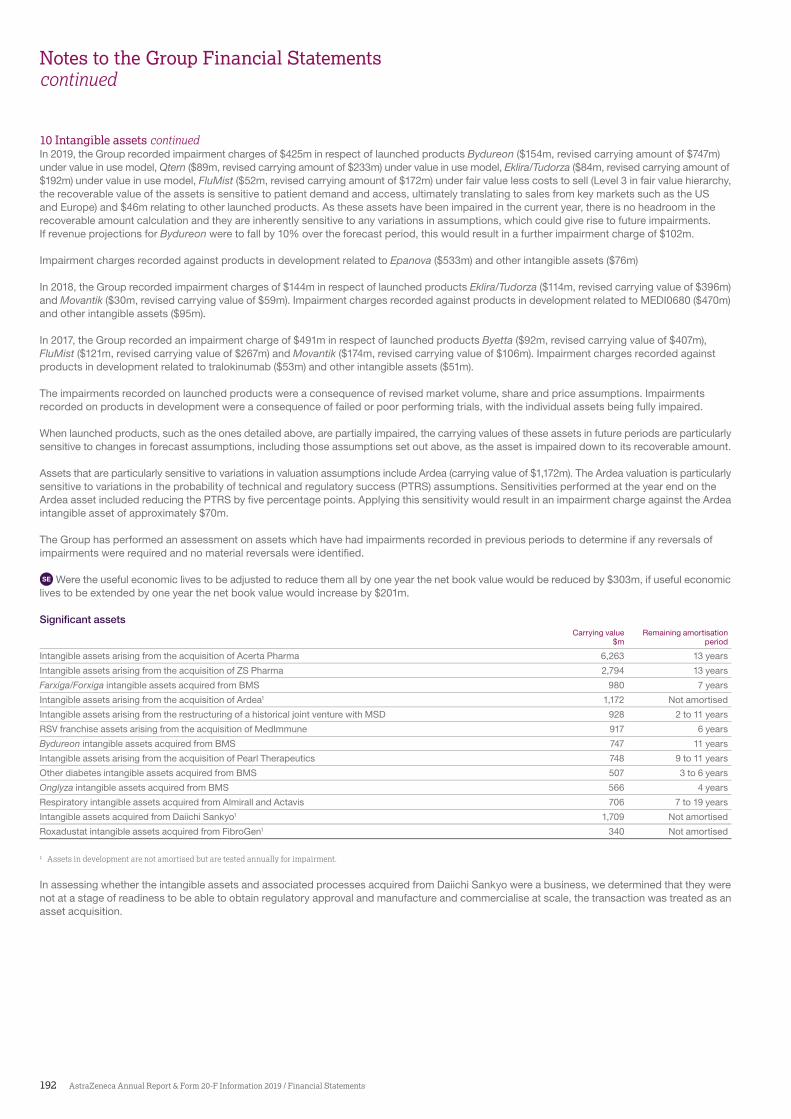
192 AstraZeneca Annual Report & Form 20-F Information 2019 / Financial Statements
Notes to the Group Financial Statementscontinued
In 2019, the Group recorded impairment charges of $425m in respect of launched products Bydureon ($154m, revised carrying amount of $747m) under value in use model, Qtern ($89m, revised carrying amount of $233m) under value in use model, Eklira/Tudorza ($84m, revised carrying amount of $192m) under value in use model, FluMist ($52m, revised carrying amount of $172m) under fair value less costs to sell (Level 3 in fair value hierarchy, the recoverable value of the assets is sensitive to patient demand and access, ultimately translating to sales from key markets such as the US and Europe) and $46m relating to other launched products. As these assets have been impaired in the current year, there is no headroom in the recoverable amount calculation and they are inherently sensitive to any variations in assumptions, which could give rise to future impairments. If revenue projections for Bydureon were to fall by 10% over the forecast period, this would result in a further impairment charge of $102m.
Impairment charges recorded against products in development related to Epanova ($533m) and other intangible assets ($76m)
In 2018, the Group recorded impairment charges of $144m in respect of launched products Eklira/Tudorza ($114m, revised carrying value of $396m) and Movantik ($30m, revised carrying value of $59m). Impairment charges recorded against products in development related to MEDI0680 ($470m) and other intangible assets ($95m).
In 2017, the Group recorded an impairment charge of $491m in respect of launched products Byetta ($92m, revised carrying value of $407m), FluMist ($121m, revised carrying value of $267m) and Movantik ($174m, revised carrying value of $106m). Impairment charges recorded against products in development related to tralokinumab ($53m) and other intangible assets ($51m).
The impairments recorded on launched products were a consequence of revised market volume, share and price assumptions. Impairments recorded on products in development were a consequence of failed or poor performing trials, with the individual assets being fully impaired.
When launched products, such as the ones detailed above, are partially impaired, the carrying values of these assets in future periods are particularly sensitive to changes in forecast assumptions, including those assumptions set out above, as the asset is impaired down to its recoverable amount.
Assets that are particularly sensitive to variations in valuation assumptions include Ardea (carrying value of $1,172m). The Ardea valuation is particularly sensitive to variations in the probability of technical and regulatory success (PTRS) assumptions. Sensitivities performed at the year end on the Ardea asset included reducing the PTRS by �ve percentage points. Applying this sensitivity would result in an impairment charge against the Ardea intangible asset of approximately $70m.
The Group has performed an assessment on assets which have had impairments recorded in previous periods to determine if any reversals of impairments were required and no material reversals were identi�ed.
SE Were the useful economic lives to be adjusted to reduce them all by one year the net book value would be reduced by $303m, if useful economic lives to be extended by one year the net book value would increase by $201m.
Significant assetsCarrying value Remaining amortisation
$m period
Intangible assets arising from the acquisition of Acerta Pharma 6,263 13 years
Intangible assets arising from the acquisition of ZS Pharma 2,794 13 years
Farxiga/Forxiga intangible assets acquired from BMS 980 7 years
Intangible assets arising from the acquisition of Ardea1 1,172 Not amortised
Intangible assets arising from the restructuring of a historical joint venture with MSD 928 2 to 11 years
RSV franchise assets arising from the acquisition of MedImmune 917 6 years
Bydureon intangible assets acquired from BMS 747 11 years
Intangible assets arising from the acquisition of Pearl Therapeutics 748 9 to 11 years
Other diabetes intangible assets acquired from BMS 507 3 to 6 years
Onglyza intangible assets acquired from BMS 566 4 years
Respiratory intangible assets acquired from Almirall and Actavis 706 7 to 19 years
Intangible assets acquired from Daiichi Sankyo1 1,709 Not amortised
Roxadustat intangible assets acquired from FibroGen1 340 Not amortised
1 Assets in development are not amortised but are tested annually for impairment.
In assessing whether the intangible assets and associated processes acquired from Daiichi Sankyo were a business, we determined that they were not at a stage of readiness to be able to obtain regulatory approval and manufacture and commercialise at scale, the transaction was treated as an asset acquisition.
10 Intangible assets continued
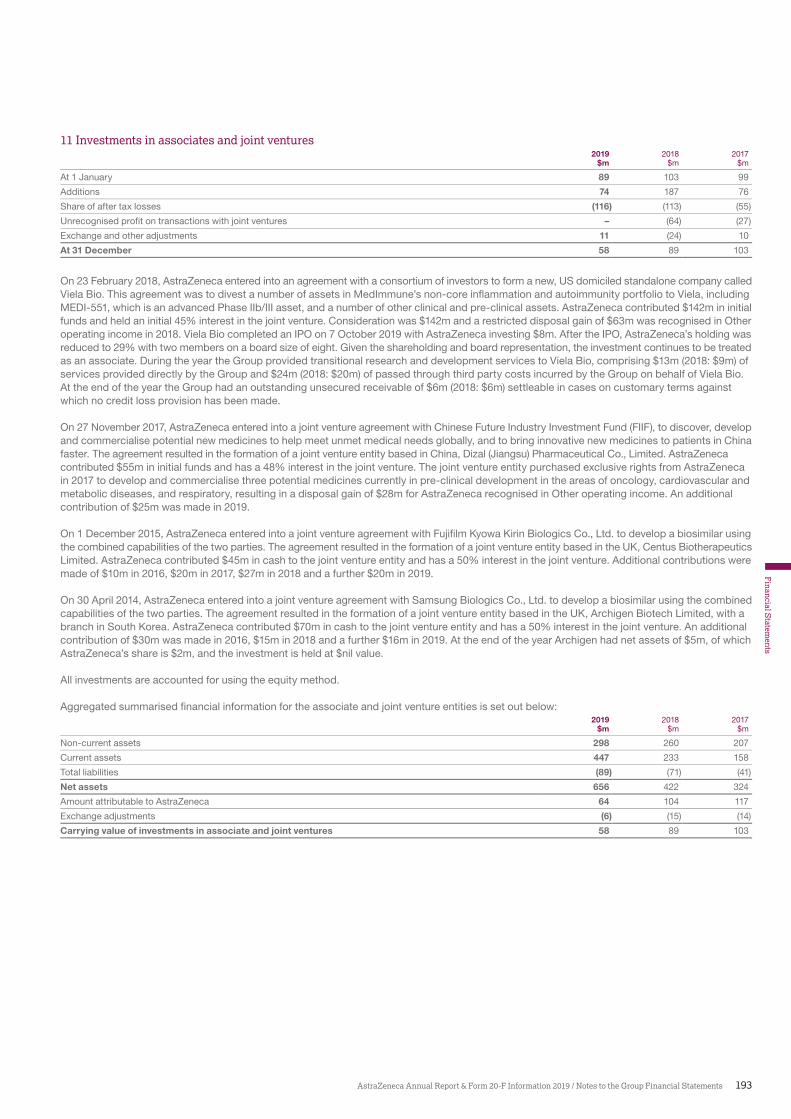
193AstraZeneca Annual Report & Form 20-F Information 2019 / Notes to the Group Financial Statements
Financial S
tatements
11 Investments in associates and joint ventures2019 2018 2017
$m $m $m
At 1 January 89 103 99
Additions 74 187 76
Share of after tax losses (116) (113) (55)
Unrecognised profit on transactions with joint ventures – (64) (27)
Exchange and other adjustments 11 (24) 10
At 31 December 58 89 103
On 23 February 2018, AstraZeneca entered into an agreement with a consortium of investors to form a new, US domiciled standalone company called Viela Bio. This agreement was to divest a number of assets in MedImmune’s non-core in�ammation and autoimmunity portfolio to Viela, including MEDI-551, which is an advanced Phase IIb/III asset, and a number of other clinical and pre-clinical assets. AstraZeneca contributed $142m in initial funds and held an initial 45% interest in the joint venture. Consideration was $142m and a restricted disposal gain of $63m was recognised in Other operating income in 2018. Viela Bio completed an IPO on 7 October 2019 with AstraZeneca investing $8m. After the IPO, AstraZeneca’s holding was reduced to 29% with two members on a board size of eight. Given the shareholding and board representation, the investment continues to be treated as an associate. During the year the Group provided transitional research and development services to Viela Bio, comprising $13m (2018: $9m) of services provided directly by the Group and $24m (2018: $20m) of passed through third party costs incurred by the Group on behalf of Viela Bio. At the end of the year the Group had an outstanding unsecured receivable of $6m (2018: $6m) settleable in cases on customary terms against which no credit loss provision has been made.
On 27 November 2017, AstraZeneca entered into a joint venture agreement with Chinese Future Industry Investment Fund (FIIF), to discover, develop and commercialise potential new medicines to help meet unmet medical needs globally, and to bring innovative new medicines to patients in China faster. The agreement resulted in the formation of a joint venture entity based in China, Dizal (Jiangsu) Pharmaceutical Co., Limited. AstraZeneca contributed $55m in initial funds and has a 48% interest in the joint venture. The joint venture entity purchased exclusive rights from AstraZeneca in 2017 to develop and commercialise three potential medicines currently in pre-clinical development in the areas of oncology, cardiovascular and metabolic diseases, and respiratory, resulting in a disposal gain of $28m for AstraZeneca recognised in Other operating income. An additional contribution of $25m was made in 2019.
On 1 December 2015, AstraZeneca entered into a joint venture agreement with Fuji�lm Kyowa Kirin Biologics Co., Ltd. to develop a biosimilar using the combined capabilities of the two parties. The agreement resulted in the formation of a joint venture entity based in the UK, Centus Biotherapeutics Limited. AstraZeneca contributed $45m in cash to the joint venture entity and has a 50% interest in the joint venture. Additional contributions were made of $10m in 2016, $20m in 2017, $27m in 2018 and a further $20m in 2019.
On 30 April 2014, AstraZeneca entered into a joint venture agreement with Samsung Biologics Co., Ltd. to develop a biosimilar using the combined capabilities of the two parties. The agreement resulted in the formation of a joint venture entity based in the UK, Archigen Biotech Limited, with a branch in South Korea. AstraZeneca contributed $70m in cash to the joint venture entity and has a 50% interest in the joint venture. An additional contribution of $30m was made in 2016, $15m in 2018 and a further $16m in 2019. At the end of the year Archigen had net assets of $5m, of which AstraZeneca’s share is $2m, and the investment is held at $nil value.
All investments are accounted for using the equity method.
Aggregated summarised �nancial information for the associate and joint venture entities is set out below:2019 2018 2017
$m $m $m
Non-current assets 298 260 207
Current assets 447 233 158
Total liabilities (89) (71) (41)
Net assets 656 422 324
Amount attributable to AstraZeneca 64 104 117
Exchange adjustments (6) (15) (14)
Carrying value of investments in associate and joint ventures 58 89 103

194 AstraZeneca Annual Report & Form 20-F Information 2019 / Financial Statements
Notes to the Group Financial Statementscontinued
12 Other investments2019 2018 2017
$m $m $m
Non-current investments
Equity securities at fair value through Other comprehensive income 1,339 833 –
Equity securities available for sale – – 933
Fixed income securities at fair value through profit and loss 62 – –
Total 1,401 833 933
Current investments
Fixed income securities at fair value through profit and loss 811 809 –
Fixed income securities available for sale – – 1,150
Fixed deposits 38 40 80
Total 849 849 1,230
Investments classi�ed as available for sale in 2017 under IAS 39 have been reclassi�ed in 2018 on adoption of IFRS 9 on 1 January 2018, as either at fair value through Other comprehensive income or at fair value through pro�t and loss.
Other investments classified as at fair value through Other comprehensive income and at fair value through profit and loss (IFRS 9)Other investments held at fair value through Other comprehensive income include equity securities which are not held for trading and which the Group has irrevocably elected at initial recognition to recognise in this category. Other investments held at fair value through pro�t and loss comprise �xed income securities that the Group holds to sell.
The fair value of listed investments is based on year end quoted market prices. Fixed deposits are held at amortised cost with carrying value being a reasonable approximation of fair value given their short-term nature.
Other investments previously classified as available for sale in 2017 (IAS 39)Impairment charges of $14m in respect of available for sale equity securities were included in Other operating income and expense in 2017. Equity and �xed income securities available for sale were held at fair value until reclassi�cation.
Fair value hierarchyThe table below analyses equity securities and bonds, contained within Other investments and carried at fair value, by valuation method. The different levels have been de�ned as follows:
> Level 1: quoted prices (unadjusted) in active markets for identical assets or liabilities> Level 2: inputs other than quoted prices included within Level 1 that are observable for the asset or liability, either directly (i.e. as prices) or
indirectly (i.e. derived from prices)> Level 3: inputs for the asset or liability that are not based on observable market data (unobservable inputs).
2019 2019 2018 2018 2017FVPL FVOCI FVPL FVOCI AFS
$m $m $m $m $m
Level 1 873 1,112 809 667 1,408
Level 2 – – – – –
Level 3 – 227 – 166 675
Total 873 1,339 809 833 2,083
Equity securities that are analysed at Level 3 include investments in private biotech companies. In the absence of speci�c market data, these unlisted investments are held at fair value calculated by taking costs and adjusting as necessary for impairments and revaluations on new funding rounds, which approximates to fair value. Movements in Level 3 investments are detailed below:
2019 2018 2017FVOCI FVOCI AFS
$m $m $m
At 1 January 166 675 641
Additions 5 79 53
Revaluations 56 (147) (1)
Transfers out 2 (434) (12)
Disposals (5) (6) (15)
Impairments and exchange adjustments 3 (1) 9
At 31 December 227 166 675
Assets are transferred in or out of Level 3 on the date of the event or change in circumstances that caused the transfer.
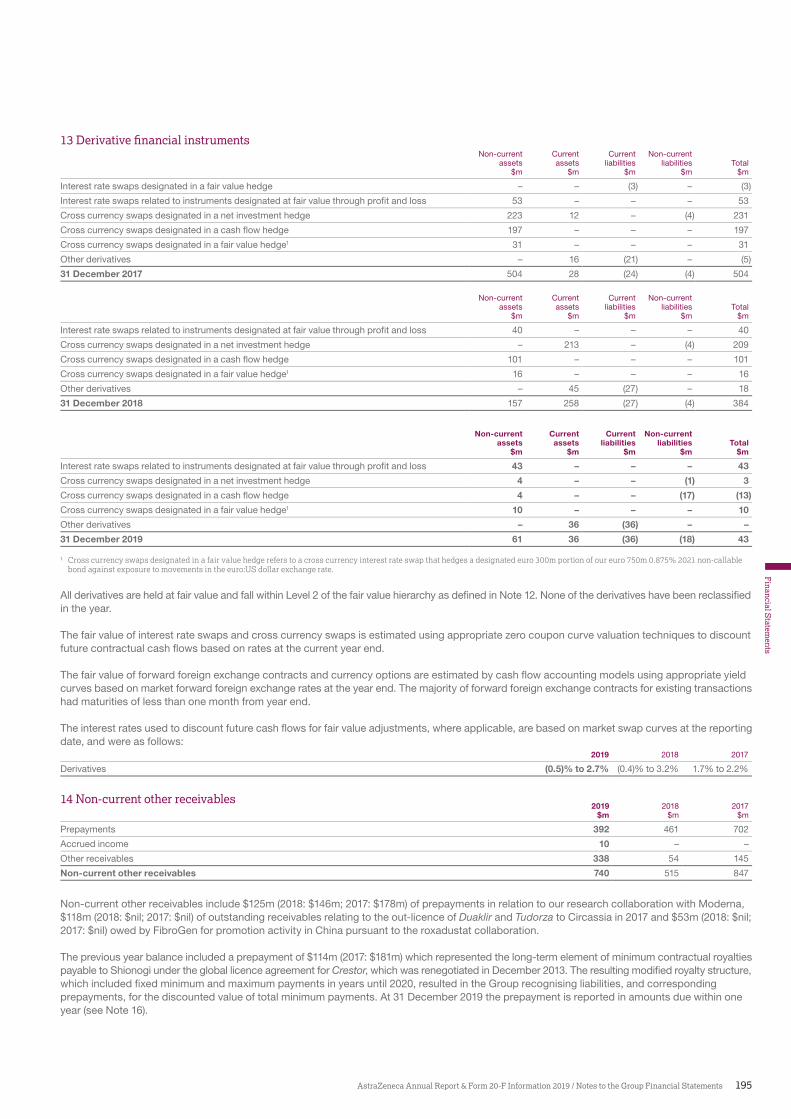
195AstraZeneca Annual Report & Form 20-F Information 2019 / Notes to the Group Financial Statements
Financial S
tatements
erivative financia instru entsNon-current Current Current Non-current
assets assets liabilities liabilities Total$m $m $m $m $m
Interest rate swaps designated in a fair value hedge – – (3) – (3)
Interest rate swaps related to instruments designated at fair value through profit and loss 53 – – – 53
Cross currency swaps designated in a net investment hedge 223 12 – (4) 231
Cross currency swaps designated in a cash flow hedge 197 – – – 197
Cross currency swaps designated in a fair value hedge1 31 – – – 31
Other derivatives – 16 (21) – (5)
31 December 2017 504 28 (24) (4) 504
Non-current Current Current Non-currentassets assets liabilities liabilities Total
$m $m $m $m $m
Interest rate swaps related to instruments designated at fair value through profit and loss 40 – – – 40
Cross currency swaps designated in a net investment hedge – 213 – (4) 209
Cross currency swaps designated in a cash flow hedge 101 – – – 101
Cross currency swaps designated in a fair value hedge1 16 – – – 16
Other derivatives – 45 (27) – 18
31 December 2018 157 258 (27) (4) 384
Non-current Current Current Non-currentassets assets liabilities liabilities Total
$m $m $m $m $m
Interest rate swaps related to instruments designated at fair value through profit and loss 43 – – – 43
Cross currency swaps designated in a net investment hedge 4 – – (1) 3
Cross currency swaps designated in a cash flow hedge 4 – – (17) (13)
Cross currency swaps designated in a fair value hedge1 10 – – – 10
Other derivatives – 36 (36) – –
31 December 2019 61 36 (36) (18) 43
1 Cross currency swaps designated in a fair value hedge refers to a cross currency interest rate swap that hedges a designated euro 300m portion of our euro 750m 0.875% 2021 non-callable bond against exposure to movements in the euro:US dollar exchange rate.
All derivatives are held at fair value and fall within Level 2 of the fair value hierarchy as de�ned in Note 12. None of the derivatives have been reclassi�ed in the year.
The fair value of interest rate swaps and cross currency swaps is estimated using appropriate zero coupon curve valuation techniques to discount future contractual cash �ows based on rates at the current year end.
The fair value of forward foreign exchange contracts and currency options are estimated by cash �ow accounting models using appropriate yield curves based on market forward foreign exchange rates at the year end. The majority of forward foreign exchange contracts for existing transactions had maturities of less than one month from year end.
The interest rates used to discount future cash �ows for fair value adjustments, where applicable, are based on market swap curves at the reporting date, and were as follows:
2019 2018 2017
Derivatives (0.5)% to 2.7% (0.4)% to 3.2% 1.7% to 2.2%
14 Non-current other receivables2019 2018 2017
$m $m $m
Prepayments 392 461 702
Accrued income 10 – –
Other receivables 338 54 145
Non-current other receivables 740 515 847
Non-current other receivables include $125m (2018: $146m; 2017: $178m) of prepayments in relation to our research collaboration with Moderna, $118m (2018: $nil; 2017: $nil) of outstanding receivables relating to the out-licence of Duaklir and Tudorza to Circassia in 2017 and $53m (2018: $nil; 2017: $nil) owed by FibroGen for promotion activity in China pursuant to the roxadustat collaboration.
The previous year balance included a prepayment of $114m (2017: $181m) which represented the long-term element of minimum contractual royalties payable to Shionogi under the global licence agreement for Crestor, which was renegotiated in December 2013. The resulting modi�ed royalty structure, which included �xed minimum and maximum payments in years until 2020, resulted in the Group recognising liabilities, and corresponding prepayments, for the discounted value of total minimum payments. At 31 December 2019 the prepayment is reported in amounts due within one year (see Note 16).
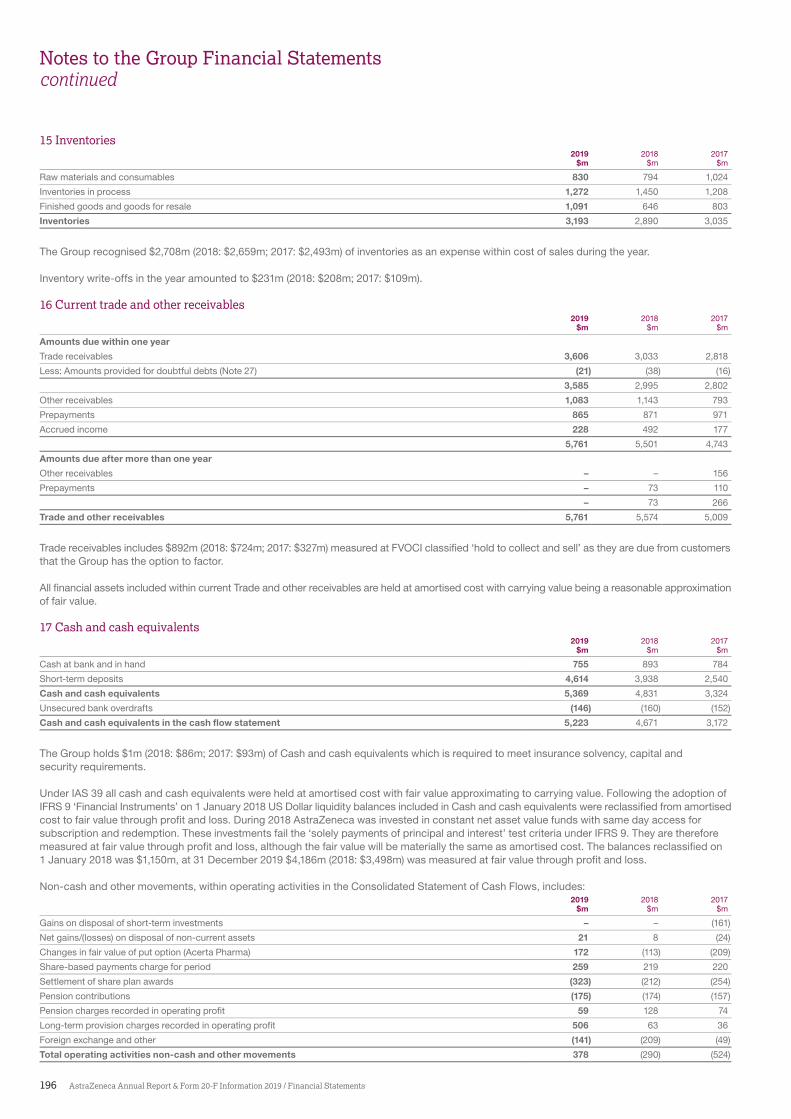
196 AstraZeneca Annual Report & Form 20-F Information 2019 / Financial Statements
Notes to the Group Financial Statementscontinued
15 Inventories2019 2018 2017
$m $m $m
Raw materials and consumables 830 794 1,024
Inventories in process 1,272 1,450 1,208
Finished goods and goods for resale 1,091 646 803
Inventories 3,193 2,890 3,035
The Group recognised $2,708m (2018: $2,659m; 2017: $2,493m) of inventories as an expense within cost of sales during the year.
Inventory write-offs in the year amounted to $231m (2018: $208m; 2017: $109m).
16 Current trade and other receivables2019 2018 2017
$m $m $m
Amounts due within one year
Trade receivables 3,606 3,033 2,818
Less: Amounts provided for doubtful debts (Note 27) (21) (38) (16)
3,585 2,995 2,802
Other receivables 1,083 1,143 793
Prepayments 865 871 971
Accrued income 228 492 177
5,761 5,501 4,743
Amounts due after more than one year
Other receivables – – 156
Prepayments – 73 110
– 73 266
Trade and other receivables 5,761 5,574 5,009
Trade receivables includes $892m (2018: $724m; 2017: $327m) measured at FVOCI classi�ed ‘hold to collect and sell’ as they are due from customers that the Group has the option to factor.
All �nancial assets included within current Trade and other receivables are held at amortised cost with carrying value being a reasonable approximation of fair value.
17 Cash and cash equivalents2019 2018 2017
$m $m $m
Cash at bank and in hand 755 893 784
Short-term deposits 4,614 3,938 2,540
Cash and cash equivalents 5,369 4,831 3,324
Unsecured bank overdrafts (146) (160) (152)
Cash and cash equivalents in the cash flow statement 5,223 4,671 3,172
The Group holds $1m (2018: $86m; 2017: $93m) of Cash and cash equivalents which is required to meet insurance solvency, capital and security requirements.
Under IAS 39 all cash and cash equivalents were held at amortised cost with fair value approximating to carrying value. Following the adoption of IFRS 9 ‘Financial Instruments’ on 1 January 2018 US Dollar liquidity balances included in Cash and cash equivalents were reclassi�ed from amortised cost to fair value through pro�t and loss. During 2018 AstraZeneca was invested in constant net asset value funds with same day access for subscription and redemption. These investments fail the ‘solely payments of principal and interest’ test criteria under IFRS 9. They are therefore measured at fair value through pro�t and loss, although the fair value will be materially the same as amortised cost. The balances reclassi�ed on 1 January 2018 was $1,150m, at 31 December 2019 $4,186m (2018: $3,498m) was measured at fair value through pro�t and loss.
Non-cash and other movements, within operating activities in the Consolidated Statement of Cash Flows, includes:2019 2018 2017
$m $m $m
Gains on disposal of short-term investments – – (161)
Net gains/(losses) on disposal of non-current assets 21 8 (24)
Changes in fair value of put option (Acerta Pharma) 172 (113) (209)
Share-based payments charge for period 259 219 220
Settlement of share plan awards (323) (212) (254)
Pension contributions (175) (174) (157)
Pension charges recorded in operating profit 59 128 74
Long-term provision charges recorded in operating profit 506 63 36
Foreign exchange and other (141) (209) (49)
Total operating activities non-cash and other movements 378 (290) (524)
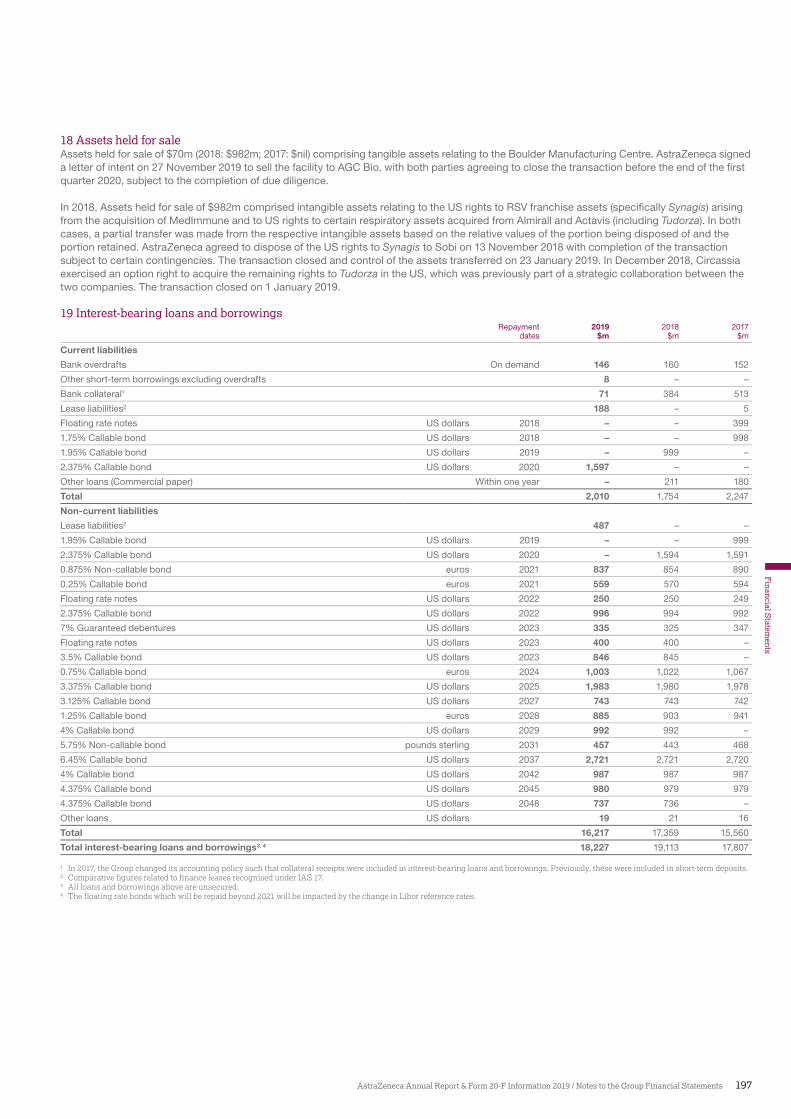
197AstraZeneca Annual Report & Form 20-F Information 2019 / Notes to the Group Financial Statements
Financial S
tatements
18 Assets held for saleAssets held for sale of $70m (2018: $982m; 2017: $nil) comprising tangible assets relating to the Boulder Manufacturing Centre. AstraZeneca signed a letter of intent on 27 November 2019 to sell the facility to AGC Bio, with both parties agreeing to close the transaction before the end of the �rst quarter 2020, subject to the completion of due diligence.
In 2018, Assets held for sale of $982m comprised intangible assets relating to the US rights to RSV franchise assets (speci�cally Synagis) arising from the acquisition of MedImmune and to US rights to certain respiratory assets acquired from Almirall and Actavis (including Tudorza). In both cases, a partial transfer was made from the respective intangible assets based on the relative values of the portion being disposed of and the portion retained. AstraZeneca agreed to dispose of the US rights to Synagis to Sobi on 13 November 2018 with completion of the transaction subject to certain contingencies. The transaction closed and control of the assets transferred on 23 January 2019. In December 2018, Circassia exercised an option right to acquire the remaining rights to Tudorza in the US, which was previously part of a strategic collaboration between the two companies. The transaction closed on 1 January 2019.
19 Interest-bearing loans and borrowings Repayment 2019 2018 2017
dates $m $m $m
Current liabilities
Bank overdrafts On demand 146 160 152
Other short-term borrowings excluding overdrafts 8 – –
Bank collateral1 71 384 513
Lease liabilities2 188 – 5
Floating rate notes US dollars 2018 – – 399
1.75% Callable bond US dollars 2018 – – 998
1.95% Callable bond US dollars 2019 – 999 –
2.375% Callable bond US dollars 2020 1,597 – –
Other loans (Commercial paper) Within one year – 211 180
Total 2,010 1,754 2,247
Non-current liabilities
Lease liabilities2 487 – –
1.95% Callable bond US dollars 2019 – – 999
2.375% Callable bond US dollars 2020 – 1,594 1,591
0.875% Non-callable bond euros 2021 837 854 890
0.25% Callable bond euros 2021 559 570 594
Floating rate notes US dollars 2022 250 250 249
2.375% Callable bond US dollars 2022 996 994 992
7% Guaranteed debentures US dollars 2023 335 325 347
Floating rate notes US dollars 2023 400 400 –
3.5% Callable bond US dollars 2023 846 845 –
0.75% Callable bond euros 2024 1,003 1,022 1,067
3.375% Callable bond US dollars 2025 1,983 1,980 1,978
3.125% Callable bond US dollars 2027 743 743 742
1.25% Callable bond euros 2028 885 903 941
4% Callable bond US dollars 2029 992 992 –
5.75% Non-callable bond pounds sterling 2031 457 443 468
6.45% Callable bond US dollars 2037 2,721 2,721 2,720
4% Callable bond US dollars 2042 987 987 987
4.375% Callable bond US dollars 2045 980 979 979
4.375% Callable bond US dollars 2048 737 736 –
Other loans US dollars 19 21 16
Total 16,217 17,359 15,560
Total interest-bearing loans and borrowings3, 4 18,227 19,113 17,807
1 In 2017, the Group changed its accounting policy such that collateral receipts were included in interest-bearing loans and borrowings. Previously, these were included in short-term deposits.2 Comparative figures related to finance leases recognised under IAS 17.3 All loans and borrowings above are unsecured.4 The floating rate bonds which will be repaid beyond 2021 will be impacted by the change in Libor reference rates.
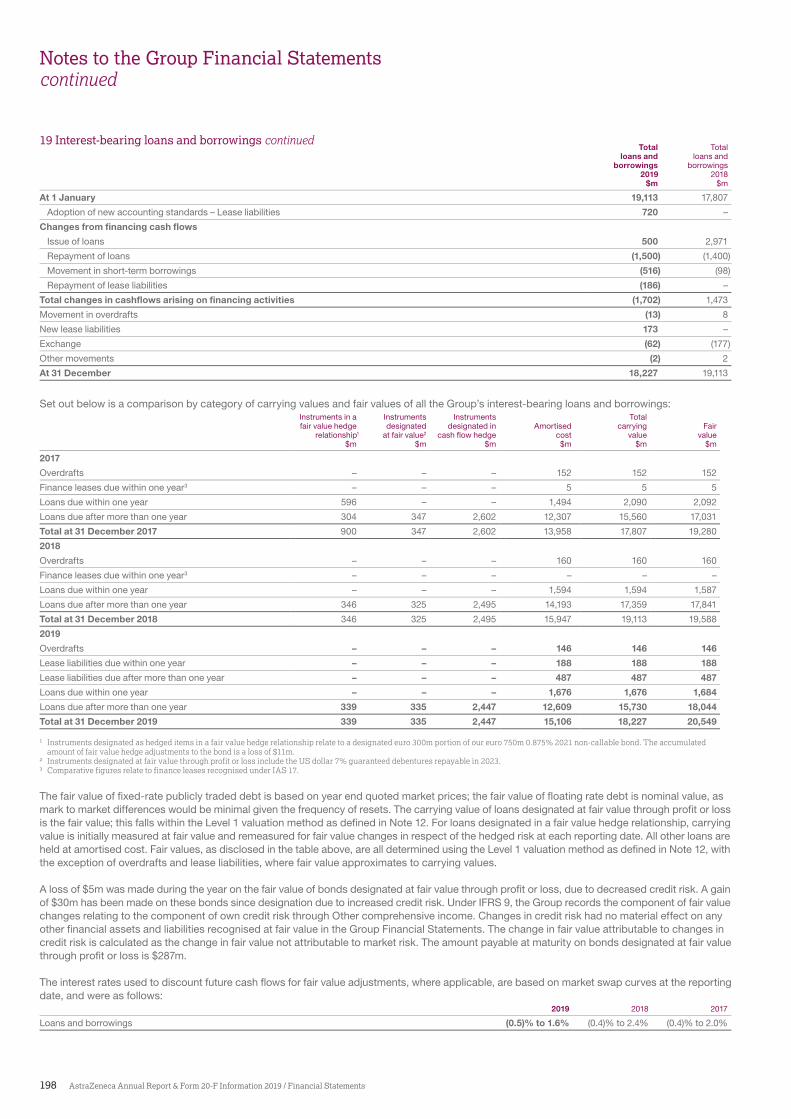
198 AstraZeneca Annual Report & Form 20-F Information 2019 / Financial Statements
Notes to the Group Financial Statementscontinued
Total Totalloans and loans and
borrowings borrowings2019 2018
$m $m
At 1 January 19,113 17,807
Adoption of new accounting standards – Lease liabilities 720 –
Changes from financing cash flows
Issue of loans 500 2,971
Repayment of loans (1,500) (1,400)
Movement in short-term borrowings (516) (98)
Repayment of lease liabilities (186) –
Total changes in cashflows arising on financing activities (1,702) 1,473
Movement in overdrafts (13) 8
New lease liabilities 173 –
Exchange (62) (177)
Other movements (2) 2
At 31 December 18,227 19,113
Set out below is a comparison by category of carrying values and fair values of all the Group’s interest-bearing loans and borrowings:Instruments in a Instruments Instruments Totalfair value hedge designated designated in Amortised carrying Fair
relationship1 at fair value2 cash flow hedge cost value value$m $m $m $m $m $m
2017
Overdrafts – – – 152 152 152
Finance leases due within one year3 – – – 5 5 5
Loans due within one year 596 – – 1,494 2,090 2,092
Loans due after more than one year 304 347 2,602 12,307 15,560 17,031
Total at 31 December 2017 900 347 2,602 13,958 17,807 19,280
2018
Overdrafts – – – 160 160 160
Finance leases due within one year3 – – – – – –
Loans due within one year – – – 1,594 1,594 1,587
Loans due after more than one year 346 325 2,495 14,193 17,359 17,841
Total at 31 December 2018 346 325 2,495 15,947 19,113 19,588
2019
Overdrafts – – – 146 146 146
Lease liabilities due within one year – – – 188 188 188
Lease liabilities due after more than one year – – – 487 487 487
Loans due within one year – – – 1,676 1,676 1,684
Loans due after more than one year 339 335 2,447 12,609 15,730 18,044
Total at 31 December 2019 339 335 2,447 15,106 18,227 20,549
1 Instruments designated as hedged items in a fair value hedge relationship relate to a designated euro 300m portion of our euro 750m 0.875% 2021 non-callable bond. The accumulated amount of fair value hedge adjustments to the bond is a loss of $11m.
2 Instruments designated at fair value through profit or loss include the US dollar 7% guaranteed debentures repayable in 2023.3 Comparative figures relate to finance leases recognised under IAS 17.
The fair value of �xed-rate publicly traded debt is based on year end quoted market prices; the fair value of �oating rate debt is nominal value, as mark to market differences would be minimal given the frequency of resets. The carrying value of loans designated at fair value through pro�t or loss is the fair value; this falls within the Level 1 valuation method as de�ned in Note 12. For loans designated in a fair value hedge relationship, carrying value is initially measured at fair value and remeasured for fair value changes in respect of the hedged risk at each reporting date. All other loans are held at amortised cost. Fair values, as disclosed in the table above, are all determined using the Level 1 valuation method as de�ned in Note 12, with the exception of overdrafts and lease liabilities, where fair value approximates to carrying values.
A loss of $5m was made during the year on the fair value of bonds designated at fair value through pro�t or loss, due to decreased credit risk. A gain of $30m has been made on these bonds since designation due to increased credit risk. Under IFRS 9, the Group records the component of fair value changes relating to the component of own credit risk through Other comprehensive income. Changes in credit risk had no material effect on any other �nancial assets and liabilities recognised at fair value in the Group Financial Statements. The change in fair value attributable to changes in credit risk is calculated as the change in fair value not attributable to market risk. The amount payable at maturity on bonds designated at fair value through pro�t or loss is $287m.
The interest rates used to discount future cash �ows for fair value adjustments, where applicable, are based on market swap curves at the reporting date, and were as follows:
2019 2018 2017
Loans and borrowings (0.5)% to 1.6% (0.4)% to 2.4% (0.4)% to 2.0%
19 Interest-bearing loans and borrowings continued
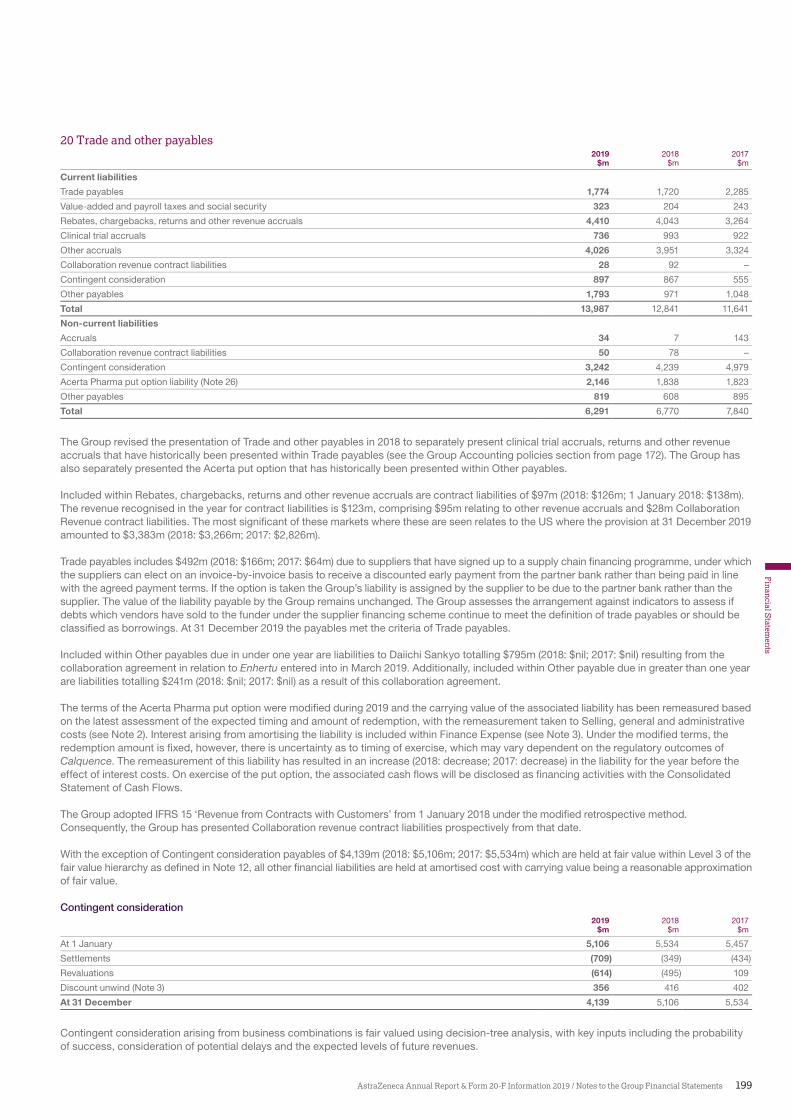
199AstraZeneca Annual Report & Form 20-F Information 2019 / Notes to the Group Financial Statements
Financial S
tatements
20 Trade and other payables2019 2018 2017
$m $m $m
Current liabilities
Trade payables 1,774 1,720 2,285
Value-added and payroll taxes and social security 323 204 243
Rebates, chargebacks, returns and other revenue accruals 4,410 4,043 3,264
Clinical trial accruals 736 993 922
Other accruals 4,026 3,951 3,324
Collaboration revenue contract liabilities 28 92 –
Contingent consideration 897 867 555
Other payables 1,793 971 1,048
Total 13,987 12,841 11,641
Non-current liabilities
Accruals 34 7 143
Collaboration revenue contract liabilities 50 78 –
Contingent consideration 3,242 4,239 4,979
Acerta Pharma put option liability (Note 26) 2,146 1,838 1,823
Other payables 819 608 895
Total 6,291 6,770 7,840
The Group revised the presentation of Trade and other payables in 2018 to separately present clinical trial accruals, returns and other revenue accruals that have historically been presented within Trade payables (see the Group Accounting policies section from page 172). The Group has also separately presented the Acerta put option that has historically been presented within Other payables.
Included within Rebates, chargebacks, returns and other revenue accruals are contract liabilities of $97m (2018: $126m; 1 January 2018: $138m). The revenue recognised in the year for contract liabilities is $123m, comprising $95m relating to other revenue accruals and $28m Collaboration Revenue contract liabilities. The most signi�cant of these markets where these are seen relates to the US where the provision at 31 December 2019 amounted to $3,383m (2018: $3,266m; 2017: $2,826m).
Trade payables includes $492m (2018: $166m; 2017: $64m) due to suppliers that have signed up to a supply chain �nancing programme, under which the suppliers can elect on an invoice-by-invoice basis to receive a discounted early payment from the partner bank rather than being paid in line with the agreed payment terms. If the option is taken the Group’s liability is assigned by the supplier to be due to the partner bank rather than the supplier. The value of the liability payable by the Group remains unchanged. The Group assesses the arrangement against indicators to assess if debts which vendors have sold to the funder under the supplier �nancing scheme continue to meet the de�nition of trade payables or should be classi�ed as borrowings. At 31 December 2019 the payables met the criteria of Trade payables.
Included within Other payables due in under one year are liabilities to Daiichi Sankyo totalling $795m (2018: $nil; 2017: $nil) resulting from the collaboration agreement in relation to Enhertu entered into in March 2019. Additionally, included within Other payable due in greater than one year are liabilities totalling $241m (2018: $nil; 2017: $nil) as a result of this collaboration agreement.
The terms of the Acerta Pharma put option were modi�ed during 2019 and the carrying value of the associated liability has been remeasured based on the latest assessment of the expected timing and amount of redemption, with the remeasurement taken to Selling, general and administrative costs (see Note 2). Interest arising from amortising the liability is included within Finance Expense (see Note 3). Under the modi�ed terms, the redemption amount is �xed, however, there is uncertainty as to timing of exercise, which may vary dependent on the regulatory outcomes of Calquence. The remeasurement of this liability has resulted in an increase (2018: decrease; 2017: decrease) in the liability for the year before the effect of interest costs. On exercise of the put option, the associated cash �ows will be disclosed as �nancing activities with the Consolidated Statement of Cash Flows.
The Group adopted IFRS 15 ‘Revenue from Contracts with Customers’ from 1 January 2018 under the modi�ed retrospective method. Consequently, the Group has presented Collaboration revenue contract liabilities prospectively from that date.
With the exception of Contingent consideration payables of $4,139m (2018: $5,106m; 2017: $5,534m) which are held at fair value within Level 3 of the fair value hierarchy as de�ned in Note 12, all other �nancial liabilities are held at amortised cost with carrying value being a reasonable approximation of fair value.
Contingent consideration2019 2018 2017
$m $m $m
At 1 January 5,106 5,534 5,457
Settlements (709) (349) (434)
Revaluations (614) (495) 109
Discount unwind (Note 3) 356 416 402
At 31 December 4,139 5,106 5,534
Contingent consideration arising from business combinations is fair valued using decision-tree analysis, with key inputs including the probability of success, consideration of potential delays and the expected levels of future revenues.
200 AstraZeneca Annual Report & Form 20-F Information 2019 / Financial Statements
Notes to the Group Financial Statementscontinued
Revaluations of Contingent consideration are recognised in Selling, general and administrative costs and include a decrease of $516m in 2019 (2018: a decrease of $482m; 2017: an increase of $208m) based on revised milestone probabilities, and revenue and royalty forecasts, relating to the acquisition of BMS’s share of the Global Diabetes Alliance. Discount unwind on the liability is included within Finance expense (see Note 3).
The discount rate used for the Contingent consideration balances range from 7% to 9%. The most signi�cant Contingent consideration balance is the Global Diabetes Alliance and this is discounted at 8%.
Management has identi�ed that reasonably possible changes in certain key assumptions, including the likelihood of achieving successful trial results, obtaining regulatory approval, the projected market share of the therapy area and expected pricing for launched products, may cause the calculated fair value of the above contingent consideration to vary materially in future years.
SE The contingent consideration balance relating to BMS’s share of Global Diabetes Alliance of $3,300m (2018: $3,983m; 2017: $4,477m) would increase/decrease by $330m with an increase/decrease in sales of 10% as compared with the current estimates.
The maximum development and sales milestones payable under outstanding contingent consideration arrangements arising on business combinations are as follows:
Nature of Maximum future milestonesAcquisitions Year contingent consideration $m
Spirogen 2013 Milestones 198
Amplimmune 2013 Milestones 200
Omthera 2013 Milestones 120
Pearl Therapeutics 2013 Milestones 290
BMS’s share of Global Diabetes Alliance1 2014 Milestones and royalties 600
Almirall1 2014 Milestones and royalties 450
Definiens1 2014 Milestones 150
1 These contingent consideration liabilities have been designated as the hedge instrument in a net investment hedge of foreign currency risk arising on the Group’s underlying US dollar net investments held in non-US dollar denominated subsidiaries. Exchange differences on the retranslation of the contingent consideration liability are recognised in Other comprehensive income to the extent that the hedge is effective. Any ineffectiveness is taken to profit.
The amount of royalties payable under the arrangements is inherently uncertain and dif�cult to predict, given the direct link to future sales and the range of outcomes. The maximum amount of royalties payable in each year is with reference to net sales.
21 ProvisionsEmployee Other
Severance Environmental benefits Legal provisions Total$m $m $m $m $m $m
At 1 January 2017 487 59 143 438 291 1,418
Charge for year 225 11 30 281 55 602
Cash paid (324) (20) (43) (48) (37) (472)
Reversals (75) – (10) (40) (44) (169)
Exchange and other movements 45 9 6 23 6 89
At 31 December 2017 358 59 126 654 271 1,468
Charge for year 94 65 1 11 30 201
Cash paid (152) (24) (9) (232) (28) (445)
Reversals (58) – – (230) (28) (316)
Exchange and other movements (16) (3) 1 (5) 6 (17)
At 31 December 2018 226 97 119 198 251 891
Charge for year 158 31 18 618 236 1,061
Cash paid (115) (39) (13) (147) (24) (338)
Reversals (30) (1) – (28) (17) (76)
Exchange and other movements 2 8 6 1 9 26
At 31 December 2019 241 96 130 642 455 1,564
2019 2018 2017$m $m $m
Due within one year 723 506 1,121
Due after more than one year 841 385 347
Total 1,564 891 1,468
AstraZeneca is undergoing a global restructuring initiative which involves rationalisation of the global supply chain, the sales and marketing organisation, IT and business support infrastructure, and R&D. Employee costs in connection with the initiatives are recognised in severance provisions. Final severance costs are often subject to the completion of the requisite consultations on the areas impacted. AstraZeneca endeavours to support employees affected by restructuring initiatives to seek alternative roles within the organisation. Where the employee is successful any severance provisions will be released.
20 Trade and other payables continued
201AstraZeneca Annual Report & Form 20-F Information 2019 / Notes to the Group Financial Statements
Financial S
tatements
Details of the environmental and legal provisions are provided in Note 29. The legal issues are often subject to substantial uncertainties with regard to the timing and �nal amounts of any payments, as such, once established these provisions remain in provisions until settlement is reached and uncertainty resolved, with no transfer to Trade and other payables prior to payment. A signi�cant proportion of the total legal provision relates to matters settled in either the current or previous periods. These uncertainties can also cause reversal in previously established provisions once �nal settlement is reached.
Employee bene�t provisions include the Deferred Bonus Plan. Further details are included in Note 28.
Other provisions comprise amounts relating to speci�c contractual or constructive obligations and disputes, the majority of other provisions relates to amounts associated with long-standing product liability settlements that arose prior to the merger of Astra and Zeneca, given the nature of the provision the amounts are expected to be settled over many years.
No provision has been released or applied for any purpose other than that for which it was established.
ost-retire ent benefitsBackgroundThe Company and most of its subsidiaries offer retirement plans which cover the majority of employees in the Group. The Group’s policy is to provide de�ned contribution (DC) orientated pension provision to its employees unless otherwise compelled by local regulation. As a result, many of these retirement plans are DC, where the Group contribution and resulting charge is �xed at a set level or is a set percentage of employees’ pay.
However, several plans, mainly in the UK, the US and Sweden, are de�ned bene�t (DB), where bene�ts are based on employees’ length of service and linked to their salary. The major de�ned bene�t plans are now largely legacy arrangements as they have been closed to new entrants since 2000, apart from the collectively bargained Swedish plan (which is still open to employees born before 1979). During 2010, following consultation with its UK employees’ representatives, the Group introduced a freeze on pensionable pay at 30 June 2010 levels for de�ned bene�t members of the UK Pension Fund. The number of active members in the Fund continues to decline and is now 643 employees. In November 2017, the Group closed the quali�ed and non-quali�ed US de�ned bene�t pension plans to future accrual (and removed any salary link) from 31 December 2017.
The major de�ned bene�t plans are funded through separate, �duciary-administered assets. The cash funding of the plans, which may from time to time involve special Group payments, is designed, in consultation with independent quali�ed actuaries, to ensure that the assets are suf�cient to meet future obligations as and when they fall due. The funding level is monitored rigorously by the Group and local �duciaries, taking into account: the Group’s credit rating; local regulation; cash �ows; and the solvency and maturity of the relevant pension scheme.
Financing principlesNinety one per cent of the Group’s total de�ned bene�t obligations (or eighty per cent of net obligations) at 31 December 2019 are in schemes within the UK, the US and Sweden. In these countries, the pension obligations are funded in line with the Group’s �nancing principles. There were no fundamental changes to these principles during 2019. The Group believes:
> in funding the bene�ts it promises to employees and meeting its obligations> that the pension arrangements should be considered in the context of its broader capital structure. In general, it does not believe in committing
excessive capital for funding when the Group might use the capital elsewhere to reinvest in the wider business, nor does it wish to generate surpluses. > in taking some measured and rewarded risks with the investments underlying the funding, subject to a long-term plan to reduce those risks
when opportunities arise > that holding certain investments may cause volatility in the funding position. However, the Group would not wish to amend its contribution level
for relatively small deviations in funding level, because it is expected that there will be short-term volatility, but it is prepared to react appropriately to more signi�cant deviations
> that proactive engagement with local Fiduciary Bodies is necessary and helpful to provide robust oversight and input in relation to funding and investment strategy and to facilitate liability management exercises appropriate to each pension plan
> in considering the use of alternative methods of providing security that do not require immediate cash funding but help mitigate exposure of the pension arrangement to the credit risk of the Group.
These principles are appropriate at the present date but they are kept under ongoing review and should circumstances change, these principles may also be subject to change.
The Group has developed a long-term funding framework to implement these principles, which targets full funding on a low-risk funding measure over the long term as the pension funds mature, with affordable long-term de-risking of investment strategy. Unless local regulation dictates otherwise, this framework determines the cash contributions payable to the pension funds. A key element of this funding framework is the investment strategy used to grow existing assets and hedge against changes in liability values. The Group provides regular input to local �duciary boards with the aim of ensuring that an appropriate investment return is targeted over the long term in a risk-controlled manner.
UKThe UK de�ned bene�t pension fund represents approximately 61% of the Group’s de�ned bene�t obligations at 31 December 2019. The �nancing principles are modi�ed in light of the UK regulatory requirements (summarised below) and resulting discussions with the Pension Fund Trustee.
Role of Trustees and RegulationThe UK Pension Fund is governed and administered by a corporate Trustee which is legally separate from the Group. The Trustee Directors are comprised of representatives appointed by both the employer and employees and include an independent professional Trustee Director. The Trustee Directors are required by law to act in the interest of all relevant bene�ciaries and are responsible in particular for the asset investment policy and the day-to-day administration of the bene�ts. They are also responsible for jointly agreeing with the employer the level of contributions due to the UK Pension Fund (see below).
202 AstraZeneca Annual Report & Form 20-F Information 2019 / Financial Statements
Notes to the Group Financial Statementscontinued
The UK pensions market is regulated by The Pensions Regulator whose statutory objectives and regulatory powers are described on its website, www.thepensionsregulator.gov.uk.
Funding requirementsUK legislation requires that pension schemes are funded prudently. On a triennial basis, the Trustee and the Group must agree the contributions required (if any) to ensure the Fund is fully funded over an appropriate time-period and on a suitably prudent measure. The actuarial valuation as at 31 March 2019 is currently in progress with a likely timescale for completion in early to mid-2020.
Certain aspects of the actuarial valuation discussions are governed by a long-term funding agreement, signed in October 2016 with the Trustee and which sets out a path to full funding on a low-risk measure. Furthermore, under this agreement, if a de�cit exists, the Group will grant a charge in favour of the Trustee over certain land and buildings on the Cambridge Biomedical Campus, effective upon practical completion of the site, or from 2021 (whichever is earlier). This charge would crystallise only in the event of the Group’s insolvency. This charge will provide long term security in respect of future UK Pension Fund contributions and will be worth up to £350m.
In relation to de�cit recovery contributions, a lump sum contribution of £51m ($65m) was made in March 2019, with a further £51m contribution due before 31 March 2020. In addition, a contribution of £27m ($35m) was made in March 2019, with a further contribution of £28m due before 31 March 2020, in relation to part payment of the deferred contribution explained below.
During 2017, the Group provided a letter of credit to the Trustee, to underwrite the deferral of an additional de�cit recovery contribution of approximately £126m which was due in 2017. This contribution will be paid in �ve instalments (with interest added each year) from March 2018 to March 2022 and to date, two instalments have been paid. The letter of credit underwriting these payments will reduce in value as each annual payment is made.
Under the funding assumptions used to set the statutory funding target, the key assumptions from the actuarial valuation as at 31 March 2016 were as follows: long-term UK price in�ation set at 2.6% per annum; salary increases at 0% per annum (as a result of pensionable pay levels being frozen in 2010); pension increases at 2.85% per annum; and discount rate at 3.71% per annum. The resulting valuation of the Fund’s liabilities on that basis were £5,265m ($6,915m) compared to a market value of assets at 31 March 2016 of £4,492m ($5,899m).
Under the governing documentation of the UK Pension Fund, any future surplus in the Fund would be returnable to the Group by refund assuming gradual settlement of the liabilities over the lifetime of the Fund. As such, there are no adjustments required in respect of IFRIC 14 ‘IAS 19 – The Limit on a De�ned Bene�t Asset, Minimum Funding Requirements and their Interaction’.
Changes to GMPA UK High Court judgment was issued on 26 October 2018 relating to an element of pension bene�ts known as Guaranteed Minimum Pensions (GMP). The ruling requires the equalisation of member bene�ts earned between 1990 and 1997 to address gender inequality in instances where GMP bene�ts are currently unequal. While there remains some uncertainty, the Group made a provision in 2018 for the estimated �nancial impact of this ruling on the UK Pension Fund, based on a comparison of the cumulative value of members’ bene�ts with the bene�ts of a notional member of the opposite gender (method C2 under the terminology of the High Court judgment). The estimated impact is based on the broad pro�le of the Fund (i.e. age pro�le, service pro�le and GMP proportion) and a past service cost of £17m ($23m) was recognised in the year ended 31 December 2018. Discussions between the Trustee and the Company are ongoing to determine the exact impact. Any subsequent adjustments to the original impact provision will be taken to Other comprehensive income.
Separate to this, following a review of the UK Pension Fund’s administrative practice and Fund Rules, a decision was made in July 2019 to change the way in which GMP is calculated. This change applies to all future pension payments from November 2019. A past service net credit of £38m ($49m) has been recognised in respect of these changes for the year ended 31 December 2019.
United States and SwedenThe IAS 19 positions for the US and Sweden as at 31 December 2019 are shown below. Note that for the post-retirement bene�t disclosure for 2019 and for the 2018 comparatives, we have split out the table disclosure for the United States and Sweden from Rest of Group, to provide further information on the larger Group schemes. The US plan and the Sweden plan account for 13% and 17% respectively of the Group’s de�ned bene�t obligations. The US and Sweden pension funds are governed by Fiduciary Bodies with responsibility for the investment policies of those funds. These plans are funded in line with the Group’s �nancing principles and contributions are paid as prescribed by the long-term funding framework (subject to local regulations being met).
The US de�ned bene�t pension plans were actuarially revalued at 31 December 2019, when plan obligations were $1,592m and plan assets were $1,506m. This includes obligations in respect of the non-quali�ed plan which is unfunded. The quali�ed US pension plan remains close to full funding on an IAS 19 basis and has a positive funding balance on the local statutory measure. As such, no contributions are required, and the investment strategy is largely de-risked.
The Swedish de�ned bene�t pension plans were actuarially valued at 31 December 2019, when plan obligations were estimated to amount to $2,160m and plan assets were $1,123m. It should be noted that the Swedish plans have a funding surplus on the local GAAP accounting basis and this in�uences contribution policy.
On current bases, it is expected that ongoing contributions (excluding those in respect of past service de�cit contributions) during the year ending 31 December 2020 for the three main countries will be approximately $31m.
ost-retire ent benefits continued
203AstraZeneca Annual Report & Form 20-F Information 2019 / Notes to the Group Financial Statements
Financial S
tatements
Post-retirement benefits other than pensionsIn the US, and to a lesser extent in certain other countries, the Group’s employment practices include the provision of healthcare and life assurance bene�ts for retired employees. As at 31 December 2019, some 3,087 retired employees and covered dependants currently bene�t from these provisions and some 2,007 current employees will be eligible on their retirement. The Group accrues for the present value of such retiree obligations over the working life of the employee. In practice, these bene�ts will be funded with reference to the �nancing principles.
The cost of post-retirement bene�ts other than pensions for the Group in 2019 was $3m (2018: $5m; 2017: $14m). Plan assets were $252m and plan obligations were $252m at 31 December 2019. These bene�t plans have been included in the disclosure of post-retirement bene�ts under IAS 19.
Financial assumptionsQuali�ed independent actuaries have updated the actuarial valuations under IAS 19 for the major de�ned bene�t schemes operated by the Group to 31 December 2019. The assumptions used may not necessarily be borne out in practice, due to the inherent �nancial and demographic uncertainty associated with making long-term projections. These assumptions re�ect the changes which have the most material impact on the results of the Group and were as follows:
2018
UK US Sweden Rest of Group4
Inflation assumption 3.2% – 1.9% 1.7%
Rate of increase in salaries –1 – 3.4% 2.5%
Rate of increase in pensions in payment 3.0% – 1.9% 1.7%
Discount rate – defined benefit obligation 2.8% 4.3% 2.4% 1.8%
Discount rate – interest cost 2.4% 3.3% 2.2% 1.5%
Discount rate – service cost 2.5% 3.3% 2.8% 1.9%
2019
UK US Sweden Rest of Group4
Inflation assumption 3.0% – 1.8% 1.5%
Rate of increase in salaries –1 – 3.3% 2.3%
Rate of increase in pensions in payment 2.8% – 1.8% 1.5%
Discount rate – defined benefit obligation 2.0%2 3.2% 1.5% 1.3%
Discount rate – interest cost 2.7%3 3.9% 2.0% 1.6%
Discount rate – service cost 2.8%3 4.0% 2.5% 1.9%
1 Pensionable pay frozen at 30 June 2010 levels following UK fund changes.2 Group defined benefit obligation as at 31 December 2019 calculated using discount rates based on market conditions as at 31 December 2019.3 2019 interest costs and service costs calculated using discount rates based on market conditions as at 31 December 2018.4 Rest of Group reflects the assumptions in Germany as these have the most material impact on the Group.
The weighted average duration of the post-retirement scheme obligations is 16 years in the UK, 9 years in the US, 20 years in Sweden and 20 years for the rest of the Group.
Demographic assumptionsThe mortality assumptions are based on country-speci�c mortality tables. These are compared to actual experience and adjusted where suf�cient data are available. Additional allowance for future improvements in life expectancy is included for all major schemes where there is credible data to support a continuing trend.
The table below illustrates life expectancy assumptions at age 65 for male and female members retiring in 2019 and male and female members expected to retire in 2039 (2018: 2018 and 2038 respectively).
Life expectancy assumption for a male member retiring at age 65 Life expectancy assumption for a female member retiring at age 65
Country 2019 2039 2018 2038 2019 2039 2018 2038
UK 22.4 23.7 23.2 24.7 23.7 25.0 24.0 25.5
US 22.0 24.9 22.2 22.8 23.4 26.6 23.7 26.8
Sweden 21.9 23.6 21.9 23.6 24.5 25.6 24.5 25.6
In the UK, the Group adopted the CMI 2018 Mortality Projections Model with a 1% long-term improvement rate in 2019 and also updated the early retirement assumption to re�ect experience observed as part of the 31 March 2019 triennial valuation. The Group has continued to assume that 30% of members (2018: 30%) will transfer out of the de�ned bene�t section of the AstraZeneca Pension Fund at the point of retirement.
The assumption used for the US plans was updated in 2019 to use the mortality tables (Pri-2012 and MP-2019) that were published during the year.
204 AstraZeneca Annual Report & Form 20-F Information 2019 / Financial Statements
Notes to the Group Financial Statementscontinued
Risks associated with the Group’s defined benefit pensionsThe UK de�ned bene�t plan accounts for 61% of the Group’s de�ned bene�t obligations and exposes the Group to a number of risks, the most signi�cant of which are:
Risk Description Mitigation
Volatile asset returns
The De�ned Bene�t Obligation (DBO) is calculated using a discount rate set with reference to AA-rated corporate bond yields; asset returns that differ from the discount rate will create an element of volatility in the solvency ratio. The UK Pension Fund holds a signi�cant proportion of assets (around 72.5%) in a growth portfolio. Although these growth assets are expected to outperform AA-rated corporate bonds in the long term, they can lead to volatility and mismatching risk in the short term. The allocation to growth assets is monitored to ensure it remains appropriate given the UK Pension Fund’s long-term objectives.
In order to mitigate investment risk, the Trustee invests in a suitably diversi�ed range of asset classes, return drivers and investment managers. The investment strategy will continue to evolve to further improve the expected risk/return pro�le as opportunities arise.
The Trustee has hedged approximately 80% of unintended non-sterling, overseas currency risk within the UK Pension Fund assets.
Changes in bond yields
A decrease in corporate bond yields will increase the present value placed on the DBO for accounting purposes.
The interest rate hedge of the UK Pension Fund is implemented via holding gilts and swaps of appropriate duration and set at approximately 85% of total assets and protects to some degree against falls in long-term interest rates (approximately 85% hedged at the end of 2018). There is a framework in place to gradually increase the level of interest rate hedging to 100% of assets over time, via a combination of liability management exercises and additional market-based hedging.
There are some differences in the bonds and instruments held by the UK Pension Fund to hedge interest rate risk on the statutory and long-term funding basis (gilts and swaps) and the bonds analysed to set the DBO discount rate on an accounting basis (AA corporate bonds). As such, there remains some mismatching risk on an accounting basis should yields on gilts and swaps diverge compared to AA corporate bonds.
In�ation risk The majority of the DBO is indexed in line with price in�ation (mainly in�ation as measured by the UK Retail Price Index (RPI) but also for some members a component of pensions is indexed by the UK Consumer Price Index (CPI)) and higher in�ation will lead to higher liabilities (although, in most cases, this is capped at an annual increase of 5%). Should changes be made to align RPI with CPI in the future, then other things being equal, this will lead to lower liability valuations.
The UK Pension Fund holds RPI index-linked gilts and derivative instruments such as swaps. The in�ation hedge of the UK Pension Fund is set at approximately 85% of total assets and protects to some degree against higher-than-expected in�ation increases on the DBO (approximately 88% hedged at the end of 2018). There is a framework in place to gradually increase the level of in�ation hedging to 100% of assets over time, via a combination of liability management exercises and additional market-based hedging.
Life expectancy The majority of the UK Pension Fund’s obligations are to provide bene�ts for the life of the member, so increases in life expectancy will result in an increase in the liabilities.
The UK Pension Fund entered into a longevity swap during 2013 which provides hedging against the longevity risk of increasing life expectancy over the next 75 years for around 10,000 of the UK Pension Fund’s current pensioners and covers $3.1bn of the UK Pension Fund’s liabilities. A one-year increase in life expectancy will result in a $210m increase in pension fund assets.
Other risksThere are a number of other risks of running the UK Pension Fund including counterparty risks from using derivatives (mitigated by using a diversi�ed range of counterparties of high standing and ensuring positions are collateralised daily). Furthermore, there are operational risks (such as paying out the wrong bene�ts) and legislative risks (such as the government increasing the burden on companies through new legislation). These are mitigated so far as possible via the governance structure in place which oversees and administers the pension funds.
The Group’s pension plans in the US and Sweden also manage these key risks, where they are relevant, in a similar manner, with the local �duciary bodies investing in a diversi�ed growth portfolio and employing a framework to hedge interest rate risk.
Post-retirement scheme deficitThe assets and obligations of the de�ned bene�t schemes operated by the Group at 31 December 2019, as calculated in accordance with IAS 19, are shown below. The fair values of the schemes’ assets are not intended to be realised in the short term and may be subject to signi�cant change before they are realised. The present value of the schemes’ obligations is derived from cash �ow projections over long periods and is therefore inherently uncertain.
ost-retire ent benefits continued
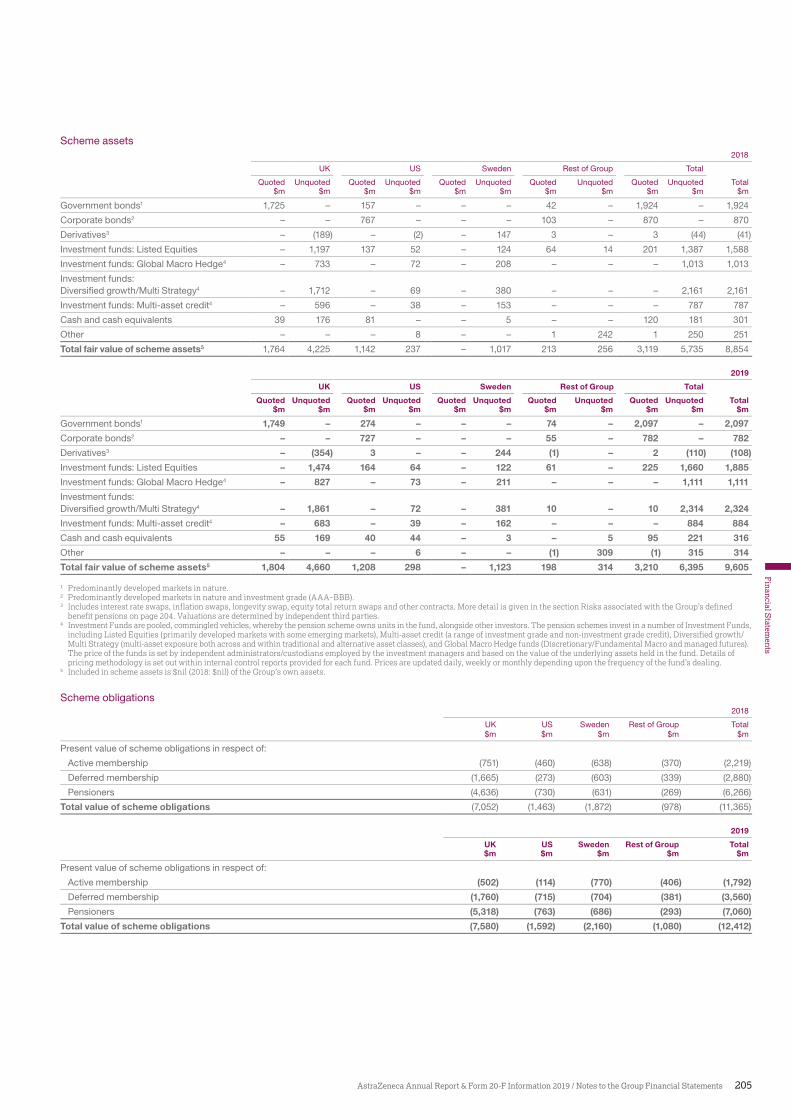
205AstraZeneca Annual Report & Form 20-F Information 2019 / Notes to the Group Financial Statements
Financial S
tatements
Scheme assets2018
UK US Sweden Rest of Group Total
Quoted Unquoted Quoted Unquoted Quoted Unquoted Quoted Unquoted Quoted Unquoted Total$m $m $m $m $m $m $m $m $m $m $m
Government bonds1 1,725 – 157 – – – 42 – 1,924 – 1,924
Corporate bonds2 – – 767 – – – 103 – 870 – 870
Derivatives3 – (189) – (2) – 147 3 – 3 (44) (41)
Investment funds: Listed Equities – 1,197 137 52 – 124 64 14 201 1,387 1,588
Investment funds: Global Macro Hedge4 – 733 – 72 – 208 – – – 1,013 1,013
Investment funds: Diversified growth/Multi Strategy4 – 1,712 – 69 – 380 – – – 2,161 2,161
Investment funds: Multi-asset credit4 – 596 – 38 – 153 – – – 787 787
Cash and cash equivalents 39 176 81 – – 5 – – 120 181 301
Other – – – 8 – – 1 242 1 250 251
Total fair value of scheme assets5 1,764 4,225 1,142 237 – 1,017 213 256 3,119 5,735 8,854
2019
UK US Sweden Rest of Group Total
Quoted Unquoted Quoted Unquoted Quoted Unquoted Quoted Unquoted Quoted Unquoted Total$m $m $m $m $m $m $m $m $m $m $m
Government bonds1 1,749 – 274 – – – 74 – 2,097 – 2,097
Corporate bonds2 – – 727 – – – 55 – 782 – 782
Derivatives3 – (354) 3 – – 244 (1) – 2 (110) (108)
Investment funds: Listed Equities – 1,474 164 64 – 122 61 – 225 1,660 1,885
Investment funds: Global Macro Hedge4 – 827 – 73 – 211 – – – 1,111 1,111
Investment funds: Diversified growth/Multi Strategy4 – 1,861 – 72 – 381 10 – 10 2,314 2,324
Investment funds: Multi-asset credit4 – 683 – 39 – 162 – – – 884 884
Cash and cash equivalents 55 169 40 44 – 3 – 5 95 221 316
Other – – – 6 – – (1) 309 (1) 315 314
Total fair value of scheme assets5 1,804 4,660 1,208 298 – 1,123 198 314 3,210 6,395 9,605
1 Predominantly developed markets in nature.2 Predominantl developedmarketsinnatureandinvestmentgrade(AAA ).3 Includes interest rate swaps, inflation swaps, longevity swap, equity total return swaps and other contracts. More detail is given in the section Risks associated with the Group’s defined
benefit pensions on page 204. Valuations are determined by independent third parties.4 Investment Funds are pooled, commingled vehicles, whereby the pension scheme owns units in the fund, alongside other investors. The pension schemes invest in a number of Investment Funds,
including Listed Equities (primarily developed markets with some emerging markets), Multi-asset credit (a range of investment grade and non-investment grade credit), Diversified growth/Multi Strategy (multi-asset exposure both across and within traditional and alternative asset classes), and Global Macro Hedge funds (Discretionary/Fundamental Macro and managed futures). The price of the funds is set by independent administrators/custodians employed by the investment managers and based on the value of the underlying assets held in the fund. Details of pricing methodology is set out within internal control reports provided for each fund. Prices are updated daily, weekly or monthly depending upon the frequency of the fund’s dealing.
5 Included in scheme assets is $nil (2018: $nil) of the Group’s own assets.
Scheme obligations2018
UK US Sweden Rest of Group Total$m $m $m $m $m
Present value of scheme obligations in respect of:
Active membership (751) (460) (638) (370) (2,219)
Deferred membership (1,665) (273) (603) (339) (2,880)
Pensioners (4,636) (730) (631) (269) (6,266)
Total value of scheme obligations (7,052) (1,463) (1,872) (978) (11,365)
2019
UK US Sweden Rest of Group Total$m $m $m $m $m
Present value of scheme obligations in respect of:
Active membership (502) (114) (770) (406) (1,792)
Deferred membership (1,760) (715) (704) (381) (3,560)
Pensioners (5,318) (763) (686) (293) (7,060)
Total value of scheme obligations (7,580) (1,592) (2,160) (1,080) (12,412)
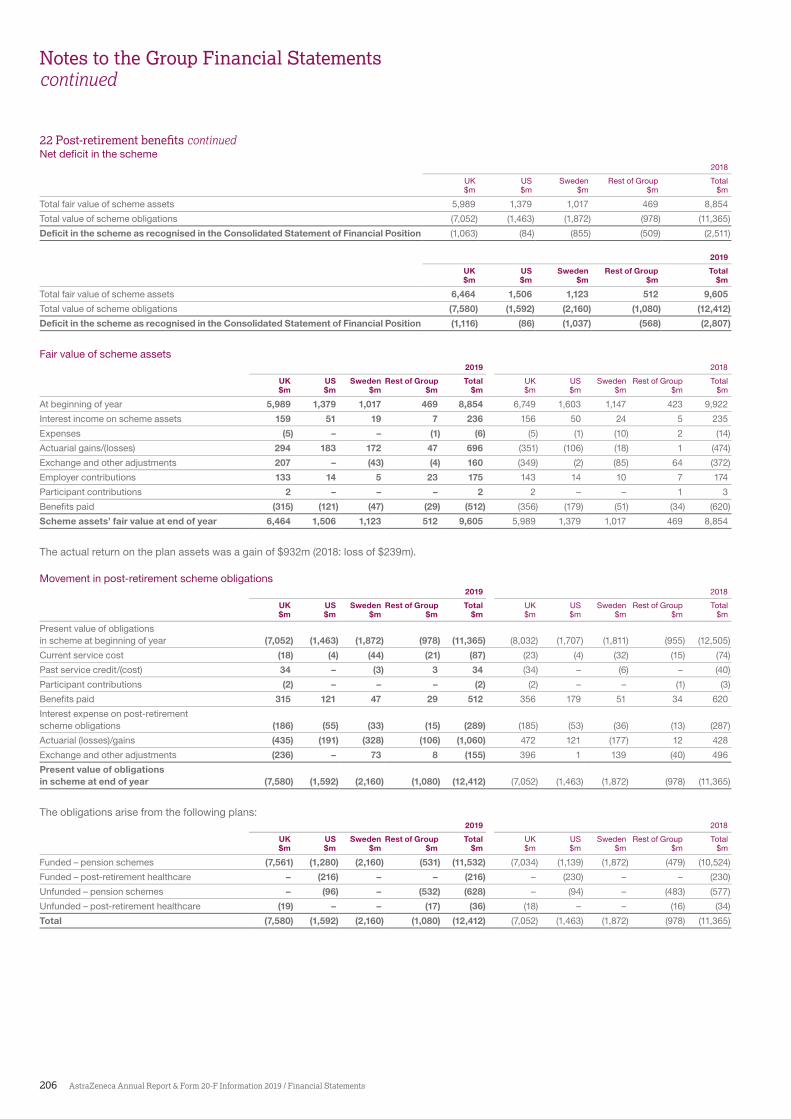
206 AstraZeneca Annual Report & Form 20-F Information 2019 / Financial Statements
Notes to the Group Financial Statementscontinued
Net de�cit in the scheme2018
UK US Sweden Rest of Group Total$m $m $m $m $m
Total fair value of scheme assets 5,989 1,379 1,017 469 8,854
Total value of scheme obligations (7,052) (1,463) (1,872) (978) (11,365)
Deficit in the scheme as recognised in the Consolidated Statement of Financial Position (1,063) (84) (855) (509) (2,511)
2019
UK US Sweden Rest of Group Total$m $m $m $m $m
Total fair value of scheme assets 6,464 1,506 1,123 512 9,605
Total value of scheme obligations (7,580) (1,592) (2,160) (1,080) (12,412)
Deficit in the scheme as recognised in the Consolidated Statement of Financial Position (1,116) (86) (1,037) (568) (2,807)
Fair value of scheme assets2019 2018
UK US Sweden Rest of Group Total UK US Sweden Rest of Group Total$m $m $m $m $m $m $m $m $m $m
At beginning of year 5,989 1,379 1,017 469 8,854 6,749 1,603 1,147 423 9,922
Interest income on scheme assets 159 51 19 7 236 156 50 24 5 235
Expenses (5) – – (1) (6) (5) (1) (10) 2 (14)
Actuarial gains/(losses) 294 183 172 47 696 (351) (106) (18) 1 (474)
Exchange and other adjustments 207 – (43) (4) 160 (349) (2) (85) 64 (372)
Employer contributions 133 14 5 23 175 143 14 10 7 174
Participant contributions 2 – – – 2 2 – – 1 3
Benefits paid (315) (121) (47) (29) (512) (356) (179) (51) (34) (620)
Scheme assets’ fair value at end of year 6,464 1,506 1,123 512 9,605 5,989 1,379 1,017 469 8,854
The actual return on the plan assets was a gain of $932m (2018: loss of $239m).
Movement in post-retirement scheme obligations2019 2018
UK US Sweden Rest of Group Total UK US Sweden Rest of Group Total$m $m $m $m $m $m $m $m $m $m
Present value of obligations in scheme at beginning of year (7,052) (1,463) (1,872) (978) (11,365) (8,032) (1,707) (1,811) (955) (12,505)
Current service cost (18) (4) (44) (21) (87) (23) (4) (32) (15) (74)
Past service credit/(cost) 34 – (3) 3 34 (34) – (6) – (40)
Participant contributions (2) – – – (2) (2) – – (1) (3)
Benefits paid 315 121 47 29 512 356 179 51 34 620
Interest expense on post-retirement scheme obligations (186) (55) (33) (15) (289) (185) (53) (36) (13) (287)
Actuarial (losses)/gains (435) (191) (328) (106) (1,060) 472 121 (177) 12 428
Exchange and other adjustments (236) – 73 8 (155) 396 1 139 (40) 496
Present value of obligations in scheme at end of year (7,580) (1,592) (2,160) (1,080) (12,412) (7,052) (1,463) (1,872) (978) (11,365)
The obligations arise from the following plans:2019 2018
UK US Sweden Rest of Group Total UK US Sweden Rest of Group Total$m $m $m $m $m $m $m $m $m $m
Funded – pension schemes (7,561) (1,280) (2,160) (531) (11,532) (7,034) (1,139) (1,872) (479) (10,524)
Funded – post-retirement healthcare – (216) – – (216) – (230) – – (230)
Unfunded – pension schemes – (96) – (532) (628) – (94) – (483) (577)
Unfunded – post-retirement healthcare (19) – – (17) (36) (18) – – (16) (34)
Total (7,580) (1,592) (2,160) (1,080) (12,412) (7,052) (1,463) (1,872) (978) (11,365)
ost-retire ent benefits continued
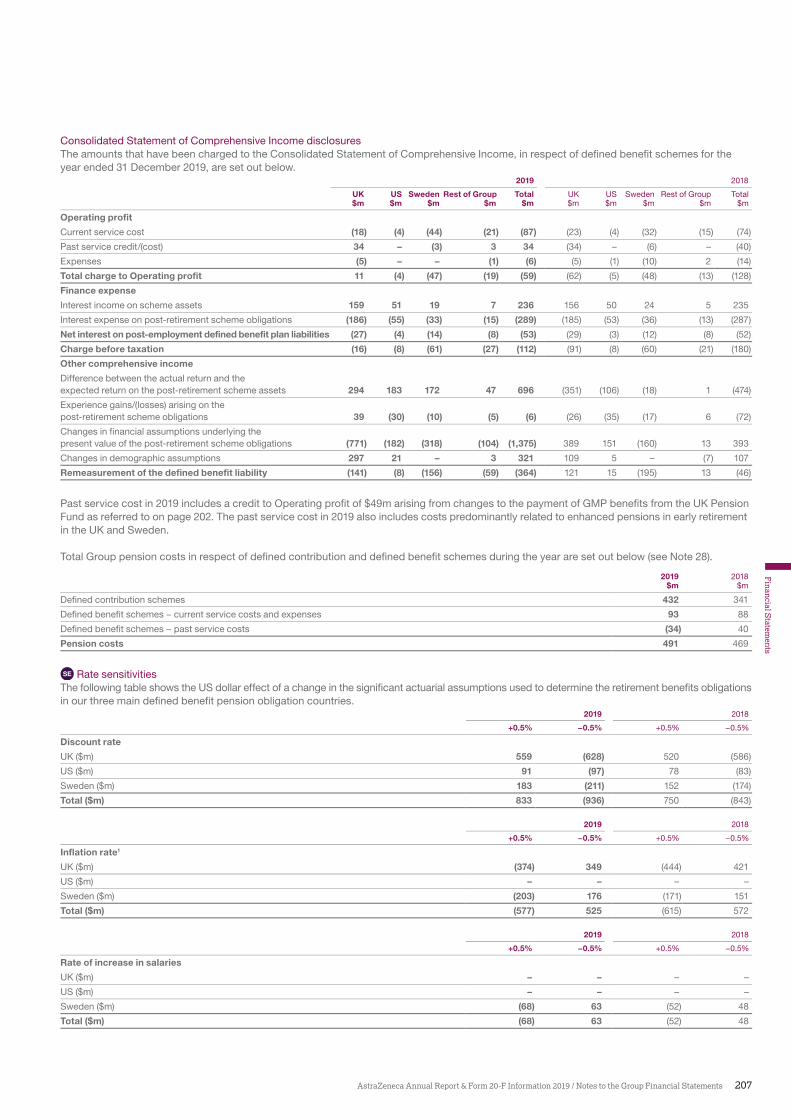
207AstraZeneca Annual Report & Form 20-F Information 2019 / Notes to the Group Financial Statements
Financial S
tatements
Consolidated Statement of Comprehensive Income disclosuresThe amounts that have been charged to the Consolidated Statement of Comprehensive Income, in respect of de�ned bene�t schemes for the year ended 31 December 2019, are set out below.
2019 2018
UK US Sweden Rest of Group Total UK US Sweden Rest of Group Total$m $m $m $m $m $m $m $m $m $m
Operating profit
Current service cost (18) (4) (44) (21) (87) (23) (4) (32) (15) (74)
Past service credit/(cost) 34 – (3) 3 34 (34) – (6) – (40)
Expenses (5) – – (1) (6) (5) (1) (10) 2 (14)
Total charge to Operating profit 11 (4) (47) (19) (59) (62) (5) (48) (13) (128)
Finance expense
Interest income on scheme assets 159 51 19 7 236 156 50 24 5 235
Interest expense on post-retirement scheme obligations (186) (55) (33) (15) (289) (185) (53) (36) (13) (287)
Net interest on post-employment defined benefit plan liabilities (27) (4) (14) (8) (53) (29) (3) (12) (8) (52)
Charge before taxation (16) (8) (61) (27) (112) (91) (8) (60) (21) (180)
Other comprehensive income
Difference between the actual return and the expected return on the post-retirement scheme assets 294 183 172 47 696 (351) (106) (18) 1 (474)
Experience gains/(losses) arising on the post-retirement scheme obligations 39 (30) (10) (5) (6) (26) (35) (17) 6 (72)
Changes in financial assumptions underlying the present value of the post-retirement scheme obligations (771) (182) (318) (104) (1,375) 389 151 (160) 13 393
Changes in demographic assumptions 297 21 – 3 321 109 5 – (7) 107
Remeasurement of the defined benefit liability (141) (8) (156) (59) (364) 121 15 (195) 13 (46)
Past service cost in 2019 includes a credit to Operating pro�t of $49m arising from changes to the payment of GMP bene�ts from the UK Pension Fund as referred to on page 202. The past service cost in 2019 also includes costs predominantly related to enhanced pensions in early retirement in the UK and Sweden.
Total Group pension costs in respect of de�ned contribution and de�ned bene�t schemes during the year are set out below (see Note 28).
2019 2018$m $m
Defined contribution schemes 432 341
Defined benefit schemes − current service costs and expenses 93 88
Defined benefit schemes − past service costs (34) 40
Pension costs 491 469
SE Rate sensitivitiesThe following table shows the US dollar effect of a change in the signi�cant actuarial assumptions used to determine the retirement bene�ts obligations in our three main de�ned bene�t pension obligation countries.
2019 2018
+0.5% −0.5% +0.5% −0.5%
Discount rate
UK ($m) 559 (628) 520 (586)
US ($m) 91 (97) 78 (83)
Sweden ($m) 183 (211) 152 (174)
Total ($m) 833 (936) 750 (843)
2019 2018
+0.5% −0.5% +0.5% −0.5%
Inflation rate1
UK ($m) (374) 349 (444) 421
US ($m) – – – –
Sweden ($m) (203) 176 (171) 151
Total ($m) (577) 525 (615) 572
2019 2018
+0.5% −0.5% +0.5% −0.5%
Rate of increase in salaries
UK ($m) – – – –
US ($m) – – – –
Sweden ($m) (68) 63 (52) 48
Total ($m) (68) 63 (52) 48
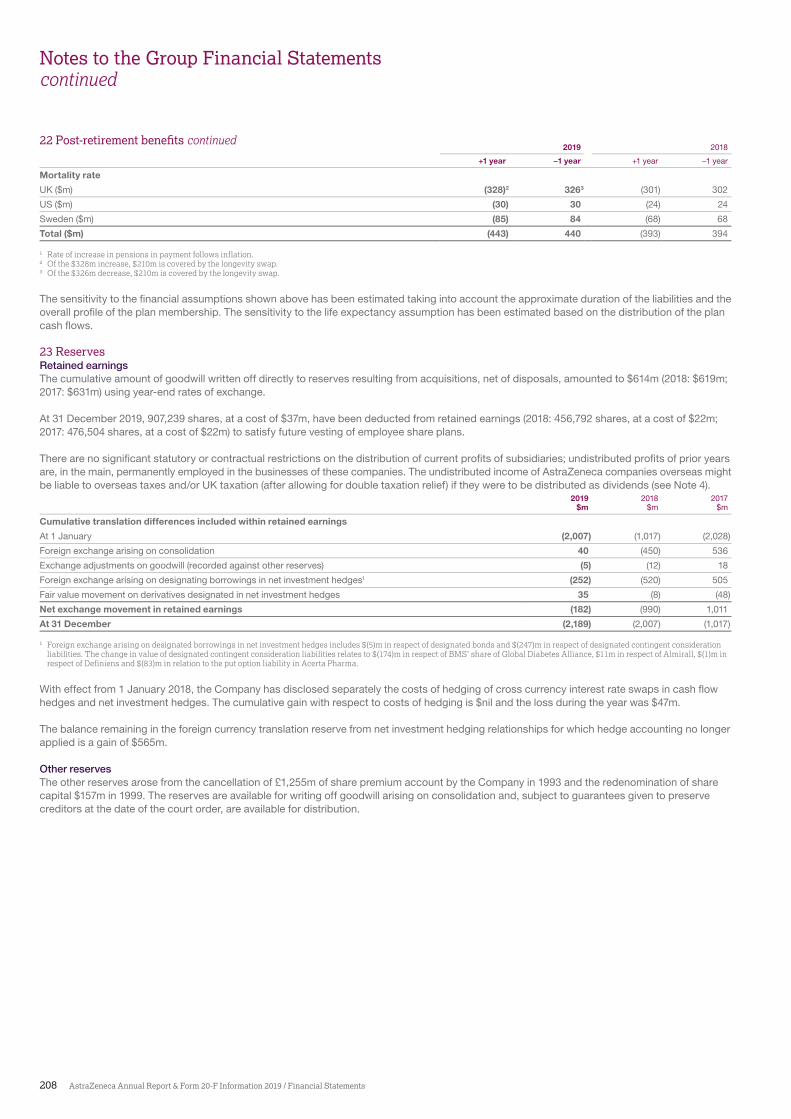
208 AstraZeneca Annual Report & Form 20-F Information 2019 / Financial Statements
Notes to the Group Financial Statementscontinued
2019 2018
+1 year −1 year +1 year −1 year
Mortality rate
UK ($m) (328)2 3263 (301) 302
US ($m) (30) 30 (24) 24
Sweden ($m) (85) 84 (68) 68
Total ($m) (443) 440 (393) 394
1 Rate of increase in pensions in payment follows inflation.2 Of the $328m increase, $210m is covered by the longevity swap.3 Of the $326m decrease, $210m is covered by the longevity swap.
The sensitivity to the �nancial assumptions shown above has been estimated taking into account the approximate duration of the liabilities and the overall pro�le of the plan membership. The sensitivity to the life expectancy assumption has been estimated based on the distribution of the plan cash �ows.
23 ReservesRetained earningsThe cumulative amount of goodwill written off directly to reserves resulting from acquisitions, net of disposals, amounted to $614m (2018: $619m; 2017: $631m) using year-end rates of exchange.
At 31 December 2019, 907,239 shares, at a cost of $37m, have been deducted from retained earnings (2018: 456,792 shares, at a cost of $22m; 2017: 476,504 shares, at a cost of $22m) to satisfy future vesting of employee share plans.
There are no signi�cant statutory or contractual restrictions on the distribution of current pro�ts of subsidiaries; undistributed pro�ts of prior years are, in the main, permanently employed in the businesses of these companies. The undistributed income of AstraZeneca companies overseas might be liable to overseas taxes and/or UK taxation (after allowing for double taxation relief) if they were to be distributed as dividends (see Note 4).
2019 2018 2017$m $m $m
Cumulative translation differences included within retained earnings
At 1 January (2,007) (1,017) (2,028)
Foreign exchange arising on consolidation 40 (450) 536
Exchange adjustments on goodwill (recorded against other reserves) (5) (12) 18
Foreign exchange arising on designating borrowings in net investment hedges1 (252) (520) 505
Fair value movement on derivatives designated in net investment hedges 35 (8) (48)
Net exchange movement in retained earnings (182) (990) 1,011
At 31 December (2,189) (2,007) (1,017)
1 Foreign exchange arising on designated borrowings in net investment hedges includes $(5)m in respect of designated bonds and $(247)m in respect of designated contingent consideration liabilities. hechangeinvalueofdesignatedcontingentconsiderationliabilitiesrelatesto (17 )minrespectof MS shareofGlobalDiabetesAlliance, 11minrespectofAlmirall, (1)minrespect of Definiens and $(83)m in relation to the put option liability in Acerta Pharma.
With effect from 1 January 2018, the Company has disclosed separately the costs of hedging of cross currency interest rate swaps in cash �ow hedges and net investment hedges. The cumulative gain with respect to costs of hedging is $nil and the loss during the year was $47m.
The balance remaining in the foreign currency translation reserve from net investment hedging relationships for which hedge accounting no longer applied is a gain of $565m.
Other reservesThe other reserves arose from the cancellation of £1,255m of share premium account by the Company in 1993 and the redenomination of share capital $157m in 1999. The reserves are available for writing off goodwill arising on consolidation and, subject to guarantees given to preserve creditors at the date of the court order, are available for distribution.
ost-retire ent benefits continued
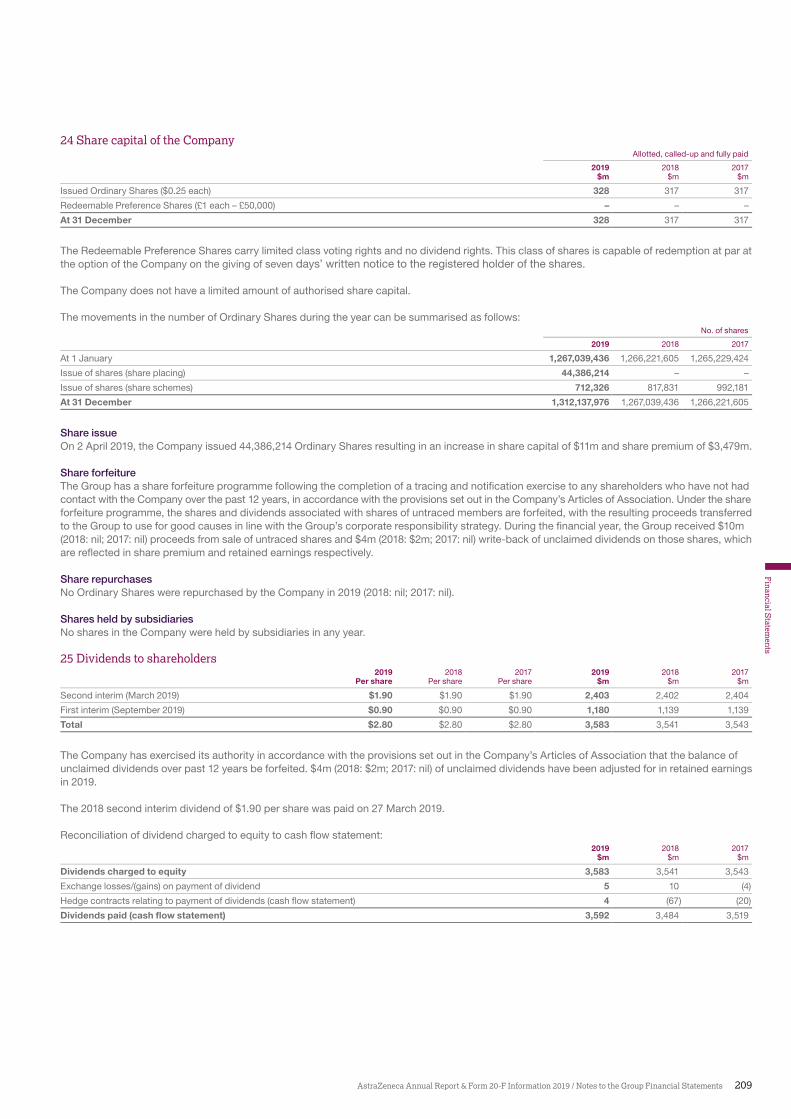
209AstraZeneca Annual Report & Form 20-F Information 2019 / Notes to the Group Financial Statements
Financial S
tatements
24 Share capital of the CompanyAllotted, called-up and fully paid
2019 2018 2017$m $m $m
Issued Ordinary Shares ($0.25 each) 328 317 317
Redeemable Preference Shares (£1 each – £50,000) – – –
At 31 December 328 317 317
The Redeemable Preference Shares carry limited class voting rights and no dividend rights. This class of shares is capable of redemption at par at the option of the Company on the giving of seven days’ written notice to the registered holder of the shares.
The Company does not have a limited amount of authorised share capital.
The movements in the number of Ordinary Shares during the year can be summarised as follows:No. of shares
2019 2018 2017
At 1 January 1,267,039,436 1,266,221,605 1,265,229,424
Issue of shares (share placing) 44,386,214 – –
Issue of shares (share schemes) 712,326 817,831 992,181
At 31 December 1,312,137,976 1,267,039,436 1,266,221,605
Share issueOn 2 April 2019, the Company issued 44,386,214 Ordinary Shares resulting in an increase in share capital of $11m and share premium of $3,479m.
Share forfeitureThe Group has a share forfeiture programme following the completion of a tracing and noti�cation exercise to any shareholders who have not had contact with the Company over the past 12 years, in accordance with the provisions set out in the Company’s Articles of Association. Under the share forfeiture programme, the shares and dividends associated with shares of untraced members are forfeited, with the resulting proceeds transferred to the Group to use for good causes in line with the Group’s corporate responsibility strategy. During the �nancial year, the Group received $10m (2018: nil; 2017: nil) proceeds from sale of untraced shares and $4m (2018: $2m; 2017: nil) write-back of unclaimed dividends on those shares, which are re�ected in share premium and retained earnings respectively.
Share repurchasesNo Ordinary Shares were repurchased by the Company in 2019 (2018: nil; 2017: nil).
Shares held by subsidiariesNo shares in the Company were held by subsidiaries in any year.
25 Dividends to shareholders2019 2018 2017 2019 2018 2017
Per share Per share Per share $m $m $m
Second interim (March 2019) $1.90 $1.90 $1.90 2,403 2,402 2,404
First interim (September 2019) $0.90 $0.90 $0.90 1,180 1,139 1,139
Total $2.80 $2.80 $2.80 3,583 3,541 3,543
The Company has exercised its authority in accordance with the provisions set out in the Company’s Articles of Association that the balance of unclaimed dividends over past 12 years be forfeited. $4m (2018: $2m; 2017: nil) of unclaimed dividends have been adjusted for in retained earnings in 2019.
The 2018 second interim dividend of $1.90 per share was paid on 27 March 2019.
Reconciliation of dividend charged to equity to cash �ow statement: 2019 2018 2017
$m $m $m
Dividends charged to equity 3,583 3,541 3,543
Exchange losses/(gains) on payment of dividend 5 10 (4)
Hedge contracts relating to payment of dividends (cash flow statement) 4 (67) (20)
Dividends paid (cash flow statement) 3,592 3,484 3,519

210 AstraZeneca Annual Report & Form 20-F Information 2019 / Financial Statements
Notes to the Group Financial Statementscontinued
26 Non-controlling interestsFollowing the acquisition of a majority stake in Acerta Pharma on 2 February 2016, the Group Financial Statements at 31 December 2019 re�ect equity of $1,456m (2018: $1,567m; 2017: $1,676m) and total comprehensive losses of $111m (2018: losses of $109m; 2017: losses of $132m) attributable to the non-controlling interest, held by other parties, in Acerta Pharma. The following summarised �nancial information, for Acerta Pharma and its subsidiaries, is presented on a stand alone basis since the acquisition date, and before the impact of Group-related adjustments, some of which are incorporated into this calculation of the loss attributable to the non-controlling interests:
2019 2018 2017$m $m $m
Total Revenue – – –
(Loss)/profit after tax (422) (9) 412
Other comprehensive income – – –
Total comprehensive (loss)/income (422) (9) 412
2019 2018 2017$m $m $m
Non-current assets 157 16 3
Current assets 475 526 904
Total assets 632 542 907
Current liabilities (310) (63) (417)
Non-current liabilities (267) – –
Total liabilities (577) (63) (417)
Net assets/(liabilities) 55 479 490
2019 2018 2017$m $m $m
Net cash (outflow)/inflow from operating activities (13) 7 5
Net cash inflow/(outflow) from investing activities 7 (4) –
Net cash inflow from financing activities 7 – –
Increase/(decrease) in cash and cash equivalents in the year 1 3 5
The total reported total comprehensive losses of $107m (2018: losses of $106m; 2017: losses of $133m) and equity of $1,469m (2018: $1,576m; 2017: $1,682m) attributable to non-controlling interests held by other parties, comprises the Acerta Pharma results and immaterial amounts in AstraZeneca Pharma India Limited and P.T. AstraZeneca Indonesia.
The non-controlling interest in Acerta Pharma is subject to a put option, exercisable by the minority shareholders at certain points in the future, dependent on regulatory outcomes of Calquence (acalabrutinib) in Europe. This put option gives rise to a liability (see Note 20).
27 Financial risk management objectives and policiesThe Group’s principal �nancial instruments, other than derivatives, comprise bank overdrafts, lease liabilities, loans, current and non-current investments, cash and short-term deposits. The main purpose of these �nancial instruments is to manage the Group’s funding and liquidity requirements. The Group has other �nancial assets and liabilities such as trade receivables and trade payables, which arise directly from its operations.
The principal �nancial risks to which the Group is exposed are those of liquidity, interest rate, foreign currency and credit. Each of these is managed in accordance with Board-approved policies. These policies are set out below.
Hedge accountingThe Group uses foreign currency borrowings, foreign currency forwards and swaps, currency options, interest rate swaps and cross-currency interest rate swaps for the purpose of hedging its foreign currency and interest rate risks. The Group may designate certain �nancial instruments as fair value hedges, cash �ow hedges or net investment hedges in accordance with IFRS 9. Hedge effectiveness is determined at the inception of the hedge relationship, and through periodic prospective effectiveness assessments to ensure that an economic relationship exists between the hedged item and hedging instrument. Sources of hedge effectiveness will depend on the hedge relationship designation but may include:
> a signi�cant change in the credit risk of either party to the hedging relationship> a timing mismatch between the hedging instrument and the hedged item> movements in foreign currency basis spread for derivatives in a fair value hedge> a signi�cant change in the value of the foreign currency denominated net assets of the Group in a net investment hedge.
The hedge ratio for each designation will be established by comparing the quantity of the hedging instrument and the quantity of the hedged item to determine their relative weighting; for all of the Group’s existing hedge relationships the hedge ratio has been determined as 1:1. Designated hedges are expected to be effective and therefore the impact of ineffectiveness on pro�t is not expected to be material. The accounting treatment for fair value hedges and debt designated as fair value through pro�t or loss is disclosed in the Group Accounting Policies section from page 172.
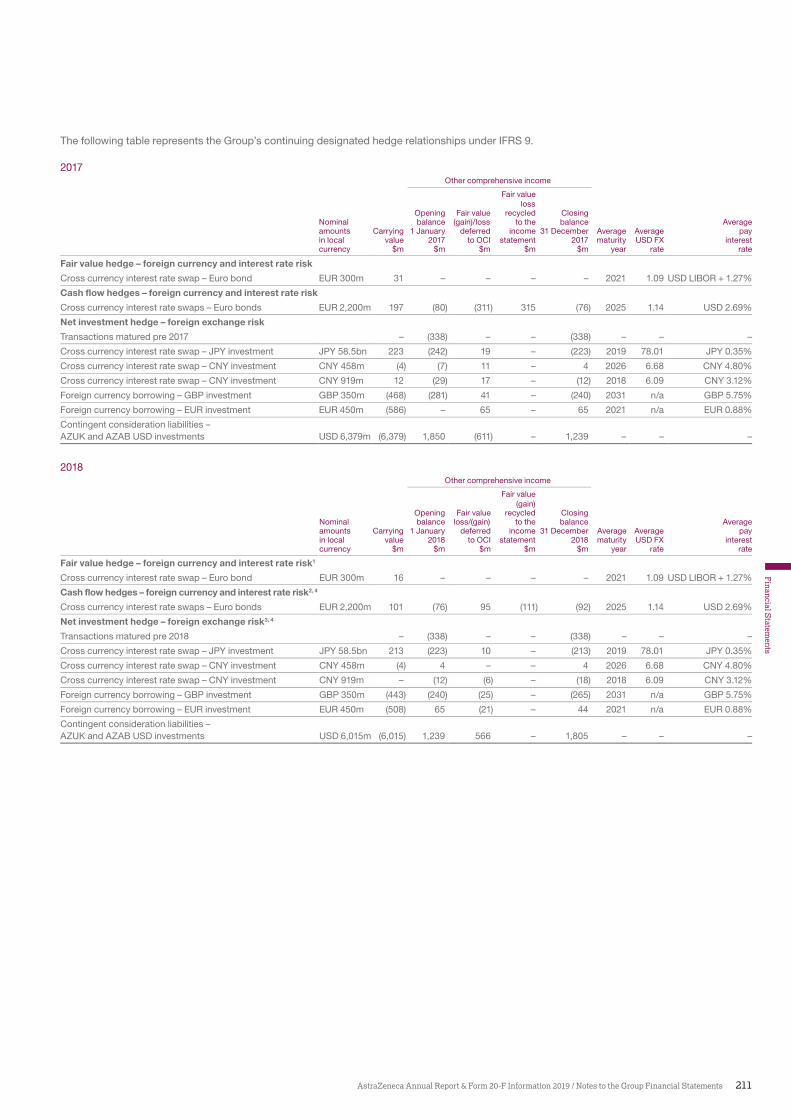
211AstraZeneca Annual Report & Form 20-F Information 2019 / Notes to the Group Financial Statements
Financial S
tatements
The following table represents the Group’s continuing designated hedge relationships under IFRS 9.
2017Other comprehensive income
Fair valueloss
Opening Fair value recycled ClosingNominal balance (gain)/loss to the balance Averageamounts Carrying 1 January deferred income 31 December Average Average payin local value 2017 to OCI statement 2017 maturity USD FX interestcurrency $m $m $m $m $m year rate rate
Fair value hedge – foreign currency and interest rate risk
Cross currency interest rate swap – Euro bond EUR 300m 31 – – – – 2021 1.09 USD LIBOR + 1.27%
Cash flow hedges – foreign currency and interest rate risk
Cross currency interest rate swaps – Euro bonds EUR 2,200m 197 (80) (311) 315 (76) 2025 1.14 USD 2.69%
Net investment hedge – foreign exchange risk
Transactions matured pre 2017 – (338) – – (338) – – –
Cross currency interest rate swap – JPY investment JPY 58.5bn 223 (242) 19 – (223) 2019 78.01 JPY 0.35%
Cross currency interest rate swap – CNY investment CNY 458m (4) (7) 11 – 4 2026 6.68 CNY 4.80%
Cross currency interest rate swap – CNY investment CNY 919m 12 (29) 17 – (12) 2018 6.09 CNY 3.12%
Foreign currency borrowing – GBP investment GBP 350m (468) (281) 41 – (240) 2031 n/a GBP 5.75%
Foreign currency borrowing – EUR investment EUR 450m (586) – 65 – 65 2021 n/a EUR 0.88%
Contingent consideration liabilities – AZUK and AZAB USD investments USD 6,379m (6,379) 1,850 (611) – 1,239 – – –
2018Other comprehensive income
Fair value(gain)
Opening Fair value recycled ClosingNominal balance loss/(gain) to the balance Averageamounts Carrying 1 January deferred income 31 December Average Average payin local value 2018 to OCI statement 2018 maturity USD FX interestcurrency $m $m $m $m $m year rate rate
Fair value hedge – foreign currency and interest rate risk1
Cross currency interest rate swap – Euro bond EUR 300m 16 – – – – 2021 1.09 USD LIBOR + 1.27%
Cash flow hedges – foreign currency and interest rate risk2, 4
Cross currency interest rate swaps – Euro bonds EUR 2,200m 101 (76) 95 (111) (92) 2025 1.14 USD 2.69%
Net investment hedge – foreign exchange risk3, 4
Transactions matured pre 2018 – (338) – – (338) – – –
Cross currency interest rate swap – JPY investment JPY 58.5bn 213 (223) 10 – (213) 2019 78.01 JPY 0.35%
Cross currency interest rate swap – CNY investment CNY 458m (4) 4 – – 4 2026 6.68 CNY 4.80%
Cross currency interest rate swap – CNY investment CNY 919m – (12) (6) – (18) 2018 6.09 CNY 3.12%
Foreign currency borrowing – GBP investment GBP 350m (443) (240) (25) – (265) 2031 n/a GBP 5.75%
Foreign currency borrowing – EUR investment EUR 450m (508) 65 (21) – 44 2021 n/a EUR 0.88%
Contingent consideration liabilities – AZUK and AZAB USD investments USD 6,015m (6,015) 1,239 566 – 1,805 – – –
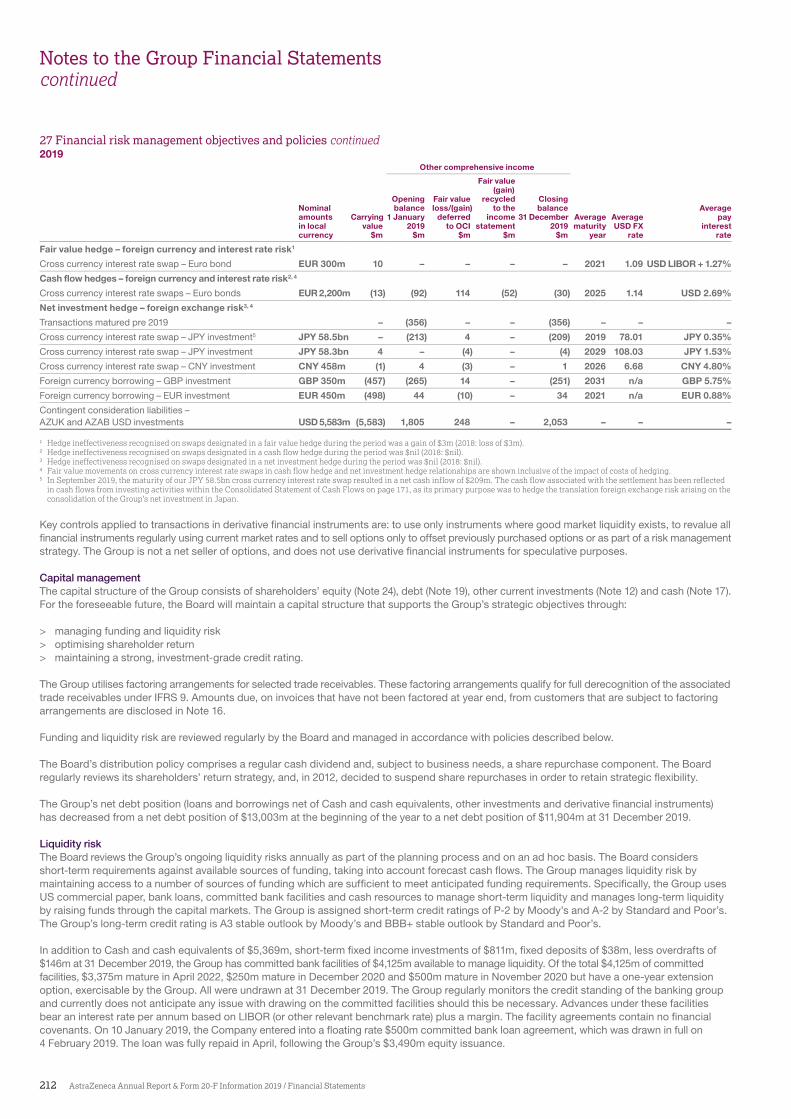
212 AstraZeneca Annual Report & Form 20-F Information 2019 / Financial Statements
Notes to the Group Financial Statementscontinued
2019Other comprehensive income
Fair value(gain)
Opening Fair value recycled ClosingNominal balance loss/(gain) to the balance Averageamounts Carrying 1 January deferred income 31 December Average Average payin local value 2019 to OCI statement 2019 maturity USD FX interestcurrency $m $m $m $m $m year rate rate
Fair value hedge – foreign currency and interest rate risk1
Cross currency interest rate swap – Euro bond EUR 300m 10 – – – – 2021 1.09 USD LIBOR + 1.27%
Cash flow hedges – foreign currency and interest rate risk2, 4
Cross currency interest rate swaps – Euro bonds EUR 2,200m (13) (92) 114 (52) (30) 2025 1.14 USD 2.69%
Net investment hedge – foreign exchange risk3, 4
Transactions matured pre 2019 – (356) – – (356) – – –
Cross currency interest rate swap – JPY investment5 JPY 58.5bn – (213) 4 – (209) 2019 78.01 JPY 0.35%
Cross currency interest rate swap – JPY investment JPY 58.3bn 4 – (4) – (4) 2029 108.03 JPY 1.53%
Cross currency interest rate swap – CNY investment CNY 458m (1) 4 (3) – 1 2026 6.68 CNY 4.80%
Foreign currency borrowing – GBP investment GBP 350m (457) (265) 14 – (251) 2031 n/a GBP 5.75%
Foreign currency borrowing – EUR investment EUR 450m (498) 44 (10) – 34 2021 n/a EUR 0.88%
Contingent consideration liabilities – AZUK and AZAB USD investments USD 5,583m (5,583) 1,805 248 – 2,053 – – –
1 Hedge ineffectiveness recognised on swaps designated in a fair value hedge during the period was a gain of $3m (2018: loss of $3m).2 Hedge ineffectiveness recognised on swaps designated in a cash flow hedge during the period was $nil (2018: $nil).3 Hedge ineffectiveness recognised on swaps designated in a net investment hedge during the period was $nil (2018: $nil).4 Fair value movements on cross currency interest rate swaps in cash flow hedge and net investment hedge relationships are shown inclusive of the impact of costs of hedging.5 In September 2019, the maturity of our JPY 58.5bn cross currency interest rate swap resulted in a net cash inflow of $209m. The cash flow associated with the settlement has been reflected
in cash flows from investing activities within the Consolidated Statement of Cash Flows on page 171, as its primary purpose was to hedge the translation foreign exchange risk arising on the consolidation of the Group’s net investment in Japan.
Key controls applied to transactions in derivative �nancial instruments are: to use only instruments where good market liquidity exists, to revalue all �nancial instruments regularly using current market rates and to sell options only to offset previously purchased options or as part of a risk management strategy. The Group is not a net seller of options, and does not use derivative �nancial instruments for speculative purposes.
Capital managementThe capital structure of the Group consists of shareholders’ equity (Note 24), debt (Note 19), other current investments (Note 12) and cash (Note 17). For the foreseeable future, the Board will maintain a capital structure that supports the Group’s strategic objectives through:
> managing funding and liquidity risk> optimising shareholder return> maintaining a strong, investment-grade credit rating.
The Group utilises factoring arrangements for selected trade receivables. These factoring arrangements qualify for full derecognition of the associated trade receivables under IFRS 9. Amounts due, on invoices that have not been factored at year end, from customers that are subject to factoring arrangements are disclosed in Note 16.
Funding and liquidity risk are reviewed regularly by the Board and managed in accordance with policies described below.
The Board’s distribution policy comprises a regular cash dividend and, subject to business needs, a share repurchase component. The Board regularly reviews its shareholders’ return strategy, and, in 2012, decided to suspend share repurchases in order to retain strategic �exibility.
The Group’s net debt position (loans and borrowings net of Cash and cash equivalents, other investments and derivative �nancial instruments) has decreased from a net debt position of $13,003m at the beginning of the year to a net debt position of $11,904m at 31 December 2019.
Liquidity riskThe Board reviews the Group’s ongoing liquidity risks annually as part of the planning process and on an ad hoc basis. The Board considers short-term requirements against available sources of funding, taking into account forecast cash �ows. The Group manages liquidity risk by maintaining access to a number of sources of funding which are suf�cient to meet anticipated funding requirements. Speci�cally, the Group uses US commercial paper, bank loans, committed bank facilities and cash resources to manage short-term liquidity and manages long-term liquidity by raising funds through the capital markets. The Group is assigned short-term credit ratings of P-2 by Moody’s and A-2 by Standard and Poor’s. The Group’s long-term credit rating is A3 stable outlook by Moody’s and BBB+ stable outlook by Standard and Poor’s.
In addition to Cash and cash equivalents of $5,369m, short-term �xed income investments of $811m, �xed deposits of $38m, less overdrafts of $146m at 31 December 2019, the Group has committed bank facilities of $4,125m available to manage liquidity. Of the total $4,125m of committed facilities, $3,375m mature in April 2022, $250m mature in December 2020 and $500m mature in November 2020 but have a one-year extension option, exercisable by the Group. All were undrawn at 31 December 2019. The Group regularly monitors the credit standing of the banking group and currently does not anticipate any issue with drawing on the committed facilities should this be necessary. Advances under these facilities bear an interest rate per annum based on LIBOR (or other relevant benchmark rate) plus a margin. The facility agreements contain no �nancial covenants. On 10 January 2019, the Company entered into a �oating rate $500m committed bank loan agreement, which was drawn in full on 4 February 2019. The loan was fully repaid in April, following the Group’s $3,490m equity issuance.
27 Financial risk management objectives and policies continued
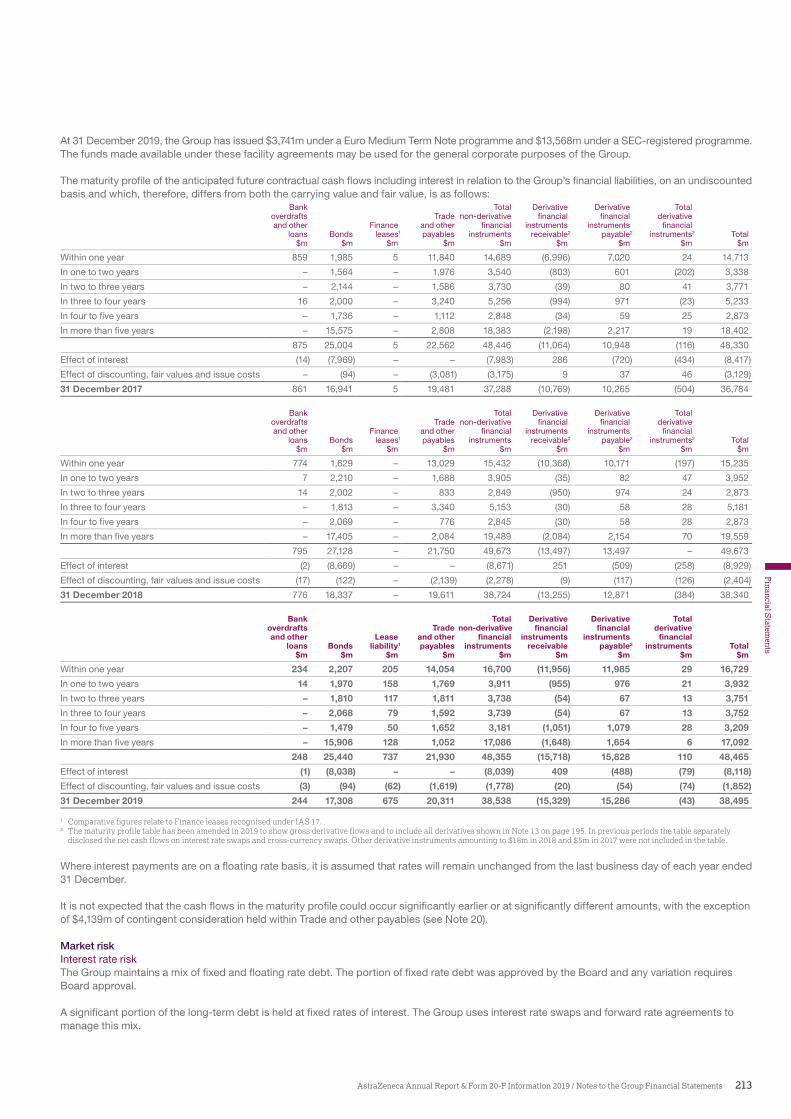
213AstraZeneca Annual Report & Form 20-F Information 2019 / Notes to the Group Financial Statements
Financial S
tatements
At 31 December 2019, the Group has issued $3,741m under a Euro Medium Term Note programme and $13,568m under a SEC-registered programme. The funds made available under these facility agreements may be used for the general corporate purposes of the Group.
The maturity pro�le of the anticipated future contractual cash �ows including interest in relation to the Group’s �nancial liabilities, on an undiscounted basis and which, therefore, differs from both the carrying value and fair value, is as follows:
Bank Total Derivative Derivative Totaloverdrafts Trade non-derivative �nancial �nancial derivativeand other Finance and other �nancial instruments instruments �nancial
loans Bonds leases1 payables instruments receivable2 payable2 instruments2 Total$m $m $m $m $m $m $m $m $m
Within one year 859 1,985 5 11,840 14,689 (6,996) 7,020 24 14,713
In one to two years – 1,564 – 1,976 3,540 (803) 601 (202) 3,338
In two to three years – 2,144 – 1,586 3,730 (39) 80 41 3,771
In three to four years 16 2,000 – 3,240 5,256 (994) 971 (23) 5,233
In four to five years – 1,736 – 1,112 2,848 (34) 59 25 2,873
In more than five years – 15,575 – 2,808 18,383 (2,198) 2,217 19 18,402
875 25,004 5 22,562 48,446 (11,064) 10,948 (116) 48,330
Effect of interest (14) (7,969) – – (7,983) 286 (720) (434) (8,417)
Effect of discounting, fair values and issue costs – (94) – (3,081) (3,175) 9 37 46 (3,129)
31 December 2017 861 16,941 5 19,481 37,288 (10,769) 10,265 (504) 36,784
Bank Total Derivative Derivative Totaloverdrafts Trade non-derivative �nancial �nancial derivativeand other Finance and other �nancial instruments instruments �nancial
loans Bonds leases1 payables instruments receivable2 payable2 instruments2 Total$m $m $m $m $m $m $m $m $m
Within one year 774 1,629 – 13,029 15,432 (10,368) 10,171 (197) 15,235
In one to two years 7 2,210 – 1,688 3,905 (35) 82 47 3,952
In two to three years 14 2,002 – 833 2,849 (950) 974 24 2,873
In three to four years – 1,813 – 3,340 5,153 (30) 58 28 5,181
In four to five years – 2,069 – 776 2,845 (30) 58 28 2,873
In more than five years – 17,405 – 2,084 19,489 (2,084) 2,154 70 19,559
795 27,128 – 21,750 49,673 (13,497) 13,497 – 49,673
Effect of interest (2) (8,669) – – (8,671) 251 (509) (258) (8,929)
Effect of discounting, fair values and issue costs (17) (122) – (2,139) (2,278) (9) (117) (126) (2,404)
31 December 2018 776 18,337 – 19,611 38,724 (13,255) 12,871 (384) 38,340
Bank Total Derivative Derivative Totaloverdrafts Trade non-derivative financial financial derivativeand other Lease and other financial instruments instruments financial
loans Bonds liability1 payables instruments receivable payable2 instruments Total$m $m $m $m $m $m $m $m $m
Within one year 234 2,207 205 14,054 16,700 (11,956) 11,985 29 16,729
In one to two years 14 1,970 158 1,769 3,911 (955) 976 21 3,932
In two to three years – 1,810 117 1,811 3,738 (54) 67 13 3,751
In three to four years – 2,068 79 1,592 3,739 (54) 67 13 3,752
In four to five years – 1,479 50 1,652 3,181 (1,051) 1,079 28 3,209
In more than five years – 15,906 128 1,052 17,086 (1,648) 1,654 6 17,092
248 25,440 737 21,930 48,355 (15,718) 15,828 110 48,465
Effect of interest (1) (8,038) – – (8,039) 409 (488) (79) (8,118)
Effect of discounting, fair values and issue costs (3) (94) (62) (1,619) (1,778) (20) (54) (74) (1,852)
31 December 2019 244 17,308 675 20,311 38,538 (15,329) 15,286 (43) 38,495
1 Comparative figures relate to Finance leases recognised under IAS 17.2 The maturity profile table has been amended in 2019 to show gross derivative flows and to include all derivatives shown in Note 13 on page 195. In previous periods the table separately
disclosed the net cash flows on interest rate swaps and cross-currency swaps. Other derivative instruments amounting to $18m in 2018 and $5m in 2017 were not included in the table.
Where interest payments are on a �oating rate basis, it is assumed that rates will remain unchanged from the last business day of each year ended 31 December.
It is not expected that the cash �ows in the maturity pro�le could occur signi�cantly earlier or at signi�cantly different amounts, with the exception of $4,139m of contingent consideration held within Trade and other payables (see Note 20).
Market riskInterest rate riskThe Group maintains a mix of �xed and �oating rate debt. The portion of �xed rate debt was approved by the Board and any variation requires Board approval.
A signi�cant portion of the long-term debt is held at �xed rates of interest. The Group uses interest rate swaps and forward rate agreements to manage this mix.
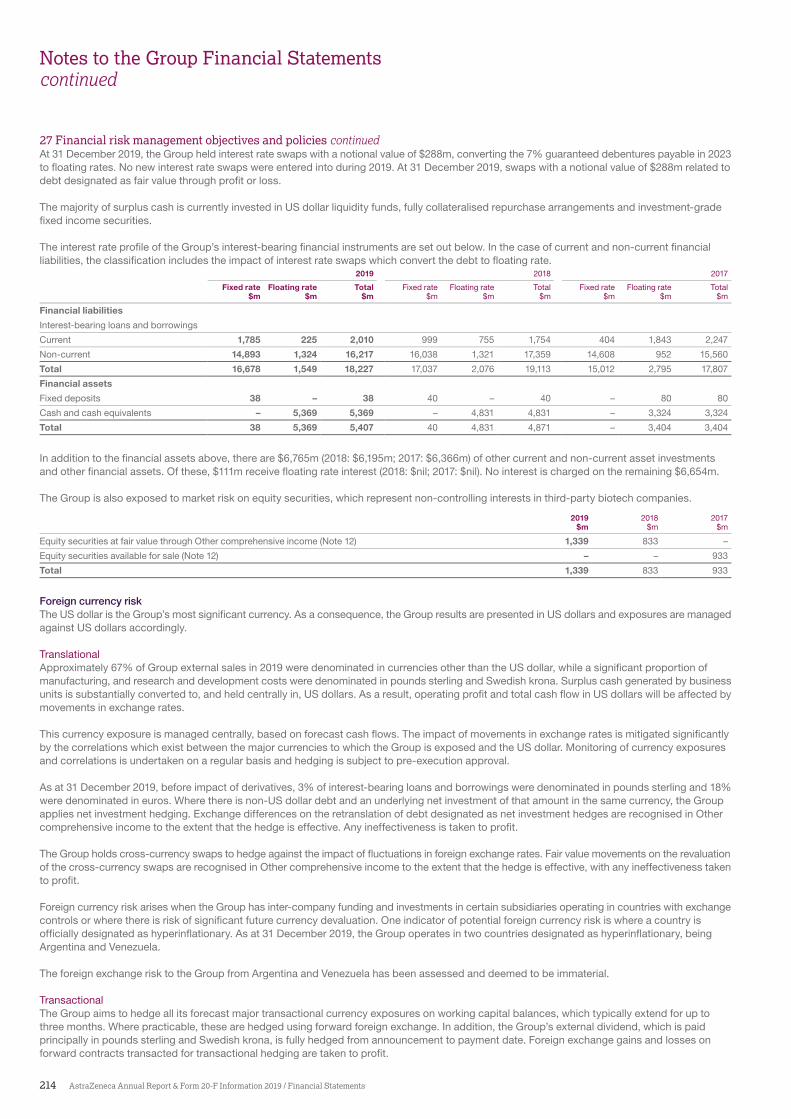
214 AstraZeneca Annual Report & Form 20-F Information 2019 / Financial Statements
Notes to the Group Financial Statementscontinued
At 31 December 2019, the Group held interest rate swaps with a notional value of $288m, converting the 7% guaranteed debentures payable in 2023 to �oating rates. No new interest rate swaps were entered into during 2019. At 31 December 2019, swaps with a notional value of $288m related to debt designated as fair value through pro�t or loss.
The majority of surplus cash is currently invested in US dollar liquidity funds, fully collateralised repurchase arrangements and investment-grade �xed income securities.
The interest rate pro�le of the Group’s interest-bearing �nancial instruments are set out below. In the case of current and non-current �nancial liabilities, the classi�cation includes the impact of interest rate swaps which convert the debt to �oating rate.
2019 2018 2017
Fixed rate Floating rate Total Fixed rate Floating rate Total Fixed rate Floating rate Total$m $m $m $m $m $m $m $m $m
Financial liabilities
Interest-bearing loans and borrowings
Current 1,785 225 2,010 999 755 1,754 404 1,843 2,247
Non-current 14,893 1,324 16,217 16,038 1,321 17,359 14,608 952 15,560
Total 16,678 1,549 18,227 17,037 2,076 19,113 15,012 2,795 17,807
Financial assets
Fixed deposits 38 – 38 40 – 40 – 80 80
Cash and cash equivalents – 5,369 5,369 – 4,831 4,831 – 3,324 3,324
Total 38 5,369 5,407 40 4,831 4,871 – 3,404 3,404
In addition to the �nancial assets above, there are $6,765m (2018: $6,195m; 2017: $6,366m) of other current and non-current asset investments and other �nancial assets. Of these, $111m receive �oating rate interest (2018: $nil; 2017: $nil). No interest is charged on the remaining $6,654m.
The Group is also exposed to market risk on equity securities, which represent non-controlling interests in third-party biotech companies.
2019 2018 2017$m $m $m
Equity securities at fair value through Other comprehensive income (Note 12) 1,339 833 –
Equity securities available for sale (Note 12) – – 933
Total 1,339 833 933
Foreign currency riskThe US dollar is the Group’s most signi�cant currency. As a consequence, the Group results are presented in US dollars and exposures are managed against US dollars accordingly.
TranslationalApproximately 67% of Group external sales in 2019 were denominated in currencies other than the US dollar, while a signi�cant proportion of manufacturing, and research and development costs were denominated in pounds sterling and Swedish krona. Surplus cash generated by business units is substantially converted to, and held centrally in, US dollars. As a result, operating pro�t and total cash �ow in US dollars will be affected by movements in exchange rates.
This currency exposure is managed centrally, based on forecast cash �ows. The impact of movements in exchange rates is mitigated signi�cantly by the correlations which exist between the major currencies to which the Group is exposed and the US dollar. Monitoring of currency exposures and correlations is undertaken on a regular basis and hedging is subject to pre-execution approval.
As at 31 December 2019, before impact of derivatives, 3% of interest-bearing loans and borrowings were denominated in pounds sterling and 18% were denominated in euros. Where there is non-US dollar debt and an underlying net investment of that amount in the same currency, the Group applies net investment hedging. Exchange differences on the retranslation of debt designated as net investment hedges are recognised in Other comprehensive income to the extent that the hedge is effective. Any ineffectiveness is taken to pro�t.
The Group holds cross-currency swaps to hedge against the impact of �uctuations in foreign exchange rates. Fair value movements on the revaluation of the cross-currency swaps are recognised in Other comprehensive income to the extent that the hedge is effective, with any ineffectiveness taken to pro�t.
Foreign currency risk arises when the Group has inter-company funding and investments in certain subsidiaries operating in countries with exchange controls or where there is risk of signi�cant future currency devaluation. One indicator of potential foreign currency risk is where a country is of�cially designated as hyperin�ationary. As at 31 December 2019, the Group operates in two countries designated as hyperin�ationary, being Argentina and Venezuela.
The foreign exchange risk to the Group from Argentina and Venezuela has been assessed and deemed to be immaterial.
TransactionalThe Group aims to hedge all its forecast major transactional currency exposures on working capital balances, which typically extend for up to three months. Where practicable, these are hedged using forward foreign exchange. In addition, the Group’s external dividend, which is paid principally in pounds sterling and Swedish krona, is fully hedged from announcement to payment date. Foreign exchange gains and losses on forward contracts transacted for transactional hedging are taken to pro�t.
27 Financial risk management objectives and policies continued
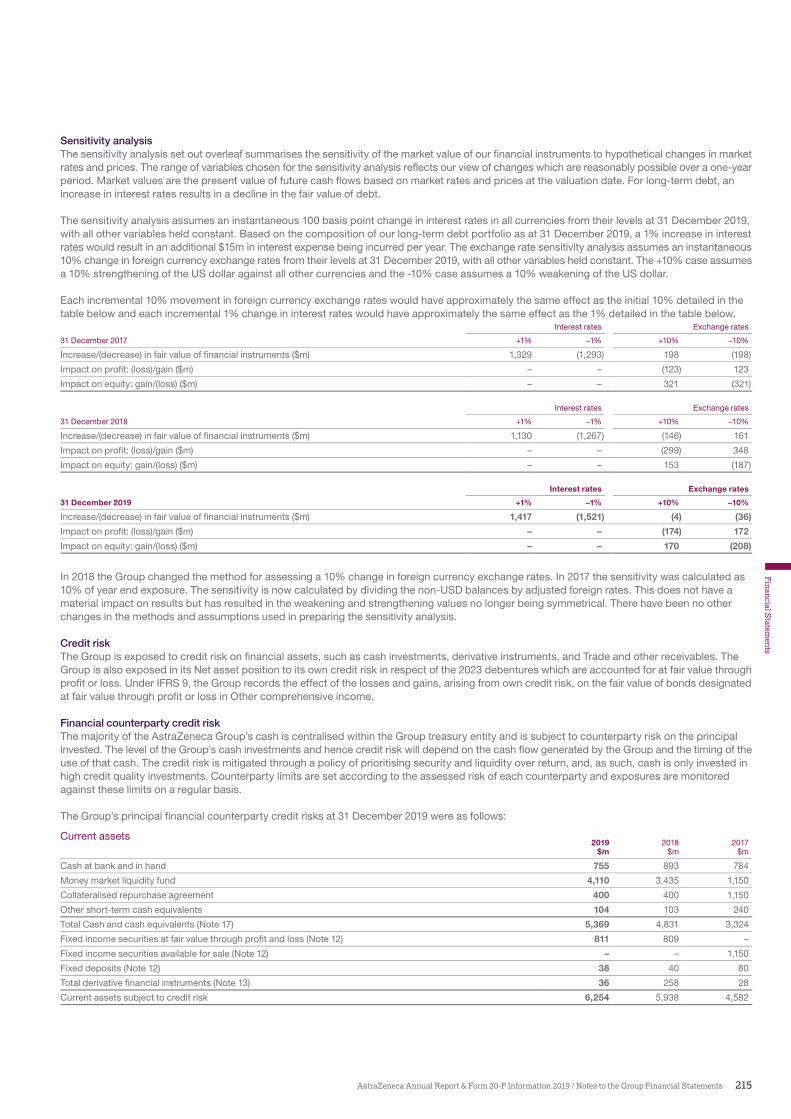
215AstraZeneca Annual Report & Form 20-F Information 2019 / Notes to the Group Financial Statements
Financial S
tatements
Sensitivity analysisThe sensitivity analysis set out overleaf summarises the sensitivity of the market value of our �nancial instruments to hypothetical changes in market rates and prices. The range of variables chosen for the sensitivity analysis re�ects our view of changes which are reasonably possible over a one-year period. Market values are the present value of future cash �ows based on market rates and prices at the valuation date. For long-term debt, an increase in interest rates results in a decline in the fair value of debt.
The sensitivity analysis assumes an instantaneous 100 basis point change in interest rates in all currencies from their levels at 31 December 2019, with all other variables held constant. Based on the composition of our long-term debt portfolio as at 31 December 2019, a 1% increase in interest rates would result in an additional $15m in interest expense being incurred per year. The exchange rate sensitivity analysis assumes an instantaneous 10% change in foreign currency exchange rates from their levels at 31 December 2019, with all other variables held constant. The +10% case assumes a 10% strengthening of the US dollar against all other currencies and the -10% case assumes a 10% weakening of the US dollar.
Each incremental 10% movement in foreign currency exchange rates would have approximately the same effect as the initial 10% detailed in the table below and each incremental 1% change in interest rates would have approximately the same effect as the 1% detailed in the table below.
Interest rates Exchange rates
31 December 2017 +1% −1% +10% −10%
Increase/(decrease) in fair value of financial instruments ($m) 1,329 (1,293) 198 (198)
Impact on profit: (loss)/gain ($m) – – (123) 123
Impact on equity: gain/(loss) ($m) – – 321 (321)
Interest rates Exchange rates
31 December 2018 +1% −1% +10% −10%
Increase/(decrease) in fair value of financial instruments ($m) 1,130 (1,267) (146) 161
Impact on profit: (loss)/gain ($m) – – (299) 348
Impact on equity: gain/(loss) ($m) – – 153 (187)
Interest rates Exchange rates
31 December 2019 +1% −1% +10% −10%
Increase/(decrease) in fair value of financial instruments ($m) 1,417 (1,521) (4) (36)
Impact on profit: (loss)/gain ($m) – – (174) 172
Impact on equity: gain/(loss) ($m) – – 170 (208)
In 2018 the Group changed the method for assessing a 10% change in foreign currency exchange rates. In 2017 the sensitivity was calculated as 10% of year end exposure. The sensitivity is now calculated by dividing the non-USD balances by adjusted foreign rates. This does not have a material impact on results but has resulted in the weakening and strengthening values no longer being symmetrical. There have been no other changes in the methods and assumptions used in preparing the sensitivity analysis.
Credit riskThe Group is exposed to credit risk on �nancial assets, such as cash investments, derivative instruments, and Trade and other receivables. The Group is also exposed in its Net asset position to its own credit risk in respect of the 2023 debentures which are accounted for at fair value through pro�t or loss. Under IFRS 9, the Group records the effect of the losses and gains, arising from own credit risk, on the fair value of bonds designated at fair value through pro�t or loss in Other comprehensive income.
Financial counterparty credit riskThe majority of the AstraZeneca Group’s cash is centralised within the Group treasury entity and is subject to counterparty risk on the principal invested. The level of the Group’s cash investments and hence credit risk will depend on the cash �ow generated by the Group and the timing of the use of that cash. The credit risk is mitigated through a policy of prioritising security and liquidity over return, and, as such, cash is only invested in high credit quality investments. Counterparty limits are set according to the assessed risk of each counterparty and exposures are monitored against these limits on a regular basis.
The Group’s principal �nancial counterparty credit risks at 31 December 2019 were as follows:
Current assets2019 2018 2017
$m $m $m
Cash at bank and in hand 755 893 784
Money market liquidity fund 4,110 3,435 1,150
Collateralised repurchase agreement 400 400 1,150
Other short-term cash equivalents 104 103 240
Total Cash and cash equivalents (Note 17) 5,369 4,831 3,324
Fixed income securities at fair value through profit and loss (Note 12) 811 809 –
Fixed income securities available for sale (Note 12) – – 1,150
Fixed deposits (Note 12) 38 40 80
Total derivative financial instruments (Note 13) 36 258 28
Current assets subject to credit risk 6,254 5,938 4,582
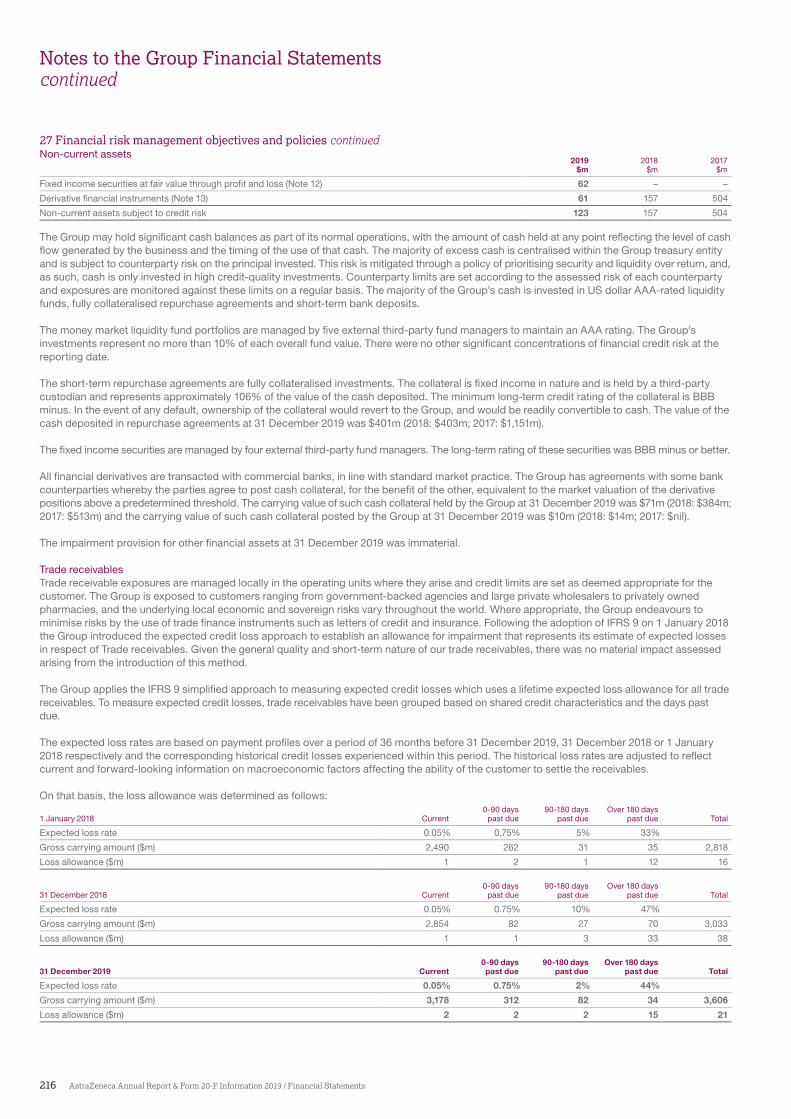
216 AstraZeneca Annual Report & Form 20-F Information 2019 / Financial Statements
Notes to the Group Financial Statementscontinued
Non-current assets2019 2018 2017
$m $m $m
Fixed income securities at fair value through profit and loss (Note 12) 62 – –
Derivative financial instruments (Note 13) 61 157 504
Non-current assets subject to credit risk 123 157 504
The Group may hold signi�cant cash balances as part of its normal operations, with the amount of cash held at any point re�ecting the level of cash �ow generated by the business and the timing of the use of that cash. The majority of excess cash is centralised within the Group treasury entity and is subject to counterparty risk on the principal invested. This risk is mitigated through a policy of prioritising security and liquidity over return, and, as such, cash is only invested in high credit-quality investments. Counterparty limits are set according to the assessed risk of each counterparty and exposures are monitored against these limits on a regular basis. The majority of the Group’s cash is invested in US dollar AAA-rated liquidity funds, fully collateralised repurchase agreements and short-term bank deposits.
The money market liquidity fund portfolios are managed by �ve external third-party fund managers to maintain an AAA rating. The Group’s investments represent no more than 10% of each overall fund value. There were no other signi�cant concentrations of �nancial credit risk at the reporting date.
The short-term repurchase agreements are fully collateralised investments. The collateral is �xed income in nature and is held by a third-party custodian and represents approximately 106% of the value of the cash deposited. The minimum long-term credit rating of the collateral is BBB minus. In the event of any default, ownership of the collateral would revert to the Group, and would be readily convertible to cash. The value of the cash deposited in repurchase agreements at 31 December 2019 was $401m (2018: $403m; 2017: $1,151m).
The �xed income securities are managed by four external third-party fund managers. The long-term rating of these securities was BBB minus or better.
All �nancial derivatives are transacted with commercial banks, in line with standard market practice. The Group has agreements with some bank counterparties whereby the parties agree to post cash collateral, for the bene�t of the other, equivalent to the market valuation of the derivative positions above a predetermined threshold. The carrying value of such cash collateral held by the Group at 31 December 2019 was $71m (2018: $384m; 2017: $513m) and the carrying value of such cash collateral posted by the Group at 31 December 2019 was $10m (2018: $14m; 2017: $nil).
The impairment provision for other �nancial assets at 31 December 2019 was immaterial.
Trade receivablesTrade receivable exposures are managed locally in the operating units where they arise and credit limits are set as deemed appropriate for the customer. The Group is exposed to customers ranging from government-backed agencies and large private wholesalers to privately owned pharmacies, and the underlying local economic and sovereign risks vary throughout the world. Where appropriate, the Group endeavours to minimise risks by the use of trade �nance instruments such as letters of credit and insurance. Following the adoption of IFRS 9 on 1 January 2018 the Group introduced the expected credit loss approach to establish an allowance for impairment that represents its estimate of expected losses in respect of Trade receivables. Given the general quality and short-term nature of our trade receivables, there was no material impact assessed arising from the introduction of this method.
The Group applies the IFRS 9 simpli�ed approach to measuring expected credit losses which uses a lifetime expected loss allowance for all trade receivables. To measure expected credit losses, trade receivables have been grouped based on shared credit characteristics and the days past due.
The expected loss rates are based on payment pro�les over a period of 36 months before 31 December 2019, 31 December 2018 or 1 January 2018 respectively and the corresponding historical credit losses experienced within this period. The historical loss rates are adjusted to re�ect current and forward-looking information on macroeconomic factors affecting the ability of the customer to settle the receivables.
On that basis, the loss allowance was determined as follows:0-90 days 90-180 days Over 180 days
1 January 2018 Current past due past due past due Total
Expected loss rate 0.05% 0.75% 5% 33%
Gross carrying amount ($m) 2,490 262 31 35 2,818
Loss allowance ($m) 1 2 1 12 16
0-90 days 90-180 days Over 180 days31 December 2018 Current past due past due past due Total
Expected loss rate 0.05% 0.75% 10% 47%
Gross carrying amount ($m) 2,854 82 27 70 3,033
Loss allowance ($m) 1 1 3 33 38
0-90 days 90-180 days Over 180 days31 December 2019 Current past due past due past due Total
Expected loss rate 0.05% 0.75% 2% 44%
Gross carrying amount ($m) 3,178 312 82 34 3,606
Loss allowance ($m) 2 2 2 15 21
27 Financial risk management objectives and policies continued
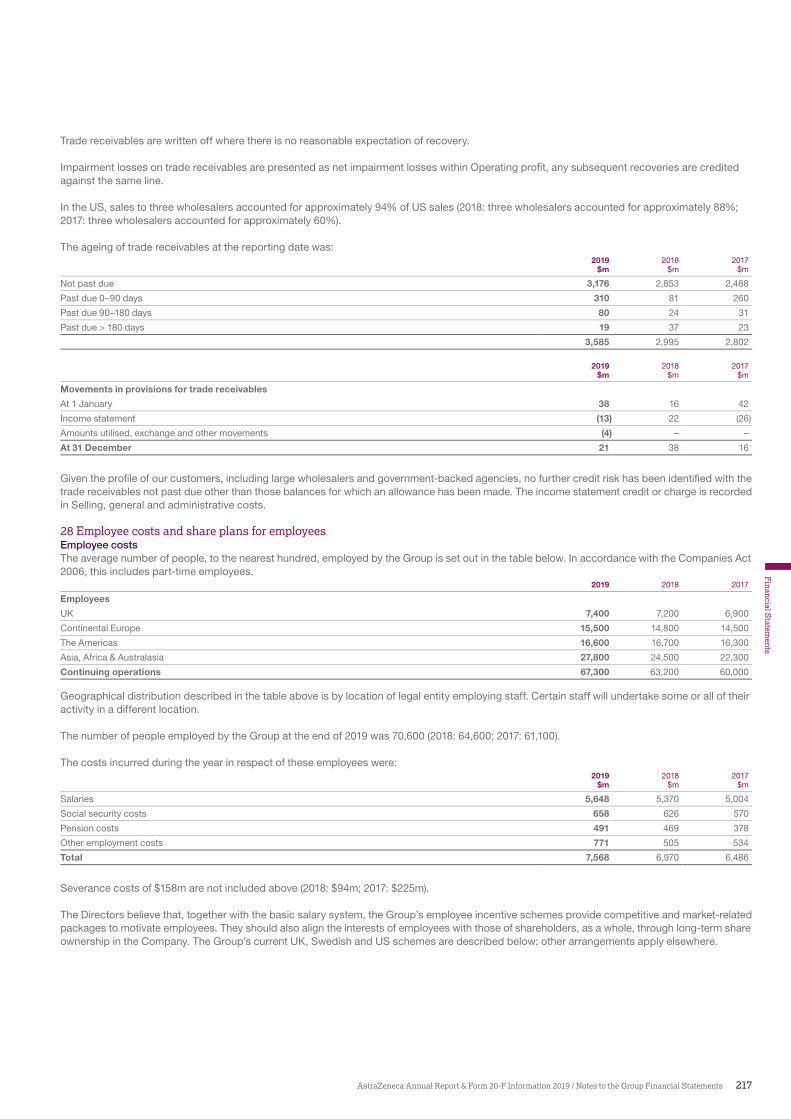
217AstraZeneca Annual Report & Form 20-F Information 2019 / Notes to the Group Financial Statements
Financial S
tatements
Trade receivables are written off where there is no reasonable expectation of recovery.
Impairment losses on trade receivables are presented as net impairment losses within Operating pro�t, any subsequent recoveries are credited against the same line.
In the US, sales to three wholesalers accounted for approximately 94% of US sales (2018: three wholesalers accounted for approximately 88%; 2017: three wholesalers accounted for approximately 60%).
The ageing of trade receivables at the reporting date was:2019 2018 2017
$m $m $m
Not past due 3,176 2,853 2,488
Past due 0–90 days 310 81 260
Past due 90–180 days 80 24 31
Past due > 180 days 19 37 23
3,585 2,995 2,802
2019 2018 2017$m $m $m
Movements in provisions for trade receivables
At 1 January 38 16 42
Income statement (13) 22 (26)
Amounts utilised, exchange and other movements (4) – –
At 31 December 21 38 16
Given the pro�le of our customers, including large wholesalers and government-backed agencies, no further credit risk has been identi�ed with the trade receivables not past due other than those balances for which an allowance has been made. The income statement credit or charge is recorded in Selling, general and administrative costs.
28 Employee costs and share plans for employeesEmployee costsThe average number of people, to the nearest hundred, employed by the Group is set out in the table below. In accordance with the Companies Act 2006, this includes part-time employees.
2019 2018 2017
Employees
UK 7,400 7,200 6,900
Continental Europe 15,500 14,800 14,500
The Americas 16,600 16,700 16,300
Asia, Africa & Australasia 27,800 24,500 22,300
Continuing operations 67,300 63,200 60,000
Geographical distribution described in the table above is by location of legal entity employing staff. Certain staff will undertake some or all of their activity in a different location.
The number of people employed by the Group at the end of 2019 was 70,600 (2018: 64,600; 2017: 61,100).
The costs incurred during the year in respect of these employees were:2019 2018 2017
$m $m $m
Salaries 5,648 5,370 5,004
Social security costs 658 626 570
Pension costs 491 469 378
Other employment costs 771 505 534
Total 7,568 6,970 6,486
Severance costs of $158m are not included above (2018: $94m; 2017: $225m).
The Directors believe that, together with the basic salary system, the Group’s employee incentive schemes provide competitive and market-related packages to motivate employees. They should also align the interests of employees with those of shareholders, as a whole, through long-term share ownership in the Company. The Group’s current UK, Swedish and US schemes are described below; other arrangements apply elsewhere.
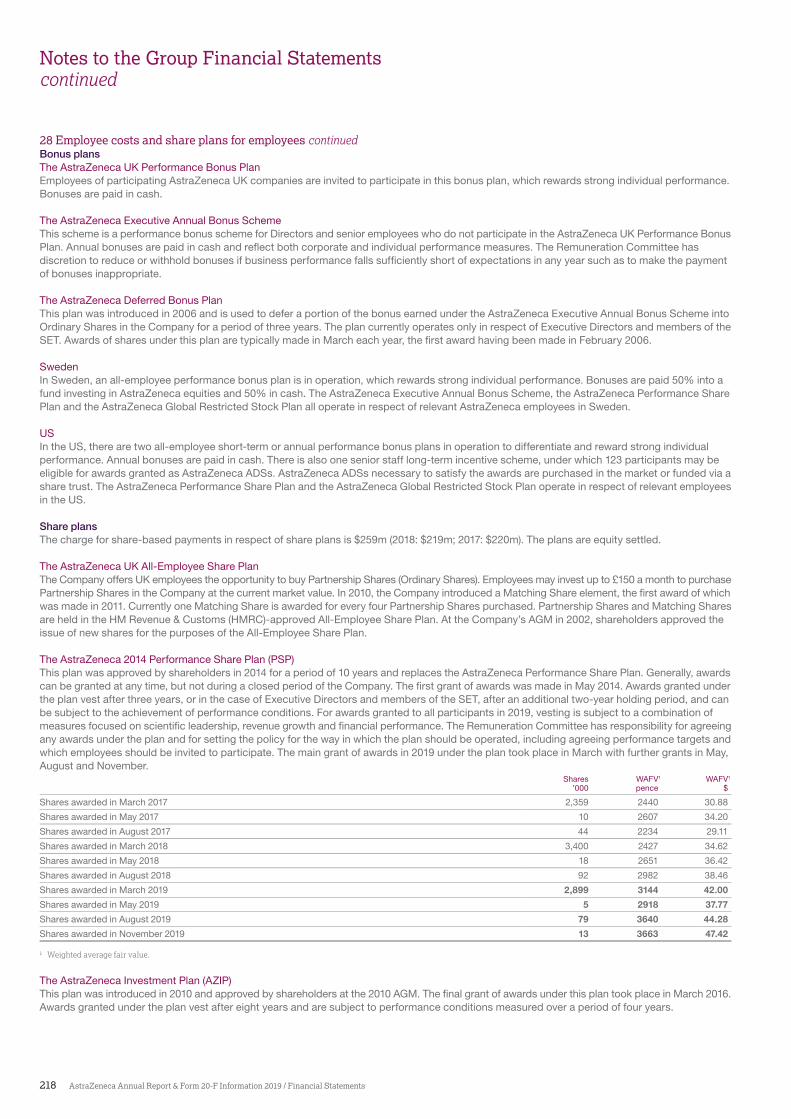
218 AstraZeneca Annual Report & Form 20-F Information 2019 / Financial Statements
Notes to the Group Financial Statementscontinued
Bonus plansThe AstraZeneca UK Performance Bonus PlanEmployees of participating AstraZeneca UK companies are invited to participate in this bonus plan, which rewards strong individual performance. Bonuses are paid in cash.
The AstraZeneca Executive Annual Bonus SchemeThis scheme is a performance bonus scheme for Directors and senior employees who do not participate in the AstraZeneca UK Performance Bonus Plan. Annual bonuses are paid in cash and re�ect both corporate and individual performance measures. The Remuneration Committee has discretion to reduce or withhold bonuses if business performance falls suf�ciently short of expectations in any year such as to make the payment of bonuses inappropriate.
The AstraZeneca Deferred Bonus PlanThis plan was introduced in 2006 and is used to defer a portion of the bonus earned under the AstraZeneca Executive Annual Bonus Scheme into Ordinary Shares in the Company for a period of three years. The plan currently operates only in respect of Executive Directors and members of the SET. Awards of shares under this plan are typically made in March each year, the �rst award having been made in February 2006.
SwedenIn Sweden, an all-employee performance bonus plan is in operation, which rewards strong individual performance. Bonuses are paid 50% into a fund investing in AstraZeneca equities and 50% in cash. The AstraZeneca Executive Annual Bonus Scheme, the AstraZeneca Performance Share Plan and the AstraZeneca Global Restricted Stock Plan all operate in respect of relevant AstraZeneca employees in Sweden.
USIn the US, there are two all-employee short-term or annual performance bonus plans in operation to differentiate and reward strong individual performance. Annual bonuses are paid in cash. There is also one senior staff long-term incentive scheme, under which 123 participants may be eligible for awards granted as AstraZeneca ADSs. AstraZeneca ADSs necessary to satisfy the awards are purchased in the market or funded via a share trust. The AstraZeneca Performance Share Plan and the AstraZeneca Global Restricted Stock Plan operate in respect of relevant employees in the US.
Share plansThe charge for share-based payments in respect of share plans is $259m (2018: $219m; 2017: $220m). The plans are equity settled.
The AstraZeneca UK All-Employee Share PlanThe Company offers UK employees the opportunity to buy Partnership Shares (Ordinary Shares). Employees may invest up to £150 a month to purchase Partnership Shares in the Company at the current market value. In 2010, the Company introduced a Matching Share element, the �rst award of which was made in 2011. Currently one Matching Share is awarded for every four Partnership Shares purchased. Partnership Shares and Matching Shares are held in the HM Revenue & Customs (HMRC)-approved All-Employee Share Plan. At the Company’s AGM in 2002, shareholders approved the issue of new shares for the purposes of the All-Employee Share Plan.
The AstraZeneca 2014 Performance Share Plan (PSP)This plan was approved by shareholders in 2014 for a period of 10 years and replaces the AstraZeneca Performance Share Plan. Generally, awards can be granted at any time, but not during a closed period of the Company. The �rst grant of awards was made in May 2014. Awards granted under the plan vest after three years, or in the case of Executive Directors and members of the SET, after an additional two-year holding period, and can be subject to the achievement of performance conditions. For awards granted to all participants in 2019, vesting is subject to a combination of measures focused on scienti�c leadership, revenue growth and �nancial performance. The Remuneration Committee has responsibility for agreeing any awards under the plan and for setting the policy for the way in which the plan should be operated, including agreeing performance targets and which employees should be invited to participate. The main grant of awards in 2019 under the plan took place in March with further grants in May, August and November.
Shares WAFV1 WAFV1
’000 pence $
Shares awarded in March 2017 2,359 2440 30.88
Shares awarded in May 2017 10 2607 34.20
Shares awarded in August 2017 44 2234 29.11
Shares awarded in March 2018 3,400 2427 34.62
Shares awarded in May 2018 18 2651 36.42
Shares awarded in August 2018 92 2982 38.46
Shares awarded in March 2019 2,899 3144 42.00
Shares awarded in May 2019 5 2918 37.77
Shares awarded in August 2019 79 3640 44.28
Shares awarded in November 2019 13 3663 47.42
1 Weighted average fair value.
The AstraZeneca Investment Plan (AZIP)This plan was introduced in 2010 and approved by shareholders at the 2010 AGM. The �nal grant of awards under this plan took place in March 2016. Awards granted under the plan vest after eight years and are subject to performance conditions measured over a period of four years.
28 Employee costs and share plans for employees continued
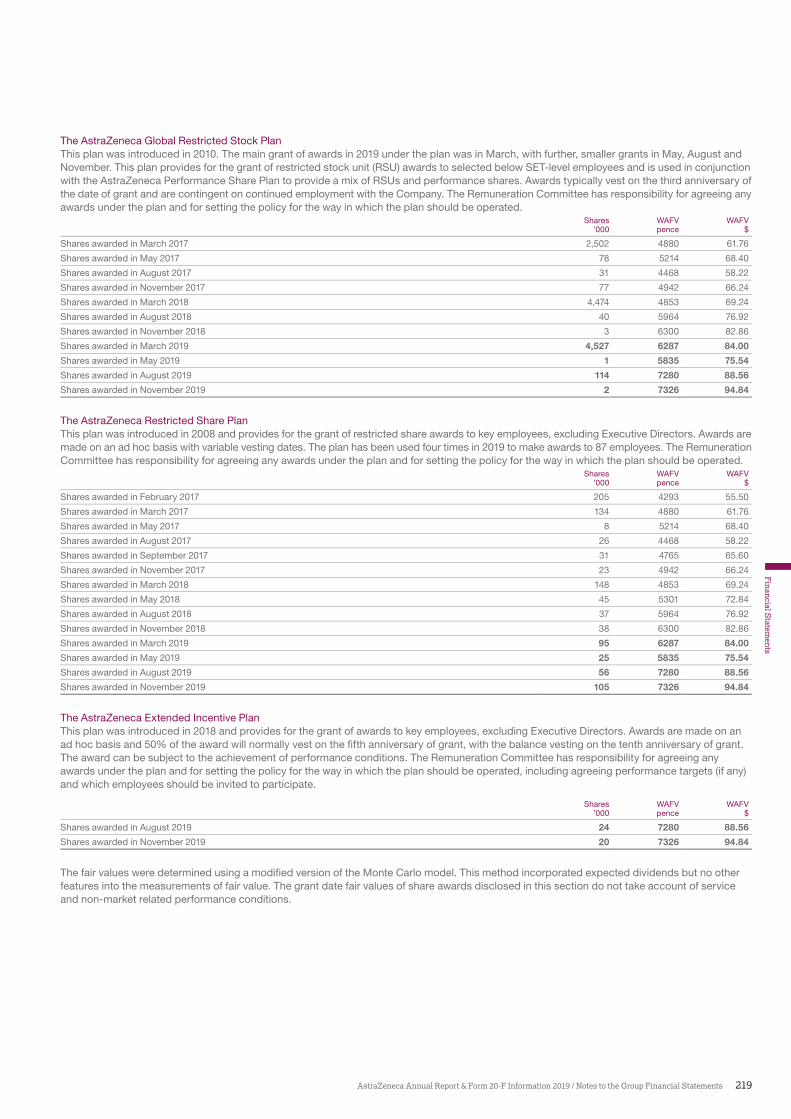
219AstraZeneca Annual Report & Form 20-F Information 2019 / Notes to the Group Financial Statements
Financial S
tatements
The AstraZeneca Global Restricted Stock PlanThis plan was introduced in 2010. The main grant of awards in 2019 under the plan was in March, with further, smaller grants in May, August and November. This plan provides for the grant of restricted stock unit (RSU) awards to selected below SET-level employees and is used in conjunction with the AstraZeneca Performance Share Plan to provide a mix of RSUs and performance shares. Awards typically vest on the third anniversary of the date of grant and are contingent on continued employment with the Company. The Remuneration Committee has responsibility for agreeing any awards under the plan and for setting the policy for the way in which the plan should be operated.
Shares WAFV WAFV’000 pence $
Shares awarded in March 2017 2,502 4880 61.76
Shares awarded in May 2017 78 5214 68.40
Shares awarded in August 2017 31 4468 58.22
Shares awarded in November 2017 77 4942 66.24
Shares awarded in March 2018 4,474 4853 69.24
Shares awarded in August 2018 40 5964 76.92
Shares awarded in November 2018 3 6300 82.86
Shares awarded in March 2019 4,527 6287 84.00
Shares awarded in May 2019 1 5835 75.54
Shares awarded in August 2019 114 7280 88.56
Shares awarded in November 2019 2 7326 94.84
The AstraZeneca Restricted Share PlanThis plan was introduced in 2008 and provides for the grant of restricted share awards to key employees, excluding Executive Directors. Awards are made on an ad hoc basis with variable vesting dates. The plan has been used four times in 2019 to make awards to 87 employees. The Remuneration Committee has responsibility for agreeing any awards under the plan and for setting the policy for the way in which the plan should be operated.
Shares WAFV WAFV’000 pence $
Shares awarded in February 2017 205 4293 55.50
Shares awarded in March 2017 134 4880 61.76
Shares awarded in May 2017 8 5214 68.40
Shares awarded in August 2017 26 4468 58.22
Shares awarded in September 2017 31 4765 65.60
Shares awarded in November 2017 23 4942 66.24
Shares awarded in March 2018 148 4853 69.24
Shares awarded in May 2018 45 5301 72.84
Shares awarded in August 2018 37 5964 76.92
Shares awarded in November 2018 38 6300 82.86
Shares awarded in March 2019 95 6287 84.00
Shares awarded in May 2019 25 5835 75.54
Shares awarded in August 2019 56 7280 88.56
Shares awarded in November 2019 105 7326 94.84
The AstraZeneca Extended Incentive PlanThis plan was introduced in 2018 and provides for the grant of awards to key employees, excluding Executive Directors. Awards are made on an ad hoc basis and 50% of the award will normally vest on the �fth anniversary of grant, with the balance vesting on the tenth anniversary of grant. The award can be subject to the achievement of performance conditions. The Remuneration Committee has responsibility for agreeing any awards under the plan and for setting the policy for the way in which the plan should be operated, including agreeing performance targets (if any) and which employees should be invited to participate.
Shares WAFV WAFV’000 pence $
Shares awarded in August 2019 24 7280 88.56
Shares awarded in November 2019 20 7326 94.84
The fair values were determined using a modi�ed version of the Monte Carlo model. This method incorporated expected dividends but no other features into the measurements of fair value. The grant date fair values of share awards disclosed in this section do not take account of service and non-market related performance conditions.
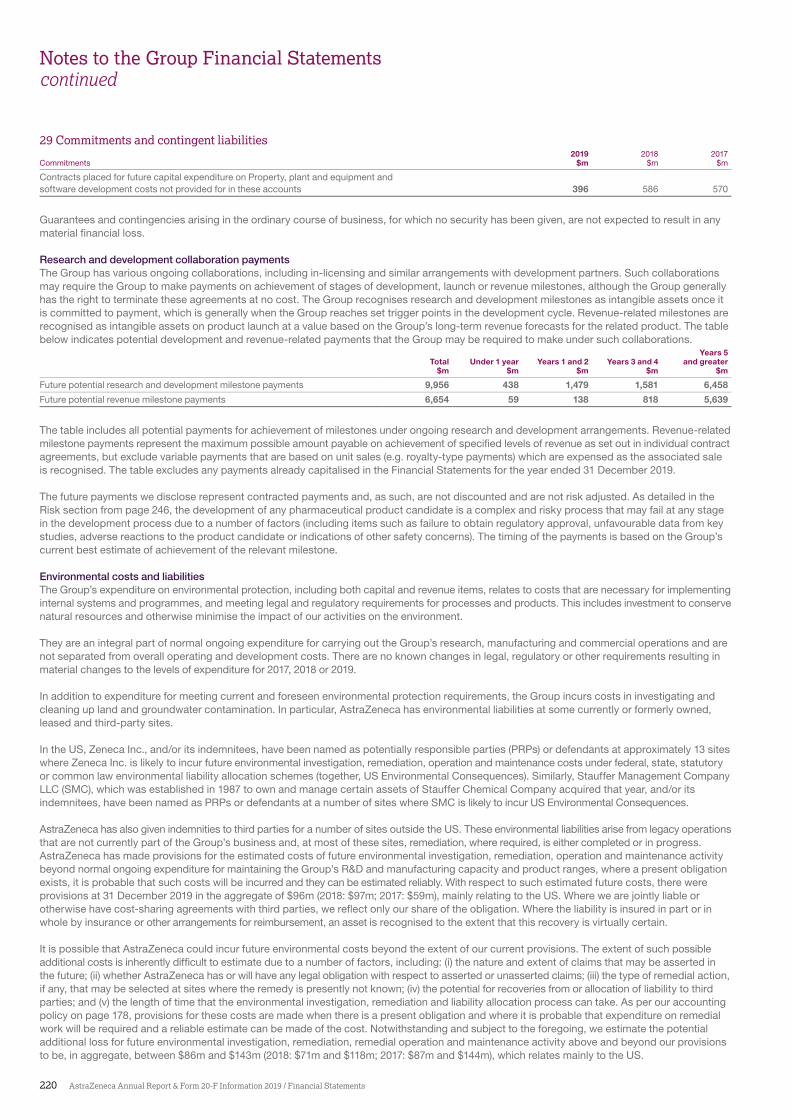
220 AstraZeneca Annual Report & Form 20-F Information 2019 / Financial Statements
Notes to the Group Financial Statementscontinued
29 Commitments and contingent liabilities2019 2018 2017
Commitments $m $m $m
Contracts placed for future capital expenditure on Property, plant and equipment and software development costs not provided for in these accounts 396 586 570
Guarantees and contingencies arising in the ordinary course of business, for which no security has been given, are not expected to result in any material �nancial loss.
Research and development collaboration paymentsThe Group has various ongoing collaborations, including in-licensing and similar arrangements with development partners. Such collaborations may require the Group to make payments on achievement of stages of development, launch or revenue milestones, although the Group generally has the right to terminate these agreements at no cost. The Group recognises research and development milestones as intangible assets once it is committed to payment, which is generally when the Group reaches set trigger points in the development cycle. Revenue-related milestones are recognised as intangible assets on product launch at a value based on the Group’s long-term revenue forecasts for the related product. The table below indicates potential development and revenue-related payments that the Group may be required to make under such collaborations.
Years 5Total Under 1 year Years 1 and 2 Years 3 and 4 and greater
$m $m $m $m $m
Future potential research and development milestone payments 9,956 438 1,479 1,581 6,458
Future potential revenue milestone payments 6,654 59 138 818 5,639
The table includes all potential payments for achievement of milestones under ongoing research and development arrangements. Revenue-related milestone payments represent the maximum possible amount payable on achievement of speci�ed levels of revenue as set out in individual contract agreements, but exclude variable payments that are based on unit sales (e.g. royalty-type payments) which are expensed as the associated sale is recognised. The table excludes any payments already capitalised in the Financial Statements for the year ended 31 December 2019.
The future payments we disclose represent contracted payments and, as such, are not discounted and are not risk adjusted. As detailed in the Risk section from page 246, the development of any pharmaceutical product candidate is a complex and risky process that may fail at any stage in the development process due to a number of factors (including items such as failure to obtain regulatory approval, unfavourable data from key studies, adverse reactions to the product candidate or indications of other safety concerns). The timing of the payments is based on the Group’s current best estimate of achievement of the relevant milestone.
Environmental costs and liabilitiesThe Group’s expenditure on environmental protection, including both capital and revenue items, relates to costs that are necessary for implementing internal systems and programmes, and meeting legal and regulatory requirements for processes and products. This includes investment to conserve natural resources and otherwise minimise the impact of our activities on the environment.
They are an integral part of normal ongoing expenditure for carrying out the Group’s research, manufacturing and commercial operations and are not separated from overall operating and development costs. There are no known changes in legal, regulatory or other requirements resulting in material changes to the levels of expenditure for 2017, 2018 or 2019.
In addition to expenditure for meeting current and foreseen environmental protection requirements, the Group incurs costs in investigating and cleaning up land and groundwater contamination. In particular, AstraZeneca has environmental liabilities at some currently or formerly owned, leased and third-party sites.
In the US, Zeneca Inc., and/or its indemnitees, have been named as potentially responsible parties (PRPs) or defendants at approximately 13 sites where Zeneca Inc. is likely to incur future environmental investigation, remediation, operation and maintenance costs under federal, state, statutory or common law environmental liability allocation schemes (together, US Environmental Consequences). Similarly, Stauffer Management Company LLC (SMC), which was established in 1987 to own and manage certain assets of Stauffer Chemical Company acquired that year, and/or its indemnitees, have been named as PRPs or defendants at a number of sites where SMC is likely to incur US Environmental Consequences.
AstraZeneca has also given indemnities to third parties for a number of sites outside the US. These environmental liabilities arise from legacy operations that are not currently part of the Group’s business and, at most of these sites, remediation, where required, is either completed or in progress. AstraZeneca has made provisions for the estimated costs of future environmental investigation, remediation, operation and maintenance activity beyond normal ongoing expenditure for maintaining the Group’s R&D and manufacturing capacity and product ranges, where a present obligation exists, it is probable that such costs will be incurred and they can be estimated reliably. With respect to such estimated future costs, there were provisions at 31 December 2019 in the aggregate of $96m (2018: $97m; 2017: $59m), mainly relating to the US. Where we are jointly liable or otherwise have cost-sharing agreements with third parties, we re�ect only our share of the obligation. Where the liability is insured in part or in whole by insurance or other arrangements for reimbursement, an asset is recognised to the extent that this recovery is virtually certain.
It is possible that AstraZeneca could incur future environmental costs beyond the extent of our current provisions. The extent of such possible additional costs is inherently dif�cult to estimate due to a number of factors, including: (i) the nature and extent of claims that may be asserted in the future; (ii) whether AstraZeneca has or will have any legal obligation with respect to asserted or unasserted claims; (iii) the type of remedial action, if any, that may be selected at sites where the remedy is presently not known; (iv) the potential for recoveries from or allocation of liability to third parties; and (v) the length of time that the environmental investigation, remediation and liability allocation process can take. As per our accounting policy on page 178, provisions for these costs are made when there is a present obligation and where it is probable that expenditure on remedial work will be required and a reliable estimate can be made of the cost. Notwithstanding and subject to the foregoing, we estimate the potential additional loss for future environmental investigation, remediation, remedial operation and maintenance activity above and beyond our provisions to be, in aggregate, between $86m and $143m (2018: $71m and $118m; 2017: $87m and $144m), which relates mainly to the US.
221AstraZeneca Annual Report & Form 20-F Information 2019 / Notes to the Group Financial Statements
Financial S
tatements
Legal proceedingsAstraZeneca is involved in various legal proceedings considered typical to its business, including actual or threatened litigation and/or actual or potential government investigations relating to employment matters, product liability, commercial disputes, pricing, sales and marketing practices, infringement of IP rights, and the validity of certain patents and competition laws. The more signi�cant matters are discussed below.
Most of the claims involve highly complex issues. Often these issues are subject to substantial uncertainties and, therefore, the probability of a loss, if any, being sustained and an estimate of the amount of any loss is dif�cult to ascertain. Consequently, for a majority of these claims, it is not possible to make a reasonable estimate of the expected �nancial effect, if any, that will result from ultimate resolution of the proceedings. In these cases, AstraZeneca discloses information with respect to the nature and facts of the cases.
With respect to each of the legal proceedings described below, other than those for which provision has been made, we are unable to make estimates of the possible loss or range of possible losses at this stage, other than as set forth in this section. We also do not believe that disclosure of the amount sought by plaintiffs, if known, would be meaningful with respect to those legal proceedings. This is due to a number of factors, including (i) the stage of the proceedings (in many cases trial dates have not been set) and the overall length and extent of pre-trial discovery; (ii) the entitlement of the parties to an action to appeal a decision; (iii) clarity as to theories of liability, damages and governing law; (iv) uncertainties in timing of litigation; and (v) the possible need for further legal proceedings to establish the appropriate amount of damages, if any.
While there can be no assurance regarding the outcome of any of the legal proceedings referred to in this Note 29, based on management’s current and considered view of each situation, we do not currently expect them to have a material adverse effect on our �nancial position. This position could of course change over time, not least because of the factors referred to above.
In cases that have been settled or adjudicated, or where quanti�able �nes and penalties have been assessed and which are not subject to appeal (or other similar forms of relief), or where a loss is probable and we are able to make a reasonable estimate of the loss, we generally indicate the loss absorbed or make a provision for our best estimate of the expected loss.
Where it is considered that the Group is more likely than not to prevail, legal costs involved in defending the claim are charged to pro�t as they are incurred.
Where it is considered that the Group has a valid contract which provides the right to reimbursement (from insurance or otherwise) of legal costs and/or all or part of any loss incurred or for which a provision has been established, and we consider recovery to be virtually certain, the best estimate of the amount expected to be received is recognised as an asset.
KJ Assessments as to whether or not to recognise provisions or assets, and of the amounts concerned, usually involve a series of complex judgements about future events and can rely heavily on estimates and assumptions. AstraZeneca believes that the provisions recorded are adequate based on currently available information and that the insurance recoveries recorded will be received. However, given the inherent uncertainties involved in assessing the outcomes of these cases, and in estimating the amount of the potential losses and the associated insurance recoveries, we could in the future incur judgments or insurance settlements that could have a material adverse effect on our results in any particular period.
IP claims include challenges to the Group’s patents on various products or processes and assertions of non-infringement of patents. A loss in any of these cases could result in loss of patent protection on the related product. The consequences of any such loss could be a signi�cant decrease in Product Sales, which could have a material adverse effect on our results. The lawsuits �led by AstraZeneca for patent infringement against companies that have �led ANDAs in the US, seeking to market generic forms of products sold by the Group prior to the expiry of the applicable patents covering these products, typically also involve allegations of non-infringement, invalidity and unenforceability of these patents by the ANDA �lers. In the event that the Group is unsuccessful in these actions or the statutory 30-month stay expires before a ruling is obtained, the ANDA �lers involved will also have the ability, subject to FDA approval, to introduce generic versions of the product concerned.
AstraZeneca has full con�dence in, and will vigorously defend and enforce, its IP.
Over the course of the past several years, including in 2019, a signi�cant number of commercial litigation claims in which AstraZeneca is involved have been resolved, particularly in the US, thereby reducing potential contingent liability exposure arising from such litigation. Similarly, in part due to patent litigation and settlement developments, greater certainty has been achieved regarding possible generic entry dates with respect to some of our patented products. At the same time, like other companies in the pharmaceutical sector and other industries, AstraZeneca continues to be subject to government investigations around the world.
Patent litigationBrilinta (ticagrelor) US patent proceedingsIn 2015 and subsequently, in response to Paragraph IV notices from ANDA �lers, AstraZeneca �led patent infringement lawsuits in the US District Court for the District of Delaware (the District Court) relating to patents listed in the FDA Orange Book with reference to Brilinta. In 2019, AstraZeneca entered into several separate settlements and the District Court entered consent judgments to dismiss several of the litigations. Additional proceedings are ongoing in the District Court. No trial date has been set.
Patent proceedings outside the US In Canada, in September 2017, Apotex Inc. (Apotex) challenged the patents listed on the Canadian Patent Register with reference to Brilinta. AstraZeneca discontinued the proceeding against Apotex in February 2019 after Apotex withdrew its challenge.
In Canada, in October 2018, Taro Pharmaceuticals Inc. (Taro) challenged the patents listed on the Canadian Patent Register with reference to Brilinta. AstraZeneca commenced an infringement action against Taro. The action was discontinued in September 2019 after Taro withdrew its challenge.
Calquence (acalabrutinib)US patent proceedingsIn November 2017, Pharmacyclics LLC (Pharmacyclics, a company in the AbbVie group) �led a patent infringement lawsuit in the US District Court for the District of Delaware (the District Court) against Acerta Pharma and AstraZeneca relating to Calquence.
In April 2018, AstraZeneca and Acerta Pharma �led a complaint in the District Court against Pharmacyclics and AbbVie, Inc. alleging that their drug, Imbruvica, infringes a US patent owned by Acerta Pharma. In November 2018, Janssen Biotech, Inc. (Janssen) intervened as a defendant.
In October 2019, AstraZeneca entered into settlement agreements with Pharmacyclics and Janssen resolving all patent litigation between the parties relating to Calquence and Imbruvica. A provision has been taken.
In October 2019, an amendment to the share purchase and option agreement (SPOA) with the sellers of Acerta Pharma (originally entered into in December 2015) came into effect, changing certain terms of the SPOA on both the timing and also reducing the maximum consideration that would be required to be made to acquire the remaining outstanding shares of Acerta Pharma if the options are exercised. The payments would be made in similar annual instalments commencing at the earliest from 2022 through to 2024, subject to the options being exercised. The changes to the terms have been re�ected
222 AstraZeneca Annual Report & Form 20-F Information 2019 / Financial Statements
Notes to the Group Financial Statementscontinued
in the assumptions used to calculate the amortised cost of the option liability as at 31 December 2019 of $2,146m (2018: $1,838m; 2017: $1,823m).
Daliresp (ro�umilast) US patent proceedings In 2015 and subsequently, in response to Paragraph IV notices from ANDA �lers, AstraZeneca �led patent infringement lawsuits in the US District Court for the District of New Jersey (the District Court) relating to patents listed in the FDA Orange Book with reference to Daliresp. In 2019, AstraZeneca entered into several separate settlements and the District Court entered consent judgments to dismiss several of the litigations. Additional proceedings are ongoing in the District Court. No trial date has been set.
Farxiga (dapagli�ozin)US patent proceedingsIn 2018, in response to Paragraph IV notices, AstraZeneca initiated ANDA litigation against Zydus Pharmaceuticals (USA) Inc. (Zydus) in the US District Court for the District of Delaware. In its complaint, AstraZeneca alleged that Zydus’ generic version of Farxiga, if approved and marketed, would infringe AstraZeneca’s US Patent Nos. 6,414,126 and 6,515,117. Zydus has counterclaimed for non-infringement of AstraZeneca’s US Patent Nos. 7,851,502; 7,919,598; 8,221,786; 8,361,972; 8,501,698; 8,685,934; and 8,716,251. Proceedings are ongoing and trial is scheduled for February 2021.
Faslodex (fulvestrant) US patent proceedings AstraZeneca has �led patent infringement lawsuits in the US District Court for the District of New Jersey (the District Court) relating to four patents listed in the FDA Orange Book with reference to Faslodex after receiving a number of Paragraph IV notices relating to multiple ANDAs or NDAs submitted pursuant to 21 U.S.C. § 355(b)(2) seeking FDA approval to market generic versions of Faslodex prior to the expiration of AstraZeneca’s patents. In July 2016, AstraZeneca settled one of these, the lawsuit brought against Sandoz, Inc. (Sandoz), and the District Court entered a consent judgment, which included an injunction preventing Sandoz from launching a generic fulvestrant product until March 2019, or earlier in certain circumstances. Between 2016 and 2019, AstraZeneca resolved all of the remaining lawsuits, and the District Court also entered consent judgments ending those lawsuits. In October 2019, AstraZeneca �led a new patent infringement lawsuit in the District Court relating to all four listed patents after receiving a new Paragraph IV notice relating to an ANDA seeking FDA approval to market generic versions of Faslodex prior to the expiration of AstraZeneca’s patents.
Patent proceedings outside the USIn Spain, in January 2016 and July 2017, the Barcelona Commercial Court ordered preliminary injunctions based on the Spanish part of European Patent Nos. EP 1,250,138 and EP 2,266,573, respectively preventing Sandoz Farmacéutica, S.A. (Sandoz) and Teva Pharm S.L.U. (Teva) from launching generic Faslodex in Spain. Sandoz appealed and, in December 2017, the Barcelona Court of Appeals revoked and lifted the preliminary injunction against Sandoz. Patent infringement and patent invalidity proceedings are ongoing against various parties.
In France, in June 2018, the Commercial Court of Nanterre denied AstraZeneca’s request for a preliminary injunction against Sandoz SAS (Sandoz) to prevent a potential launch of its generic Faslodex in France. Additionally, in June 2018, Sandoz served AstraZeneca with an invalidation writ against European Patent Nos. EP 2,266,573; EP 1,250,138; and EP 1,272,195. Patent infringement and patent invalidity proceedings are ongoing with Sandoz.
In Germany, in January 2017, the German Federal Patent Court declared the German part of European Patent No. EP 1,250,138 (the ‘138 patent) invalid. In April 2019, the German Federal Court of Justice upheld the January 2017 decision and determined the ‘138 patent to be invalid. In November 2019, the German Federal Patent Court declared the German part of European Patent No. EP 1,272,195 invalid.
In Italy, Actavis Group Ptc ehf and Actavis Italy S.p.A. �led actions alleging that the Italian part of the ‘138 patent and European Patent No. EP 2,266,573 (the ‘573 patent) are invalid. In July 2018, the Court of Turin determined that the ‘138 patent is invalid. In July 2019, the Court of Milan determined that the ‘573 patent is invalid. Patent infringement and patent invalidity proceedings are ongoing against various parties.
Imfinzi (durvalumab) US patent proceedings In July 2017, Bristol-Myers Squibb, E.R. Squibb & Sons LLC, Ono Pharmaceutical Co and Tasuku Honjo �led a patent infringement action in the US District Court for the District of Delaware relating to AstraZeneca’s commercialisation of Imfinzi. The case was dismissed without prejudice on 14 June 2019.
Movantik (naloxegol)US patent proceedingsIn December 2018, AstraZeneca initiated ANDA litigation against Apotex, Inc. and Apotex Corp. (together Apotex) and against MSN Laboratories (MSN) in the US District Court for the District of Delaware. In its complaint, AstraZeneca alleges that the generic companies’ versions of Movantik, if approved and marketed, would infringe US Patent No. 9,012,469 (the ‘469 patent). A trial has been scheduled for March 2021.
In November 2019, AstraZeneca initiated ANDA litigation against Aurobindo Pharma U.S.A. in the US District Court for the District of Delaware. In its complaint, AstraZeneca alleges that the generic company’s versions of Movantik, if approved and marketed, would infringe the ‘469 patent.
Onglyza (saxagliptin)Patent proceedings outside the USIn Canada, in November 2019, Sandoz Canada Inc. sent a Notice of Allegation to AstraZeneca challenging the validity of Canadian substance Patent No. 2402894 (expiry March 2021) and formulation Patent No. 2568391 (expiry May 2025) related to Onglyza. AstraZeneca commenced an action in response in January 2020.
RoxadustatPatent proceedings outside the USIn Canada, in May 2018, Akebia Therapeutics, Inc. �led an impeachment action in the Federal Court of Canada alleging invalidity of several of FibroGen, Inc.’s (FibroGen) method of use patents (Canadian Patent Nos. 2467689; 2468083; and 2526496) related to HIF prolyl hydroxylase inhibitors. AstraZeneca is the exclusive licensee of FibroGen in Canada. AstraZeneca and FibroGen are defending the action.
Symbicort (budesonide/formoterol fumarate dihydrate)US patent proceedingsBeginning in October 2018, AstraZeneca initiated ANDA litigation against Mylan Pharmaceuticals Inc. (Mylan), Mylan Laboratories Limited, Mylan Inc., and Mylan N.V. (collectively, the Mylan Entities) and 3M Company (3M) and, separately, ANDA litigation against Teva Pharmaceuticals USA, Inc. (Teva) and Catalent Pharma Solutions, LLC (Catalent) in the US District Court for the District of Delaware (Delaware District Court). AstraZeneca also �led a similar action against the Mylan Entities in the US District Court for the Northern District of West Virginia (West Virginia District Court). In its complaints, AstraZeneca alleges that the defendants’ generic versions of Symbicort, if approved and marketed, would infringe AstraZeneca’s US Patent Nos. 7,759,328; 8,143,239; 8,575,137; and 7,967,011. In March 2019, following stipulations �led by the parties, the Delaware and West Virginia District Courts dismissed without prejudice Mylan Laboratories Limited, Mylan Inc., and Mylan N.V. from those actions. In May 2019, AstraZeneca �led a Second Amended Complaint in each of the Delaware District Court actions adding allegations that the defendants’ proposed generic versions of Symbicort, if approved and marketed, would infringe AstraZeneca’s US Patent No. 10,166,247 (the ‘247 patent). In June 2019, Teva and Catalent responded to the Second Amended Complaint and alleged that their proposed generic product does not infringe the ‘247 patent and/or that the ‘247 patent is invalid
29 Commitments and contingent liabilities continued
223AstraZeneca Annual Report & Form 20-F Information 2019 / Notes to the Group Financial Statements
Financial S
tatements
and/or unenforceable. AstraZeneca decided to no longer assert patent infringement of US Patent No. 7,967,011 against Teva and Catalent.
In October 2019, the Delaware District Court transferred the Delaware action with Mylan and 3M to the West Virginia District Court. In November 2019, AstraZeneca �led an Amended Complaint in the West Virginia District Court against Mylan and 3M adding allegations that their proposed generic version of Symbicort, if approved and marketed, would infringe the ‘247 patent and removing allegations of infringement of US Patent No. 7,967,011. In November 2019, Mylan and 3M responded to the Amended Complaint and alleged that their proposed generic product does not infringe the asserted patents and/or that the asserted patents are invalid and/or unenforceable. In December 2019, AstraZeneca settled its ANDA action with Teva and Catalent and that matter is now closed. The trial of the Mylan and 3M matter is scheduled for July 2020.
Tagrisso (osimertinib)US patent proceedingsIn February 2020, in response to Paragraph IV notices from multiple ANDA �lers, AstraZeneca �led patent infringement lawsuits in the US District Court for the District of Delaware. In its complaint, AstraZeneca alleged that a generic vision of Tagrisso, if approved and marketed would infringe AstraZeneca’s US Patent No. 10,183,020. No trial has been set.
Product liability litigationByetta/Bydureon (exenatide) In the US, Amylin Pharmaceuticals, LLC, a wholly owned subsidiary of AstraZeneca, and/or AstraZeneca are among multiple defendants in various lawsuits �led in federal and state courts involving claims of physical injury from treatment with Byetta and/or Bydureon. The lawsuits allege several types of injuries including pancreatitis, pancreatic cancer, thyroid cancer, and kidney cancer. A multidistrict litigation was established in the US District Court for the Southern District of California (the District Court) in regard to the alleged pancreatic cancer cases in federal courts. Further, a coordinated proceeding has been established in Los Angeles, California in regard to the various lawsuits in California state courts. In November 2015, the District Court granted the defendants’ motion for summary judgment and dismissed all claims alleging pancreatic cancer that accrued prior to 11 September 2015. In November 2017, the US Court of Appeals for the Ninth Circuit vacated the District Court’s order and remanded for further discovery. In November 2018, the Court of Appeal for the State of California annulled the judgment from the California state coordinated proceeding and remanded for further discovery.
Farxiga (dapagli�ozin) and Xigduo (dapagli�ozin/metformin HCl)In several jurisdictions in the US, AstraZeneca has been named as a defendant in lawsuits involving plaintiffs claiming physical injury, including diabetic ketoacidosis and kidney failure, from treatment with Farxiga and/or Xigduo XR.
In April 2017, the Judicial Panel on Multidistrict Litigation ordered transfer of any currently pending cases as well as of any similar, subsequently �led cases to a coordinated and consolidated pre-trial multidistrict litigation (MDL) proceeding in the US District Court for the Southern District of New York. A majority of these claims have been resolved or dismissed, and the MDL has been administratively closed.
In two jurisdictions in the US, AstraZeneca has been named as a defendant in lawsuits involving plaintiffs claiming physical injury, including Fournier’s Gangrene and necrotizing fasciitis, from treatment with Farxiga and/or Xigduo XR.
Nexium (esomeprazole magnesium) and Losec/Prilosec (omeprazole)US proceedingsIn the US, AstraZeneca is defending various lawsuits brought in federal and state courts involving multiple plaintiffs claiming that they have been diagnosed with various injuries following treatment with proton pump inhibitors, including Nexium and Prilosec. In May 2017, counsel for a group of such plaintiffs claiming that they have been diagnosed with kidney injuries �led a motion with the Judicial Panel on Multidistrict Litigation (JPML) seeking the transfer of any currently pending federal court cases as well as any similar, subsequently �led cases to a coordinated and consolidated pre-trial multidistrict litigation (MDL) proceeding. In August 2017, the JPML granted the motion and consolidated the pending federal court cases in an MDL proceeding in federal court in New Jersey for pre-trial purposes. A trial in the MDL is scheduled for November 2021.
In July 2019, counsel for a similarly de�ned group of plaintiffs with claims pending in New Jersey state courts petitioned the New Jersey State Administrative Director of the Courts to centralise judicial management of all plaintiffs’ claims alleging kidney injuries pending in that State in a coordinated multicounty litigation (MCL) proceeding. The MCL has been centralised in Atlantic County.
Canada proceedingsIn Canada, in July and August 2017, AstraZeneca was served with three putative class action lawsuits. Two of the lawsuits seek authorisation to represent individual residents in Canada who allegedly suffered kidney injuries from the use of proton pump inhibitors, including Nexium and Losec. In August 2019, the third lawsuit, �led in Quebec, was dismissed.
Onglyza (saxagliptin) and Kombiglyze (saxagliptin and metformin) In the US, AstraZeneca is defending various lawsuits alleging heart failure, cardiac injuries, and/or death from treatment with Onglyza or Kombiglyze. In February 2018, the Judicial Panel on Multidistrict Litigation ordered the transfer of various pending federal actions to the US District Court for the Eastern District of Kentucky (District Court) for consolidated pre-trial proceedings with the federal actions pending in the District Court. The previously disclosed California State Court coordinated proceeding remains pending in California.
Commercial litigation Amplimmune In the US, in June 2017, AstraZeneca was served with a lawsuit �led by the stockholders’ agents for Amplimmune, Inc. (Amplimmune) in Delaware State Court that alleged, among other things, breaches of contractual obligations relating to a 2013 merger agreement between AstraZeneca and Amplimmune. Trial is scheduled for February 2020.
Array BioPharmaIn the US, in December 2017, AstraZeneca was served with a complaint �led in New York State Court by Array BioPharma, Inc. (Array) that alleged, among other things, breaches of contractual obligations relating to a 2003 collaboration agreement between AstraZeneca and Array.
Ocimum lawsuit In December 2015, AstraZeneca was served with a complaint �led by Ocimum Biosciences, Ltd. (Ocimum) in the Superior Court for the State of Delaware that alleges, among other things, breaches of contractual obligations and misappropriation of trade secrets, relating to a now terminated 2001 licensing agreement between AstraZeneca and Gene Logic, Inc. (Gene Logic), the rights to which Ocimum purports to have acquired from Gene Logic. In December 2019, the court granted AstraZeneca’s motion for summary judgment and dismissed the case.
Seroquel XR Antitrust Litigation In the US in 2019, AstraZeneca was named in several related complaints brought in the US District Court for the Southern District of New York, including several putative class action lawsuits that were purportedly brought on behalf of classes of direct purchasers or end payors of Seroquel XR, that allege AstraZeneca and generic drug manufacturers violated antitrust laws when settling patent litigation related to Seroquel XR.
Toprol-XL (metoprolol succinate) In the US, in October 2016, AstraZeneca completed its sale of certain assets related to the US rights to Toprol-XL and AstraZeneca’s authorised generic metoprolol succinate product to Aralez Pharmaceuticals Trading DAC (Aralez). In August 2018, Aralez commenced voluntary insolvency proceedings and

224 AstraZeneca Annual Report & Form 20-F Information 2019 / Financial Statements
Notes to the Group Financial Statementscontinued
AstraZeneca �led a proof of claim in those proceedings asserting its unsecured claims. In October 2018, Aralez �led a motion in the Bankruptcy Court seeking to sell the US rights to Toprol-XL and its authorised generic and AstraZeneca �led an objection to the proposed sale. In March 2019, AstraZeneca entered into an agreement with the senior secured creditor and the settlement has now been approved by the Bankruptcy Court, bringing this matter to a close.
Other commercial litigationAnti-Terrorism Act Civil LawsuitIn the US, in October 2017, AstraZeneca and certain other pharmaceutical and/or medical device companies were named as defendants in a complaint �led in the US District Court for the District of Columbia by US nationals (or their estates, survivors, or heirs) who were killed or wounded in Iraq between 2005 and 2011. The plaintiffs allege that the defendants violated the US Anti-Terrorism Act and various state laws by selling pharmaceuticals and medical supplies to the Iraqi Ministry of Health.
Government investigations/proceedings Crestor (rosuvastatin calcium) Qui tam litigation In the US, in January and February 2014, AstraZeneca was served with lawsuits �led in the US District Court for the District of Delaware under the qui tam (whistleblower) provisions of the federal False Claims Act and related state statutes, alleging that AstraZeneca directed certain employees to promote Crestor off-label and provided unlawful remuneration to physicians in connection with the promotion of Crestor. The DOJ and all US states have declined to intervene in the lawsuits. In March 2019, AstraZeneca �led a motion to dismiss the complaint. Oral argument on the motion to dismiss is scheduled for February 2020.
Iraqi Ministry of Health Anti-Corruption ProbeIn July 2018, AstraZeneca, along with other companies, received an inquiry from the DOJ pursuant to the Foreign Corrupt Practices Act in connection with an anti-corruption investigation relating to activities in Iraq, including interactions with the Iraqi government. AstraZeneca is cooperating with the inquiry.
Synagis (palivizumab)Litigation in New York In the US, in June 2011, MedImmune received a demand from the US Attorney’s Of�ce for the Southern District of New York requesting certain documents related to the sales and marketing activities of Synagis. In July 2011, MedImmune received a similar court order to produce documents from the Of�ce of the Attorney General for the State of New York
Medicaid and Fraud Control Unit pursuant to what the government attorneys advised was a joint investigation. MedImmune has cooperated with these inquiries. In March 2017, MedImmune was served with a lawsuit �led in the US District Court for the Southern District of New York (District Court) by the Attorney General for the State of New York alleging that MedImmune inappropriately provided assistance to a single specialty care pharmacy. In September 2018, the District Court denied MedImmune’s motion to dismiss the lawsuit brought by the Attorney General for the State of New York.
In June 2017, MedImmune was served with a lawsuit in the District Court by a relator under the qui tam (whistleblower) provisions of the federal and certain state False Claims Acts. The lawsuit was originally �led under seal in April 2009 and alleges that MedImmune made false claims about Synagis. In November 2017, MedImmune was served with an amended complaint in which the relator set forth additional false claims allegations relating to Synagis. In September 2018, the District Court dismissed the relator’s lawsuit. In January 2019, the relator appealed the District Court’s decision to the US Court of Appeals for the Second Circuit. Oral arguments relating to the appeal are scheduled for February 2020.
Florida Attorney General investigationIn May 2012, MedImmune received a subpoena duces tecum from the Of�ce of Attorney General for the State of Florida Medicaid and Fraud Control Unit requesting certain documents related to the sales and marketing activities of Synagis. MedImmune accepted receipt of the request and has coordinated with the Florida government to provide the appropriate responses and cooperate with any related investigation. AstraZeneca is unaware of the nature or focus of the investigation; however, based on the requests, it appears to be similar to the inquiry from the State of New York (described above).
Toprol-XL (metoprolol succinate)Louisiana Attorney General LitigationIn the US, in March 2015, AstraZeneca was served with a state court complaint �led by the Attorney General for the State of Louisiana (the State) alleging that, in connection with enforcement of its patents for Toprol-XL, it had engaged in unlawful monopolisation and unfair trade practices, causing the State government to pay increased prices for Toprol-XL.
In April 2019, a Louisiana state court (State Court) granted AstraZeneca’s motion for summary judgment dismissing the State’s lawsuit and entered judgment in AstraZeneca’s favour. The State is appealing the State Court’s ruling.
Multi-product litigationLitigation in Washington StateIn the US, in September 2018, a lawsuit against AstraZeneca and several other defendants was unsealed in the US District Court for the Western District of Washington (District Court). The complaint alleged that the defendants violated various laws, including state and federal false claims acts, by offering clinical educator and reimbursement support programmes. In September 2018, the government moved to dismiss the lawsuit against AstraZeneca and similar lawsuits �led against other companies by relator Health Choice Alliance. In November 2019, the District Court granted the government’s motion to dismiss.
Other government investigations/proceedingsUS Congressional InquiryIn January 2019, AstraZeneca received a letter from the US House of Representatives Committee on Oversight and Reform seeking information related to pricing practices for Crestor. Similar letters were sent to 11 other pharmaceutical manufacturers. We continue to cooperate with the inquiry and have produced certain responsive information.
Additional government inquiriesAs is true for most, if not all, major prescription pharmaceutical companies, AstraZeneca is currently involved in multiple inquiries into drug marketing and pricing practices. In addition to the investigations described above, various law enforcement of�ces have, from time to time, requested information from the Group. There have been no material developments in those matters.
TaxSE AstraZeneca considers whether it is probable that a taxation authority will accept an uncertain tax treatment. If it is concluded that it is not probable that the taxation authority will accept an uncertain tax treatment, where tax exposures can be quanti�ed, an accrual is made based on either the most likely amount method or the expected value method depending on which method management expects to better predict the resolution of the uncertainty. Accruals can be built up over a long period of time but the ultimate resolution of tax exposures usually occurs at a point in time, and given the inherent uncertainties in assessing the outcomes of these exposures (which sometimes can be binary in nature), we could, in future periods, experience adjustments to these accruals that have a material positive or negative effect on our results in any particular period. Details of the movements in relation to material tax exposures are discussed below.
29 Commitments and contingent liabilities continued

225AstraZeneca Annual Report & Form 20-F Information 2019 / Notes to the Group Financial Statements
Financial S
tatements
KJ AstraZeneca faces a number of audits and reviews in jurisdictions around the world and, in some cases, is in dispute with the tax authorities. The issues under discussion are often complex and can require many years to resolve. Accruals for tax contingencies require management to make key judgements with respect to the ultimate outcome of current and potential future tax audits, and actual results could vary from these estimates.
Transfer pricing and other international tax contingenciesThe total net accrual included in the Group Financial Statements to cover the worldwide exposure to transfer pricing audits is $140m, a decrease of $72m compared with 2018 mainly as a result of the conclusion of tax authority review.
In addition to these tax exposures, the European Commission (EC) issued its decision on the state aid review of UK Controlled Foreign Company Group Financing Exemption. The EC concluded that part of the UK measures was unlawful and have instructed recovery of the state aid. The UK Government and the Group have appealed the decision. Despite the nature of the complexities of the ruling in relation to the Group’s position, the complex tax legislation and taking into account the ongoing appeal, the Group does not expect any additional liability would be material.
Management continues to believe that AstraZeneca’s positions on all its transfer pricing and other international tax audits and disputes are robust, and that AstraZeneca is appropriately provided, including consideration of whether corresponding relief will be available under Mutal Agreement procedures or unilaterally. For transfer pricing audits where AstraZeneca and the tax authorities are in dispute, and the state aid matter, AstraZeneca estimates the potential for reasonably possible additional liabilities above and beyond the amount provided to be up to $76m (2018: $357m; 2017: $30m) including associated interest. However, management believes that it is unlikely that these additional liabilities will arise. It is possible that some of these contingencies may reduce in the future to the extent that any tax authority challenge is concluded, or matters lapse following expiry of the relevant statutes of limitation resulting in a reduction in the tax charge in future periods.
Other tax contingenciesIncluded in the tax accrual is $887m relating to a number of other tax contingencies, an increase of $157m mainly due to the impact of an additional year of transactions relating to contingencies for which accruals had already been established, new tax contingencies in the period partially offset by the transitional adjustments on adoption of IFRIC 23 ‘Uncertainty over Income Tax Treatments’ and exchange rate effects.
For these tax exposures, AstraZeneca estimates the potential for reasonably possible additional losses above and beyond the amount provided to be up to $327m (2018: $253m; 2017: $nil) including associated interest. It is, however, possible that some of these contingencies may reduce in the future if any tax authority challenge is concluded or matters lapse following expiry of the relevant statutes of limitation resulting in a reduction in the tax charge in future periods.
Timing of cash �ows and interestIt is not possible to estimate the timing of tax cash �ows in relation to each outcome. However, it is anticipated that a number of signi�cant disputes may be resolved over the next one to two years.
Included within other receivables and payables is a net amount of interest arising on tax contingencies of $90m.
30 Statutory and other information2019 2018 2017
$m $m $m
Fees payable to PricewaterhouseCoopers LLP and its associates:
Group audit fee 3.9 3.8 3.0
Fees payable to PricewaterhouseCoopers LLP and its associates for other services:
The audit of subsidiaries pursuant to legislation 8.3 9.4 5.7
Attestation under s404 of Sarbanes-Oxley Act 2002 2.0 2.0 2.0
Audit-related assurance services 0.3 0.8 0.4
Tax compliance services – 0.1 –
Other assurance services 0.1 0.9 –
Fees payable to PricewaterhouseCoopers Associates in respect of the Group’s pension schemes:
The audit of subsidiaries’ pension schemes 0.3 0.4 –
14.9 17.4 11.1
$0.7m of fees payable in 2019 are in respect of the 2018 Group audit and audit of subsidiaries (2018: $3.2m in respect of the 2017 audit).
Related party transactionsThe Group had no material related party transactions which might reasonably be expected to in�uence decisions made by the users of these Financial Statements.
Key management personnel compensationKey management personnel are de�ned for the purpose of disclosure under IAS 24 ‘Related Party Disclosures’ as the members of the Board and the members of the SET.
2019 2018 2017$’000 $’000 $’000
Short-term employee benefits 31,329 32,523 28,274
Post-employment benefits 1,766 2,387 2,469
Share-based payments 19,210 23,605 16,452
52,305 58,515 47,195
Total remuneration is included within employee costs (see Note 28).
226 AstraZeneca Annual Report & Form 20-F Information 2019 / Financial Statements
Notes to the Group Financial Statementscontinued
31 Subsequent eventsFollowing the recommendation from an independent Data Monitoring Committee, AstraZeneca decided in January 2020 to terminate the Phase III STRENGTH trial for Epanova, due to its low likelihood of demonstrating a bene�t to patients with MDS who are at increased risk of CV disease. This was considered to be an adjusting event after the reporting period, resulting in a full impairment of the Epanova intangible asset of $533m recorded in Research and development expense in FY 2019, and a provision for inventory and supply-related costs of $115m recorded in Cost of sales, also in FY 2019.
In January 2020, the Company announced that it had agreed to divest the global commercial rights to a number of established hypertension medicines, including Inderal, Tenormin and Zestril to Atnahs Pharma. Atnahs Pharma will make an upfront payment of $350m to AstraZeneca. AstraZeneca may also receive future sales-contingent payments of up to $40m between 2020 and 2022. Income arising from the upfront and future payments will be reported in AstraZeneca’s �nancial statements within Other operating income and expense. The divestment is expected to complete in the �rst quarter of 2020.
In January 2020, the Company announced that it will recover the global rights to brazikumab (formerly MEDI2070), a monoclonal antibody targeting IL23, from Allergan. Brazikumab is currently in a Phase IIb/III programme in Crohn’s disease and a Phase IIb trial in ulcerative colitis. AstraZeneca and Allergan will terminate their existing license agreement and all rights to brazikumab will revert to AstraZeneca. The transaction is expected to complete in the �rst quarter of 2020, subject to regulatory approvals associated with AbbVie’s proposed acquisition of Allergan and its timely completion. Under the termination agreement, Allergan will fund up to an agreed amount, estimated to be the total costs expected to be incurred by AstraZeneca until completion of development for brazikumab in Crohn’s disease and ulcerative colitis, including the development of a companion diagnostic.
Pursuant to the 2012 collaboration between Amgen and AstraZeneca to jointly develop and commercialise a clinical-stage in�ammation portfolio, Amgen is entitled to receive a high single-digit to low double-digit royalty on sales of brazikumab if approved and launched. This includes the original inventor royalty. Other than this, AstraZeneca will own all rights and bene�ts arising from the medicine with no other payments due to Amgen.
In January 2020, AstraZeneca sold a proportion of its equity portfolio receiving consideration of $184m.
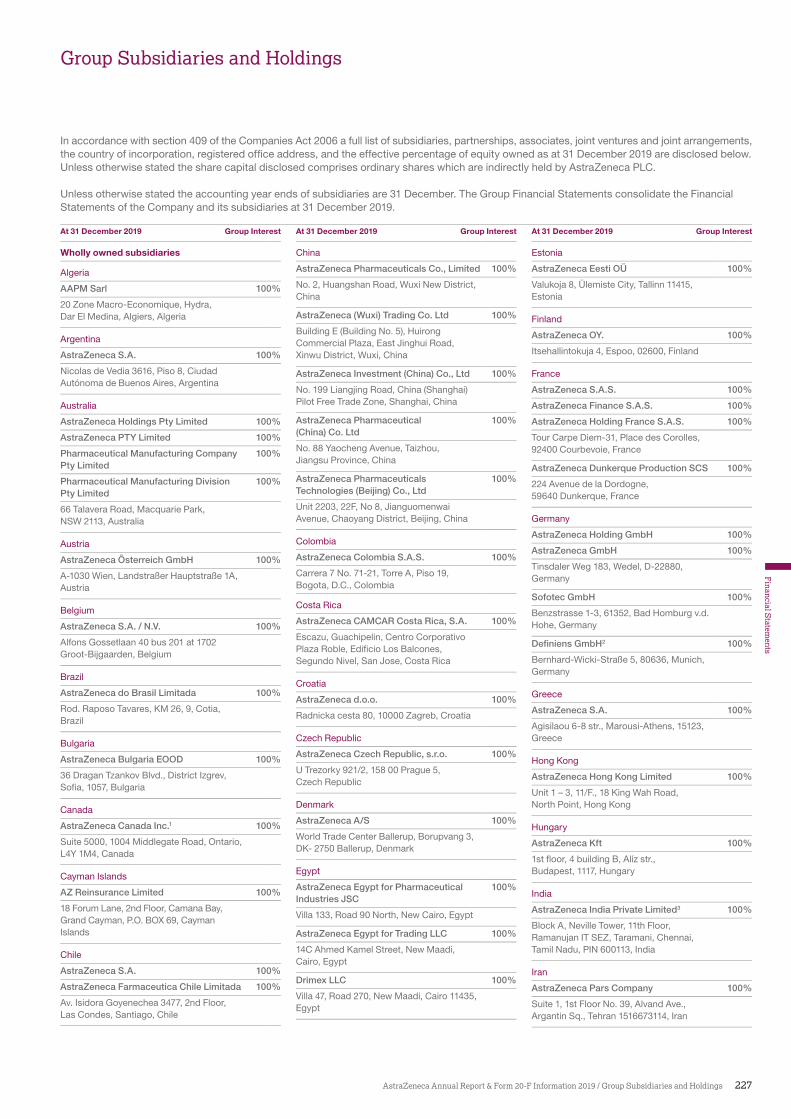
227
Financial S
tatements
AstraZeneca Annual Report & Form 20-F Information 2019 / Group Subsidiaries and Holdings
Group Subsidiaries and Holdings
In accordance with section 409 of the Companies Act 2006 a full list of subsidiaries, partnerships, associates, joint ventures and joint arrangements, the country of incorporation, registered of�ce address, and the effective percentage of equity owned as at 31 December 2019 are disclosed below. Unless otherwise stated the share capital disclosed comprises ordinary shares which are indirectly held by AstraZeneca PLC.
Unless otherwise stated the accounting year ends of subsidiaries are 31 December. The Group Financial Statements consolidate the Financial Statements of the Company and its subsidiaries at 31 December 2019.
At 31 December 2019 Group Interest At 31 December 2019 Group Interest At 31 December 2019 Group Interest
Wholly owned subsidiaries
Algeria
AAPM Sarl 100%
20 Zone Macro-Economique, Hydra, Dar El Medina, Algiers, Algeria
Argentina
AstraZeneca S.A. 100%
Nicolas de Vedia 3616, Piso 8, Ciudad Autónoma de Buenos Aires, Argentina
Australia
AstraZeneca Holdings Pty Limited 100%
AstraZeneca PTY Limited 100%
Pharmaceutical Manufacturing Company Pty Limited
100%
Pharmaceutical Manufacturing Division Pty Limited
100%
66 Talavera Road, Macquarie Park, NSW 2113, Australia
Austria
AstraZeneca Österreich GmbH 100%
A-1030 Wien, Landstraßer Hauptstraße 1A, Austria
Belgium
AstraZeneca S.A. / N.V. 100%
Alfons Gossetlaan 40 bus 201 at 1702 Groot-Bijgaarden, Belgium
Brazil
AstraZeneca do Brasil Limitada 100%
Rod. Raposo Tavares, KM 26, 9, Cotia, Brazil
Bulgaria
AstraZeneca Bulgaria EOOD 100%
36 Dragan Tzankov Blvd., District Izgrev, Sofia, 1057, Bulgaria
Canada
AstraZeneca Canada Inc.1 100%
Suite 5000, 1004 Middlegate Road, Ontario, L4Y 1M4, Canada
Cayman Islands
AZ Reinsurance Limited 100%
18 Forum Lane, 2nd Floor, Camana Bay, Grand Cayman, P.O. BOX 69, Cayman Islands
Chile
AstraZeneca S.A. 100%
AstraZeneca Farmaceutica Chile Limitada 100%
Av. Isidora Goyenechea 3477, 2nd Floor, Las Condes, Santiago, Chile
China
AstraZeneca Pharmaceuticals Co., Limited 100%
No. 2, Huangshan Road, Wuxi New District, China
AstraZeneca (Wuxi) Trading Co. Ltd 100%
Building E (Building No. 5), Huirong Commercial Plaza, East Jinghui Road, Xinwu District, Wuxi, China
AstraZeneca Investment (China) Co., Ltd 100%
No. 199 Liangjing Road, China (Shanghai) Pilot Free Trade Zone, Shanghai, China
AstraZeneca Pharmaceutical (China) Co. Ltd
100%
No. 88 Yaocheng Avenue, Taizhou, Jiangsu Province, China
AstraZeneca Pharmaceuticals Technologies (Beijing) Co., Ltd
100%
Unit 2203, 22F, No 8, Jianguomenwai Avenue, Chaoyang District, Beijing, China
Colombia
AstraZeneca Colombia S.A.S. 100%
Carrera 7 No. 71-21, Torre A, Piso 19, Bogota, D.C., Colombia
Costa Rica
AstraZeneca CAMCAR Costa Rica, S.A. 100%
Escazu, Guachipelin, Centro Corporativo Plaza Roble, Edificio Los Balcones, Segundo Nivel, San Jose, Costa Rica
Croatia
AstraZeneca d.o.o. 100%
Radnicka cesta 80, 10000 Zagreb, Croatia
Czech Republic
AstraZeneca Czech Republic, s.r.o. 100%
U Trezorky 921/2, 158 00 Prague 5, Czech Republic
Denmark
AstraZeneca A/S 100%
World Trade Center Ballerup, Borupvang 3, DK- 2750 Ballerup, Denmark
Egypt
AstraZeneca Egypt for Pharmaceutical Industries JSC
100%
Villa 133, Road 90 North, New Cairo, Egypt
AstraZeneca Egypt for Trading LLC 100%
14C Ahmed Kamel Street, New Maadi, Cairo, Egypt
Drimex LLC 100%
Villa 47, Road 270, New Maadi, Cairo 11435, Egypt
Estonia
AstraZeneca Eesti OÜ 100%
Valukoja 8, Ülemiste City, Tallinn 11415, Estonia
Finland
AstraZeneca OY. 100%
Itsehallintokuja 4, Espoo, 02600, Finland
France
AstraZeneca S.A.S. 100%
AstraZeneca Finance S.A.S. 100%
AstraZeneca Holding France S.A.S. 100%
Tour Carpe Diem-31, Place des Corolles, 92400 Courbevoie, France
AstraZeneca Dunkerque Production SCS 100%
224 Avenue de la Dordogne, 59640 Dunkerque, France
Germany
AstraZeneca Holding GmbH 100%
AstraZeneca GmbH 100%
Tinsdaler Weg 183, Wedel, D-22880, Germany
Sofotec GmbH 100%
Benzstrasse 1-3, 61352, Bad Homburg v.d. Hohe, Germany
Definiens GmbH2 100%
Bernhard-Wicki-Straße 5, 80636, Munich, Germany
Greece
AstraZeneca S.A. 100%
Agisilaou 6-8 str., Marousi-Athens, 15123, Greece
Hong Kong
AstraZeneca Hong Kong Limited 100%
Unit 1 – 3, 11/F., 18 King Wah Road, North Point, Hong Kong
Hungary
AstraZeneca Kft 100%
1st floor, 4 building B, Alíz str., Budapest, 1117, Hungary
India
AstraZeneca India Private Limited3 100%
Block A, Neville Tower, 11th Floor, Ramanujan IT SEZ, Taramani, Chennai, Tamil Nadu, PIN 600113, India
Iran
AstraZeneca Pars Company 100%
Suite 1, 1st Floor No. 39, Alvand Ave., Argantin Sq., Tehran 1516673114, Iran
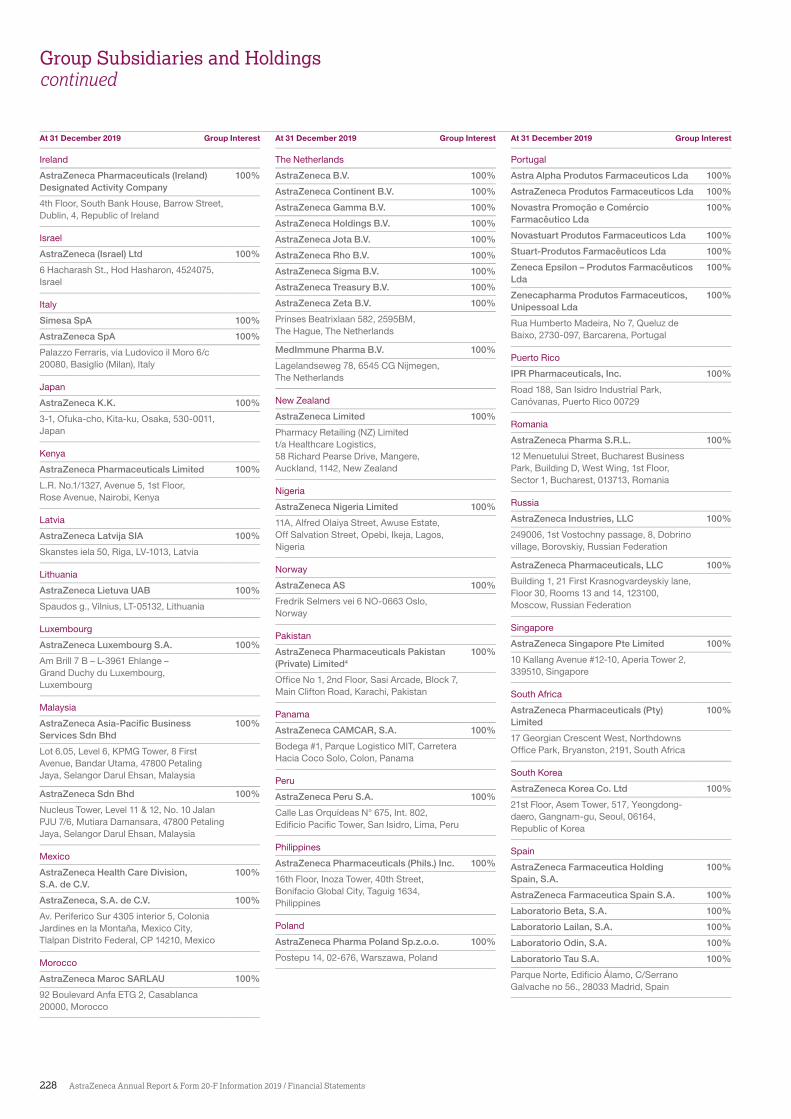
228 AstraZeneca Annual Report & Form 20-F Information 2019 / Financial Statements
Group Subsidiaries and Holdings continued
Ireland
AstraZeneca Pharmaceuticals (Ireland) Designated Activity Company
100%
4th Floor, South Bank House, Barrow Street, Dublin, 4, Republic of Ireland
Israel
AstraZeneca (Israel) Ltd 100%
6 Hacharash St., Hod Hasharon, 4524075, Israel
Italy
Simesa SpA 100%
AstraZeneca SpA 100%
Palazzo Ferraris, via Ludovico il Moro 6/c 20080, Basiglio (Milan), Italy
Japan
AstraZeneca K.K. 100%
3-1, Ofuka-cho, Kita-ku, Osaka, 530-0011, Japan
Kenya
AstraZeneca Pharmaceuticals Limited 100%
L.R. No.1/1327, Avenue 5, 1st Floor, Rose Avenue, Nairobi, Kenya
Latvia
AstraZeneca Latvija SIA 100%
Skanstes iela 50, Riga, LV-1013, Latvia
Lithuania
AstraZeneca Lietuva UAB 100%
Spaudos g., Vilnius, LT-05132, Lithuania
Luxembourg
AstraZeneca Luxembourg S.A. 100%
Am Brill 7 B – L-3961 Ehlange – Grand Duchy du Luxembourg, Luxembourg
Malaysia
AstraZeneca Asia-Pacific Business Services Sdn Bhd
100%
Lot 6.05, Level 6, KPMG Tower, 8 First Avenue, Bandar Utama, 47800 Petaling Jaya, Selangor Darul Ehsan, Malaysia
AstraZeneca Sdn Bhd 100%
Nucleus Tower, Level 11 & 12, No. 10 Jalan PJU 7/6, Mutiara Damansara, 47800 Petaling Jaya, Selangor Darul Ehsan, Malaysia
Mexico
AstraZeneca Health Care Division, S.A. de C.V.
100%
AstraZeneca, S.A. de C.V. 100%
Av. Periferico Sur 4305 interior 5, Colonia Jardines en la Montaña, Mexico City, Tlalpan Distrito Federal, CP 14210, Mexico
Morocco
AstraZeneca Maroc SARLAU 100%
92 Boulevard Anfa ETG 2, Casablanca 20000, Morocco
The Netherlands
AstraZeneca B.V. 100%
AstraZeneca Continent B.V. 100%
AstraZeneca Gamma B.V. 100%
AstraZeneca Holdings B.V. 100%
AstraZeneca Jota B.V. 100%
AstraZeneca Rho B.V. 100%
AstraZeneca Sigma B.V. 100%
AstraZeneca Treasury B.V. 100%
AstraZeneca Zeta B.V. 100%
Prinses Beatrixlaan 582, 2595BM, The Hague, The Netherlands
MedImmune Pharma B.V. 100%
Lagelandseweg 78, 6545 CG Nijmegen, The Netherlands
New Zealand
AstraZeneca Limited 100%
Pharmacy Retailing (NZ) Limited t/a Healthcare Logistics, 58 Richard Pearse Drive, Mangere, Auckland, 1142, New Zealand
Nigeria
AstraZeneca Nigeria Limited 100%
11A, Alfred Olaiya Street, Awuse Estate, Off Salvation Street, Opebi, Ikeja, Lagos, Nigeria
Norway
AstraZeneca AS 100%
Fredrik Selmers vei 6 NO-0663 Oslo, Norway
Pakistan
AstraZeneca Pharmaceuticals Pakistan (Private) Limited4
100%
Office No 1, 2nd Floor, Sasi Arcade, Block 7, Main Clifton Road, Karachi, Pakistan
Panama
AstraZeneca CAMCAR, S.A. 100%
Bodega #1, Parque Logistico MIT, Carretera Hacia Coco Solo, Colon, Panama
Peru
AstraZeneca Peru S.A. 100%
Calle Las Orquídeas N° 675, Int. 802, Edificio Pacific Tower, San Isidro, Lima, Peru
Philippines
AstraZeneca Pharmaceuticals (Phils.) Inc. 100%
16th Floor, Inoza Tower, 40th Street, Bonifacio Global City, Taguig 1634, Philippines
Poland
AstraZeneca Pharma Poland Sp.z.o.o. 100%
Postepu 14, 02-676, Warszawa, Poland
Portugal
Astra Alpha Produtos Farmaceuticos Lda 100%
AstraZeneca Produtos Farmaceuticos Lda 100%
Novastra Promoção e Comércio Farmacêutico Lda
100%
Novastuart Produtos Farmaceuticos Lda 100%
Stuart-Produtos Farmacêuticos Lda 100%
Zeneca Epsilon – Produtos Farmacêuticos Lda
100%
Zenecapharma Produtos Farmaceuticos, Unipessoal Lda
100%
Rua Humberto Madeira, No 7, Queluz de Baixo, 2730-097, Barcarena, Portugal
Puerto Rico
IPR Pharmaceuticals, Inc. 100%
Road 188, San Isidro Industrial Park, Canóvanas, Puerto Rico 00729
Romania
AstraZeneca Pharma S.R.L. 100%
12 Menuetului Street, Bucharest Business Park, Building D, West Wing, 1st Floor, Sector 1, Bucharest, 013713, Romania
Russia
AstraZeneca Industries, LLC 100%
249006, 1st Vostochny passage, 8, Dobrino village, Borovskiy, Russian Federation
AstraZeneca Pharmaceuticals, LLC 100%
Building 1, 21 First Krasnogvardeyskiy lane, Floor 30, Rooms 13 and 14, 123100, Moscow, Russian Federation
Singapore
AstraZeneca Singapore Pte Limited 100%
10 Kallang Avenue #12-10, Aperia Tower 2, 339510, Singapore
South Africa
AstraZeneca Pharmaceuticals (Pty) Limited
100%
17 Georgian Crescent West, Northdowns Office Park, Bryanston, 2191, South Africa
South Korea
AstraZeneca Korea Co. Ltd 100%
21st Floor, Asem Tower, 517, Yeongdong-daero, Gangnam-gu, Seoul, 06164, Republic of Korea
Spain
AstraZeneca Farmaceutica Holding Spain, S.A.
100%
AstraZeneca Farmaceutica Spain S.A. 100%
Laboratorio Beta, S.A. 100%
Laboratorio Lailan, S.A. 100%
Laboratorio Odin, S.A. 100%
Laboratorio Tau S.A. 100%
Parque Norte, Edificio Álamo, C/Serrano Galvache no 56., 28033 Madrid, Spain
At 31 December 2019 Group Interest At 31 December 2019 Group Interest At 31 December 2019 Group Interest
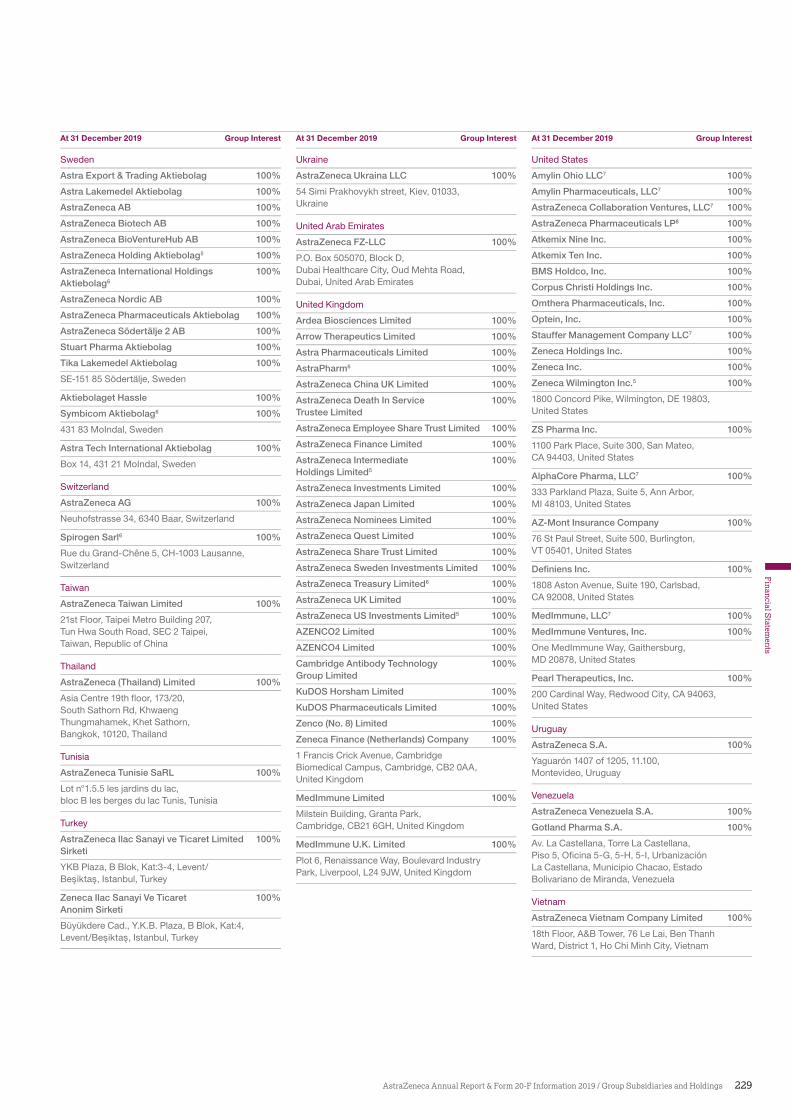
229
Financial S
tatements
AstraZeneca Annual Report & Form 20-F Information 2019 / Group Subsidiaries and Holdings
Sweden
Astra Export & Trading Aktiebolag 100%
Astra Lakemedel Aktiebolag 100%
AstraZeneca AB 100%
AstraZeneca Biotech AB 100%
AstraZeneca BioVentureHub AB 100%
AstraZeneca Holding Aktiebolag5 100%
AstraZeneca International Holdings Aktiebolag6
100%
AstraZeneca Nordic AB 100%
AstraZeneca Pharmaceuticals Aktiebolag 100%
AstraZeneca Södertälje 2 AB 100%
Stuart Pharma Aktiebolag 100%
Tika Lakemedel Aktiebolag 100%
SE-151 85 Södertälje, Sweden
Aktiebolaget Hassle 100%
Symbicom Aktiebolag6 100%
431 83 MoIndal, Sweden
Astra Tech International Aktiebolag 100%
Box 14, 431 21 MoIndal, Sweden
Switzerland
AstraZeneca AG 100%
Neuhofstrasse 34, 6340 Baar, Switzerland
Spirogen Sarl6 100%
Rue du Grand-Chêne 5, CH-1003 Lausanne, Switzerland
Taiwan
AstraZeneca Taiwan Limited 100%
21st Floor, Taipei Metro Building 207, Tun Hwa South Road, SEC 2 Taipei, Taiwan, Republic of China
Thailand
AstraZeneca (Thailand) Limited 100%
Asia Centre 19th floor, 173/20, South Sathorn Rd, Khwaeng Thungmahamek, Khet Sathorn, Bangkok, 10120, Thailand
Tunisia
AstraZeneca Tunisie SaRL 100%
Lot n°1.5.5 les jardins du lac, bloc B les berges du lac Tunis, Tunisia
Turkey
AstraZeneca Ilac Sanayi ve Ticaret Limited Sirketi
100%
YKB Plaza, B Blok, Kat:3-4, Levent/Bes̨iktas̨, Istanbul, Turkey
Zeneca Ilac Sanayi Ve Ticaret Anonim Sirketi
100%
Büyükdere Cad., Y.K.B. Plaza, B Blok, Kat:4, Levent/Bes̨iktas̨, Istanbul, Turkey
Ukraine
AstraZeneca Ukraina LLC 100%
54 Simi Prakhovykh street, Kiev, 01033, Ukraine
United Arab Emirates
AstraZeneca FZ-LLC 100%
P.O. Box 505070, Block D, Dubai Healthcare City, Oud Mehta Road, Dubai, United Arab Emirates
United Kingdom
Ardea Biosciences Limited 100%
Arrow Therapeutics Limited 100%
Astra Pharmaceuticals Limited 100%
AstraPharm6 100%
AstraZeneca China UK Limited 100%
AstraZeneca Death In Service Trustee Limited
100%
AstraZeneca Employee Share Trust Limited 100%
AstraZeneca Finance Limited 100%
AstraZeneca Intermediate Holdings Limited5
100%
AstraZeneca Investments Limited 100%
AstraZeneca Japan Limited 100%
AstraZeneca Nominees Limited 100%
AstraZeneca Quest Limited 100%
AstraZeneca Share Trust Limited 100%
AstraZeneca Sweden Investments Limited 100%
AstraZeneca Treasury Limited6 100%
AstraZeneca UK Limited 100%
AstraZeneca US Investments Limited5 100%
AZENCO2 Limited 100%
AZENCO4 Limited 100%
Cambridge Antibody Technology Group Limited
100%
KuDOS Horsham Limited 100%
KuDOS Pharmaceuticals Limited 100%
Zenco (No. 8) Limited 100%
Zeneca Finance (Netherlands) Company 100%
1 Francis Crick Avenue, Cambridge Biomedical Campus, Cambridge, CB2 0AA, United Kingdom
MedImmune Limited 100%
Milstein Building, Granta Park, Cambridge, CB21 6GH, United Kingdom
MedImmune U.K. Limited 100%
Plot 6, Renaissance Way, Boulevard Industry Park, Liverpool, L24 9JW, United Kingdom
United States
Amylin Ohio LLC7 100%
Amylin Pharmaceuticals, LLC7 100%
AstraZeneca Collaboration Ventures, LLC7 100%
AstraZeneca Pharmaceuticals LP8 100%
Atkemix Nine Inc. 100%
Atkemix Ten Inc. 100%
BMS Holdco, Inc. 100%
Corpus Christi Holdings Inc. 100%
Omthera Pharmaceuticals, Inc. 100%
Optein, Inc. 100%
Stauffer Management Company LLC7 100%
Zeneca Holdings Inc. 100%
Zeneca Inc. 100%
Zeneca Wilmington Inc.5 100%
1800 Concord Pike, Wilmington, DE 19803, United States
ZS Pharma Inc. 100%
1100 Park Place, Suite 300, San Mateo, CA 94403, United States
AlphaCore Pharma, LLC7 100%
333 Parkland Plaza, Suite 5, Ann Arbor, MI 48103, United States
AZ-Mont Insurance Company 100%
76 St Paul Street, Suite 500, Burlington, VT 05401, United States
Definiens Inc. 100%
1808 Aston Avenue, Suite 190, Carlsbad, CA 92008, United States
MedImmune, LLC7 100%
MedImmune Ventures, Inc. 100%
One MedImmune Way, Gaithersburg, MD 20878, United States
Pearl Therapeutics, Inc. 100%
200 Cardinal Way, Redwood City, CA 94063, United States
Uruguay
AstraZeneca S.A. 100%
Yaguarón 1407 of 1205, 11.100, Montevideo, Uruguay
Venezuela
AstraZeneca Venezuela S.A. 100%
Gotland Pharma S.A. 100%
Av. La Castellana, Torre La Castellana, Piso 5, Oficina 5-G, 5-H, 5-I, Urbanización La Castellana, Municipio Chacao, Estado Bolivariano de Miranda, Venezuela
Vietnam
AstraZeneca Vietnam Company Limited 100%
18th Floor, A&B Tower, 76 Le Lai, Ben Thanh Ward, District 1, Ho Chi Minh City, Vietnam
At 31 December 2019 Group Interest At 31 December 2019 Group Interest At 31 December 2019 Group Interest
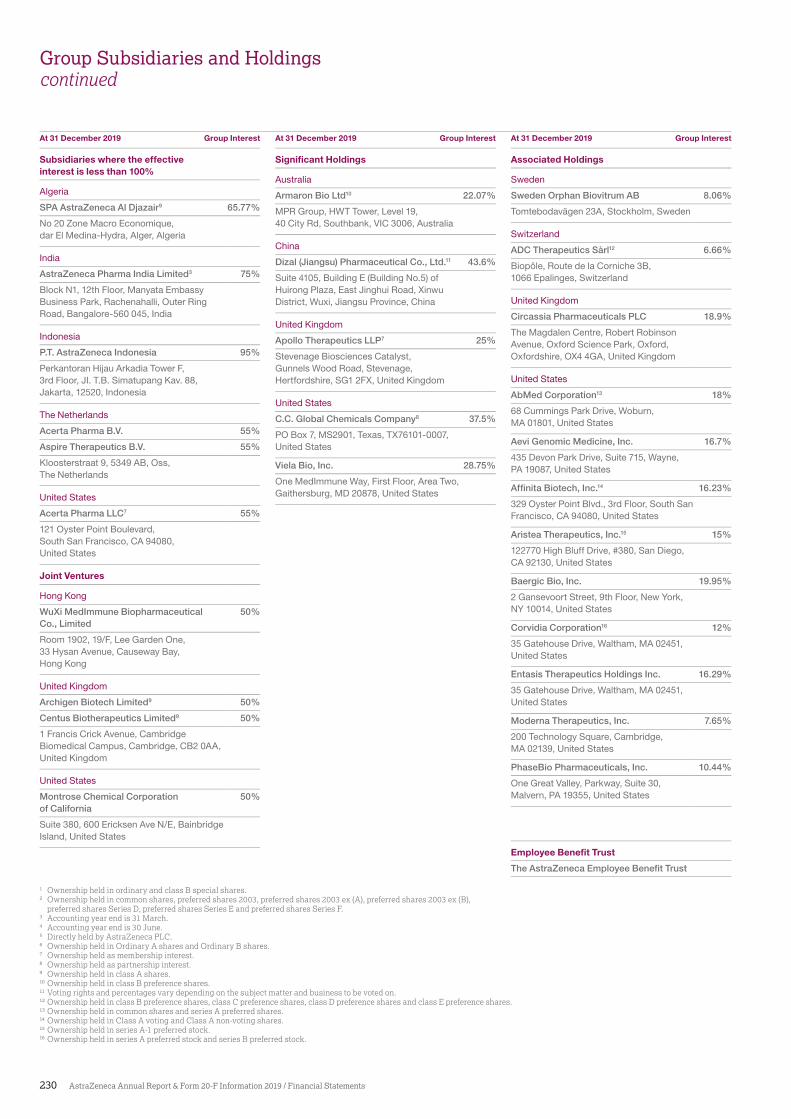
230 AstraZeneca Annual Report & Form 20-F Information 2019 / Financial Statements
Group Subsidiaries and Holdings continued
Subsidiaries where the effective interest is less than 100%
Algeria
SPA AstraZeneca Al Djazair9 65.77%
No 20 Zone Macro Economique, dar El Medina-Hydra, Alger, Algeria
India
AstraZeneca Pharma India Limited3 75%
Block N1, 12th Floor, Manyata Embassy Business Park, Rachenahalli, Outer Ring Road, Bangalore-560 045, India
Indonesia
P.T. AstraZeneca Indonesia 95%
Perkantoran Hijau Arkadia Tower F, 3rd Floor, JI. T.B. Simatupang Kav. 88, Jakarta, 12520, Indonesia
The Netherlands
Acerta Pharma B.V. 55%
Aspire Therapeutics B.V. 55%
Kloosterstraat 9, 5349 AB, Oss, The Netherlands
United States
Acerta Pharma LLC7 55%
121 Oyster Point Boulevard, South San Francisco, CA 94080, United States
Joint Ventures
Hong Kong
WuXi MedImmune Biopharmaceutical Co., Limited
50%
Room 1902, 19/F, Lee Garden One, 33 Hysan Avenue, Causeway Bay, Hong Kong
United Kingdom
Archigen Biotech Limited9 50%
Centus Biotherapeutics Limited9 50%
1 Francis Crick Avenue, Cambridge Biomedical Campus, Cambridge, CB2 0AA, United Kingdom
United States
Montrose Chemical Corporation of California
50%
Suite 380, 600 Ericksen Ave N/E, Bainbridge Island, United States
Significant Holdings
Australia
Armaron Bio Ltd10 22.07%
MPR Group, HWT Tower, Level 19, 40 City Rd, Southbank, VIC 3006, Australia
China
Dizal (Jiangsu) Pharmaceutical Co., Ltd.11 43.6%
Suite 4105, Building E (Building No.5) of Huirong Plaza, East Jinghui Road, Xinwu District, Wuxi, Jiangsu Province, China
United Kingdom
Apollo Therapeutics LLP7 25%
Stevenage Biosciences Catalyst, Gunnels Wood Road, Stevenage, Hertfordshire, SG1 2FX, United Kingdom
United States
C.C. Global Chemicals Company8 37.5%
PO Box 7, MS2901, Texas, TX76101-0007, United States
Viela Bio, Inc. 28.75%
One MedImmune Way, First Floor, Area Two, Gaithersburg, MD 20878, United States
Associated Holdings
Sweden
Sweden Orphan Biovitrum AB 8.06%
Tomtebodavägen 23A, Stockholm, Sweden
Switzerland
ADC Therapeutics Sàrl12 6.66%
Biopôle, Route de la Corniche 3B, 1066 Epalinges, Switzerland
United Kingdom
Circassia Pharmaceuticals PLC 18.9%
The Magdalen Centre, Robert Robinson Avenue, Oxford Science Park, Oxford, Oxfordshire, OX4 4GA, United Kingdom
United States
AbMed Corporation13 18%
68 Cummings Park Drive, Woburn, MA 01801, United States
Aevi Genomic Medicine, Inc. 16.7%
435 Devon Park Drive, Suite 715, Wayne, PA 19087, United States
Affinita Biotech, Inc.14 16.23%
329 Oyster Point Blvd., 3rd Floor, South San Francisco, CA 94080, United States
Aristea Therapeutics, Inc.15 15%
122770 High Bluff Drive, #380, San Diego, CA 92130, United States
Baergic Bio, Inc. 19.95%
2 Gansevoort Street, 9th Floor, New York, NY 10014, United States
Corvidia Corporation16 12%
35 Gatehouse Drive, Waltham, MA 02451, United States
Entasis Therapeutics Holdings Inc. 16.29%
35 Gatehouse Drive, Waltham, MA 02451, United States
Moderna Therapeutics, Inc. 7.65%
200 Technology Square, Cambridge, MA 02139, United States
PhaseBio Pharmaceuticals, Inc. 10.44%
One Great Valley, Parkway, Suite 30, Malvern, PA 19355, United States
Employee Benefit Trust
The AstraZeneca Employee Benefit Trust
1 Ownershipheldinordinar andclass specialshares.2 Ownershipheldincommonshares,preferredshares2003,preferredshares2003ex(A),preferredshares2003ex( ),
preferred shares Series D, preferred shares Series E and preferred shares Series F.3 Accounting year end is 31 March.4 Accounting year end is 30 June.5 Directly held by AstraZeneca PLC.6 OwnershipheldinOrdinar AsharesandOrdinar shares.7 Ownership held as membership interest.8 Ownership held as partnership interest.9 Ownership held in class A shares.10 Ownershipheldinclass preferenceshares.11 Voting rights and percentages vary depending on the subject matter and business to be voted on.12 Ownershipheldinclass preferenceshares,classCpreferenceshares,classDpreferencesharesandclassEpreferenceshares.13 Ownership held in common shares and series A preferred shares.14 Ownership held in Class A voting and Class A non-voting shares.15 Ownership held in series A-1 preferred stock.16 OwnershipheldinseriesApreferredstockandseries preferredstock.
At 31 December 2019 Group Interest At 31 December 2019 Group Interest At 31 December 2019 Group Interest
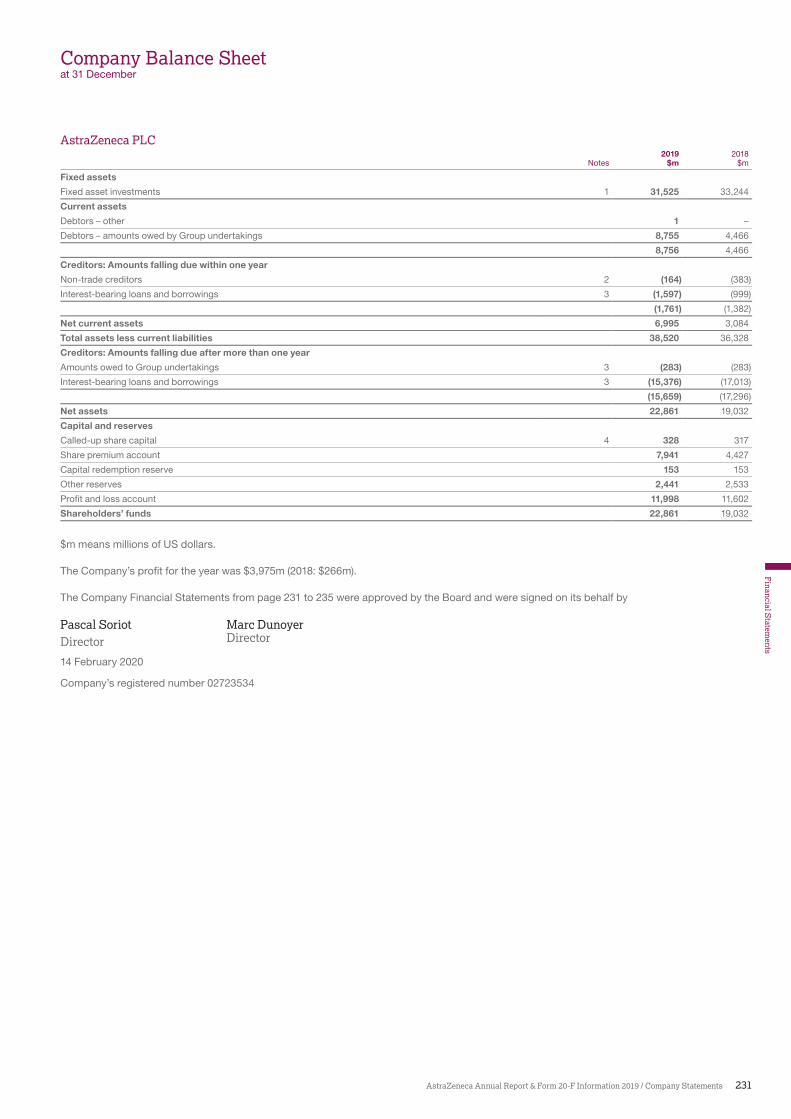
231
Financial S
tatements
AstraZeneca Annual Report & Form 20-F Information 2019 / Company Statements
Company Balance Sheetat 31 December
AstraZeneca PLC2019 2018
Notes $m $m
Fixed assets
Fixed asset investments 1 31,525 33,244
Current assets
Debtors – other 1 –
Debtors – amounts owed by Group undertakings 8,755 4,466
8,756 4,466
Creditors: Amounts falling due within one year
Non-trade creditors 2 (164) (383)
Interest-bearing loans and borrowings 3 (1,597) (999)
(1,761) (1,382)
Net current assets 6,995 3,084
Total assets less current liabilities 38,520 36,328
Creditors: Amounts falling due after more than one year
Amounts owed to Group undertakings 3 (283) (283)
Interest-bearing loans and borrowings 3 (15,376) (17,013)
(15,659) (17,296)
Net assets 22,861 19,032
Capital and reserves
Called-up share capital 4 328 317
Share premium account 7,941 4,427
Capital redemption reserve 153 153
Other reserves 2,441 2,533
Profit and loss account 11,998 11,602
Shareholders’ funds 22,861 19,032
$m means millions of US dollars.
The Company’s pro�t for the year was $3,975m (2018: $266m).
The Company Financial Statements from page 231 to 235 were approved by the Board and were signed on its behalf by
Pascal Soriot Marc DunoyerDirector Director
14 February 2020
Company’s registered number 02723534
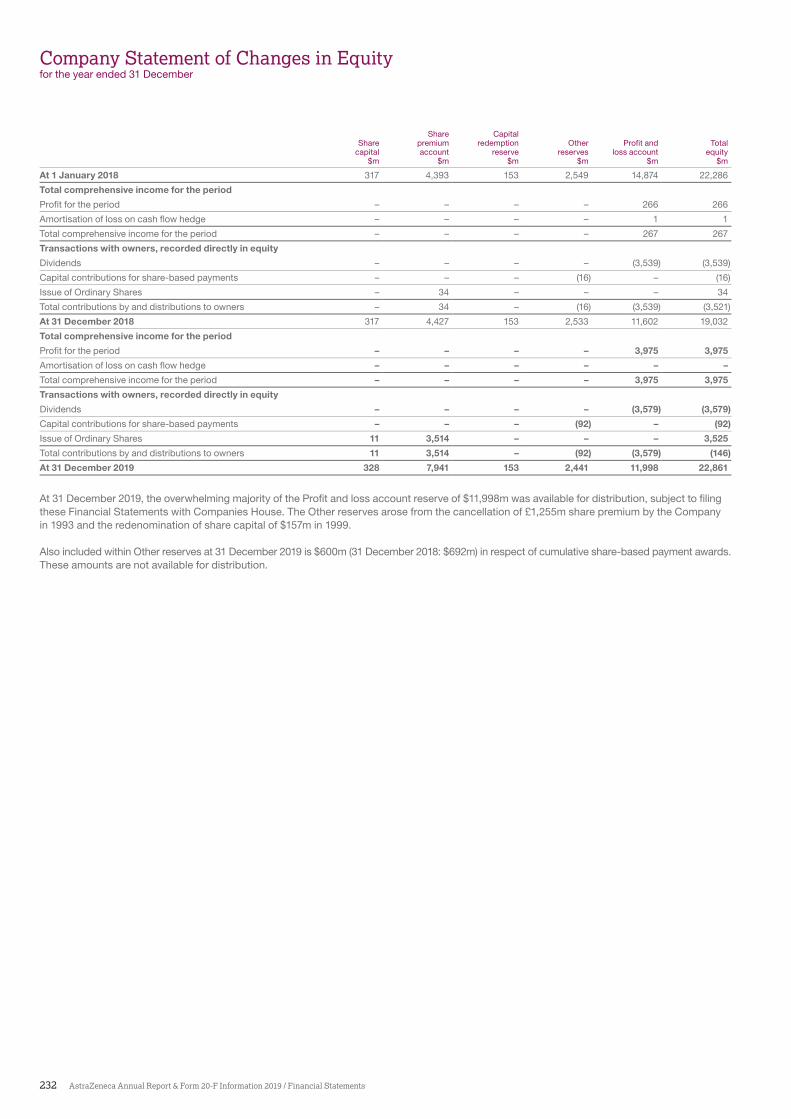
232 AstraZeneca Annual Report & Form 20-F Information 2019 / Financial Statements
Company Statement of Changes in Equityfor the year ended 31 December
Share CapitalShare premium redemption Other Profit and Total
capital account reserve reserves loss account equity$m $m $m $m $m $m
At 1 January 2018 317 4,393 153 2,549 14,874 22,286
Total comprehensive income for the period
Profit for the period – – – – 266 266
Amortisation of loss on cash flow hedge – – – – 1 1
Total comprehensive income for the period – – – – 267 267
Transactions with owners, recorded directly in equity
Dividends – – – – (3,539) (3,539)
Capital contributions for share-based payments – – – (16) – (16)
Issue of Ordinary Shares – 34 – – – 34
Total contributions by and distributions to owners – 34 – (16) (3,539) (3,521)
At 31 December 2018 317 4,427 153 2,533 11,602 19,032
Total comprehensive income for the period
Profit for the period – – – – 3,975 3,975
Amortisation of loss on cash flow hedge – – – – – –
Total comprehensive income for the period – – – – 3,975 3,975
Transactions with owners, recorded directly in equity
Dividends – – – – (3,579) (3,579)
Capital contributions for share-based payments – – – (92) – (92)
Issue of Ordinary Shares 11 3,514 – – – 3,525
Total contributions by and distributions to owners 11 3,514 – (92) (3,579) (146)
At 31 December 2019 328 7,941 153 2,441 11,998 22,861
At 31 December 2019, the overwhelming majority of the Pro�t and loss account reserve of $11,998m was available for distribution, subject to �ling these Financial Statements with Companies House. The Other reserves arose from the cancellation of £1,255m share premium by the Company in 1993 and the redenomination of share capital of $157m in 1999.
Also included within Other reserves at 31 December 2019 is $600m (31 December 2018: $692m) in respect of cumulative share-based payment awards. These amounts are not available for distribution.
233
Financial S
tatements
AstraZeneca Annual Report & Form 20-F Information 2019 / Company Accounting Policies
Company Accounting Policies
Basis of presentation of financia infor ationThese �nancial statements were prepared in accordance with FRS 101 ‘Reduced Disclosure Framework’.
In preparing these �nancial statements, the Company applied the recognition, measurement and disclosure requirements of International Financial Reporting Standards as adopted by the EU (Adopted IFRSs), but makes amendments where necessary in order to comply with the Companies Act 2006 and has set out below where advantage of the FRS 101 disclosure exemptions has been taken.
In these �nancial statements, the Company has applied the exemptions available under FRS 101 in respect of the following disclosures:
> Statement of Cash Flows and related notes> disclosures in respect of transactions
with wholly owned subsidiaries> disclosures in respect of
capital management> the effects of new but not yet effective IFRSs> disclosures in respect of the compensation
of Key Management Personnel.
As the Group Financial Statements (presented on pages 168 to 230) include the equivalent disclosures, the Company has also taken the exemptions under FRS 101 available in respect of the following disclosures:
> IFRS 2 ‘Share-based Payment’ in respect of Group settled share-based payments
> certain disclosures required by IFRS 13 ‘Fair Value Measurement’ and the disclosures required by IFRS 7 ‘Financial Instrument Disclosures’.
No individual pro�t and loss account is prepared as provided by section 408 of the Companies Act 2006.
The accounting policies set out below have, unless otherwise stated, been applied consistently to all periods presented in these �nancial statements.
Basis of accountingThe Company Financial Statements are prepared under the historical cost convention, in accordance with the Companies Act 2006.
The following paragraphs describe the main accounting policies, which have been applied consistently.
Foreign currenciesPro�t and loss account items in foreign currencies are translated into US dollars at average rates for the relevant accounting periods. Monetary assets and liabilities are translated at exchange rates prevailing at the date of the Company Balance Sheet. Exchange gains and losses on loans and on short-term foreign currency borrowings and deposits are included within Finance expense. Exchange differences on all other foreign currency transactions are recognised in Operating pro�t.
TaxationThe current tax payable is based on taxable pro�t for the year. Taxable pro�t differs from reported pro�t because taxable pro�t excludes items that are either never taxable or tax deductible or items that are taxable or tax deductible in a different period. The Company’s current tax assets and liabilities are calculated using tax rates that have been enacted or substantively enacted by the reporting date.
Deferred tax is provided using the balance sheet liability method, providing for temporary differences between the carrying amounts of assets and liabilities for �nancial reporting purposes and the amounts used for taxation purposes. Deferred tax assets are recognised to the extent that it is probable that taxable pro�t will be available against which the asset can be utilised. This requires judgements to be made in respect of the availability of future taxable income.
No deferred tax asset or liability is recognised in respect of temporary differences associated with investments in subsidiaries and branches where the Company is able to control the timing of reversal of the temporary differences and it is probable that the temporary differences will not reverse in the foreseeable future.
The Company’s deferred tax assets and liabilities are calculated using tax rates that are expected to apply in the period when the liability is settled or the asset realised based on tax rates that have been enacted or substantively enacted by the reporting date.
Accruals for tax contingencies require management to make judgements of potential exposures in relation to tax audit issues. Tax bene�ts are not recognised unless the tax positions will probably be accepted by the authorities. This is based upon management interpretation of applicable laws and regulations and the expectation of how the tax authority will resolve the matter. Once considered probable of not being sustained, management reviews each material tax bene�t to assess whether a provision should be taken against full recognition of the bene�t on the basis of potential settlement through negotiation and/or litigation.
Accruals for tax contingencies are measured using either the most likely amount or the expected value amount depending on which method the Company expect to better predict the resolution of the uncertainty.
InvestmentsFixed asset investments, including investments in subsidiaries, are stated at cost and reviewed for impairment if there are indications that the carrying value may not be recoverable.
Share-based paymentsThe issuance by the Company to employees of its subsidiaries of a grant of awards over the Company’s shares, represents additional capital contributions by the Company to its subsidiaries. An additional investment in subsidiaries results in a corresponding increase in shareholders’ equity. The additional capital contribution is based on the fair value of the grant issued, allocated over the underlying grant’s vesting period, less the market cost of shares charged to subsidiaries in settlement of such share awards.
Financial instrumentsInterest-bearing loans are initially measured at fair value (with direct transaction costs being amortised over the life of the loan) and are subsequently measured at amortised cost using the effective rate method at each reporting date. Changes in carrying value are recognised in pro�t.
LitigationThrough the normal course of business, the AstraZeneca Group is involved in legal disputes, the settlement of which may involve cost to the Company. Provision is made where an adverse outcome is probable and associated costs can be estimated reliably. In other cases, appropriate descriptions are included.
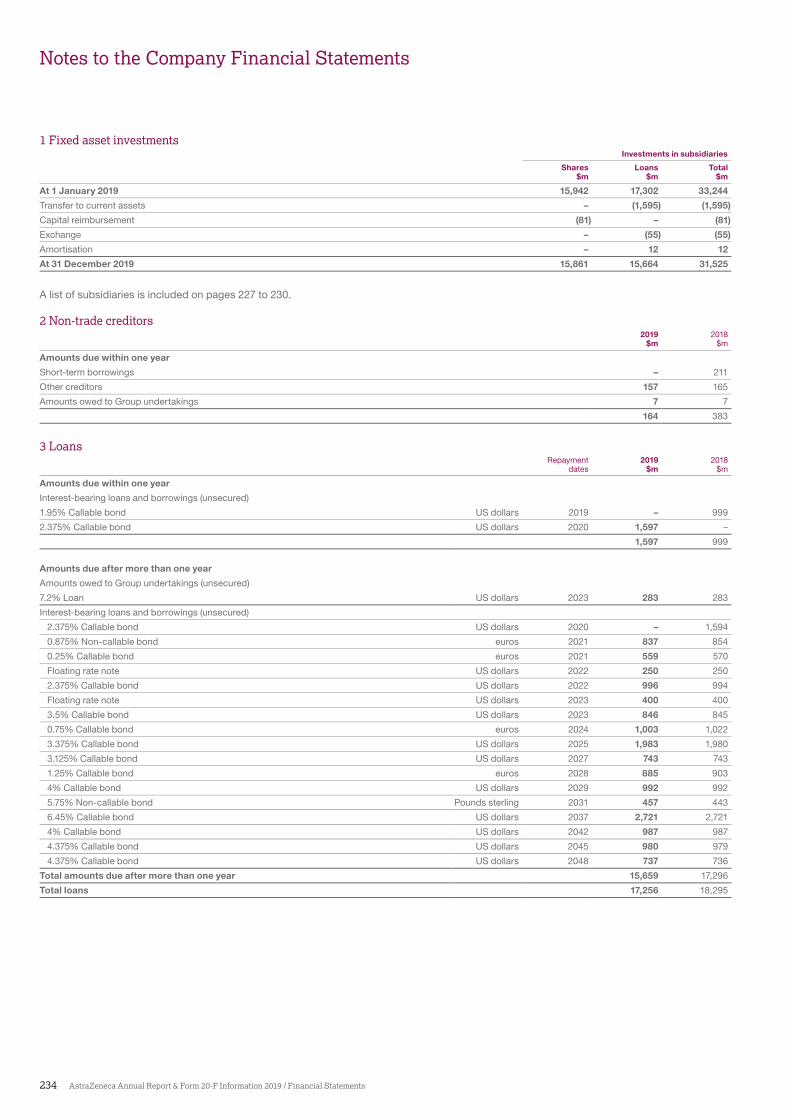
234 AstraZeneca Annual Report & Form 20-F Information 2019 / Financial Statements
Notes to the Company Financial Statements
1 Fixed asset investmentsInvestments in subsidiaries
Shares Loans Total$m $m $m
At 1 January 2019 15,942 17,302 33,244
Transfer to current assets – (1,595) (1,595)
Capital reimbursement (81) – (81)
Exchange – (55) (55)
Amortisation – 12 12
At 31 December 2019 15,861 15,664 31,525
A list of subsidiaries is included on pages 227 to 230.
2 Non-trade creditors2019 2018
$m $m
Amounts due within one year
Short-term borrowings – 211
Other creditors 157 165
Amounts owed to Group undertakings 7 7
164 383
3 Loans Repayment 2019 2018
dates $m $m
Amounts due within one year
Interest-bearing loans and borrowings (unsecured)
1.95% Callable bond US dollars 2019 – 999
2.375% Callable bond US dollars 2020 1,597 –
1,597 999
Amounts due after more than one year
Amounts owed to Group undertakings (unsecured)
7.2% Loan US dollars 2023 283 283
Interest-bearing loans and borrowings (unsecured)
2.375% Callable bond US dollars 2020 – 1,594
0.875% Non-callable bond euros 2021 837 854
0.25% Callable bond euros 2021 559 570
Floating rate note US dollars 2022 250 250
2.375% Callable bond US dollars 2022 996 994
Floating rate note US dollars 2023 400 400
3.5% Callable bond US dollars 2023 846 845
0.75% Callable bond euros 2024 1,003 1,022
3.375% Callable bond US dollars 2025 1,983 1,980
3.125% Callable bond US dollars 2027 743 743
1.25% Callable bond euros 2028 885 903
4% Callable bond US dollars 2029 992 992
5.75% Non-callable bond Pounds sterling 2031 457 443
6.45% Callable bond US dollars 2037 2,721 2,721
4% Callable bond US dollars 2042 987 987
4.375% Callable bond US dollars 2045 980 979
4.375% Callable bond US dollars 2048 737 736
Total amounts due after more than one year 15,659 17,296
Total loans 17,256 18,295
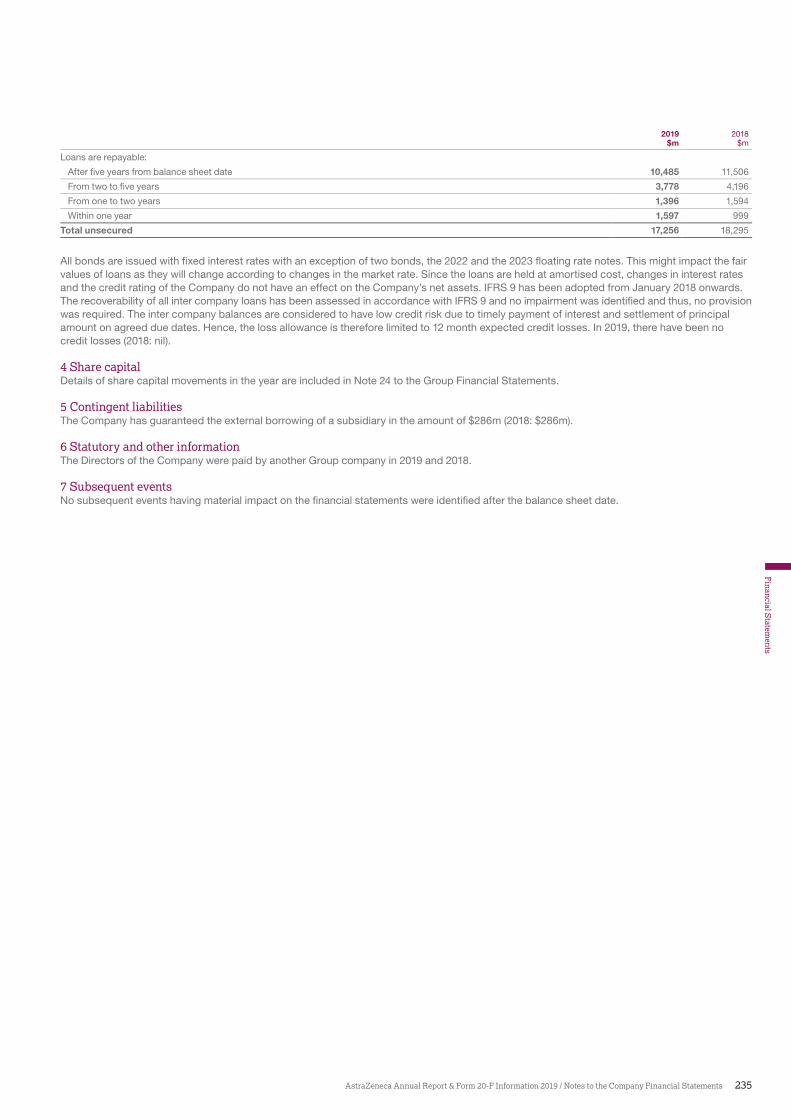
235
Financial S
tatements
AstraZeneca Annual Report & Form 20-F Information 2019 / Notes to the Company Financial Statements
2019 2018$m $m
Loans are repayable:
After five years from balance sheet date 10,485 11,506
From two to five years 3,778 4,196
From one to two years 1,396 1,594
Within one year 1,597 999
Total unsecured 17,256 18,295
All bonds are issued with �xed interest rates with an exception of two bonds, the 2022 and the 2023 �oating rate notes. This might impact the fair values of loans as they will change according to changes in the market rate. Since the loans are held at amortised cost, changes in interest rates and the credit rating of the Company do not have an effect on the Company’s net assets. IFRS 9 has been adopted from January 2018 onwards. The recoverability of all inter company loans has been assessed in accordance with IFRS 9 and no impairment was identi�ed and thus, no provision was required. The inter company balances are considered to have low credit risk due to timely payment of interest and settlement of principal amount on agreed due dates. Hence, the loss allowance is therefore limited to 12 month expected credit losses. In 2019, there have been no credit losses (2018: nil).
4 Share capitalDetails of share capital movements in the year are included in Note 24 to the Group Financial Statements.
5 Contingent liabilitiesThe Company has guaranteed the external borrowing of a subsidiary in the amount of $286m (2018: $286m).
6 Statutory and other informationThe Directors of the Company were paid by another Group company in 2019 and 2018.
7 Subsequent eventsNo subsequent events having material impact on the �nancial statements were identi�ed after the balance sheet date.
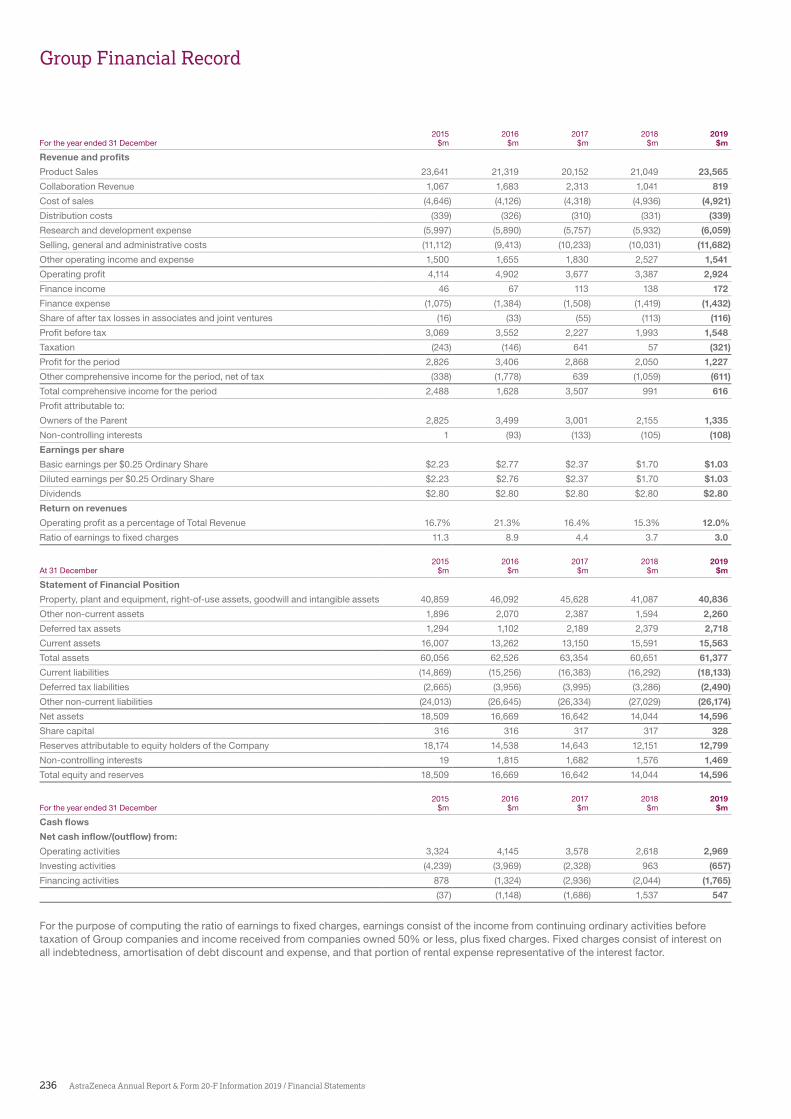
236 AstraZeneca Annual Report & Form 20-F Information 2019 / Financial Statements
Group Financial Record
2015 2016 2017 2018 2019For the year ended 31 December $m $m $m $m $m
Revenue and profits
Product Sales 23,641 21,319 20,152 21,049 23,565
Collaboration Revenue 1,067 1,683 2,313 1,041 819
Cost of sales (4,646) (4,126) (4,318) (4,936) (4,921)
Distribution costs (339) (326) (310) (331) (339)
Research and development expense (5,997) (5,890) (5,757) (5,932) (6,059)
Selling, general and administrative costs (11,112) (9,413) (10,233) (10,031) (11,682)
Other operating income and expense 1,500 1,655 1,830 2,527 1,541
Operating profit 4,114 4,902 3,677 3,387 2,924
Finance income 46 67 113 138 172
Finance expense (1,075) (1,384) (1,508) (1,419) (1,432)
Share of after tax losses in associates and joint ventures (16) (33) (55) (113) (116)
Profit before tax 3,069 3,552 2,227 1,993 1,548
Taxation (243) (146) 641 57 (321)
Profit for the period 2,826 3,406 2,868 2,050 1,227
Other comprehensive income for the period, net of tax (338) (1,778) 639 (1,059) (611)
Total comprehensive income for the period 2,488 1,628 3,507 991 616
Profit attributable to:
Owners of the Parent 2,825 3,499 3,001 2,155 1,335
Non-controlling interests 1 (93) (133) (105) (108)
Earnings per share
Basic earnings per $0.25 Ordinary Share $2.23 $2.77 $2.37 $1.70 $1.03
Diluted earnings per $0.25 Ordinary Share $2.23 $2.76 $2.37 $1.70 $1.03
Dividends $2.80 $2.80 $2.80 $2.80 $2.80
Return on revenues
Operating profit as a percentage of Total Revenue 16.7% 21.3% 16.4% 15.3% 12.0%
Ratio of earnings to fixed charges 11.3 8.9 4.4 3.7 3.0
2015 2016 2017 2018 2019At 31 December $m $m $m $m $m
Statement of Financial Position
Property, plant and equipment, right-of-use assets, goodwill and intangible assets 40,859 46,092 45,628 41,087 40,836
Other non-current assets 1,896 2,070 2,387 1,594 2,260
Deferred tax assets 1,294 1,102 2,189 2,379 2,718
Current assets 16,007 13,262 13,150 15,591 15,563
Total assets 60,056 62,526 63,354 60,651 61,377
Current liabilities (14,869) (15,256) (16,383) (16,292) (18,133)
Deferred tax liabilities (2,665) (3,956) (3,995) (3,286) (2,490)
Other non-current liabilities (24,013) (26,645) (26,334) (27,029) (26,174)
Net assets 18,509 16,669 16,642 14,044 14,596
Share capital 316 316 317 317 328
Reserves attributable to equity holders of the Company 18,174 14,538 14,643 12,151 12,799
Non-controlling interests 19 1,815 1,682 1,576 1,469
Total equity and reserves 18,509 16,669 16,642 14,044 14,596
2015 2016 2017 2018 2019For the year ended 31 December $m $m $m $m $m
Cash flows
Net cash inflow/(outflow) from:
Operating activities 3,324 4,145 3,578 2,618 2,969
Investing activities (4,239) (3,969) (2,328) 963 (657)
Financing activities 878 (1,324) (2,936) (2,044) (1,765)
(37) (1,148) (1,686) 1,537 547
For the purpose of computing the ratio of earnings to �xed charges, earnings consist of the income from continuing ordinary activities before taxation of Group companies and income received from companies owned 50% or less, plus �xed charges. Fixed charges consist of interest on all indebtedness, amortisation of debt discount and expense, and that portion of rental expense representative of the interest factor.