Embed Size (px)
Citation preview
WHAT SCHOOL FACTORS CONTRIBUTE TO
UNDERACHIEVEMENT? THE CASE OF CARIBBEAN
STUDENTS IN TORONTO SECONDARY SCHOOLS
by
Richard M.S. Linley
Bachelor of Political Science, University of Ottawa, 2004
PROJECT SUBMITTED IN PARTIAL FULFILLMENT OF
THE REQUIREMENTS FOR THE DEGREE OF
MASTER OF PUBLIC POLICY
In the
Faculty
of
Arts and Social Sciences
© Richard M.S. Linley, 2009
SIMON FRASER UNIVERSITY
Summer 2009
All rights reserved. This work may not be
reproduced in whole or in part, by photocopy
or other means, without permission of the author.
ii
Approval
Name: Richard M.S. Linley
Degree: Master of Public Policy
Title of Project: What School Factors Contribute to Underachievement?
The Case of Caribbean Students in Toronto Secondary
Schools
Supervisory Committee:
Chair: Nancy Olewiler
Director, Public Policy Program, SFU
___________________________________________
Dominique M. Gross
Senior Supervisor
Associate Professor, Public Policy Program, SFU
___________________________________________
John Richards
Internal Examiner
Professor, Public Policy Program, SFU
Date Defended/Approved: May 4, 2009
Last revision: Spring 09
Declaration of Partial Copyright Licence The author, whose copyright is declared on the title page of this work, has granted to Simon Fraser University the right to lend this thesis, project or extended essay to users of the Simon Fraser University Library, and to make partial or single copies only for such users or in response to a request from the library of any other university, or other educational institution, on its own behalf or for one of its users.
The author has further granted permission to Simon Fraser University to keep or make a digital copy for use in its circulating collection (currently available to the public at the “Institutional Repository” link of the SFU Library website <www.lib.sfu.ca> at: <http://ir.lib.sfu.ca/handle/1892/112>) and, without changing the content, to translate the thesis/project or extended essays, if technically possible, to any medium or format for the purpose of preservation of the digital work.
The author has further agreed that permission for multiple copying of this work for scholarly purposes may be granted by either the author or the Dean of Graduate Studies.
It is understood that copying or publication of this work for financial gain shall not be allowed without the author’s written permission.
Permission for public performance, or limited permission for private scholarly use, of any multimedia materials forming part of this work, may have been granted by the author. This information may be found on the separately catalogued multimedia material and in the signed Partial Copyright Licence.
While licensing SFU to permit the above uses, the author retains copyright in the thesis, project or extended essays, including the right to change the work for subsequent purposes, including editing and publishing the work in whole or in part, and licensing other parties, as the author may desire.
The original Partial Copyright Licence attesting to these terms, and signed by this author, may be found in the original bound copy of this work, retained in the Simon Fraser University Archive.
Simon Fraser University Library Burnaby, BC, Canada
STATEMENT OF ETHICS APPROVAL
The author, whose name appears on the title page of this work, has obtained, for the research described in this work, either:
(a) Human research ethics approval from the Simon Fraser University Office of Research Ethics,
or
(b) Advance approval of the animal care protocol from the University Animal Care Committee of Simon Fraser University;
or has conducted the research
(c) as a co-investigator, collaborator or research assistant in a research project approved in advance,
or
(d) as a member of a course approved in advance for minimal risk human research, by the Office of Research Ethics.
A copy of the approval letter has been filed at the Theses Office of the University Library at the time of submission of this thesis or project.
The original application for approval and letter of approval are filed with the relevant offices. Inquiries may be directed to those authorities.
Simon Fraser University Library
Simon Fraser University Burnaby, BC, Canada
Last update: Spring 2010
iii
Abstract
This study adds to the growing literature on the Black education experience in Canada.
The achievement gap among Black student populations and the resulting high dropout rate is well
documented in past studies. Given the varied results of these studies, there is a clear need for
further investigation of how school factors contribute to academic underachievement.
Specifically, this study explores the academic underachievement of Black Caribbean immigrants
in Toronto‟s public secondary schools. Through key informant interviews, focus groups and a
case study analysis, I examine whether school factors negatively influence the academic
performance of these students. Low teacher expectations; culturally insensitive curriculum;
school disciplinary practices; a lack of linkages between schools and the Caribbean community
and peer culture all show significance in this study. Drawing on these findings, the study
proposes and evaluates three policy options for addressing such factors.
Keywords: Toronto; Caribbean; Academic Underachievement; School Factors
Subject terms: Teacher Expectations; School Counselling Practices; School Curriculum; Peer
Groups; School Discipline; Generational Status; Toronto District School Board
iv
Executive Summary
The Toronto District School Board (TDSB) is the largest school board in Canada and
among the largest in North America, serving almost 1.4 million electors of the City of Toronto
According to the TDSB, Black students are more likely to be at risk of not graduating and
potentially dropping out of secondary school. In view of the achievement the gap, one of the
current initiatives of the TDSB is to improve the academic success of Black students.
Recognizing that Toronto‟s African Canadian community is not one and the same, this study
explores underachievement in a specific Black immigrant population, namely Caribbean
immigrants.
Seeking better educational opportunities for Caribbean youth is often one of the most
important reasons for migrating. Yet, these students have the highest dropout rate and at-risk rates
in credit accumulation among all Black students in the TDSB. The failure of these students to
complete secondary school and pursue post-secondary education calls into question some of the
benefits of emigration. Previous research suggests that teachers‟ low expectations from these
students combined with a misunderstanding of their culture increase settlement difficulties for
Caribbean youth and contribute to their academic underachievement.
To uncover school factors that may negatively influence the achievement patterns of
Caribbean students, I use information from interviews with education policy experts and
community stakeholders (i.e. key informants) in the City of Toronto. This data is supplemented
with interviews with focus groups made of first and second-generation Caribbean secondary
students to highlight some of the significant school factors that negatively influence these
v
students‟ academic performance in secondary school. A case study is also used to help
corroborate the findings.
My findings suggests low teacher expectations, culturally insensitive curriculum, school
disciplinary practices, a lack of linkages between schools and the Caribbean community, and
peer culture among Caribbean students exert a negative influence on school completion. These
findings, along with a survey of existing literature, inform my policy options. While a number of
options are considered, those proposed in this study include the following:
Provide Ongoing Diversity Training to All Employee Groups: The TDSB would provide
staff development opportunities related to racism and classism in partnership with the
Canadian Race Relations Foundation (CRRF) and the Settlement and Integration Services
Organization. The training supports school staff by deepening their awareness and
understanding of the implications of diversity, equity and racism in schools today.
Pilot Caribbean Academic Program: The TDSB would pilot the Caribbean Academic
Program (CAP), a specialized curriculum and transitional program. ESC Students spend
part of the day in their CAP classes and the other half in regular content courses. The
program offers a maximum of two years of language instruction and emphasis is on
learning English grammar and sentence structure by studying the differences between
Creole and English. Students receive full credits for their participation.
Partner with Pathways to Education to Target ESC Secondary Students: The TDSB
would work closely with Caribbean families and partner with the Pathways program to
address the needs of high-risk ESC students. The program would address many
community risk factors, such as poverty, minority status and the inability of Caribbean
parents to navigate the school system. The program is also free to participating students.
I assess the practicality of these options by using a set of criteria that includes effectiveness,
administrative feasibility, stakeholder acceptability and cost. This multi-criteria analysis reveals
vi
that partnering with Pathways to Education to target Caribbean students in Toronto‟s inner city
communities is the best policy to pursue. Subject to an ongoing evaluation of the partnership and
early outcomes, the TDSB may want to introduce some features of diversity training for all TDSB
employees at a later stage. Lastly, I suggest, while this study has identified some of the important
factors influencing dropout rates, future TDSB research should consider a quantitative study on
how school experiences impact student achievement and the decision to leave school early among
Caribbean youth.
vii
Dedication
To my parents, Rick and Anna, for their love, encouragement and support.
viii
Acknowledgements
First, I would like to express my sincere gratitude to my capstone supervisor, Professor
Dominique Gross, who read and corrected an endless number of my drafts and challenged me to
produce my very best work. I would also like to thank Professor John Richards for his questions
and comments during my defence and his academic support over the last two years. Thanks also
go out to all Public Policy faculty members for their encouragement during this process and the
unique opportunity to join the MPP program.
I am also very thankful to all those who participated in interviews in this study,
particularly Dr. Carl James, Dr. George Dei, Dr. Joe Springer, Dr. Kathleen Gallagher, Dr. Lance
McCready, Dr. Rob Brown and Kurt McIntosh. I would also like to thank the Jamaican Canadian
Association who provided me with valuable input and helped organize the focus groups for this
study. This study would have not been possible without their help.
I am also thankful for my family and friends in Ontario, who patiently endured my
absence during graduate school and for their words of encouragement along the way. Finally, I
would have not finished this degree were it not for Elizabeth Koster, who joined me in British
Columbia during this pursuit. Her unending patience and support have been crucial to my
academic and professional success over the last four years.
ix
Table of Contents
Approval ......................................................................................................................................... ii
Abstract .......................................................................................................................................... iii
Executive Summary ...................................................................................................................... iv
Dedication ..................................................................................................................................... vii
Acknowledgements ..................................................................................................................... viii
Table of Contents .......................................................................................................................... ix
List of Figures ................................................................................................................................ xi
List of Tables ................................................................................................................................ xii
Glossary ....................................................................................................................................... xiv
1: Introduction ............................................................................................................................... 1
2: Demographics and School Performance .................................................................................. 3
2.1 Demographics ............................................................................................................ 3 2.2 School Performance ................................................................................................... 6
2.2.1 International Data on School Performance ............................................................ 8 2.2.2 TDSB Data on School Performance by Region of Birth ....................................... 9
3: Theory about Minorities and School Performance .............................................................. 14
3.1.1 Teacher Expectations ........................................................................................... 15 3.1.2 School Counselling Practices .............................................................................. 16 3.1.3 School Curriculum ............................................................................................... 16 3.1.4 Peer Groups ......................................................................................................... 17 3.1.5 School Discipline ................................................................................................. 19
3.2 Generational Status .................................................................................................. 19
4: Policy Problem and Key Stakeholders ................................................................................... 22
5: Methodology ............................................................................................................................. 25
5.1 Key Informants ........................................................................................................ 25 5.2 Focus Groups ........................................................................................................... 27 5.3 Analytical Method ................................................................................................... 30
6: Analysis ..................................................................................................................................... 31
6.1 Key Informants ........................................................................................................ 31 6.1.1 Teacher Expectations ........................................................................................... 31 6.1.2 School Counselling Practices .............................................................................. 34 6.1.3 School Curriculum ............................................................................................... 36 6.1.4 Peer Groups ......................................................................................................... 37 6.1.5 School Discipline ................................................................................................. 38 6.1.6 Generational Status .............................................................................................. 39
6.2 Focus Groups ........................................................................................................... 40
x
6.2.1 Teacher Expectations ........................................................................................... 40 6.2.2 School Counselling Practices .............................................................................. 42 6.2.3 School Curriculum ............................................................................................... 42 6.2.4 School Discipline ................................................................................................. 43 6.2.5 Peer Groups ......................................................................................................... 43 6.2.6 Other School Factors ........................................................................................... 44
6.3 Case Study ............................................................................................................... 45 6.4 Summary of Findings .............................................................................................. 47
7: Policy Objectives, Options, Criteria Analysis ....................................................................... 52
7.1 Policy Objectives ..................................................................................................... 52 7.1.1 Policy Options ..................................................................................................... 52
7.2 Criteria for Analysis ................................................................................................ 56
8: Analysis of Policy Options ...................................................................................................... 61
8.1 Option 1: Provide Ongoing Diversity Training for All TDSB Employee
Groups ..................................................................................................................... 61 8.2 Option 2: Pilot Caribbean Academic Program ........................................................ 63 8.3 Option 3: Partner with Pathways to Education to Target ESC Secondary
Students ................................................................................................................... 65 8.4 Policy Recommendations ........................................................................................ 68
9: Conclusions .............................................................................................................................. 71
Appendices .................................................................................................................................... 73
Appendix A: Key Informant Questions ..................................................................................... 74 Appendix B: Key Informant Results .......................................................................................... 76 Appendix C: Focus Group Survey ............................................................................................. 79 Appendix D: Focus Group Survey Results ................................................................................ 81 Appendix E: Focus Group Questions ......................................................................................... 82 Appendix F: Focus Group Sample Results ................................................................................ 84 Appendix G: Dropout Data from Springer et al. Case Study ..................................................... 87 Bibliography .............................................................................................................................. 88 Websites Visited ........................................................................................................................ 93
xi
List of Figures
Figure 1: Dropout of Cohort by the Fall 2005 by Region of Birth ....................................10
xii
List of Tables
Table 1: People of Caribbean Origin in the CMA and the City of Toronto ........................5
Table 2: 2006 Black Student Population in the TDSB ........................................................6
Table 3: Trends of Education Attainment of the Total Population Aged 15 and
Over by Country & Group ..................................................................................9
Table 4: Gr. 9 Cohort Student Achievement in Credit Accumulation by Region of
Birth ..................................................................................................................10
Table 5: Student Achievement in Mathematics, Science & Geography by Region
of Birth ..............................................................................................................11
Table 6: Student Achievement in English by Region of Birth ..........................................12
Table 7: Student Achievement in the Ontario Secondary School Literacy Test by
Region of Birth ..................................................................................................13
Table 8: Key Informants Interviewed & Position Title .....................................................25
Table 9: Interview Themes & Questions Explored with Key Informants .........................27
Table 10: Summary of Focus Group Survey Findings – Demographic Data ....................29
Table 11: School Factors Explored with Caribbean Secondary Students ..........................29
Table 12: Summary of Key Informant Responses .............................................................32
Table 13: Results from Focus Group Discussions with First Generation Students ...........40
Table 14: Comparative Analysis of Focus Group and Case Study Results .......................46
Table 15: Summary of Overall Findings ...........................................................................50
Table 16: Criteria and Measures for Analysis of the Policy Options ................................57
Table 17: Evaluation of Policy Options .............................................................................68
Table 18: Summary of Key Informant Responses Regarding Teacher Expectations ........76
Table 19: Summary of Key Informant Responses Regarding School Counselling
Practices ............................................................................................................76
Table 20: Summary of Key Informant Responses Regarding School Curriculum ............77
Table 21: Summary of Key Informant Responses Regarding Peer Groups ......................77
Table 22: Summary of Key Informant Responses Regarding School Discipline ..............78
Table 23: Summary of Focus Group Survey Results A .....................................................81
Table 24: Summary of Focus Group Survey Results B .....................................................81
xiii
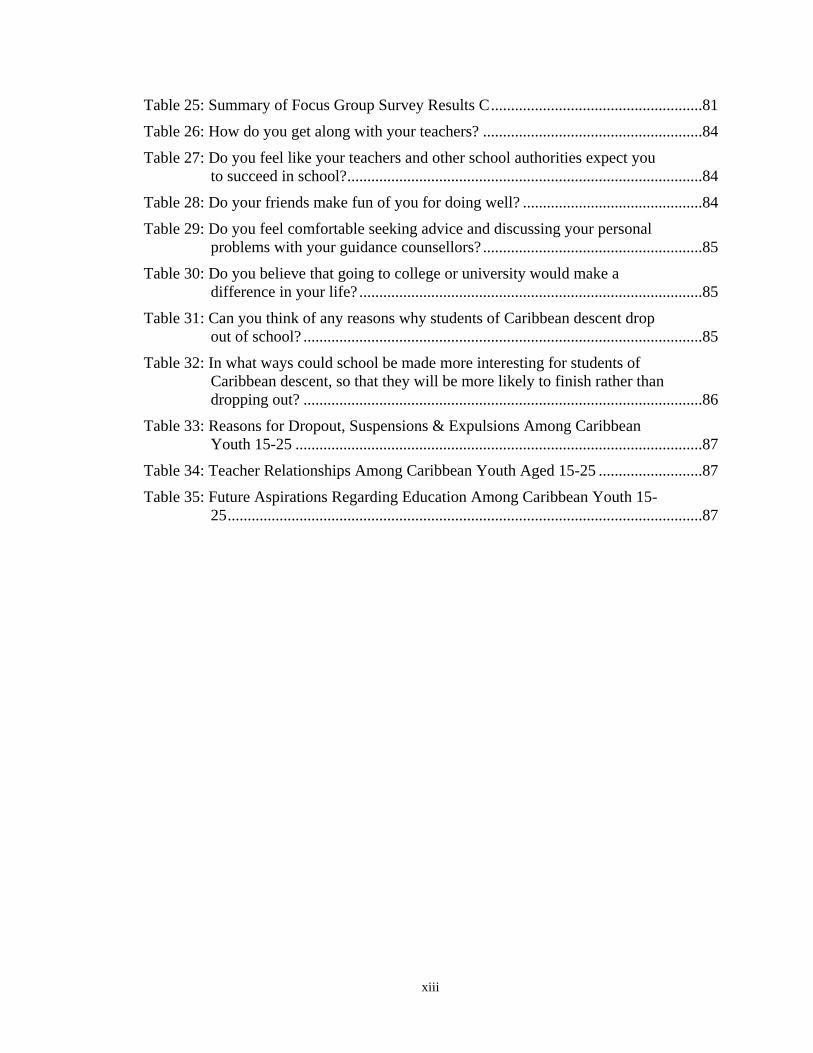
Table 25: Summary of Focus Group Survey Results C .....................................................81
Table 26: How do you get along with your teachers? .......................................................84
Table 27: Do you feel like your teachers and other school authorities expect you
to succeed in school? .........................................................................................84
Table 28: Do your friends make fun of you for doing well? .............................................84
Table 29: Do you feel comfortable seeking advice and discussing your personal
problems with your guidance counsellors? .......................................................85
Table 30: Do you believe that going to college or university would make a
difference in your life? ......................................................................................85
Table 31: Can you think of any reasons why students of Caribbean descent drop
out of school? ....................................................................................................85
Table 32: In what ways could school be made more interesting for students of
Caribbean descent, so that they will be more likely to finish rather than
dropping out? ....................................................................................................86
Table 33: Reasons for Dropout, Suspensions & Expulsions Among Caribbean
Youth 15-25 ......................................................................................................87
Table 34: Teacher Relationships Among Caribbean Youth Aged 15-25 ..........................87
Table 35: Future Aspirations Regarding Education Among Caribbean Youth 15-
25 .......................................................................................................................87
xiv
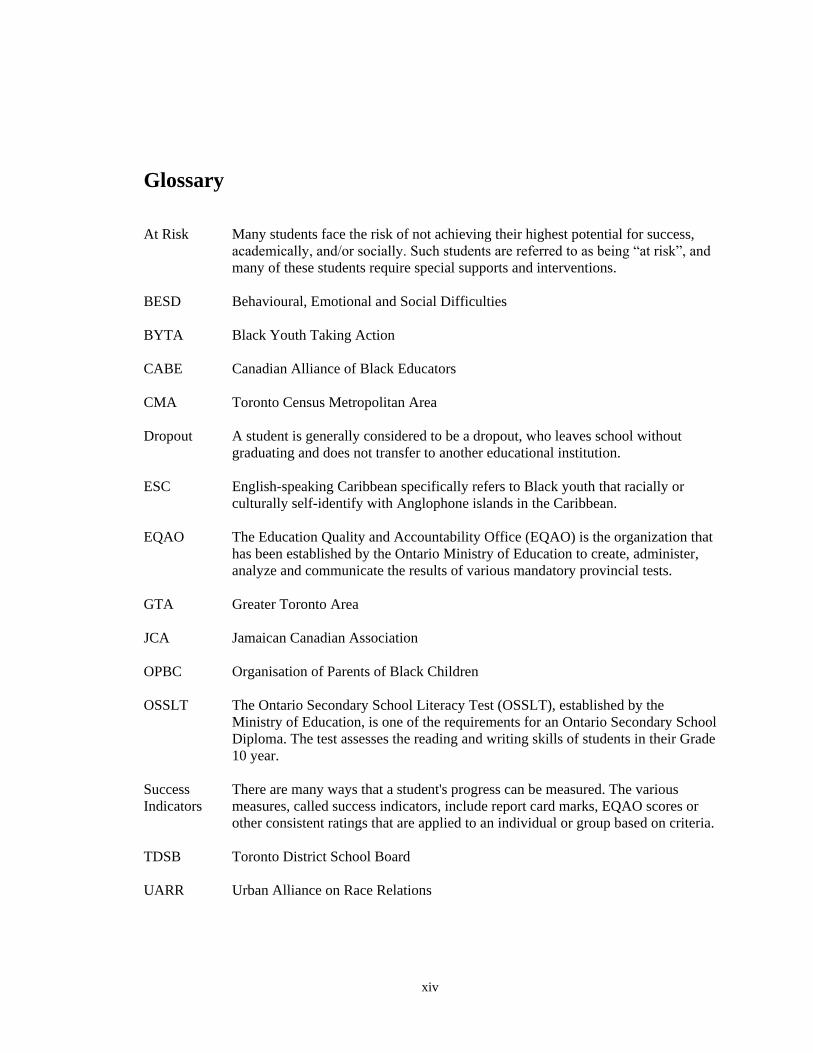
Glossary
At Risk
BESD
BYTA
CABE
CMA
Dropout
ESC
EQAO
GTA
JCA
OPBC
OSSLT
Success
Indicators
TDSB
UARR
Many students face the risk of not achieving their highest potential for success,
academically, and/or socially. Such students are referred to as being “at risk”, and
many of these students require special supports and interventions.
Behavioural, Emotional and Social Difficulties
Black Youth Taking Action
Canadian Alliance of Black Educators
Toronto Census Metropolitan Area
A student is generally considered to be a dropout, who leaves school without
graduating and does not transfer to another educational institution.
English-speaking Caribbean specifically refers to Black youth that racially or
culturally self-identify with Anglophone islands in the Caribbean.
The Education Quality and Accountability Office (EQAO) is the organization that
has been established by the Ontario Ministry of Education to create, administer,
analyze and communicate the results of various mandatory provincial tests.
Greater Toronto Area
Jamaican Canadian Association
Organisation of Parents of Black Children
The Ontario Secondary School Literacy Test (OSSLT), established by the
Ministry of Education, is one of the requirements for an Ontario Secondary School
Diploma. The test assesses the reading and writing skills of students in their Grade
10 year.
There are many ways that a student's progress can be measured. The various
measures, called success indicators, include report card marks, EQAO scores or
other consistent ratings that are applied to an individual or group based on criteria.
Toronto District School Board
Urban Alliance on Race Relations
1
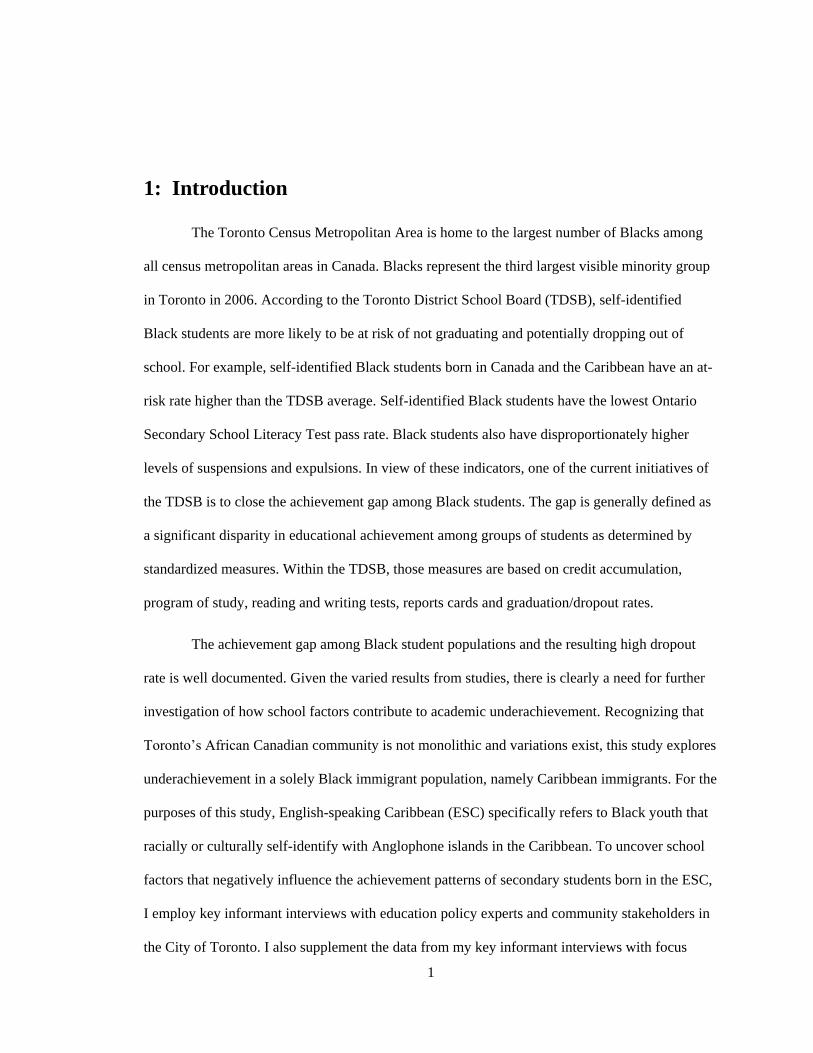
1: Introduction
The Toronto Census Metropolitan Area is home to the largest number of Blacks among
all census metropolitan areas in Canada. Blacks represent the third largest visible minority group
in Toronto in 2006. According to the Toronto District School Board (TDSB), self-identified
Black students are more likely to be at risk of not graduating and potentially dropping out of
school. For example, self-identified Black students born in Canada and the Caribbean have an at-
risk rate higher than the TDSB average. Self-identified Black students have the lowest Ontario
Secondary School Literacy Test pass rate. Black students also have disproportionately higher
levels of suspensions and expulsions. In view of these indicators, one of the current initiatives of
the TDSB is to close the achievement gap among Black students. The gap is generally defined as
a significant disparity in educational achievement among groups of students as determined by
standardized measures. Within the TDSB, those measures are based on credit accumulation,
program of study, reading and writing tests, reports cards and graduation/dropout rates.
The achievement gap among Black student populations and the resulting high dropout
rate is well documented. Given the varied results from studies, there is clearly a need for further
investigation of how school factors contribute to academic underachievement. Recognizing that
Toronto‟s African Canadian community is not monolithic and variations exist, this study explores
underachievement in a solely Black immigrant population, namely Caribbean immigrants. For the
purposes of this study, English-speaking Caribbean (ESC) specifically refers to Black youth that
racially or culturally self-identify with Anglophone islands in the Caribbean. To uncover school
factors that negatively influence the achievement patterns of secondary students born in the ESC,
I employ key informant interviews with education policy experts and community stakeholders in
the City of Toronto. I also supplement the data from my key informant interviews with focus
2
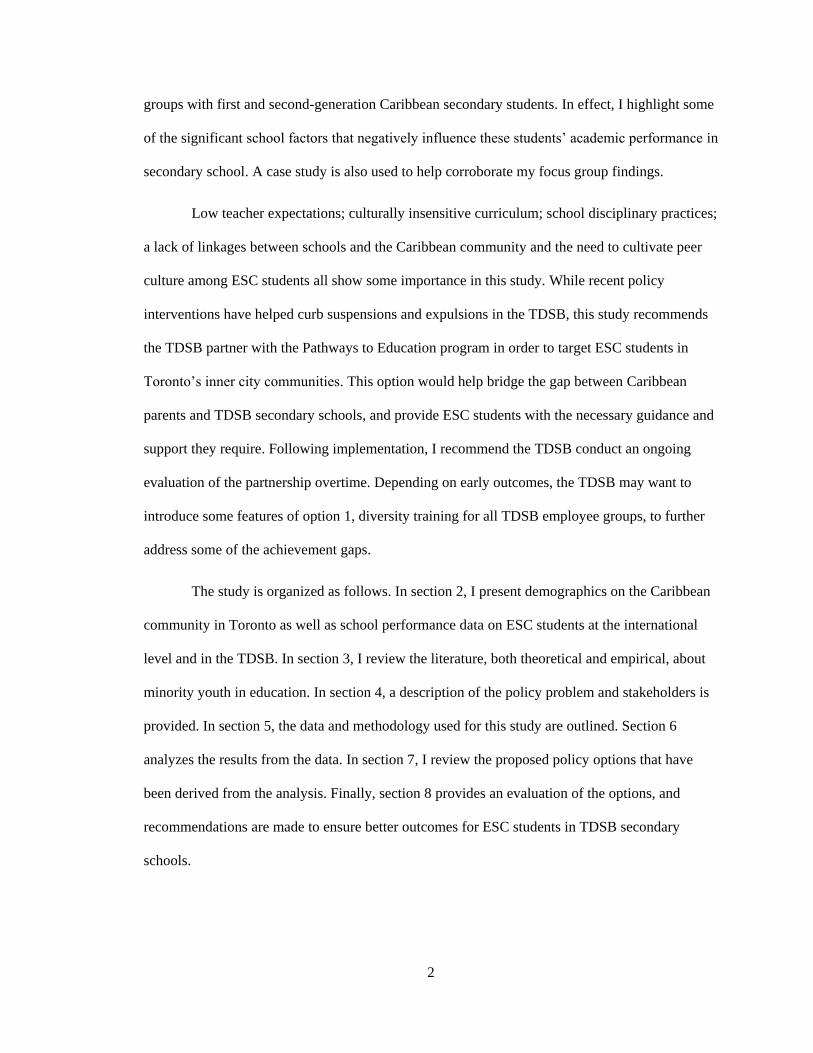
groups with first and second-generation Caribbean secondary students. In effect, I highlight some
of the significant school factors that negatively influence these students‟ academic performance in
secondary school. A case study is also used to help corroborate my focus group findings.
Low teacher expectations; culturally insensitive curriculum; school disciplinary practices;
a lack of linkages between schools and the Caribbean community and the need to cultivate peer
culture among ESC students all show some importance in this study. While recent policy
interventions have helped curb suspensions and expulsions in the TDSB, this study recommends
the TDSB partner with the Pathways to Education program in order to target ESC students in
Toronto‟s inner city communities. This option would help bridge the gap between Caribbean
parents and TDSB secondary schools, and provide ESC students with the necessary guidance and
support they require. Following implementation, I recommend the TDSB conduct an ongoing
evaluation of the partnership overtime. Depending on early outcomes, the TDSB may want to
introduce some features of option 1, diversity training for all TDSB employee groups, to further
address some of the achievement gaps.
The study is organized as follows. In section 2, I present demographics on the Caribbean
community in Toronto as well as school performance data on ESC students at the international
level and in the TDSB. In section 3, I review the literature, both theoretical and empirical, about
minority youth in education. In section 4, a description of the policy problem and stakeholders is
provided. In section 5, the data and methodology used for this study are outlined. Section 6
analyzes the results from the data. In section 7, I review the proposed policy options that have
been derived from the analysis. Finally, section 8 provides an evaluation of the options, and
recommendations are made to ensure better outcomes for ESC students in TDSB secondary
schools.
3
2: Demographics and School Performance
This section begins with background information on the Caribbean region and the
immigration patterns of Caribbean immigrants to Canada since the 1960s. Subsequently, I
provide an overview of the latest Census data on people of Caribbean origin living in the Toronto
Census Metropolitan Area (CMA) and in the City of Toronto. I then compare the CMA and City
data with demographic data on Caribbean secondary students and their school performance at the
international level and in the TDSB.
2.1 Demographics
The Caribbean region is comprised of 50 inhabited island countries that stretch in a
2,000-mile-long arc between Trinidad and western Cuba. The Caribbean culture contains
influences from African, Spanish, British, French, Dutch, Asian and Native American cultures. In
addition to ethnic diversity, the region is home to a variety of races. While a large portion of the
population is of African descent, there is an array of languages spoken in the Caribbean region
including English, French, Spanish, Dutch and Creole. Caribbean people also share a common set
of cultural values, including the presence of extended families and a strong sense of family
cohesion; the importance of spirituality (many are practicing Christians); a focus on self-
improvement; and a strong sense of ethnic pride based on allegiance to one‟s country of origin
(Mitchell and Bryan, 2007).
Historically, the first wave of Caribbean immigrants to Canada arrived in 1956 when two
thousand West Indians came as university students and domestics (Coelho, 1988). In 1967,
Canada‟s immigration department eliminated country quotas and the number of Caribbean
newcomers to Canada started to increase. By 2001, 25% of Caribbean immigrants living in
4
Canada had arrived between 1981 and 1990, while another 28% had arrived in the subsequent
decade. In contrast, only 14% had arrived in the 1960s, while just 2% came before 1961. Today,
Canadians of Caribbean origin form one of the largest non-European ethnic origin groups in
Canada. Over half a million people (578,695) of Caribbean origin live in Canada, representing
close to 2% of the total population. The majority of people of Caribbean origin live in either
Ontario or Quebec, but they account for a small share of the overall population in both provinces
(Lindsay, 2007). In 2006, 40% (229,580) of all those who reported Caribbean origin (age 15 and
over) lived in the Toronto CMA, accounting for 5% of the CMA population (5,113,149)
(Statistics Canada, 2006).
Based on Statistics Canada‟s 2006 Profile of Ethnic Origin and Visible Minorities, Table
1 outlines the distribution of the Caribbean population in the CMA and the City of Toronto.
Among those in the CMA, 51% said they were Jamaican, while 15% were Guyanese, 13% were
West Indian, 11% were Trinidadian and Tobagonian and 5% were Barbadian. Hence, Jamaicans
represent the largest subgroup of people of Caribbean of origin living in the CMA. The largest
share of those aged 15 and over is first generation 71% (162,830), followed by second generation
26% (59,950) and third generation or more 3% (6,795)1 (Statistics Canada, 2006).
1 According to Statistics Canada, 1st generation refers to persons born outside Canada; 2nd generation refers to persons
born in Canada with at least one parent born outside Canada; 3rd generation refers to person born in Canada with
parents born in Canada.
5
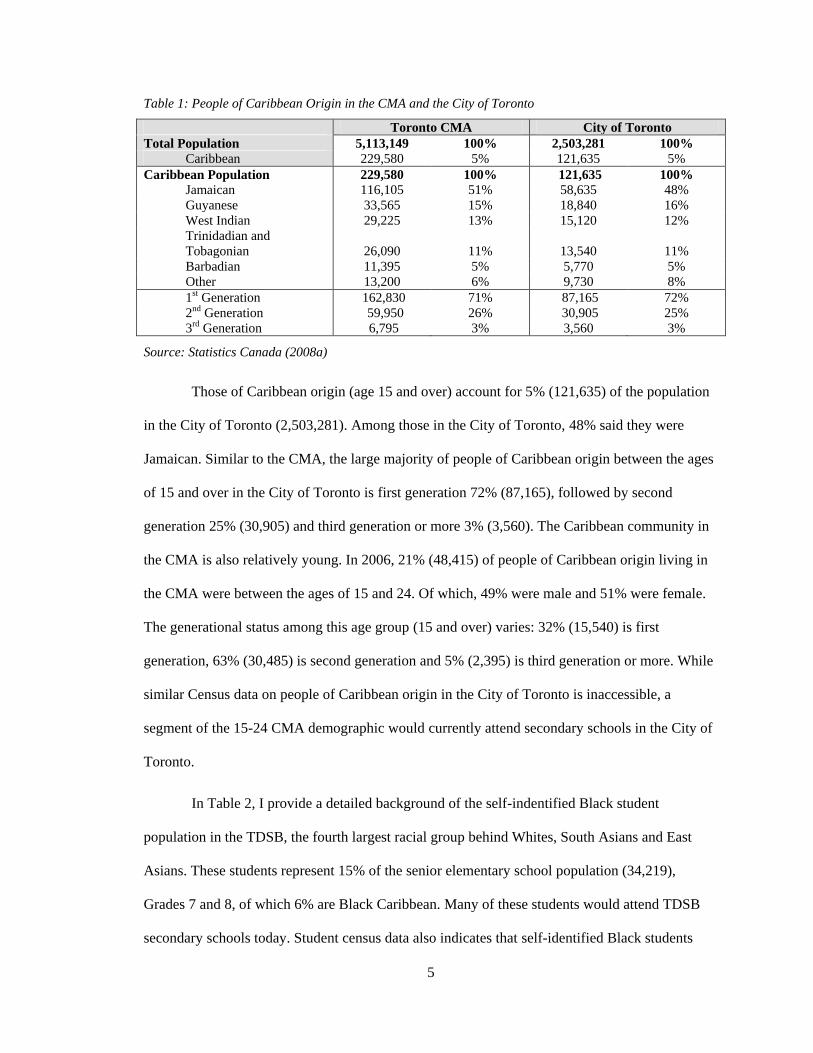
Table 1: People of Caribbean Origin in the CMA and the City of Toronto
Toronto CMA City of Toronto
Total Population 5,113,149 100% 2,503,281 100%
Caribbean 229,580 5% 121,635 5%
Caribbean Population 229,580 100% 121,635 100%
Jamaican 116,105 51% 58,635 48%
Guyanese 33,565 15% 18,840 16%
West Indian 29,225 13% 15,120 12%
Trinidadian and
Tobagonian
26,090
11%
13,540
11%
Barbadian 11,395 5% 5,770 5%
Other 13,200 6% 9,730 8%
1st Generation 162,830 71% 87,165 72%
2nd Generation 59,950 26% 30,905 25%
3rd Generation 6,795 3% 3,560 3%
Source: Statistics Canada (2008a)
Those of Caribbean origin (age 15 and over) account for 5% (121,635) of the population
in the City of Toronto (2,503,281). Among those in the City of Toronto, 48% said they were
Jamaican. Similar to the CMA, the large majority of people of Caribbean origin between the ages
of 15 and over in the City of Toronto is first generation 72% (87,165), followed by second
generation 25% (30,905) and third generation or more 3% (3,560). The Caribbean community in
the CMA is also relatively young. In 2006, 21% (48,415) of people of Caribbean origin living in
the CMA were between the ages of 15 and 24. Of which, 49% were male and 51% were female.
The generational status among this age group (15 and over) varies: 32% (15,540) is first
generation, 63% (30,485) is second generation and 5% (2,395) is third generation or more. While
similar Census data on people of Caribbean origin in the City of Toronto is inaccessible, a
segment of the 15-24 CMA demographic would currently attend secondary schools in the City of
Toronto.
In Table 2, I provide a detailed background of the self-indentified Black student
population in the TDSB, the fourth largest racial group behind Whites, South Asians and East
Asians. These students represent 15% of the senior elementary school population (34,219),
Grades 7 and 8, of which 6% are Black Caribbean. Many of these students would attend TDSB
secondary schools today. Student census data also indicates that self-identified Black students

6
represent 12% of the secondary school population (71,222), Grades 9 to 12, of which 6% are
Black Caribbean (Yau & O‟Reilly, 2007). Thus, at both the senior elementary and secondary
school levels, Black Caribbean students represent the largest subgroup within the Black student
population. While many of these students are 2nd or 3rd generation, students born in the ESC (1st
generation), are underperforming academically at the secondary level. The subsequent section
provides data on the school performance of ESC students internationally and in the TDSB.
Table 2: 2006 Black Student Population in the TDSB
Detailed Racial Background Grade 7-8 Grade 9-12
Total number of TDSB Students 34,219 71,222
Black Canadian % 5% of pop. 2% of pop.
Black Caribbean % 6% of pop. 6% of pop.
Black African % 4% of pop. 4% of pop.
Source: Yau & O‟Reilly, 2007
2.2 School Performance
The TDSB was created on January 1, 1998, following the amalgamation of seven boards
of education (Grodesky et al., 2004). It is the largest school board in Canada and among the
largest in North America, serving almost 1.4 million electors of the City of Toronto (TDSB,
2008a). The student body is also diverse: whereas Toronto elementary schools receive up to 8,000
newcomers each year from many countries, secondary schools receive on average 4,000
newcomers each year (Dei, 2008). As a result, approximately 80,000 (30%) of students were born
outside of Canada in more than 175 different countries; 27,000 (10%) of students have been in
Canada for three years or less; and over 80 languages are represented in schools. For example,
2005 statistics show that approximately 41% of secondary students have a first language other
than English (Dei 2008). Given the student diversity, there is a current gap in knowledge about
how well secondary students from various demographic backgrounds do in their studies. To
address this gap, the TDSB is exploring links between demographic data and student achievement
7
among its senior elementary and secondary student populations and early findings indicate high
underachievement among Black youth, some of whom were born in ESC (Brown, 2006).
The pattern of migration of people from the Caribbean to Canada is unique among
immigrants, especially for youth. During the 1980s many children immigrated to Canada in order
to join their parents who had come before them. This had enormous consequences. Youth may be
dealing with a restructured family that may have been separated for more than a decade. The
situation is complicated if they have other siblings who were born in Canada, or they are dealing
with step-siblings who now form part of the new mixed family. They may have left the emotional
attachment to extended family, especially a grandmother, to join a family where their situation is
less stable (Scott, 1990). For example, a recent study suggests ESC students are more likely to
enter school one year late (88 percent) and live in alternate family structures; only 26 percent of
students from the Caribbean lived in two parent families. Ultimately, the high rate of Caribbean
single parenthood limits parental preparation of youth for school. ESC students are also the least
likely to be enrolled in the „Academic‟ stream in the TDSB, with only 39 percent of secondary
students on this path (Anisef et al., 2008). In addition to migration stress and parental status
factors, Caribbean immigrants face a host of concerns associated with their minority group status.
Like many Blacks immigrants, they expect to experience the “mobility dream” where any person
can “make it” regardless of ethnicity or race, and education is viewed as a means of attaining this
dream (Plaza, 1998). In fact, seeking better educational opportunities for youth is often one of the
most important reasons for migrating (Smith et al, 2005). However, the realities of day-to-day life
do not always correspond with these expectations (Plaza, 1998). Racism and other barriers to
immigrant mobility, such as an increased number of Caribbean immigrants living below the
poverty line, may limit these expectations.2 This suggests the effects of community and socio-
2 The poverty line is defined as the low income cutoff (LICO), as defined by Statistics Canada. Specifically, LICOs –
based on data from the Survey of Household Spending – are defined as the income below which a family is likely to
spend 20 percentage points more of its income on food, shelter and clothing than the average family. LICOs are
calculated using both total income (i.e. income after government transfers, but before taxes) and after-tax income.
8
demographic characteristics on student achievement. In fact, concern has been expressed since
the 1970s about the 'ghettoisation' of Black tenants in Metropolitan Toronto Housing Authority
(MTHA) public housing, particularly among Caribbean immigrants (Murdie, 1994). Some of the
“ghetto-like” neighbourhoods in which these students live may adversely affect the quality of the
schools they attend. The acculturation process for ESC students therefore has negative impact on
their academic performance and over the course of their lifetime (Mitchell & Bryan, 2007).
2.2.1 International Data on School Performance
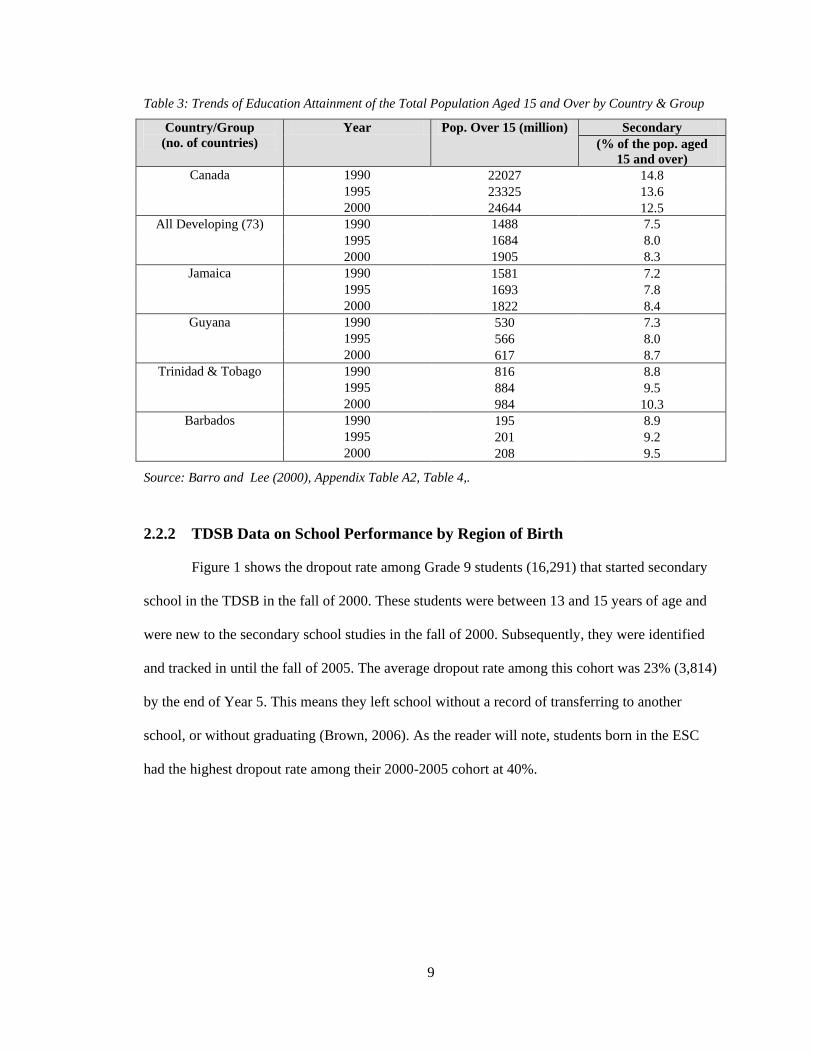
Table 3 presents time-series data on the educational attainment for the population over
age 15 at five-year intervals between 1990 and 2000 for a number of ESC countries. Specifically,
the date set refers to the percentage of the population for whom the secondary school level was
the highest level of education attained. Data is provided for four countries of the five largest
subgroups of people of Caribbean of origin living in the CMA. For comparison purposes, similar
data is provided for Canada and all developing countries.
Secondary school attainment has modestly improved in the four ESC countries in the
1990s up until 2000.3 It is lowest in Jamaica (8.4%), followed by Guyana (8.7%), Barbados
(9.5%) and Trinidad & Tobago (10.3%), and these countries have a slightly higher secondary
school attainment than all developing countries (8.3%). Still, all four ESC countries lag behind
Canada (12.5%) in this regard, highlighting a small gap in secondary school attainment for the
population over age 15. This gap is further substantiated in the next section, which provides data
on ESC students and their school performance relative to other secondary students in the TDSB.
There are separate cut-offs for seven sizes of family (from unattached individuals to families of seven or more persons)
and for five community sizes (from rural areas to urban areas with a population of more than 500,000) (Statistics
Canada, 2008b). 3 Similar results are observed for the population over age 25.
9
Table 3: Trends of Education Attainment of the Total Population Aged 15 and Over by Country & Group
Country/Group
(no. of countries)
Year Pop. Over 15 (million) Secondary
(% of the pop. aged
15 and over)
Canada 1990 22027 14.8
1995 23325 13.6
2000 24644 12.5
All Developing (73) 1990 1488 7.5
1995 1684 8.0
2000 1905 8.3
Jamaica 1990 1581 7.2
1995 1693 7.8
2000 1822 8.4
Guyana 1990 530 7.3
1995 566 8.0
2000 617 8.7
Trinidad & Tobago 1990 816 8.8
1995 884 9.5
2000 984 10.3
Barbados 1990 195 8.9
1995 201 9.2
2000 208 9.5
Source: Barro and Lee (2000), Appendix Table A2, Table 4,.
2.2.2 TDSB Data on School Performance by Region of Birth
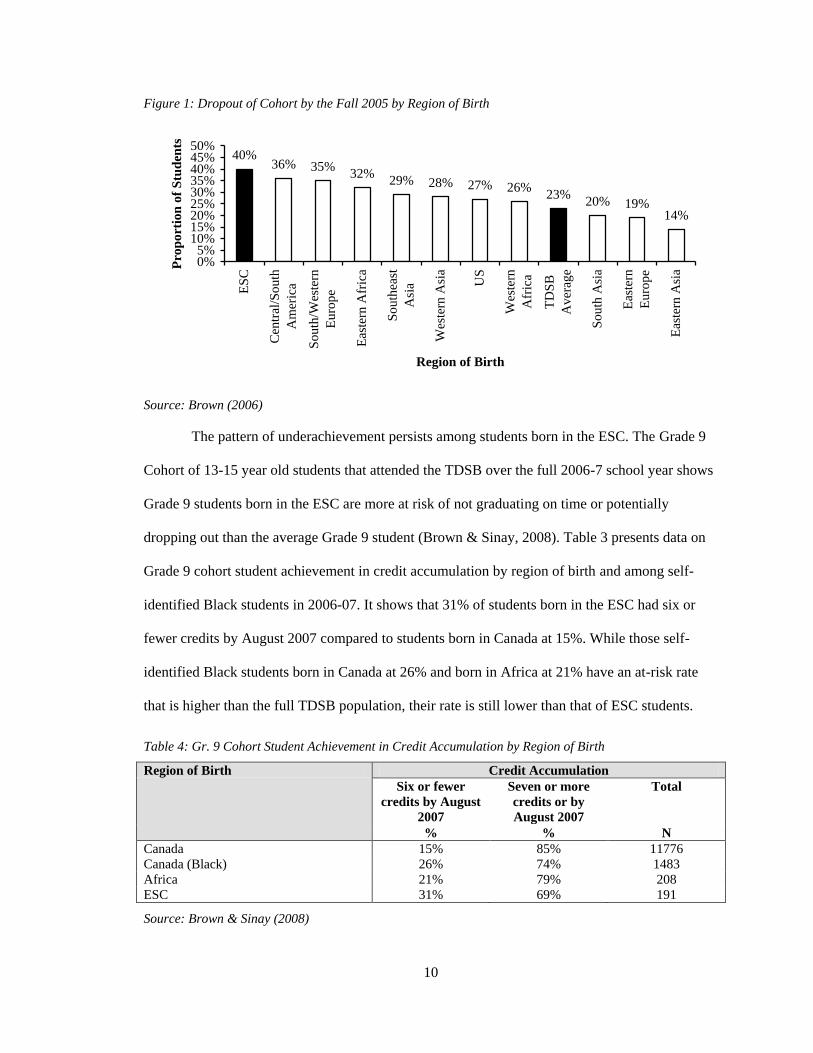
Figure 1 shows the dropout rate among Grade 9 students (16,291) that started secondary
school in the TDSB in the fall of 2000. These students were between 13 and 15 years of age and
were new to the secondary school studies in the fall of 2000. Subsequently, they were identified
and tracked in until the fall of 2005. The average dropout rate among this cohort was 23% (3,814)
by the end of Year 5. This means they left school without a record of transferring to another
school, or without graduating (Brown, 2006). As the reader will note, students born in the ESC
had the highest dropout rate among their 2000-2005 cohort at 40%.
10
Figure 1: Dropout of Cohort by the Fall 2005 by Region of Birth
40%36% 35%
32%29% 28% 27% 26%
23%20% 19%
14%
0%5%
10%15%20%25%30%35%40%45%50%
ES
C
Cen
tral
/So
uth
Am
eric
a
So
uth
/Wes
tern
Euro
pe
Eas
tern
Afr
ica
So
uth
east
Asi
a
Wes
tern
Asi
a
US
Wes
tern
Afr
ica
TD
SB
Av
erag
e
So
uth
Asi
a
Eas
tern
Euro
pe
Eas
tern
Asi
a
Region of Birth
Pro
po
rtio
n o
f S
tud
ents
Source: Brown (2006)
The pattern of underachievement persists among students born in the ESC. The Grade 9
Cohort of 13-15 year old students that attended the TDSB over the full 2006-7 school year shows
Grade 9 students born in the ESC are more at risk of not graduating on time or potentially
dropping out than the average Grade 9 student (Brown & Sinay, 2008). Table 3 presents data on
Grade 9 cohort student achievement in credit accumulation by region of birth and among self-
identified Black students in 2006-07. It shows that 31% of students born in the ESC had six or
fewer credits by August 2007 compared to students born in Canada at 15%. While those self-
identified Black students born in Canada at 26% and born in Africa at 21% have an at-risk rate
that is higher than the full TDSB population, their rate is still lower than that of ESC students.
Table 4: Gr. 9 Cohort Student Achievement in Credit Accumulation by Region of Birth
Region of Birth Credit Accumulation
Six or fewer
credits by August
2007
Seven or more
credits or by
August 2007
Total
% % N
Canada 15% 85% 11776
Canada (Black) 26% 74% 1483
Africa 21% 79% 208
ESC 31% 69% 191
Source: Brown & Sinay (2008)
11
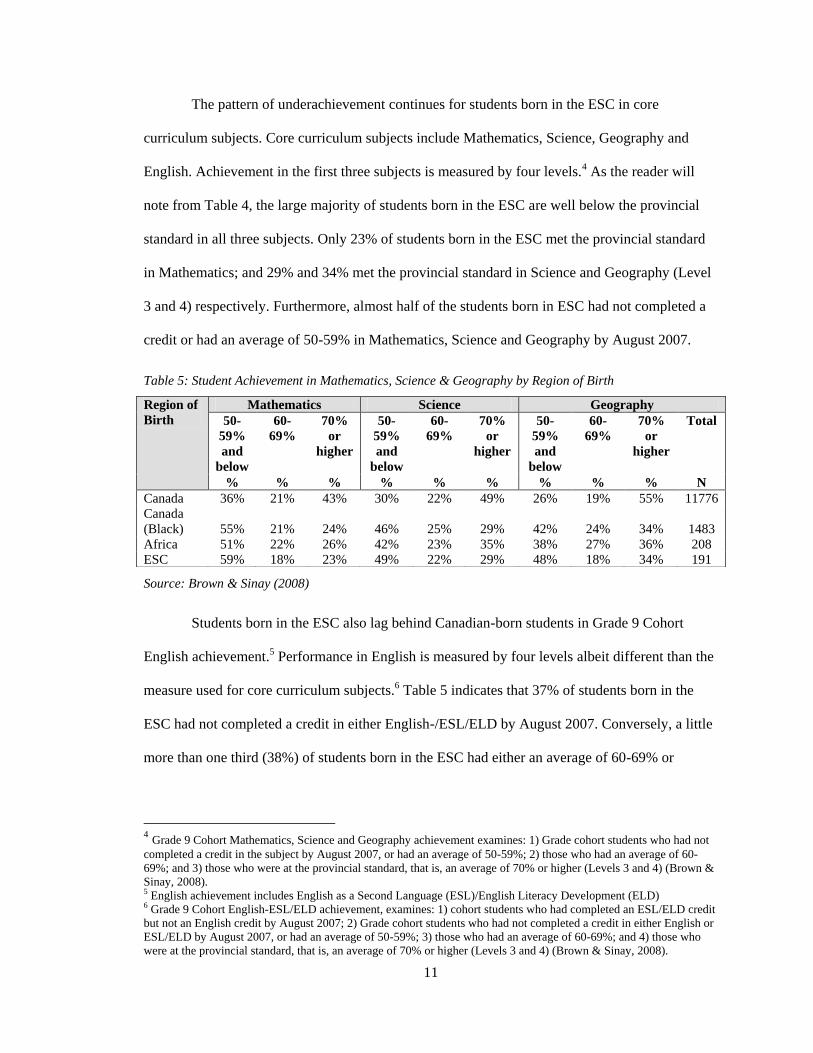
The pattern of underachievement continues for students born in the ESC in core
curriculum subjects. Core curriculum subjects include Mathematics, Science, Geography and
English. Achievement in the first three subjects is measured by four levels.4 As the reader will
note from Table 4, the large majority of students born in the ESC are well below the provincial
standard in all three subjects. Only 23% of students born in the ESC met the provincial standard
in Mathematics; and 29% and 34% met the provincial standard in Science and Geography (Level
3 and 4) respectively. Furthermore, almost half of the students born in ESC had not completed a
credit or had an average of 50-59% in Mathematics, Science and Geography by August 2007.
Table 5: Student Achievement in Mathematics, Science & Geography by Region of Birth
Source: Brown & Sinay (2008)
Students born in the ESC also lag behind Canadian-born students in Grade 9 Cohort
English achievement.5 Performance in English is measured by four levels albeit different than the
measure used for core curriculum subjects.6 Table 5 indicates that 37% of students born in the
ESC had not completed a credit in either English-/ESL/ELD by August 2007. Conversely, a little
more than one third (38%) of students born in the ESC had either an average of 60-69% or
4 Grade 9 Cohort Mathematics, Science and Geography achievement examines: 1) Grade cohort students who had not
completed a credit in the subject by August 2007, or had an average of 50-59%; 2) those who had an average of 60-
69%; and 3) those who were at the provincial standard, that is, an average of 70% or higher (Levels 3 and 4) (Brown &
Sinay, 2008). 5 English achievement includes English as a Second Language (ESL)/English Literacy Development (ELD) 6 Grade 9 Cohort English-ESL/ELD achievement, examines: 1) cohort students who had completed an ESL/ELD credit
but not an English credit by August 2007; 2) Grade cohort students who had not completed a credit in either English or
ESL/ELD by August 2007, or had an average of 50-59%; 3) those who had an average of 60-69%; and 4) those who
were at the provincial standard, that is, an average of 70% or higher (Levels 3 and 4) (Brown & Sinay, 2008).
Region of
Birth
Mathematics Science Geography
50-
59%
and
below
60-
69%
70%
or
higher
50-
59%
and
below
60-
69%
70%
or
higher
50-
59%
and
below
60-
69%
70%
or
higher
Total
% % % % % % % % % N
Canada 36% 21% 43% 30% 22% 49% 26% 19% 55% 11776
Canada
(Black)
55%
21%
24%
46%
25%
29%
42%
24%
34%
1483
Africa 51% 22% 26% 42% 23% 35% 38% 27% 36% 208
ESC 59% 18% 23% 49% 22% 29% 48% 18% 34% 191
12
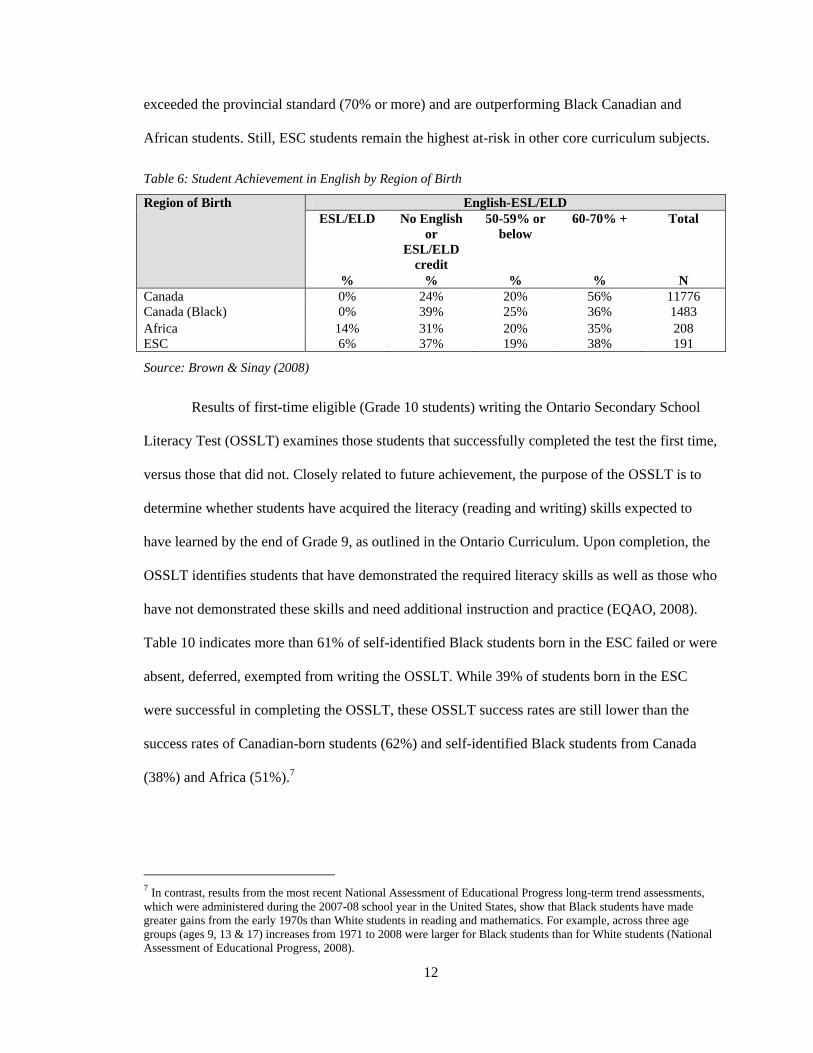
exceeded the provincial standard (70% or more) and are outperforming Black Canadian and
African students. Still, ESC students remain the highest at-risk in other core curriculum subjects.
Table 6: Student Achievement in English by Region of Birth
Region of Birth English-ESL/ELD
ESL/ELD No English
or
ESL/ELD
credit
50-59% or
below
60-70% + Total
% % % % N
Canada 0% 24% 20% 56% 11776
Canada (Black) 0% 39% 25% 36% 1483
Africa 14% 31% 20% 35% 208
ESC 6% 37% 19% 38% 191
Source: Brown & Sinay (2008)
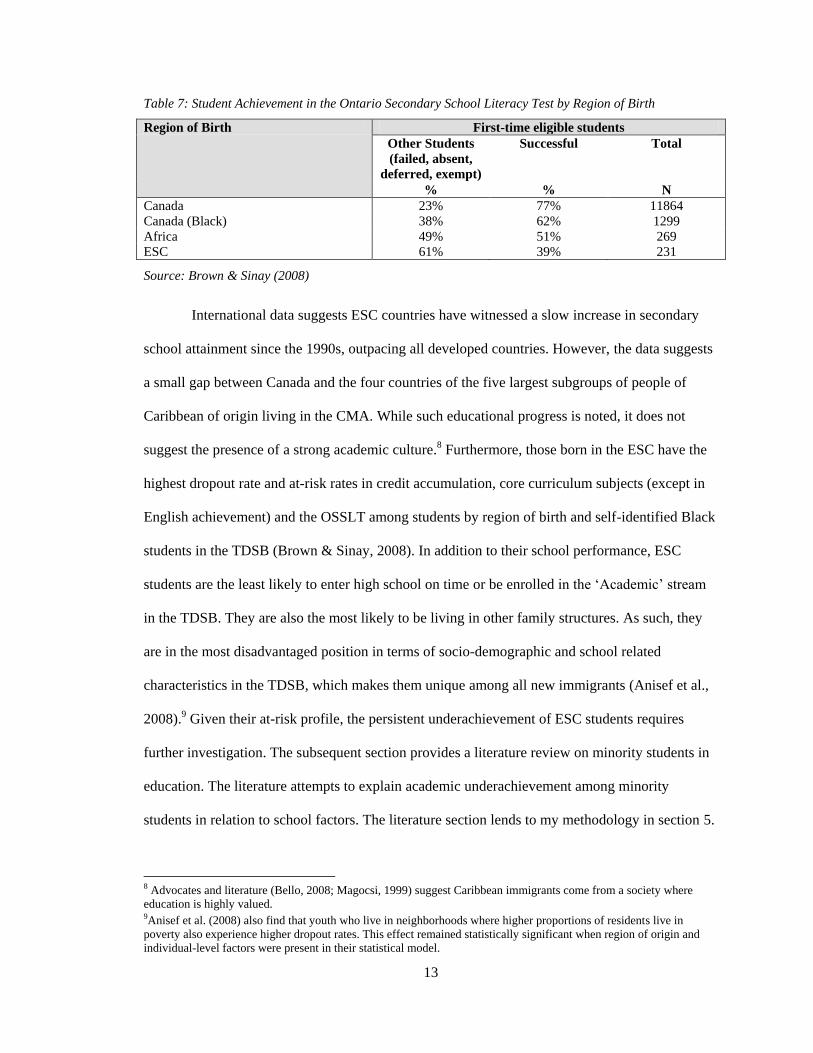
Results of first-time eligible (Grade 10 students) writing the Ontario Secondary School
Literacy Test (OSSLT) examines those students that successfully completed the test the first time,
versus those that did not. Closely related to future achievement, the purpose of the OSSLT is to
determine whether students have acquired the literacy (reading and writing) skills expected to
have learned by the end of Grade 9, as outlined in the Ontario Curriculum. Upon completion, the
OSSLT identifies students that have demonstrated the required literacy skills as well as those who
have not demonstrated these skills and need additional instruction and practice (EQAO, 2008).
Table 10 indicates more than 61% of self-identified Black students born in the ESC failed or were
absent, deferred, exempted from writing the OSSLT. While 39% of students born in the ESC
were successful in completing the OSSLT, these OSSLT success rates are still lower than the
success rates of Canadian-born students (62%) and self-identified Black students from Canada
(38%) and Africa (51%).7
7 In contrast, results from the most recent National Assessment of Educational Progress long-term trend assessments,
which were administered during the 2007-08 school year in the United States, show that Black students have made
greater gains from the early 1970s than White students in reading and mathematics. For example, across three age
groups (ages 9, 13 & 17) increases from 1971 to 2008 were larger for Black students than for White students (National
Assessment of Educational Progress, 2008).
13
Table 7: Student Achievement in the Ontario Secondary School Literacy Test by Region of Birth
Region of Birth First-time eligible students
Other Students
(failed, absent,
deferred, exempt)
Successful Total
% % N
Canada 23% 77% 11864
Canada (Black) 38% 62% 1299
Africa 49% 51% 269
ESC 61% 39% 231
Source: Brown & Sinay (2008)
International data suggests ESC countries have witnessed a slow increase in secondary
school attainment since the 1990s, outpacing all developed countries. However, the data suggests
a small gap between Canada and the four countries of the five largest subgroups of people of
Caribbean of origin living in the CMA. While such educational progress is noted, it does not
suggest the presence of a strong academic culture.8 Furthermore, those born in the ESC have the
highest dropout rate and at-risk rates in credit accumulation, core curriculum subjects (except in
English achievement) and the OSSLT among students by region of birth and self-identified Black
students in the TDSB (Brown & Sinay, 2008). In addition to their school performance, ESC
students are the least likely to enter high school on time or be enrolled in the „Academic‟ stream
in the TDSB. They are also the most likely to be living in other family structures. As such, they
are in the most disadvantaged position in terms of socio-demographic and school related
characteristics in the TDSB, which makes them unique among all new immigrants (Anisef et al.,
2008).9 Given their at-risk profile, the persistent underachievement of ESC students requires
further investigation. The subsequent section provides a literature review on minority students in
education. The literature attempts to explain academic underachievement among minority
students in relation to school factors. The literature section lends to my methodology in section 5.
8 Advocates and literature (Bello, 2008; Magocsi, 1999) suggest Caribbean immigrants come from a society where
education is highly valued. 9Anisef et al. (2008) also find that youth who live in neighborhoods where higher proportions of residents live in
poverty also experience higher dropout rates. This effect remained statistically significant when region of origin and
individual-level factors were present in their statistical model.
14
3: Theory about Minorities and School Performance
The theoretical literature on minority youth addresses the relationship between ethnic
origin and educational achievement. It also attempts to explain the negative schooling
experiences of some minority youth and the process of academic disengagement. In his study on
minorities in Canadian education, Cummins (1997) highlights the role of the school and teachers
in maintaining inequalities. Cummins suggests unequal power and status relations within the
larger society shape the “micro-politics” of the classroom to the disadvantage of minority groups.
Cummins identifies two types of educational structures reflected in the power relations of the
classroom. The first structure, which he labels “coercive relations of power”, serves to maintain
the inferior status of minority students and contributes to their uneasiness with their learning
environment. The second structure, which he labels the “collaborative relations of power”,
relations are positively co-developed and shared among students and teachers. As such, minority
students feel more comfortable with their identity and are better able to change their situation.
In Cummins' view, there is a historical and current pattern of “coercive relations of
power”, the first structure, which have led to persistent problems in Canadian schools for
minority students. The lack of respect for minorities' cultural identities and languages contributes
to student resistance to learning and strained relationships with teachers. Mitchell and Bryan
(2007) support Cummins‟ view. They suggest Caribbean immigrant students who represent one
of the largest subgroups in the Black population in the United States are experiencing negative
academic outcomes because of poor interactions with school personnel. Walrond (2008) also
shares this view, suggesting there is a lack of cultural recognition of the cultural model of
Caribbean youth in Canadian schools. Given these theoretical perspectives, I focus on specific
studies that highlight some of the school factors that contribute to underachievement. While most
15
of the studies focus on either minorities or Black student populations as homogenous groups,
some of the case studies are particularly germane to Caribbean youth.
3.1.1 Teacher Expectations
As noted earlier, several authors have attributed underachievement among minority
students, particularly Caribbean immigrant students, to the negative experiences they have within
school. There is a growing body of research that suggests some teachers have lower expectations
of minority students, particularly Black students. For example, Taylor (1991) finds that to the
extent teachers harbour negative racial stereotypes, a Black student‟s race alone is enough to
place them at risk of negative school outcomes. This is despite the fact that studies show Black
students‟ aspirations are as high as White students (Smith et al., 2001). Solomon (1997) suggests
teachers have negative perceptions and expectations of Black students and often give preferential
treatment to students of their own kind. Murphy (1973) also suggests “social class” is readily and
undoubtedly accepted as a critical component of those expectations; all of which lead to
alienation and academic failure among Black students. In Canada, Codjoe (2001) examines the
academic and achievement-related beliefs of Black high school students in two Canadian cities,
Toronto and Halifax. Black students express the belief that White teachers view them as
academically weak, discourage their academic interests, stream them into vocational and athletic
programs, and respond to them less positively than White students.
In the case of ESC students, the expectations follow a stereotype: having poor language
and communication skills; low levels of school participation; and, in the case of the males, higher
levels of aggression (Anderson and Grant, 1987; Foster, 1996). Moreover, Walrond (2008) argues
that Caribbean youth are regularly and unnecessarily tested and labelled “as having psychological
problems, as being slow learners or being learning disabled, as suffering from the attention deficit
syndrome or being hyperactive, and assigned to special education classes”. Lindsay et al. (2006),
using longitudinal data from the 2005 Pupil Level Annual School Census, discovers that
16
Caribbean students are one and half times more likely identified as having Behavioural,
Emotional and Social Difficulties (BESD) than White British students. They suggest differential
treatment of Caribbean students as a reason for their over-representation in the BESD category.
As a result, treatment of some minority students by teachers emerges as a problem that
contributes to academic failure.
3.1.2 School Counselling Practices
Elliston (1985) suggests school counsellors do not provide adequate, culturally competent
counselling and academic planning. This affects the academic outcomes for minority students and
limits their life chances. Mitchell and Bryan (2005) notes that this situation is compounded by the
fact that Caribbean parents are often unaware of the need to monitor closely their children‟s
academic development, as school personnel in the Caribbean are perceived by parents as
professionals who are trusted to make the best decision for the child‟s academic progress. The
fact that Caribbean students are more likely enrolled in basic and general level academic
programs than is the average student is a case in point. The Ontario Royal Commission on
Learning (1995) indicates that Canadian-born black students of Caribbean descent are
overrepresented in basic and general level math courses and foreign-born black students of
Caribbean descent are overrepresented in basic and general level English and math programs.
While parents may believe that teachers are making the best educational decisions for their child,
they are sometimes unaware that the prescribed educational programs are nonacademic tracks.
Consequently, there is a need for appropriate school counselor and teacher interactions with
Caribbean students and families (Mitchell & Bryan, 2005).
3.1.3 School Curriculum
There is also concern that the classroom is not a welcoming environment where Black
children can discuss their life experiences (Walrond, 2008). Teaching materials and school texts
17
are critical in this respect. Research provides evidence that the underrepresentation of Black
culture in the school curriculum provides mediocre classroom experiences for Black children,
thus establishing barriers to their academic achievement (Dei, 1995; Hale-Benson 1986). An
important predictor of whether students remain in school or leave school early is their ability to
identify with curriculum (Griffin, 2002). For instance, based on a three-year study in the greater
Toronto area, Dei et al. (1997) examine how school structures and processes lead to Black
students dropping out. Students cite problems regarding the content of school curriculum and its
relevance to their lives. Accordingly, curriculum that fails to reflect Black students‟ experiences
and provides, at times, only negative images of students‟ culture and backgrounds is critical in
affecting the learning processes of these students (Dei, 1995). This lack of interest in school
curriculum is further exacerbated given that Black students tend to “identify” less with academics
relative to Asian and White students (Dei, 2003).
3.1.4 Peer Groups
The role of peers is also a factor in the underachievement of minority youth. In a study
examining ethnic differences in adolescent achievement, Steinberg et al. (1992) find that while
African-American parents are supportive of academic success, African-American youth find it
difficult to join a peer group that encourages academic success. Interviews with high-achieving
African-American students indicate that peer support for academic success is limited to the extent
that many academically successful African-American students avoid contact with other African-
American students and affiliate primarily with students from other ethnic groups. Ogbu (2003)
documents similar findings in a study of the academic performance of African-American students
in an affluent neighbourhood in Cleveland, Ohio. Ogbu finds that Black peer groups have
different norms and degrees of school involvement; do not study together; and encourage each
other to do poorly in school. Black peer groups consider answering questions in class as “acting
White” and peers run the risk of being chastised and marginalised. Ogbu finds this is particularly
18
true for students in lower level academic programs who tend to be vulnerable to negative peer
influence. Similar issues have arisen in the analysis of the U.S. White/Black student performance
gaps. In a recent empirical study of Texas schools, Hanushek and Rivkin (2006) conclude that the
Black/White achievement gap is entirely attributable to an over-representation of Black students
in low-performing schools. This is consistent with other recent work on racial composition in
schools. Guryan (2004) examines whether the desegregation plans of the 1970‟s benefited Black
and White students in desegregated school districts in the U.S.10 He finds they reduced high
school dropout rates of Blacks by two to three percentage points during this decade. No
significant change is observed among Whites. Similarly, Cooley (2007) studies White and non-
White students in North Carolina public elementary schools and determines that desegregation
results in small reductions in between-race achievement gaps. Others such as Angrist and Lang
(2004) use Boston‟s Metropolitan Council for Educational Opportunity (Metco), one of the
largest and longest-running desegregation programs in the U.S., to study the impact of
desegregation on White students who remain in schools to which Black students are bused. They
find no impact of Metco on the scores of White non-Metco students, but show some evidence of a
negative impact on the reading and language scores of Black third graders, especially girls.
However, given the localized nature of the results, they conclude that peer effects from Metco are
modest. In total, these findings suggest that minority peer effects in school are likely detrimental,
particularly with respect to achievement on standardized tests for basic subjects (Richards et al.,
2009).
10 Up until Brown v. Board of Education in 1954, Southern and Border States in the U.S. legally segregated their school
systems by race. As a result, Black schools received fewer resources and Black children were taught almost exclusively
by Black teachers. With the Brown decision, the U.S. Supreme Court deemed segregated schools "inherently unequal"
and therefore unconstitutional. During the next 30 years, federal courts ordered the implementation of desegregation
plans for many of the largest school districts in the U.S. The intent was to provide equal educational resources to
Blacks by eradicating segregation on the basis of race (Guryan, 2004).
19
3.1.5 School Discipline
Felice (1981) suggests that students that dropout from school are more likely to come
from schools with disproportionately high rates of minority student suspensions and expulsions.
This is less the case where students perceive the discipline to be fair (Goldschmidt and Wang,
1999). Some minority students face discipline for being “nonconformist and resistant to the
authoritarian structures of schooling” (Dei, 2008, p. 350). To illustrate this point, Gillborn (1997)
shows how Caribbean and Asian students in Britain are subject to different stereotypes, with
Caribbean students more frequently perceived by teachers as troublemakers and punished for
displays of their ethnicity than Asian students. Gillborn notes that for Caribbean males, “the very
masculinity that seems to offer them respect among peers (including Whites) feed directly into
actions that will fail them in school” (p. 383-384). In Britain, inequalities are already greatest for
Caribbean males who are subject to high underachievement and expelled more than any other
group. Others such as Ruck and Wortley (2002) examine perceptions of differential treatment
relating to school disciplinary practices among racially and ethnically diverse high school
students in Toronto. They find that racial and ethnic minority students believe they are more
likely to face suspension or police contact at school than White students. Moreover, age at
immigration seems to be associated with students‟ perceptions of differential treatment, such that
the longer respondents live in Canada the more likely they are to perceive bias toward members
of their racial and ethnic group.
3.2 Generational Status
A recent study reveals that first and second-generation immigrant youth face distinct
challenges in secondary school (Ferguson et al., 2005). In interviews with first and second-
generation youth in Toronto and Kitchener-Waterloo that had either left school early or were at
risk of doing so, researchers indentify the need to learn a new language, unfamiliarity with the
Canadian school system and inappropriate grade placement as important risk factors. Issues of
20
resettlement, loneliness, isolation and a lack of friends are also reported. The study suggests
youth who immigrated to Canada during the last years of high school were most at risk of
dropping out. This has been shown in previous studies: minority students that arrive in their new
homeland by age six or seven tend to do better academically than those who arrive in the upper
elementary and junior high years (Gibson, 1987).
There is also evidence that immigrant youths are frequently more successful in school
than non-immigrant students of similar backgrounds if they receive all their schooling in their
new homeland (Gibson, 1997). Mitchell (2005) analyses the responses of 200 Caribbean
immigrant adolescents of first, second and third-generation who attended public, private and
catholic schools in New York City and an urban area in North Carolina. Results indicate that
academic achievement decreases with the length of stay. This substantiates Ogbu‟s (1997)
findings that there are differences in performance between recent minority immigrant populations
and U.S.-born minority students, with the former having greater academic success. Yet, Canadian
research contradicts these findings. Anisef et al. (2008) find region of origin to be a significant
predictor of underachievement. They find first generation Caribbean youth perform worse in
Toronto schools compared to native born and “third” plus generation Caribbean youth. Glick and
White (2004) suggest that this variance of research findings shows that the adaptation experiences
of immigrant and second-generation youth do not follow the same trajectory across all racial and
ethnic groups. Thus, generational status influences academic achievement among Caribbean
youth, but it is not clear in what ways and to what extent.
To summarise, teacher expectations and academic planning practices adversely affect
minority students and their academic achievement. There is also the lack of relevant curriculum,
peer influences and the disciplining of minority students with suspensions and expulsions, which
ultimately lead to negative school outcomes. In addition to their sense of alienation, some
minority students lack any sense of identification and connectedness to school. As a result,

21
negative attitudes towards school manifest themselves in a variety of ways depending on their
length of time in their new country. In the subsequent section, I outline the policy problem and
the possible stakeholders that would be interested in this study.
22
4: Policy Problem and Key Stakeholders
The policy problem I examine is the academic underachievement among secondary
students born in the ESC. In Canada, graduation from high school is the minimum level of
education required to gain access to a range of prospects, including post-secondary education.
While graduating from secondary school does not guarantee individuals have sufficient academic
skills for post-secondary education, failing to graduate ensures an individual does not. Those who
leave school early, on average, have lower academic skills than secondary school graduates and
even those graduates of similar characteristics or backgrounds (Alexander et al., 1985). In 2006,
the Canadian unemployment rate among 25- to 54-year-olds without a secondary school diploma
was 9.4%, compared to 4.2% for those with a secondary school diploma (Statistics Canada,
2008c). Individuals with less than a secondary school diploma also suffer a lower level in real
income. Dropouts have been disproportionately limited in recent decades to working at the low
end of the service sector economy. These positions tend to offer low wages, poor benefit
packages, non-unionized status and restrictions to internal job promotions (Dunham & Wilson,
2007). Leaving school early is a barrier to future occupational mobility and success. Dropouts
also suffer from a host of negative consequences, ranging from poor health to increased criminal
activity (Rumberger & Thomas, 2000). The number of school years completed is therefore an
important contributor to an individual‟s welfare.
The dropout rate among secondary students born in ESC was 40% in 2005 and this
segment of the Black student population continues to be more at risk of not graduating compared
to the average secondary student. This study proposes policy options based on an analysis of key
informant interviews, focus groups and a case study. Findings from this study will be useful to
school boards in fostering positive environments that help minority youth complete high school.
23
It will also assist boards with developing policies and programs to close the achievement gap
between students born in the ESC and other groups of students.
Stakeholders interested in this policy problem include the Ontario Ministry of Education.
The Ministry is responsible for allocating funds to school boards based on student enrolment and
the unique needs of the students in each board. Ministries also include the Ontario Ministry of
Citizenship and Immigration, which provides programs and services to help newcomers settle in
Ontario. Another stakeholder is the TDSB with the 22 school board trustees elected to the board.
Trustees approve or disapprove all internal policies. Others include CultureLink, which offers
services to immigrant students and families in the TDSB. Community stakeholders engaged in
this policy problem include the Toronto‟s Caribbean community, notably the Jamaican Canadian
Association (JCA) and Tropicana Community Services (TSC). The JCA is an incorporated, non-
profit charitable organization, providing social and cultural programs for people of Jamaican,
African Canadian and Caribbean descent. The JCA also offers a range of culturally sensitive
services, which support the diverse needs of its constituency, especially youth. TSC is a not-for-
profit organization providing culturally social services in East Toronto, focusing on the needs of
youth, newcomers and the Caribbean and Black communities.
Other community stakeholders include the Canadian Alliance of Black Educators, the
Black Youth Taking Action and the Urban Alliance on Race Relations. These organizations have
been involved in advocacy and action around the need for anti-racism and equity in education. As
well, they have attempted to address the barriers faced by immigrant and refugee students in the
Toronto area. Additional stakeholders include numerous parents and community advocates in the
Toronto Black community, specifically the Organisation of Parents of Black Children (OPBC).
The OPBC has long advocated for improvements in curriculum content and delivery for Black
students, and for fuller participation of Black parents in the processes of education in Toronto and
surrounding areas. Finally, Pathways to Education is a charitable organization created to reduce

24
poverty and its effects by lowering the high school dropout rate and increasing access to post-
secondary education among disadvantaged youth in the Regent Park neighbourhood in Toronto.
The next section now describes the main methodologies employed in my study.
25
5: Methodology
Two main methodologies form the basis for my analysis: key informant and focus group
interviews. This section helps to provide context for Section 6, which presents the results of my
data analysis. Details in this section include data collection as well as the themes explored with
key informants and focus group participants.
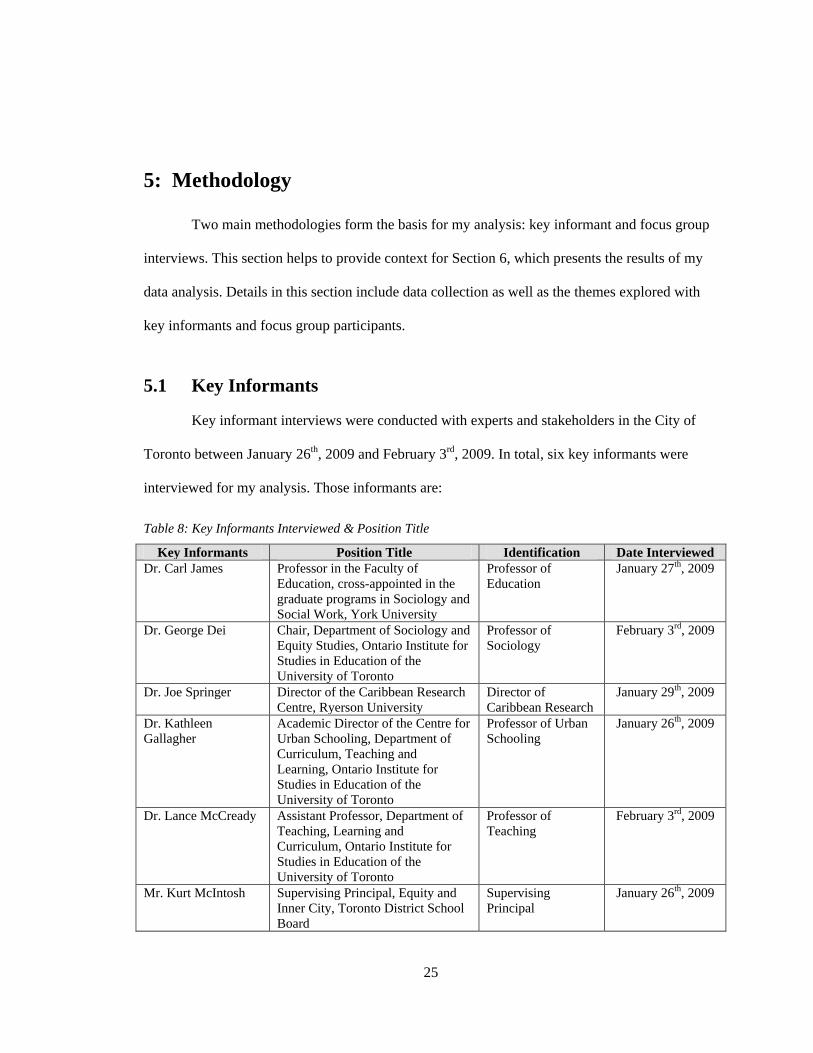
5.1 Key Informants
Key informant interviews were conducted with experts and stakeholders in the City of
Toronto between January 26th, 2009 and February 3rd, 2009. In total, six key informants were
interviewed for my analysis. Those informants are:
Table 8: Key Informants Interviewed & Position Title
Key Informants Position Title Identification Date Interviewed
Dr. Carl James Professor in the Faculty of
Education, cross-appointed in the
graduate programs in Sociology and
Social Work, York University
Professor of
Education
January 27th, 2009
Dr. George Dei
Chair, Department of Sociology and
Equity Studies, Ontario Institute for
Studies in Education of the
University of Toronto
Professor of
Sociology
February 3rd, 2009
Dr. Joe Springer Director of the Caribbean Research
Centre, Ryerson University
Director of
Caribbean Research
January 29th, 2009
Dr. Kathleen
Gallagher
Academic Director of the Centre for
Urban Schooling, Department of
Curriculum, Teaching and
Learning, Ontario Institute for
Studies in Education of the
University of Toronto
Professor of Urban
Schooling
January 26th, 2009
Dr. Lance McCready Assistant Professor, Department of
Teaching, Learning and
Curriculum, Ontario Institute for
Studies in Education of the
University of Toronto
Professor of
Teaching
February 3rd, 2009
Mr. Kurt McIntosh Supervising Principal, Equity and
Inner City, Toronto District School
Board
Supervising
Principal
January 26th, 2009
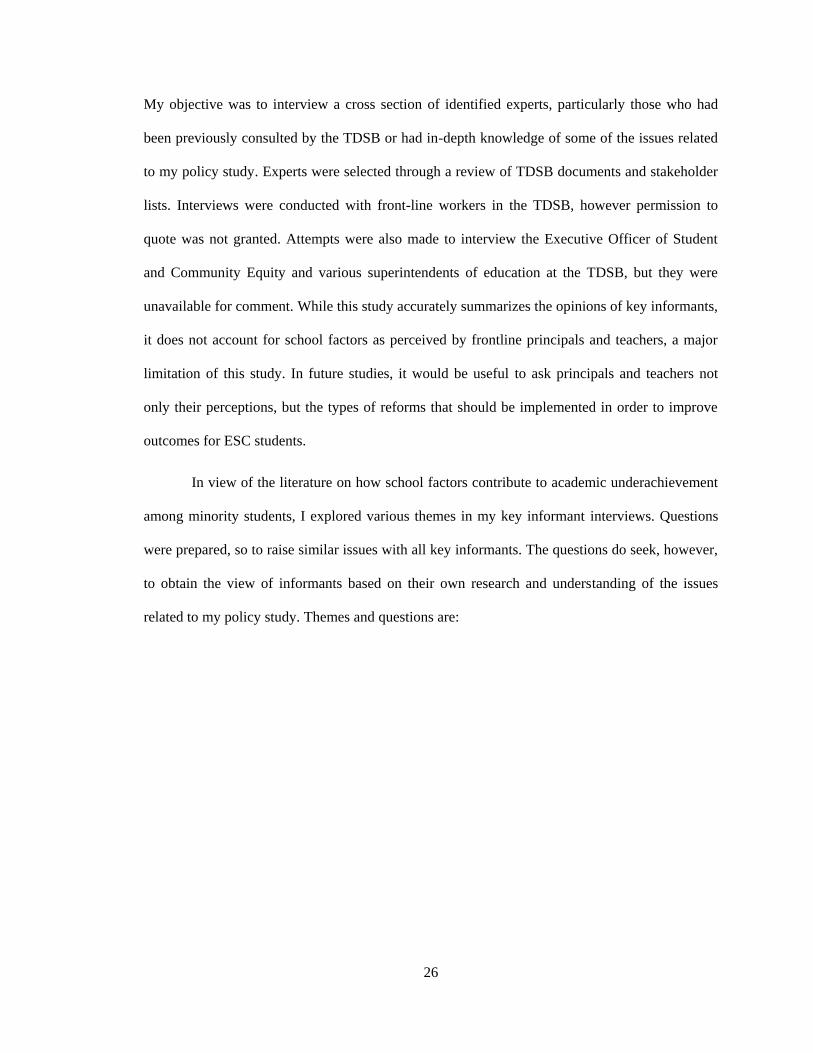
26
My objective was to interview a cross section of identified experts, particularly those who had
been previously consulted by the TDSB or had in-depth knowledge of some of the issues related
to my policy study. Experts were selected through a review of TDSB documents and stakeholder
lists. Interviews were conducted with front-line workers in the TDSB, however permission to
quote was not granted. Attempts were also made to interview the Executive Officer of Student
and Community Equity and various superintendents of education at the TDSB, but they were
unavailable for comment. While this study accurately summarizes the opinions of key informants,
it does not account for school factors as perceived by frontline principals and teachers, a major
limitation of this study. In future studies, it would be useful to ask principals and teachers not
only their perceptions, but the types of reforms that should be implemented in order to improve
outcomes for ESC students.
In view of the literature on how school factors contribute to academic underachievement
among minority students, I explored various themes in my key informant interviews. Questions
were prepared, so to raise similar issues with all key informants. The questions do seek, however,
to obtain the view of informants based on their own research and understanding of the issues
related to my policy study. Themes and questions are:
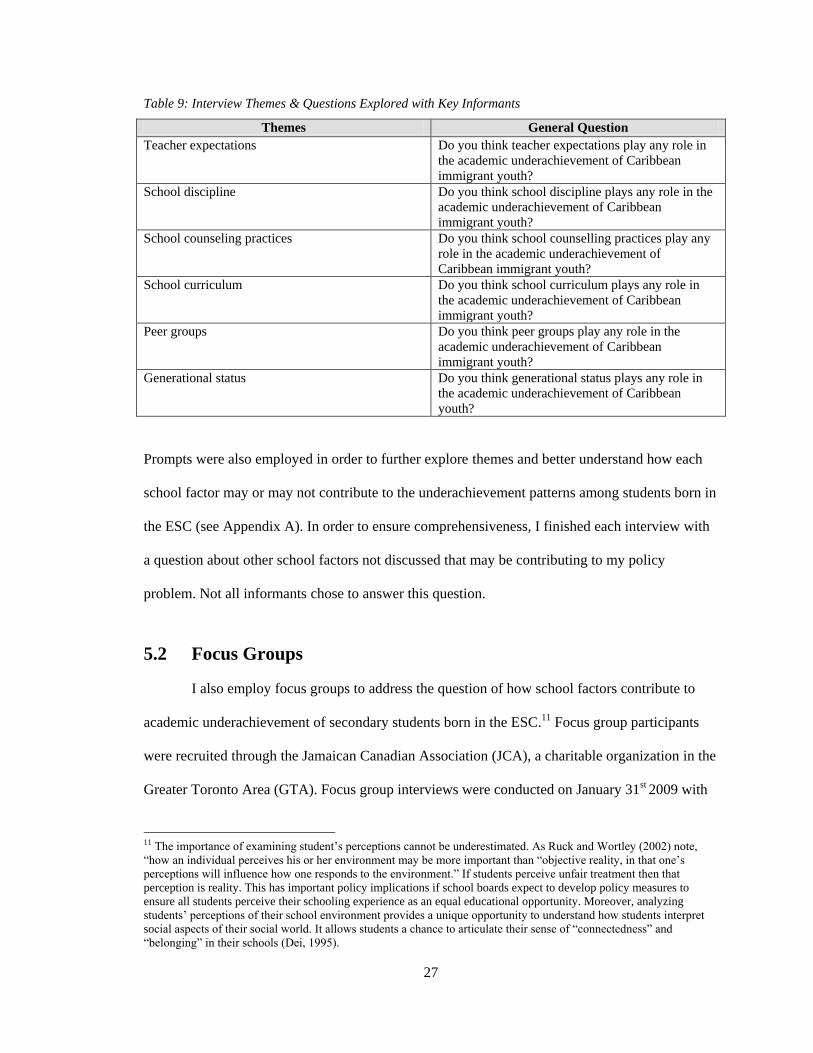
27
Table 9: Interview Themes & Questions Explored with Key Informants
Themes General Question
Teacher expectations Do you think teacher expectations play any role in
the academic underachievement of Caribbean
immigrant youth?
School discipline Do you think school discipline plays any role in the
academic underachievement of Caribbean
immigrant youth?
School counseling practices Do you think school counselling practices play any
role in the academic underachievement of
Caribbean immigrant youth?
School curriculum Do you think school curriculum plays any role in
the academic underachievement of Caribbean
immigrant youth?
Peer groups Do you think peer groups play any role in the
academic underachievement of Caribbean
immigrant youth?
Generational status Do you think generational status plays any role in
the academic underachievement of Caribbean
youth?
Prompts were also employed in order to further explore themes and better understand how each
school factor may or may not contribute to the underachievement patterns among students born in
the ESC (see Appendix A). In order to ensure comprehensiveness, I finished each interview with
a question about other school factors not discussed that may be contributing to my policy
problem. Not all informants chose to answer this question.
5.2 Focus Groups
I also employ focus groups to address the question of how school factors contribute to
academic underachievement of secondary students born in the ESC.11 Focus group participants
were recruited through the Jamaican Canadian Association (JCA), a charitable organization in the
Greater Toronto Area (GTA). Focus group interviews were conducted on January 31st 2009 with
11 The importance of examining student‟s perceptions cannot be underestimated. As Ruck and Wortley (2002) note,
“how an individual perceives his or her environment may be more important than “objective reality, in that one‟s
perceptions will influence how one responds to the environment.” If students perceive unfair treatment then that
perception is reality. This has important policy implications if school boards expect to develop policy measures to
ensure all students perceive their schooling experience as an equal educational opportunity. Moreover, analyzing
students‟ perceptions of their school environment provides a unique opportunity to understand how students interpret
social aspects of their social world. It allows students a chance to articulate their sense of “connectedness” and
“belonging” in their schools (Dei, 1995).
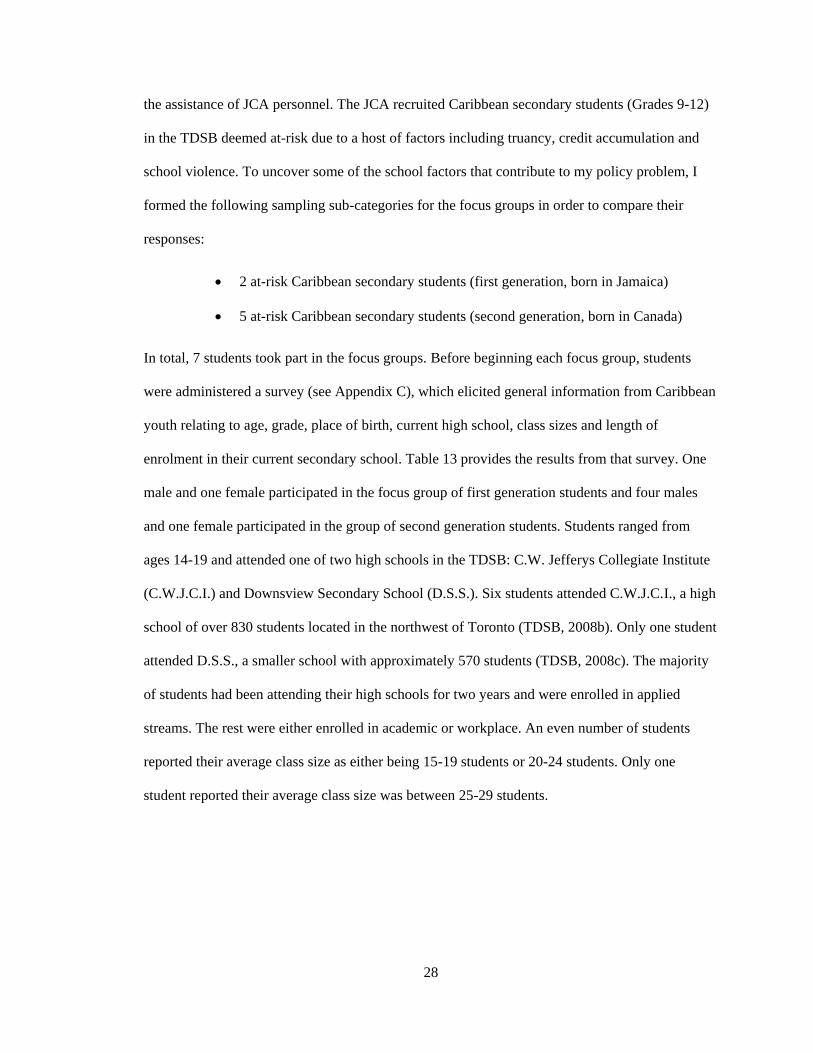
28
the assistance of JCA personnel. The JCA recruited Caribbean secondary students (Grades 9-12)
in the TDSB deemed at-risk due to a host of factors including truancy, credit accumulation and
school violence. To uncover some of the school factors that contribute to my policy problem, I
formed the following sampling sub-categories for the focus groups in order to compare their
responses:
2 at-risk Caribbean secondary students (first generation, born in Jamaica)
5 at-risk Caribbean secondary students (second generation, born in Canada)
In total, 7 students took part in the focus groups. Before beginning each focus group, students
were administered a survey (see Appendix C), which elicited general information from Caribbean
youth relating to age, grade, place of birth, current high school, class sizes and length of
enrolment in their current secondary school. Table 13 provides the results from that survey. One
male and one female participated in the focus group of first generation students and four males
and one female participated in the group of second generation students. Students ranged from
ages 14-19 and attended one of two high schools in the TDSB: C.W. Jefferys Collegiate Institute
(C.W.J.C.I.) and Downsview Secondary School (D.S.S.). Six students attended C.W.J.C.I., a high
school of over 830 students located in the northwest of Toronto (TDSB, 2008b). Only one student
attended D.S.S., a smaller school with approximately 570 students (TDSB, 2008c). The majority
of students had been attending their high schools for two years and were enrolled in applied
streams. The rest were either enrolled in academic or workplace. An even number of students
reported their average class size as either being 15-19 students or 20-24 students. Only one
student reported their average class size was between 25-29 students.
29
Table 10: Summary of Focus Group Survey Findings – Demographic Data
Generational
Status
Place of
birth
Age Grade Toronto
High
School
Length of
time at
high
school
Academic
Stream
Class
Sizes
(# of
students)
1st
generation
Jamaica 19 10 C.W.J.C.I. 5 years Applied 15-19
Jamaica 16 12 D.S.S. 2 years Academic 25-29
2nd
generation
Canada 17 11 C.W.J.C.I. 3 years Applied 20-24
Canada 18 12 C.W.J.C.I. 2 years Workplace 20-24
Canada 15 10 C.W.J.C.I. 2 years Academic 20-24
Canada 15 10 C.W.J.C.I. 2 years Applied 15-19
Canada 14 9 C.W.J.C.I. 1 years Applied 15-19
On the survey, questions also elicited information with respect to class participation, teacher
relationships, school discipline and institutional respect for Caribbean students‟ cultural and racial
backgrounds. The survey closed with questions relating to personal motivation and high school
completion (see Appendix D for survey results). Subsequently, I began the focus group and
explored school factors similar to those raised with key informants. Again, questions were
prepared, so as to raise similar issues with both focus groups. Table 14 provides an overview of
the general themes. I also elicited information from students about how school boards could
address underachievement among ESC students, so that they would be more likely to finish
secondary school rather than dropping out.
Table 11: School Factors Explored with Caribbean Secondary Students
Variable
#
General Theme Specific Theme
1 Teacher expectations Fair/respectful treatment of you
Relationship with teachers
Expectations of school teachers/authorities
2 School counseling practices Knowledge about guidance counselors
Reliance on guidance counselors
3 School curriculum Interest in course material
Representative of race and culture
Ability to follow curricular demands
Willingness to seek help when needed
4 Peer groups Relationship with school peers
Expectations of peer groups
School culture in general (bullying, violence,
discrimination, abuse)
5 School discipline Fair treatment by school authorities
30
Given the small size of my focus groups, data from Springer et al.‟s “Pathways to
Homelessness Among Caribbean Youth Aged 15-25 in Toronto” are used to help validate findings
from my focus group interviews. The study, conducted in February 2006, attempts to determine
pathways related to homelessness among Caribbean youth, some of whom are dropouts. The
study garnered 43 interviews (26 males and 17 females). The majority of homeless youth were
Black. In total, 15 (35%, 11 males and 4 females) had dropped out of school at some point.
Although the focus of this study is different, reasonable comparisons can be made between the
two samples. In relation to other immigrant students in the TDSB, students born in the ESC are in
the least favourable position in terms of socio-demographic characteristics (Anisef et al., 2008).
My analysis focuses on the responses of those students in the Springer et al. study that dropped
out secondary school. Questions range from reasons for dropping out to issues surrounding
discrimination in school.
5.3 Analytical Method
To compare the information from the full written transcripts, I develop categories of
responses that both generalize the verbatim and the larger themes emerging from these
discussions. For the focus groups, I also crosstab participants‟ responses with the characteristics
gathered from my survey related to place of birth, grade level, academic stream and school
involvement. From theses analyses, I then highlight the issues that negatively influence the
academic achievement of students born in the ESC or discourage some of them from completing
secondary school. The next section presents the detailed analysis.
31
6: Analysis
This section presents the results of my analysis. I focus on school factors that both
positively and negatively influence student achievement among students born in the ESC, as
expressed by key informants and focus group participants. Focus group results are compared with
a case study to lend to my findings. All help to inform my policy options discussed in section 7.
6.1 Key Informants
Table 15 summarises my overall findings with respect to the five main school factors
investigated in my study.
6.1.1 Teacher Expectations
All informants except one believe that teacher expectations play an important role in the
underachievement of students born in the ESC. Race and class considerations also have an
impact. The Director of Caribbean Research suggests that ESC students learn early on from
teachers that little is expected of them academically and they are often ignored, which he
considers problematic. The Professor of Sociology suggests that not all teachers have low
expectations or that all teachers engage in those stereotypes, but it is still a problem since students
have raised it consistently in past TDSB studies. For example, students often raise the issue that
teachers do not believe in their ability to excel. As a result, students act out. Yet, the larger issue
is what is available to students to counteract low expectations. Similarly, the Supervising
Principal maintains that relationships between students of the ESC and teachers are sometimes
strained since many Black students feel stereotyped.
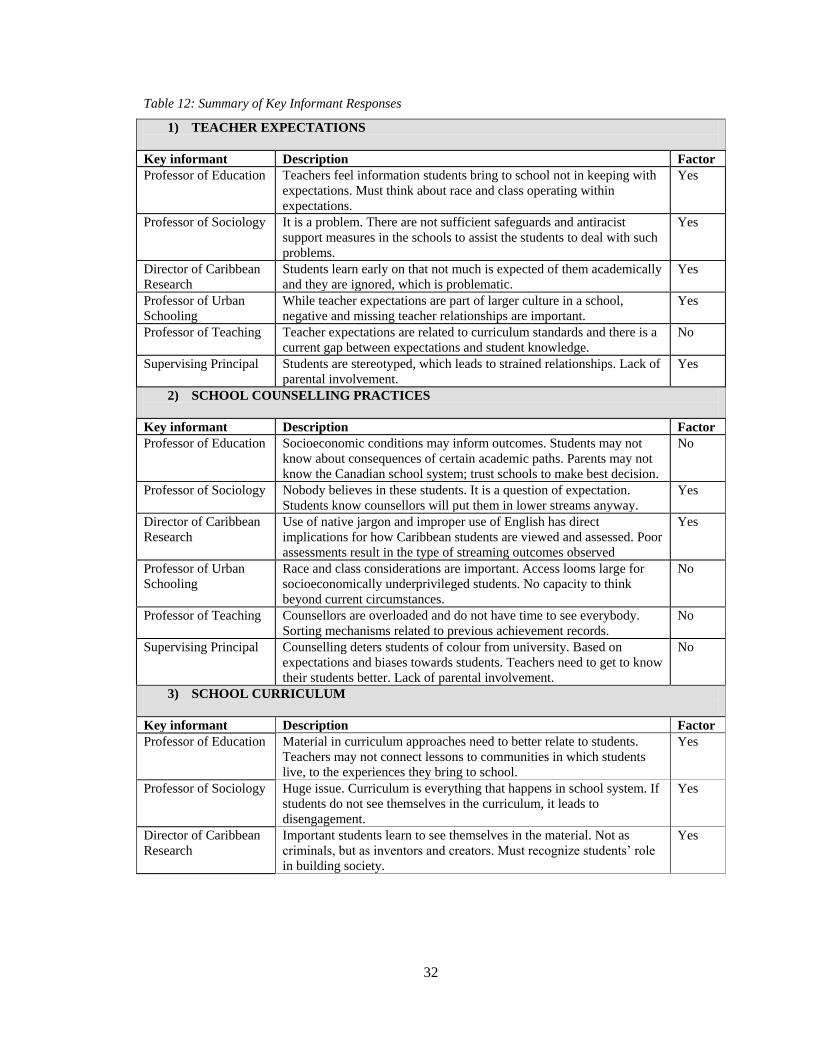
32
Table 12: Summary of Key Informant Responses
1) TEACHER EXPECTATIONS
Key informant Description Factor
Professor of Education Teachers feel information students bring to school not in keeping with
expectations. Must think about race and class operating within
expectations.
Yes
Professor of Sociology It is a problem. There are not sufficient safeguards and antiracist
support measures in the schools to assist the students to deal with such
problems.
Yes
Director of Caribbean
Research
Students learn early on that not much is expected of them academically
and they are ignored, which is problematic.
Yes
Professor of Urban
Schooling
While teacher expectations are part of larger culture in a school,
negative and missing teacher relationships are important.
Yes
Professor of Teaching Teacher expectations are related to curriculum standards and there is a
current gap between expectations and student knowledge.
No
Supervising Principal Students are stereotyped, which leads to strained relationships. Lack of
parental involvement.
Yes
2) SCHOOL COUNSELLING PRACTICES
Key informant Description Factor
Professor of Education Socioeconomic conditions may inform outcomes. Students may not
know about consequences of certain academic paths. Parents may not
know the Canadian school system; trust schools to make best decision.
No
Professor of Sociology Nobody believes in these students. It is a question of expectation.
Students know counsellors will put them in lower streams anyway.
Yes
Director of Caribbean
Research
Use of native jargon and improper use of English has direct
implications for how Caribbean students are viewed and assessed. Poor
assessments result in the type of streaming outcomes observed
Yes
Professor of Urban
Schooling
Race and class considerations are important. Access looms large for
socioeconomically underprivileged students. No capacity to think
beyond current circumstances.
No
Professor of Teaching Counsellors are overloaded and do not have time to see everybody.
Sorting mechanisms related to previous achievement records.
No
Supervising Principal Counselling deters students of colour from university. Based on
expectations and biases towards students. Teachers need to get to know
their students better. Lack of parental involvement.
No
3) SCHOOL CURRICULUM
Key informant Description Factor
Professor of Education Material in curriculum approaches need to better relate to students.
Teachers may not connect lessons to communities in which students
live, to the experiences they bring to school.
Yes
Professor of Sociology Huge issue. Curriculum is everything that happens in school system. If
students do not see themselves in the curriculum, it leads to
disengagement.
Yes
Director of Caribbean
Research
Important students learn to see themselves in the material. Not as
criminals, but as inventors and creators. Must recognize students‟ role
in building society.
Yes
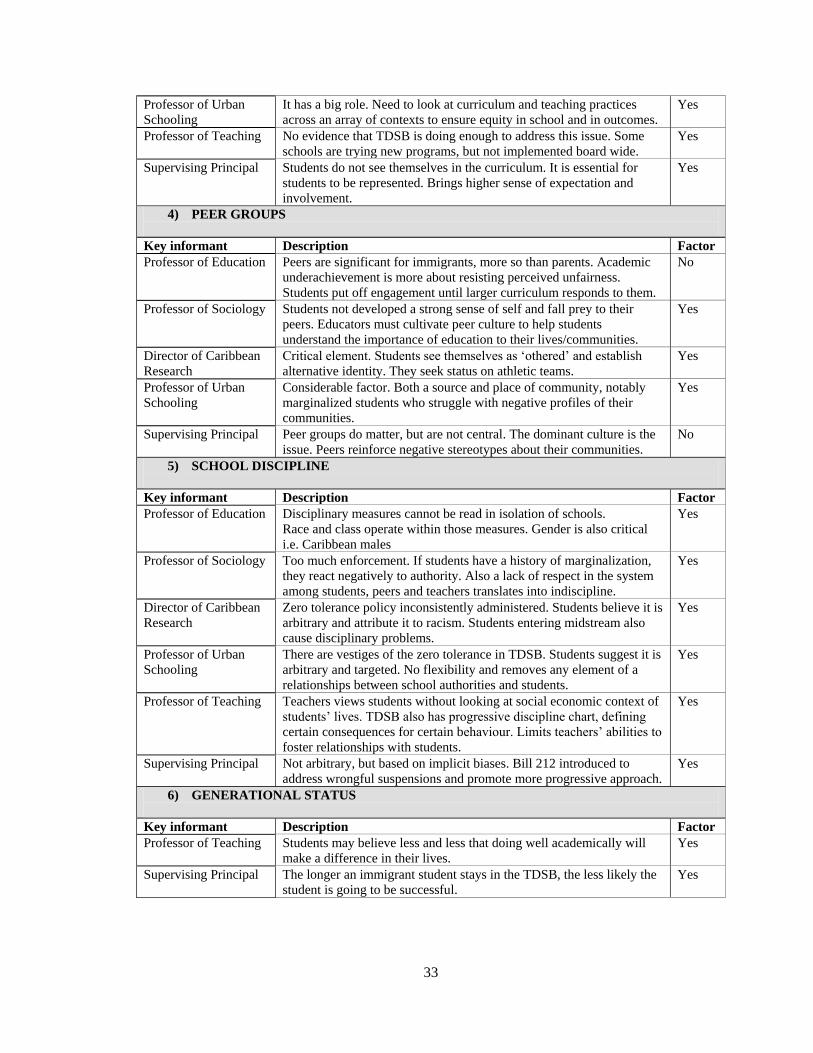
33
Professor of Urban
Schooling
It has a big role. Need to look at curriculum and teaching practices
across an array of contexts to ensure equity in school and in outcomes.
Yes
Professor of Teaching No evidence that TDSB is doing enough to address this issue. Some
schools are trying new programs, but not implemented board wide.
Yes
Supervising Principal Students do not see themselves in the curriculum. It is essential for
students to be represented. Brings higher sense of expectation and
involvement.
Yes
4) PEER GROUPS
Key informant Description Factor
Professor of Education Peers are significant for immigrants, more so than parents. Academic
underachievement is more about resisting perceived unfairness.
Students put off engagement until larger curriculum responds to them.
No
Professor of Sociology Students not developed a strong sense of self and fall prey to their
peers. Educators must cultivate peer culture to help students
understand the importance of education to their lives/communities.
Yes
Director of Caribbean
Research
Critical element. Students see themselves as „othered‟ and establish
alternative identity. They seek status on athletic teams.
Yes
Professor of Urban
Schooling
Considerable factor. Both a source and place of community, notably
marginalized students who struggle with negative profiles of their
communities.
Yes
Supervising Principal Peer groups do matter, but are not central. The dominant culture is the
issue. Peers reinforce negative stereotypes about their communities.
No
5) SCHOOL DISCIPLINE
Key informant Description Factor
Professor of Education Disciplinary measures cannot be read in isolation of schools.
Race and class operate within those measures. Gender is also critical
i.e. Caribbean males
Yes
Professor of Sociology Too much enforcement. If students have a history of marginalization,
they react negatively to authority. Also a lack of respect in the system
among students, peers and teachers translates into indiscipline.
Yes
Director of Caribbean
Research
Zero tolerance policy inconsistently administered. Students believe it is
arbitrary and attribute it to racism. Students entering midstream also
cause disciplinary problems.
Yes
Professor of Urban
Schooling
There are vestiges of the zero tolerance in TDSB. Students suggest it is
arbitrary and targeted. No flexibility and removes any element of a
relationships between school authorities and students.
Yes
Professor of Teaching Teachers views students without looking at social economic context of
students‟ lives. TDSB also has progressive discipline chart, defining
certain consequences for certain behaviour. Limits teachers‟ abilities to
foster relationships with students.
Yes
Supervising Principal Not arbitrary, but based on implicit biases. Bill 212 introduced to
address wrongful suspensions and promote more progressive approach.
Yes
6) GENERATIONAL STATUS
Key informant Description Factor
Professor of Teaching
Students may believe less and less that doing well academically will
make a difference in their lives.
Yes
Supervising Principal The longer an immigrant student stays in the TDSB, the less likely the
student is going to be successful.
Yes
34
A related issue raised by key informants is the concept of class and race operating within
expectations and its impact on student achievement. The Professor of Education suggests that
teachers may feel that the educational values of students born in the ESC may not be in keeping
with academic expectations. Socioeconomic conditions may also be operating within those
expectations, as economic conditions correlate strongly with race. For him, it is therefore
necessary to consider the communities and schools in which Caribbean immigrants live and
attend. He notes:
…Black students living in, say, for example, in Bayview and Leslie or Leslie and Yorkmills, in a
fairly solidly middle-class area, might have different relationships with the school, say at York
Mills Collegiate, [than] compared to somebody that goes to Westview in the Jane and Finch area.
They‟re both migrant, they‟re both Black, they both might have similar backgrounds, but they live
in different kinds of communities. Therefore, teachers might use that kind of information about
what he or she knows about the community - but what he or she knows about a community is a
construct - not only by the teacher, but by that environment and of course by the media. All that is
going to operate with teacher expectations of students and sometimes what students come to think
the teachers expect of them and they might play to that expectation that teachers have of them.
The Professor of Urban Schooling makes a similar point, underscoring the challenges associated
with teaching socioeconomically underprivileged students. She also indentifies negative and
missing teacher relationships as factors. Conversely, the Professor of Teaching gives little
credence to the impact of teacher expectations on student outcomes. While he believes high
expectations for students are important, he notes that teacher expectations are related to
curriculum standards and, in this respect, student skills are fundamentally lacking. Teachers
expect a certain academic skill set, which students have not always acquired. Therefore, the
notion of high expectations being a successful platform to develop positive relationships with
students does not address the underlying issues of poor academic standards.
6.1.2 School Counselling Practices
With regards to school counselling practices, no clear consensus emerges among
informants on this issue. Whereas half of the informants suggest low expectations play a role in
this outcome, a third feels class and race considerations are underlying factors. Points are also
35
raised about the weak linkages between schools and the Caribbean community. The Director of
Caribbean Research argues that ESC students‟ use of native jargon and improper use of English
has a direct implication for how they are counselled and assessed. Other informants share
different views on school counselling practices. The Professor of Urban Schooling suggests race
and class considerations may inform a student‟s decision to follow specific streams through high
school, particularly among socioeconomically disadvantaged students. The Professor of Teaching
acknowledges school counsellors can play a significant role, however, some counsellors are
overloaded and do not have time to counsel every student. Moreover, schools have sorting
mechanisms in place related to previous academic achievement, with the result that students are
often automatically placed into a particular academic stream.
As noted, informants also focus on weak community linkages as a determinant in why
students born in the ESC are placed in non-academic streams. According to the Supervising
Principal, the relationship between schools and the Caribbean community are informed in part by
cultural based parental attitudes, which may have a direct impact on student achievement:
…social advocacy is very different in the Caribbean than social advocacy here in Toronto…most
Caribbean families leave education to the professionals and back home they don‟t question a lot
because education is not their domain. It‟s for the professionals and you send your child to school
and you expect that they will be given a fair opportunity to be successful and be challenged and
given some rigour to move forward. Now, I‟m not saying that all Caribbean countries, all school
environments, but, generally, that‟s the sentiment of the community, is that they leave education
up to the teachers. They come here to Canada in many, many cases expecting that same approach,
but here in Canada we always talk about parent involvement and getting the community involved
and we, again, project upon, our Caribbean parents, who don‟t show up at the school council
meeting, to the bake sale, and our response is – that‟s an uncaring parent. They don‟t care about
their child‟s success. They‟re not getting involved in their child‟s education, but if that‟s not my
way and I‟m not used to that and I expect when I send my child to school [that] you‟re going to be
educating [them], that is your job, and I‟m not saying that with any disdain, but that‟s what I
respect your position and that‟s what you do, you educate, as you did back home.
The Professor of Education shares the Supervising Principal‟s view. He suggests there is a
knowledge gap among Caribbean parents regarding academic streams, and more appropriate
school counsellor and teacher interactions with Caribbean students and families is required to
address this gap.
36
6.1.3 School Curriculum
On the impact of school curriculum on student achievement, all informants acknowledge
that course content and material play a significant role in underachievement, as does the ability of
a teacher to connect the material to a student‟s day-to-day life. The Professor of Sociology places
a high value on curriculum and its impact on student achievement. Curriculum, he notes, “is
everything that happens in the school system.” If students do not see themselves in the
curriculum, it leads to disengagement. The curriculum and the approach of teachers to the
curriculum need to relate to students in the context of their everyday lives. The Director of
Caribbean Research agrees with him. It is much more important that students learn to see
themselves in a positive light and contributing to the larger society. Accordingly, the curriculum
must be presented in a fashion that allows students to engage with it.
The Professor of Education also underscores the teacher‟s approach to the curriculum as
significant to student achievement. If a student believes the curriculum does not relate to a
student‟s experience, it may be due to the fact that the teacher is not connecting a lesson to that
student. Curriculum does not necessarily need to reflect a particular population, but it does need
to reflect student experiences. This response speaks to the difficulties faced by educators to
engage different learning and social styles, particularly in diverse social settings. Others, such as
the Supervising Principal, believe it is essential for students to be represented in the overall
school environment, which leads to greater student engagement and success. He maintains that
the lack of representation of Black culture in the curriculum fosters both mediocre classroom
experiences and institutional inequalities. Speaking to the 40% dropout rate among students born
in the ESC, he notes:
How do [ESC students come to have a] 40% dropout rate? Is it because [school is] hard? It‟s
not because it‟s hard. [It‟s because they] have no relationship with an adult in this building or at
least no substantive or sustainable relationship with an adult, which is in this building - this
course, this school, this building; and when you talk about curriculum you [also have] to talk
“Big C” curriculum. I‟m not just talking about content; I‟m talking about pictures on the wall.
I‟m talking about announcements on the PA. Does it represent it me in anyway? Do I see myself in
37
any part of this building? In the staffing? In the leadership? In the secretaries sitting at the
front door? In the caretakers in the building?
Hence, the school environment becomes another barrier to academic achievement. Students may
lack any connection to the school due to a lack of cultural perspectives and diversity in staff
representation.
6.1.4 Peer Groups
On the issue of peer groups, there is no clear agreement among key informants regarding
a negative peer effect. While half suggest they do matter, others suggest peers do not actively
encourage negative attitudes toward school and academic achievement. Rather, negative peer
groups are a function of low-teacher expectations and students tend to assume the negative
stereotypes about their communities. The Professor of Education points out that peers are a
significant source of community among immigrant students. Peers may have a better appreciation
for some of the issues students face in school compared to immigrant parents. However, he
differentiates between African American and African Caribbean students and their approach to
academic achievement. He argues disengagement among ESC students is more related to
perceived bias or unfairness than succeeding in school. In some instances, students may be
putting off their engagement until something better comes along such as a teacher they can relate
to or a curriculum that responds to them. Conversely, the Professor of Sociology explains that
many ESC students have not developed a strong sense of self-confidence. Therefore, students that
are ignored or underappreciated fall prey to their peers. Alternatively, they may seek status
elsewhere. The Director of Caribbean Research notes that accomplishments in sports, particularly
for Caribbean males, become a means of avoiding and resisting the negative stereotypes about
their identities in the classroom. For the most part, all informants recognize educators have a
responsibility to cultivate peer culture and show different students the relevance of education to
themselves and their communities.
38
6.1.5 School Discipline
All informants acknowledge that discipline has a negative influence on the academic
achievement of ESC students. Yet, issues of class, race and gender are also important. The
Supervising Principal contends that students born in the ESC are subject to a disproportionate
number of suspensions relative to other students. This creates barriers to academic achievement,
which arise from strong biases educators have about the Caribbean community. Three of the
informants hold the TDSB‟s zero tolerance policy (i.e. Safe Schools Act)12 responsible for the
disproportionate number of suspensions and expulsions among students born in the ESC.
Although it has now been repealed, the Professor of Urban Schooling maintains the policy had
two significant implications. First, the one-size-fits-all approach of the policy restricted
administrators who may have been more progressive on issues of discipline. Second, the policy
offered a platform to school authorities who were more punitive with certain populations. As a
result, some students felt the administration of discipline was arbitrary and targeted. The policy
also helped to remove the element of any positive relationship with school authorities, serving to
alienate not only Caribbean students, but other minority students, too.
Another issue raised regarding school discipline is the practice of delaying Caribbean
students a year to “catch-up” with the Canadian school system. Interestingly, this is not raised by
informants when discussing school counselling practices. The Director of Caribbean Research
suggests such assessments do not consider the physical development of these students, which, in
turn, can lead to isolation and generate disciplinary issues. Of the informants, only one raises this
issue. The Professor of Education believes that school discipline practices are having a negative
impact on the academic achievement of ESC students. Like other informants, he believes that
12 On June 14, 2002, the Safe Schools Act (SSA) was passed by the provincial government. The SSA amended Ontario‟s
Education Act, implementing a new Code of Conduct for Ontario schools and providing principals and teachers with
the authority to suspend and expel students. One of the most significant changes made by the SSA was the provision for
mandatory suspension, expulsion and police involvement for various forms of misconduct. The SSA fundamentally
changed the manner in which discipline was enforced in Toronto, creating what some refer to as a zero tolerance
regime (Falconer et al., 2008).
39
focusing on community is important. For him, the weak ties between the schools and the
Caribbean community remain an issue, as does race and class and how those factors operate
within disciplinary structures and policies. He suggests that disciplinary measures are more likely
to occur in neighbourhoods where there is less parental involvement in the local schools. The
Professor of Education also points out that gender is critical involving issues of discipline.
Caribbean males are more likely to be subject to disciplinary issues than females.13
6.1.6 Generational Status
Lastly, not all key informants spoke to the importance of generational status, but some
key findings do emerge from my discussions, namely the age of entry into the school system.
Most significant is the admission by the Supervising Principal that the longer a minority student
is enrolled in the TDSB system, the less likely their academic success. The Professor of Teaching
provides an alternative explanation for this outcome. While there is no evidence that academic
standards among ESC students are higher in countries of origin, he suggests immigrant students
may increasingly believe that excelling academically will make little difference in their lives.
While this belief may be tied to their parents‟ outlook, it may be related to their socio-economic
standing, too. As a result, after being in the school system for a length of time, there can be a shift
in attitude in terms of how immigrant students apply themselves in school.
In summary, the majority of informants feel teacher expectations; school curriculum; and
disciplinary practices play a role in the underachievement of students born in the ESC. Half of the
informants feel peer groups play a role, too. On the other hand, there is no clear agreement on the
roles of school counselling practices. Aside from those school factors, points are raised about the
weak linkages between schools and the Caribbean community, which can lead to poor academic
outcomes.
13 This concurs with available research on the subject. Ruck & Wortley (2002) indicate that males are far more likely
than females to be disciplined at school.
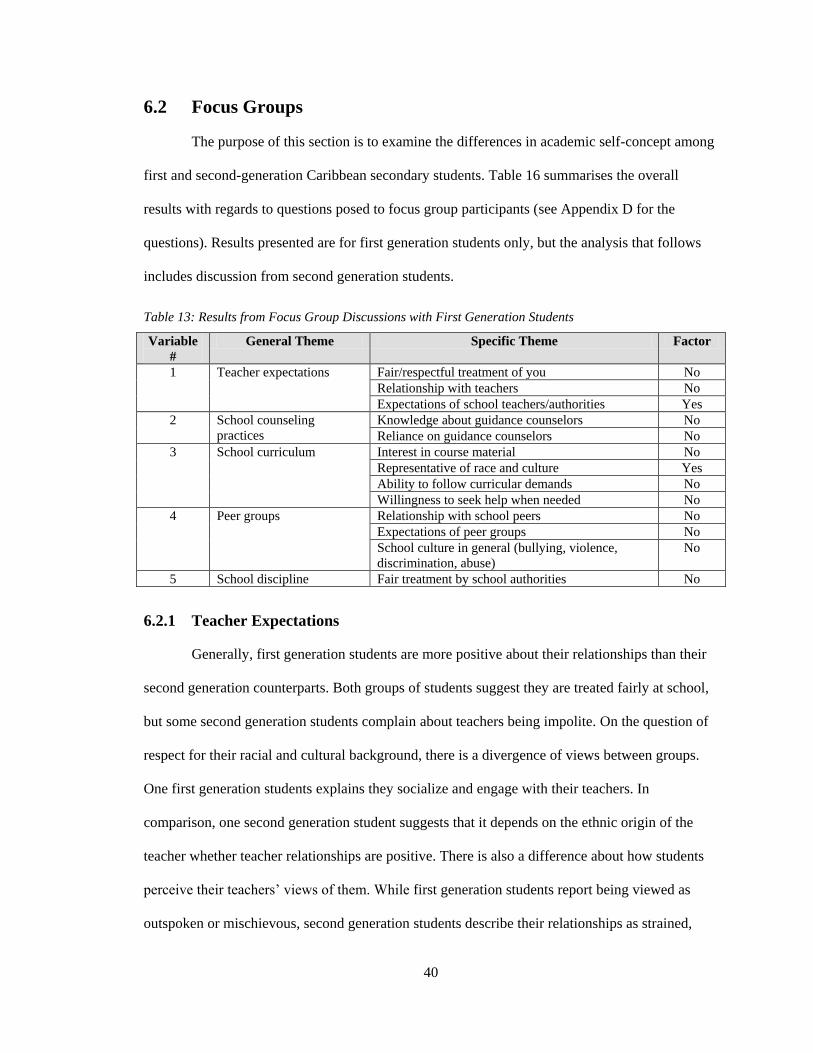
40
6.2 Focus Groups
The purpose of this section is to examine the differences in academic self-concept among
first and second-generation Caribbean secondary students. Table 16 summarises the overall
results with regards to questions posed to focus group participants (see Appendix D for the
questions). Results presented are for first generation students only, but the analysis that follows
includes discussion from second generation students.
Table 13: Results from Focus Group Discussions with First Generation Students
Variable
#
General Theme Specific Theme Factor
1 Teacher expectations Fair/respectful treatment of you No
Relationship with teachers No
Expectations of school teachers/authorities Yes
2 School counseling
practices
Knowledge about guidance counselors No
Reliance on guidance counselors No
3 School curriculum Interest in course material No
Representative of race and culture Yes
Ability to follow curricular demands No
Willingness to seek help when needed No
4 Peer groups Relationship with school peers No
Expectations of peer groups No
School culture in general (bullying, violence,
discrimination, abuse)
No
5 School discipline Fair treatment by school authorities No
6.2.1 Teacher Expectations
Generally, first generation students are more positive about their relationships than their
second generation counterparts. Both groups of students suggest they are treated fairly at school,
but some second generation students complain about teachers being impolite. On the question of
respect for their racial and cultural background, there is a divergence of views between groups.
One first generation students explains they socialize and engage with their teachers. In
comparison, one second generation student suggests that it depends on the ethnic origin of the
teacher whether teacher relationships are positive. There is also a difference about how students
perceive their teachers‟ views of them. While first generation students report being viewed as
outspoken or mischievous, second generation students describe their relationships as strained,
41
explaining teachers are rude. It is noted by a number of second generation students that teachers
send students down to the office far too often. In so far as general expectations from teachers and
school authorities, both first and second generation students describe a lack of encouragement and
understanding. According to one first generation student, teachers fail to appreciate students‟ day-
to-day experiences at home. In general, very few of the students from both groups feel teachers
hold high expectations of them. One first generation student does feel however his vice-principal
expects him to succeed.
Both groups of students are adamant that they do not share a bond or feel comfortable
discussing personal problems with any of their teachers. Friends and coaches are cited as the only
outlet for discussing problems at school. First and second generation students are divided on
teachers as role models. However, the former were more likely to identify some teachers as role
models. The key ingredient was the ability of the teacher to relate to students14 i.e. usually a
teacher of visible minority status. Such teachers help to increase self-confidence and promote
higher aspirations. Concerns also surface regarding student perceptions of equal treatment.
Particularly, the notion that students are not treated differently because of race or linguistic
differences. One first generation student notes:
I have a computer teacher...he doesn‟t see colour. Like, you know, some teachers will think
just cause, just you‟re Black or whatever, like they need to break it down for you, he does like, he
teaches everyone the same. Like, he teaches everyone equal, everyone is equal to him. The way he
teaches you one thing, he‟s going to teach the next person the same thing. It doesn‟t matter. It
doesn‟t matter if you speak English properly or not. He‟s going to teach you the same thing.
Systemic racism and the differential treatment of ESC students by teachers and other
administrators is a significant problem that directly contributes to underachievement. When
treated equally and fairly, students are less likely to form an “oppositional identity” that removes
them from academic success.15
14 King (1993) concluded that Black teachers as role models were critically important because of the many other roles,
perspectives, and practices they brought to their teaching approach. 15 See Codjoe (2001) and Asanova (2008) for further discussion.
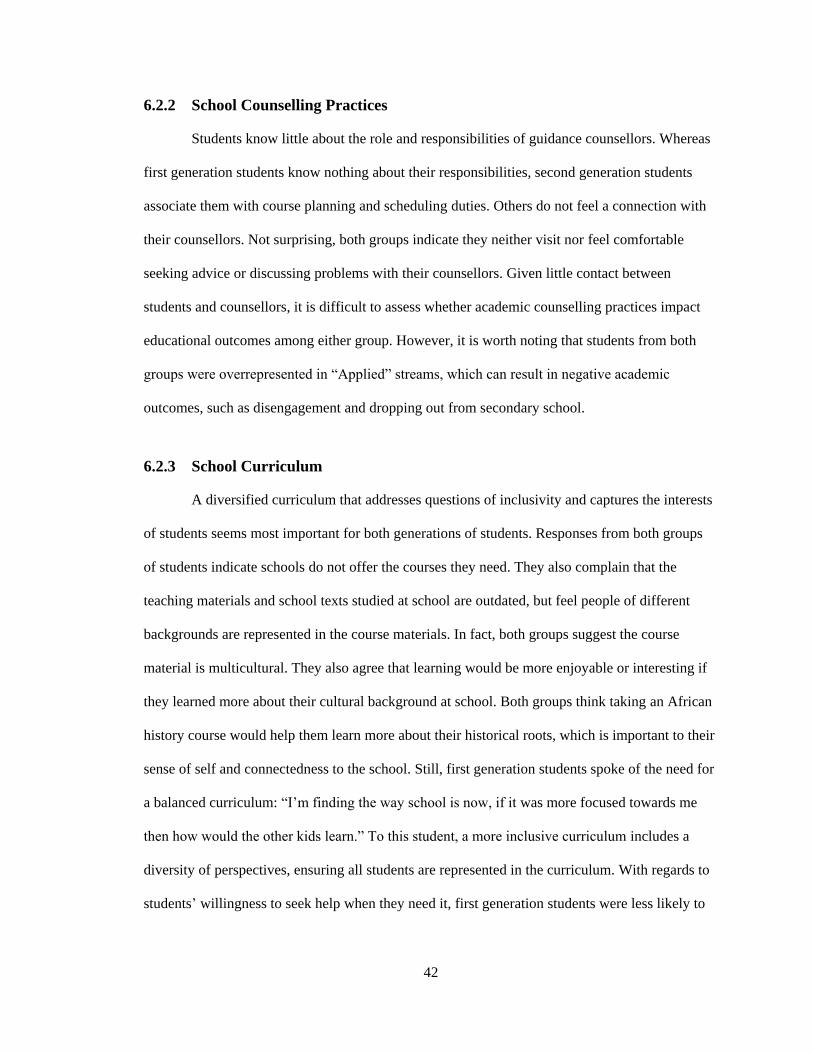
42
6.2.2 School Counselling Practices
Students know little about the role and responsibilities of guidance counsellors. Whereas
first generation students know nothing about their responsibilities, second generation students
associate them with course planning and scheduling duties. Others do not feel a connection with
their counsellors. Not surprising, both groups indicate they neither visit nor feel comfortable
seeking advice or discussing problems with their counsellors. Given little contact between
students and counsellors, it is difficult to assess whether academic counselling practices impact
educational outcomes among either group. However, it is worth noting that students from both
groups were overrepresented in “Applied” streams, which can result in negative academic
outcomes, such as disengagement and dropping out from secondary school.
6.2.3 School Curriculum
A diversified curriculum that addresses questions of inclusivity and captures the interests
of students seems most important for both generations of students. Responses from both groups
of students indicate schools do not offer the courses they need. They also complain that the
teaching materials and school texts studied at school are outdated, but feel people of different
backgrounds are represented in the course materials. In fact, both groups suggest the course
material is multicultural. They also agree that learning would be more enjoyable or interesting if
they learned more about their cultural background at school. Both groups think taking an African
history course would help them learn more about their historical roots, which is important to their
sense of self and connectedness to the school. Still, first generation students spoke of the need for
a balanced curriculum: “I‟m finding the way school is now, if it was more focused towards me
then how would the other kids learn.” To this student, a more inclusive curriculum includes a
diversity of perspectives, ensuring all students are represented in the curriculum. With regards to
students‟ willingness to seek help when they need it, first generation students were less likely to
43
forego help from a teacher.16 Moreover, neither group of students found the school workload
demanding or too challenging.
6.2.4 School Discipline
Nothing indicates students are being disciplined for being nonconformist or resistant to
school discipline. Students are asked whether they thought they were treated fairly by school
authorities. Girls from both groups raise issues related to dress codes and boys complain about the
need to maintain grades to remain on sports teams. One second generation student suggests some
Jamaican and African students are more likely to be suspended than their mainstream
counterparts. She notes:
“Like, in my school, like, there are some people that...do stuff and get kicked out, but I don‟t feel
like they treat everybody fair, in my school, cause, there are people that, well, I‟ve seen people
like try to stab somebody and they‟ll get kicked out, they‟ll get kicked out and come back. And
some people who did something like not as bad, get kicked out and can‟t come back to school.
It‟s because of who they are...Caribbean, like Black, just Jamaicans, Africans.”
This implies that some students may perceive that their peers are more often penalized for
engaging in the same types of behaviours than other students. Furthermore, that discipline is
arbitrarily administered. While it is difficult to substantiate without a larger sample size, the fact
that a female student was more likely to believe that there is bias in terms of treatment relating to
school punishment does not correspond with available research on school discipline.17
6.2.5 Peer Groups
First generation students have slightly higher expectations of themselves academically
than their second generation counterparts. All students report academic achievement is
encouraged among their friends. However, first generation students do speak to occasional issues
16 Past studies have shown that students in need of help often do not ask for it (Stanton-Salazar & Spina, 2000).
However, this was not the case for first generation students in this study. 17 Ruck & Wortley (2002)
44
of teasing and bullying when asked how well they get along with other students in the school. As
one female student explains about clothes and accessories:
...it depends, there are some people in our school that if you‟re not wearing the newest Nikes, or
if you‟re not wearing the newest Jordans, or if you don‟t have a Jsquare bag, they don‟t want to
see you... so, they used to get at you like, where did you get those shoes from, Salvation Army,
you know.
While this student recounted teasing as a negative component of the school environment, there is
no sense that this directly impacted the student‟s achievement. As noted, students from both
groups had different self-expectations for academic achievement. Still, there is no indication that
academic achievement is discouraged to the extent that high-achieving first generation students
are forced to associate with students from other ethnic groups. On questions regarding future
aspirations, both groups of students understand the importance of education and their own social
mobility in the future. All students are in agreement that going to college or university would
make a positive difference in their lives. There is also a broad range of career goals among
students from becoming a teacher, a lawyer to pursuing a career in either the music or sport and
entertainment industries.
6.2.6 Other School Factors
Lastly, students are asked if they could think of any reasons why students born in the
ESC dropout of school. A majority of first and second generation students highlight the
significance of peer influence and the lure of selling drugs to make money, which, again, raises
the issue of a negative peer effect. First generation students also indicate that the negative
stereotypes about the communities in which students live plays a role. As one first generation
student explains regarding the high dropout rate:
It probably depends on the school and like the atmosphere, the atmosphere of the school. I know,
cause, when most, when most of these Black kids, when they come to Canada, once they started
the drugs, they start making money and then they drop out of school to go and make money, and
then they end up getting in trouble, and then if they go to jail, it screws up everything...that‟s
probably what it is, and plus, like, I live in the Jane and Finch area, and like all the folks are
45
stereotyped. Like you‟re from Jane and Finch, you‟re going to get shot; oh you‟re going to get
shot bad.
While schools have little control over negative societal labelling and other factors that constitute
social risk, underachievement is open to school intervention. With this in mind, my primary
methodology reveals that teacher expectations and school curriculum play a role in the
underachievement of students born in the ESC. While the students do not suggest as much, all
informants agree that disciplinary practices have adverse impacts on academic achievement. Half
of the informants feel peer groups play a role; others suggest low teacher expectations are the
larger factor. All students report academic achievement is encouraged among their friends, but
underscore the significance of peer influence and drug peddling. Additionally, there is no clear
agreement on the role of school counselling practices on student achievement. Generally, low
expectations and negative stereotypes are attributed to this factor. Points are also raised about the
poor linkages between schools and the Caribbean community in Toronto schools, which lead to
negative academic outcomes.
6.3 Case Study
Table 17 provides a summary of the comparative analysis between the responses of first
generation students in the focus group and the case study. While proxies do not exist for all the
school factors investigated in my study, Springer et al. (2006) address the role of teacher
relationships and expectations, school discipline and the ability of first generation students to
follow curricular demands. They also inquire about the future aspirations of students (see
Appendix G). Some commonality is found between first generation students in the focus group
and case study on the issue of teacher relationships. Students from the case study report that they
have no strong relationships with any of their teachers. They also suggest that not all teachers
expect them to succeed in school. Equally, 47% of dropouts in the case study feel discrimination
makes it hard for people of Caribbean background to get good marks in school. However, first
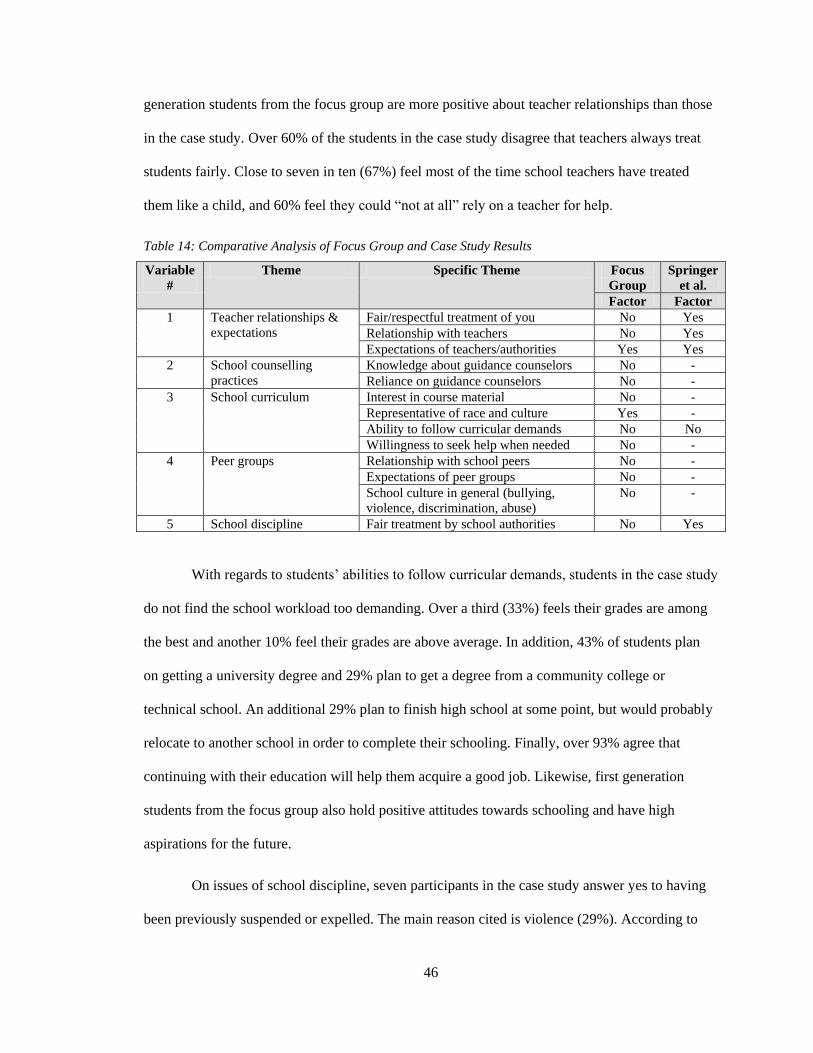
46
generation students from the focus group are more positive about teacher relationships than those
in the case study. Over 60% of the students in the case study disagree that teachers always treat
students fairly. Close to seven in ten (67%) feel most of the time school teachers have treated
them like a child, and 60% feel they could “not at all” rely on a teacher for help.
Table 14: Comparative Analysis of Focus Group and Case Study Results
Variable
#
Theme Specific Theme Focus
Group
Springer
et al.
Factor Factor
1 Teacher relationships &
expectations
Fair/respectful treatment of you No Yes
Relationship with teachers No Yes
Expectations of teachers/authorities Yes Yes
2 School counselling
practices
Knowledge about guidance counselors No -
Reliance on guidance counselors No -
3 School curriculum Interest in course material No -
Representative of race and culture Yes -
Ability to follow curricular demands No No
Willingness to seek help when needed No -
4 Peer groups Relationship with school peers No -
Expectations of peer groups No -
School culture in general (bullying,
violence, discrimination, abuse)
No -
5 School discipline Fair treatment by school authorities No Yes
With regards to students‟ abilities to follow curricular demands, students in the case study
do not find the school workload too demanding. Over a third (33%) feels their grades are among
the best and another 10% feel their grades are above average. In addition, 43% of students plan
on getting a university degree and 29% plan to get a degree from a community college or
technical school. An additional 29% plan to finish high school at some point, but would probably
relocate to another school in order to complete their schooling. Finally, over 93% agree that
continuing with their education will help them acquire a good job. Likewise, first generation
students from the focus group also hold positive attitudes towards schooling and have high
aspirations for the future.
On issues of school discipline, seven participants in the case study answer yes to having
been previously suspended or expelled. The main reason cited is violence (29%). According to
47
the Director of Caribbean Research, many of the students in the case study suggested school
discipline is administered arbitrarily by school authorities. In contrast, first generation students
from the focus groups do not share these views.
Students in the case study also share their reasons for dropping out of secondary school.
While over 40% cite “financial” reasons as the main reason for leaving school, another 29% cite
“relocation”. First generation students in the focus groups also cite financial reasons as a possible
reason for why students drop out of school. One female student explains:
I think the government should give more money to the schools, like a special program for people
that can‟t really afford to come to school and those stuff...at least if there‟s like, you know, if
you ever got busted before you come to school, there‟s nothing really on their minds saying
like oh how am I going to come to school, how I‟m going to eat, so if there‟s a program, I
think the percentage of dropouts would be lesser.
Again, issues regarding socioeconomic disadvantage emerge, which schools have little control
over. However, common school factors that prevail from the focus group and case study are
missing teacher relationships and low teacher expectations. First generation students in both the
focus group and case study do, however, share positive attitudes towards education as vehicle for
success and upward mobility.
6.4 Summary of Findings
The purpose of this section is to highlight school factors that positively and negatively
influence academic achievement of ESC students. Table 18 presents a summary of the overall
findings. Accordingly, a number of issues emerge:
1) Teacher expectations: All informants except one believe that teacher expectations play
an important role in the underachievement of students born in the ESC. First generation students
recount a lack of teacher relationships and stress the value of minority teachers as role models in
schools. Case study participants also disagree that teachers always treat students fairly.
48
2) School counselling practices: There is no clear consensus among key informants on this
factor. Some key informants attribute low expectations to why first generation students are placed
in non-academic streams. Missing school partnerships with Caribbean families and the lack of
awareness among students and parents about certain academic paths is also mentioned. Students
also report little knowledge about the role and responsibilities of guidance counsellors.
3) School curriculum: All informants agree that if students do not see themselves in the
curriculum, it leads to disengagement. The curriculum material needs to better relate to students.
First generation students also think learning about their own cultural background would help
them to do better in school.
4) School discipline: All informants agree the Safe Schools Act (SSA) and the zero
tolerance approach that ensued had negative impacts on the Caribbean population, notably among
males. The weak ties between the schools and the Caribbean community remain an issue as well.
Disciplinary measures are more likely to occur in neighbourhoods where there is less parental
involvement.
5) Peer groups: There is no clear agreement among key informants regarding this factor.
There is a general acknowledgement among informants about the need to cultivate peer culture
and show ESC students the relevance of education to themselves and their communities. ESC
students also highlight the significance of peer influence and the lure of selling drugs to make
money. On the contrary, first generation students report that they hold high expectations of
themselves with respect to academic achievement, as do case study participants. Still, recent
studies on racial composition in U.S. schools suggest the negative effect of higher proportion of
Black students is highly significant for Blacks, much more so than for Whites (Hanushek and
Rivkin, 2006). This is especially true in terms of achievement on standardized tests for basic
subjects. Given that ESC students continue to have the highest at-risk rates in credit accumulation
and core curriculum subjects, the minority peer effect is likely deleterious.
49
Overall, the school factors that influence the policy analysis that follows are:
Low teacher expectations and ill-prepared educators to engage different learning
and social style.
The need to cultivate peer culture among ESC students
Culturally insensitive curriculum that fails to reflect the experiences and histories
of students.
Lack of linkages and meaningful partnerships between schools and the wider
Caribbean community.
School discipline is also found to negatively influence the academic achievement of ESC
students. Much of that is attributed to the SSA. However, this change in the TDSB‟s disciplinary
climate did not go unnoticed by community stakeholders. In July 2005, the Ontario Human
Rights Commission (OHRC) initiated a complaint against the TDSB. The complaint alleged that
the enforcement of the SSA and the TDSB‟s policies on discipline were having a disproportionate
impact on racial minority students and students with disabilities. As a result of this complaint, the
TDSB and the OHRC entered into a settlement agreement in November 2005. The TDSB is now
expected to report yearly to the Provincial School Safety and Equity Officer on progress made in
implementing the OHRC settlement. The TDSB implemented a progressive discipline approach
with the goal of curbing suspensions and expulsions.18 Changes have also been made by the
current provincial government to Ontario‟s Education Act (Falkoner et al., 2008). Given these
policy interventions, I do not address school discipline in my policy options.
18 Recent TDSB data indicates the number of students suspended by system enrolment has since declined from 2005-
2008. In 2005-06 the number of students suspended and overall suspensions showed a marked decline, and the
numbers have continued to drop for 2007-08 (TDSB, 2007; TDSB, 2008e).
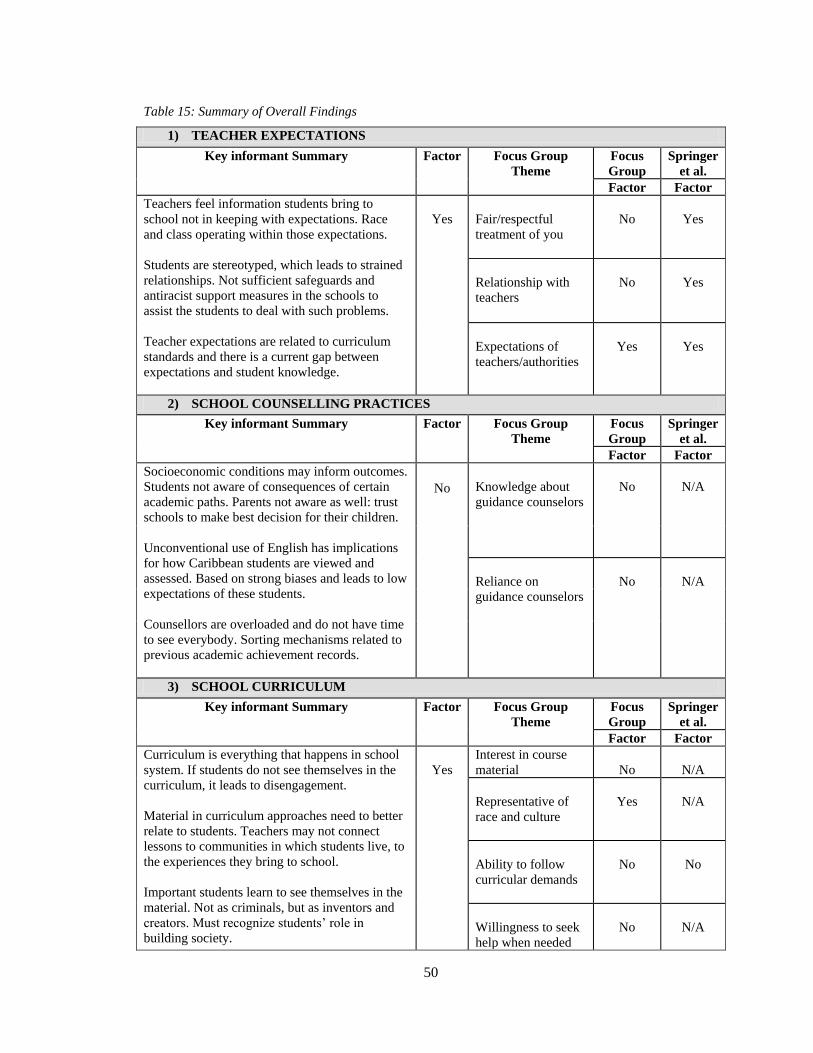
50
Table 15: Summary of Overall Findings
1) TEACHER EXPECTATIONS
Key informant Summary Factor Focus Group
Theme
Focus
Group
Springer
et al.
Factor Factor
Teachers feel information students bring to
school not in keeping with expectations. Race
and class operating within those expectations.
Students are stereotyped, which leads to strained
relationships. Not sufficient safeguards and
antiracist support measures in the schools to
assist the students to deal with such problems.
Teacher expectations are related to curriculum
standards and there is a current gap between
expectations and student knowledge.
Yes
Fair/respectful
treatment of you
No
Yes
Relationship with
teachers
No
Yes
Expectations of
teachers/authorities
Yes
Yes
2) SCHOOL COUNSELLING PRACTICES
Key informant Summary Factor Focus Group
Theme
Focus
Group
Springer
et al.
Factor Factor
Socioeconomic conditions may inform outcomes.
Students not aware of consequences of certain
academic paths. Parents not aware as well: trust
schools to make best decision for their children.
Unconventional use of English has implications
for how Caribbean students are viewed and
assessed. Based on strong biases and leads to low
expectations of these students.
Counsellors are overloaded and do not have time
to see everybody. Sorting mechanisms related to
previous academic achievement records.
No
Knowledge about
guidance counselors
No
N/A
Reliance on
guidance counselors
No
N/A
3) SCHOOL CURRICULUM
Key informant Summary Factor Focus Group
Theme
Focus
Group
Springer
et al.
Factor Factor
Curriculum is everything that happens in school
system. If students do not see themselves in the
curriculum, it leads to disengagement.
Material in curriculum approaches need to better
relate to students. Teachers may not connect
lessons to communities in which students live, to
the experiences they bring to school.
Important students learn to see themselves in the
material. Not as criminals, but as inventors and
creators. Must recognize students‟ role in
building society.
Yes
Interest in course
material
No
N/A
Representative of
race and culture
Yes
N/A
Ability to follow
curricular demands
No
No
Willingness to seek
help when needed
No
N/A
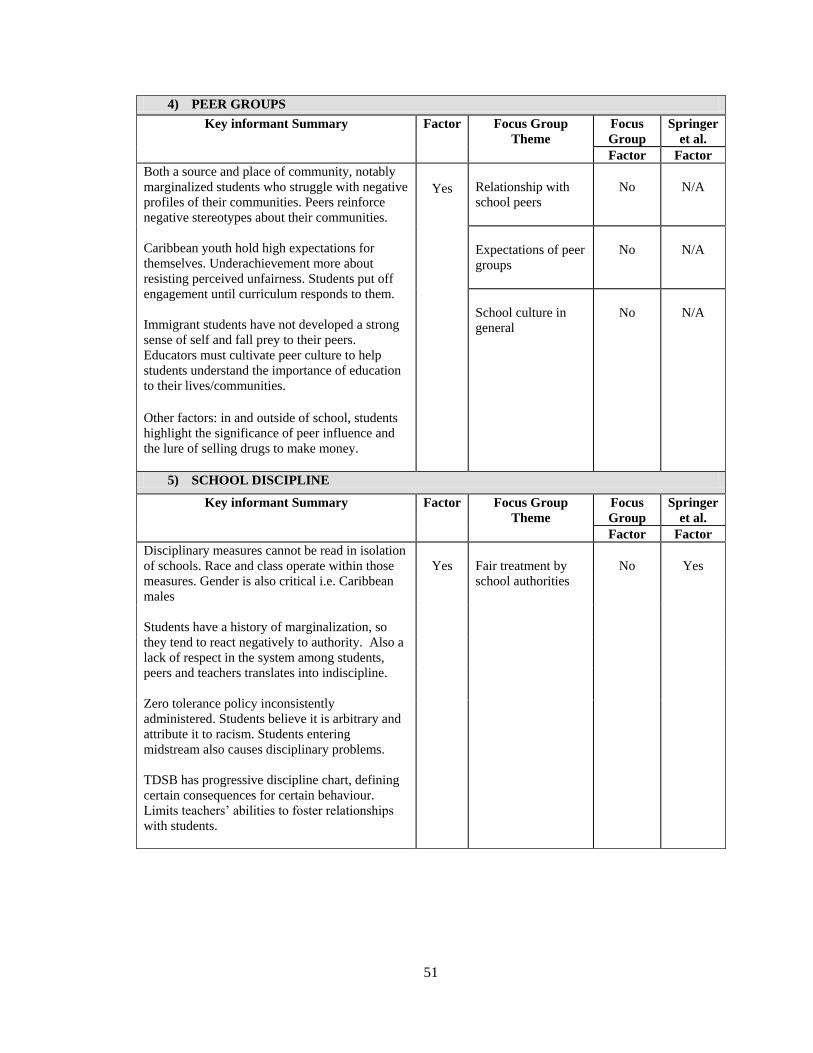
51
4) PEER GROUPS
Key informant Summary Factor Focus Group
Theme
Focus
Group
Springer
et al.
Factor Factor
Both a source and place of community, notably
marginalized students who struggle with negative
profiles of their communities. Peers reinforce
negative stereotypes about their communities.
Caribbean youth hold high expectations for
themselves. Underachievement more about
resisting perceived unfairness. Students put off
engagement until curriculum responds to them.
Immigrant students have not developed a strong
sense of self and fall prey to their peers.
Educators must cultivate peer culture to help
students understand the importance of education
to their lives/communities.
Other factors: in and outside of school, students
highlight the significance of peer influence and
the lure of selling drugs to make money.
Yes
Relationship with
school peers
No
N/A
Expectations of peer
groups
No
N/A
School culture in
general
No
N/A
5) SCHOOL DISCIPLINE
Key informant Summary Factor Focus Group
Theme
Focus
Group
Springer
et al.
Factor Factor
Disciplinary measures cannot be read in isolation
of schools. Race and class operate within those
measures. Gender is also critical i.e. Caribbean
males
Students have a history of marginalization, so
they tend to react negatively to authority. Also a
lack of respect in the system among students,
peers and teachers translates into indiscipline.
Zero tolerance policy inconsistently
administered. Students believe it is arbitrary and
attribute it to racism. Students entering
midstream also causes disciplinary problems.
TDSB has progressive discipline chart, defining
certain consequences for certain behaviour.
Limits teachers‟ abilities to foster relationships
with students.
D
Yes
Fair treatment by
school authorities
No
Yes
52
7: Policy Objectives, Options, Criteria Analysis
To assess the various policy options, I identify both long-term and short-term objectives
as well as criteria to evaluate the policy options. I assign a measure to each criterion for the
purpose of comparison.
7.1 Policy Objectives
To close the achievement gap for underachieving students, the TDSB has set a “Key
System Goal” to increase the secondary school graduation rate for all demographic groups to a
minimum of 85% in five years. The TDSB has established a 5% per year improvement for the
next five years for underachieving groups for secondary school graduation (TDSB, 2008d). For
the purposes of this study, the long-term objective is to reduce the dropout rate among students
born in the ESC from 40% to 15% by 2013 as set by the TDSB and my short-term goal is to
reduce it to 35% by 2010.
7.1.1 Policy Options
Based on my findings in sub-section 6.4., a number of policy options are designed to
address the factors that negatively influence the academic achievement of Black student
populations. Two often cited reforms are an Afrocentric alternative secondary school and
increasing the number of minority teachers in the school system. However, the literature does not
clearly support the efficacy of these policy options in addressing the dropout rate (Ginwright,
2000; Pitts, 2005). Hence, those options are not proposed. Teacher merit pay was also considered
as a policy option in this study; the idea of rewarding teachers that do a good job (based on the
performance of their students) and weeding out those teachers that do not. It would also entail
53
putting the very best teachers in the poorest schools in Toronto and paying them salaries to
compensate for the challenges they face (Ibbitson, 2009). However, as noted earlier, a major
limitation of this study is that it does not account for the views of frontline principals and
teachers. Without these interviews, it is difficult to accurately assess whether merit pay would be
acceptable to frontline teachers and the unions. Moreover, a recent report by the British
Columbia-based Society for the Advancement of Excellence in Education suggests the
substantive effects of merit pay on student achievement are mixed. Based on a review of six
teacher compensation programs operating at the district, state, and national levels in the United
States, the report argues merit pay would help attract and retain better teachers. Yet, “merit” is
hard to define (i.e. risks arbitrariness and favouritism by principals) and the study finds such pay
for individual teachers is unpopular. Many view merit pay as proliferating unhealthy competition
and lowering staff morale (Raham et al., 2008). Hence, the three alternative options are:
Option 1: Provide ongoing diversity training for all TDSB employee groups
Students stay in school when social relations with their teachers are positive. In this
study, both first and second generation students spoke about teachers harbouring negative
attitudes towards students. Informants also indicated that there are insufficient safeguards and
antiracist support measures in schools. While not all teachers and school staff are insensitive,
there is the sense that some are ill-prepared to engage different learning and social styles. To
address these findings, option 1 proposes the TDSB provide ongoing diversity training for all
employee groups modeled after the approach of the Hamilton-Wentworth District School Board
(HWDSB). Specifically, the HWDSB currently provides staff development opportunities related
to racism and classism in partnership with the Canadian Race Relations Foundation (CRRF) and
the Settlement and Integration Services Organization (SISO). According to the CRRF, the
training supports school staff by deepening their awareness and understanding of the implications
of diversity, equity and racism in schools today. The workshops provide practical strategies and
54
resources for the school and the classroom, with an emphasis on turning theory into practice.
Participants explore racism and other forms of discrimination in education as well as learn how to
deliver an inclusive curriculum based on anti-racism and multicultural approaches. Sessions also
focus on identity and inclusion as well as understanding systemic barriers to equality in education
for all students (Canadian Race Relations Foundation, 2009).19 This option should be offered
annually to all existing and new staff.
Option 2: Pilot Caribbean Academic Program
Key informants suggest ESC students perform poorly in school because the curriculum
has little relevance to their lives and culture. Data in this study show first generation students
believe learning about their cultural background would make school more interesting and
enjoyable for them and would help them to do better in school. ESC students also cite unequal
treatment by teachers, namely because of linguistic differences. The use of native jargon and
improper use of English has a direct implication for how they are counselled and assessed. The
fact also remains that very few ESC students have acquired the literacy (reading and writing)
skills expected by the end of Grade 9. To address these shortcomings, option 2 proposes the
TDSB pilot the Caribbean Academic Program (CAP), similar to the one introduced in Evanston
Township High School (ETHS) near Chicago in 1986 (Siegler, 1999). The CAP, a specialized
curriculum and transitional program, provides a variety of services to help students succeed
(Evanston Township High School, 2009b).20 ESC Students spend part of the day in their CAP
classes and the other half in regular content courses. The program offers a maximum of two years
of language instruction and emphasis is on learning English grammar and sentence structure by
studying the differences between Creole and English. Students receive full credits for their
participation and attention is paid to developing respect for the Creole language. Specifically,
19 Similar training opportunities have been provided to staff in the school districts of Fort Wayne, Indiana and Durham
Public Schools in North Carolina, which have proven effective for lowering dropout rates for diverse populations
(Sadowsky, 2001; Durham Public School District, 2009). 20 At ETHS; at least 8% of ETHS‟ students were born in Jamaica, Belize, Barbados, and the Bahamas (Evanston
Township High School, 2009b).
55
freshmen participate in a special section of reading, where cultural and language differences
experienced in other classes are addressed. For upper class students, CAP offers support in
mainstream English classes as well as a literature and language classes. Caribbean literature is
used extensively to build reading skills, including stories, plays, tales and poetry. Students
enrolled in CAP classes are also eligible for an intensive study period, in which they can receive
individual and small group homework assistance (Evanston Township High School, 2009b).
Another key to the CAP program is parent involvement. The program is carefully explained to
parents by teachers and students, and a CAP parent group meets regularly (Fischer, 1992).
Option 3: Partner with Pathways to Education to Target ESC Secondary Students
Findings from this study suggest that there is a lack of linkages and meaningful
partnerships that exist between schools and the wider Caribbean community. First generation
students cite financial reasons as a possible reason for why students drop out of school as well as
negative peer pressure. In the GTA, Regent Park‟s Pathways to Education program addresses the
lack of connectivity between the schools and the community, and fills the existing gap in how the
TDSB engages with ESC students and their families. It also helps to address issues of high
poverty among ESC students, negative peer effects and the importance of positive role models in
their lives. The Regent Park Community Health Centre initiated the Pathways to Education
program in Regent Park in 2001. This is the oldest public housing project and one of the most
economically disadvantaged neighbourhoods in Canada (Pathways to Education, 2009). The
specific objectives of the program are to increase retention in high school and academic success
of students from the Regent Park area. Option 3 proposes the TDSB work closely with Caribbean
families and partner with the Pathways program to address the needs of high-risk ESC students.
The program would address many community risk factors, such as poverty, minority status and
the inability of Caribbean parents to navigate the school system. For instance, the Pathways
program helps bridge the gap between parents and secondary schools by providing information
56
and supporting active parental involvement. The program is also free to participating students.
The only requirement is that parents sign a contract agreeing to participate and giving Pathways
staff the right to both advocate on the students‟ behalf and gain access to their personal
information, including attendance records and grades from local secondary schools. In return,
students have access to tutoring in their communities four nights a week and participate in group,
individual and career mentoring. Students further receive financial support such as bus fare to
attend school and a thousand dollar scholarship towards post-secondary education. Lastly,
students and parents receive personal support and advocacy from a Student-Parent Support
Worker (Pathways to Education, 2008).
7.2 Criteria for Analysis
A set of four criteria provide the framework for evaluating each policy option. Those
criteria are effectiveness, administrative feasibility, stakeholder acceptability and cost. Table 15
provides a summary of the criteria and measures applied in the policy analysis. All criteria are
weighted equally and assigned a rating of high (score = 3), medium (score = 2) and low (score
=1). This system of analysis enables me to allocate a score to each criterion, thus highlighting the
tradeoffs between them. The total scores allow me to determine how well each policy achieves
the objectives.
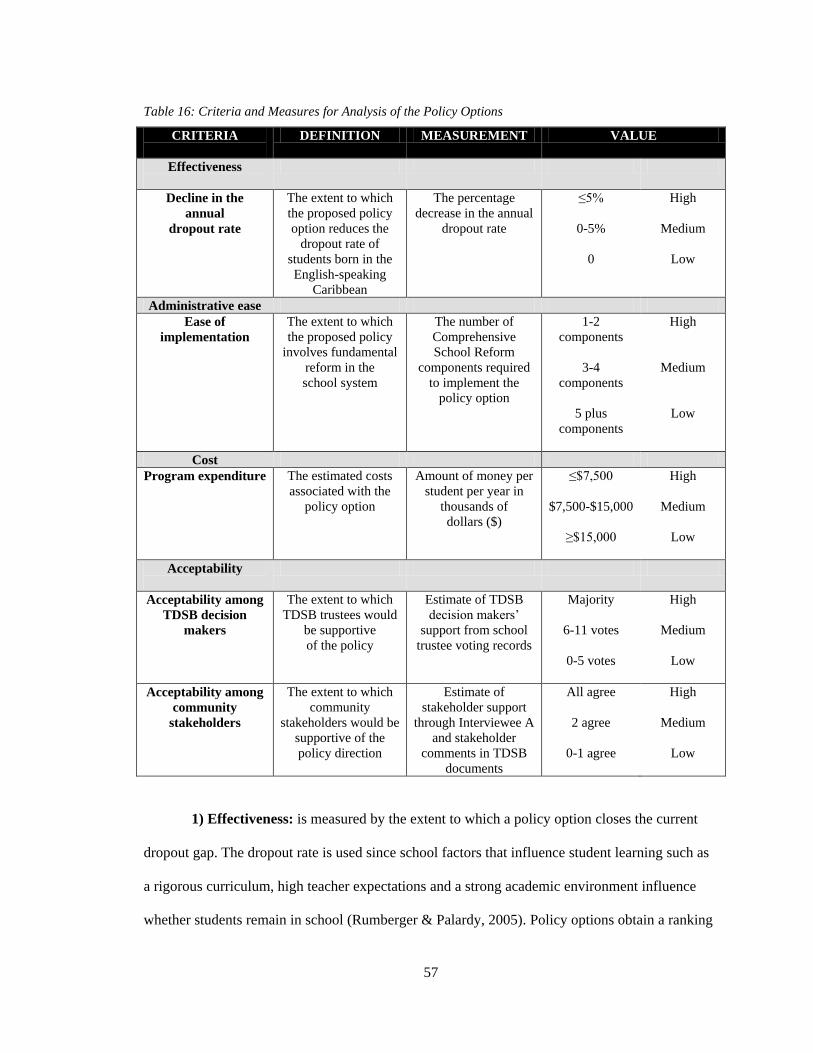
57
Table 16: Criteria and Measures for Analysis of the Policy Options
CRITERIA
DEFINITION MEASUREMENT VALUE
Effectiveness
Decline in the
annual
dropout rate
The extent to which
the proposed policy
option reduces the
dropout rate of
students born in the
English-speaking
Caribbean
The percentage
decrease in the annual
dropout rate
≤5%
0-5%
0
High
Medium
Low
Administrative ease
Ease of
implementation
The extent to which
the proposed policy
involves fundamental
reform in the
school system
The number of
Comprehensive
School Reform
components required
to implement the
policy option
1-2
components
3-4
components
5 plus
components
High
Medium
Low
Cost
Program expenditure The estimated costs
associated with the
policy option
Amount of money per
student per year in
thousands of
dollars ($)
≤$7,500
$7,500-$15,000
≥$15,000
High
Medium
Low
Acceptability
Acceptability among
TDSB decision
makers
The extent to which
TDSB trustees would
be supportive
of the policy
Estimate of TDSB
decision makers‟
support from school
trustee voting records
Majority
6-11 votes
0-5 votes
High
Medium
Low
Acceptability among
community
stakeholders
The extent to which
community
stakeholders would be
supportive of the
policy direction
Estimate of
stakeholder support
through Interviewee A
and stakeholder
comments in TDSB
documents
All agree
2 agree
0-1 agree
High
Medium
Low
1) Effectiveness: is measured by the extent to which a policy option closes the current
dropout gap. The dropout rate is used since school factors that influence student learning such as
a rigorous curriculum, high teacher expectations and a strong academic environment influence
whether students remain in school (Rumberger & Palardy, 2005). Policy options obtain a ranking
58
of (1) if they leave dropout rates unchanged. I give a score of (2) if they decrease dropout rates by
less than 5%. Options receive a ranking of (3) if they decrease dropout rates by 5% or more.
2) Administrative ease: measures the extent to which a policy option requires
fundamental reform in the school system. The Comprehensive School Reform (CSR) model
measures the degree to which a policy option addresses all aspects of a school system‟s
operations. There are five general components to the CSR: resource restructuring (either with
existing or the realignment of financial resources), internal facilitator (to coordinate the
implementation of the reform and otherwise monitor implementation), initial training (the amount
of specific training and staff development required) teacher buy-in (changes in curriculum,
classroom instruction and assessment) and outside assistance (the amount of assistance required
external to the school board to implement the reform). Thus, the more comprehensive the reform
the more difficult to it will be to implement (Vernez et al., 2006). Options receive a ranking of (1)
if they require all 5 components. I allocate a score of (2) if they require 3-4 components. Options
obtain a ranking of (3) if they require 1-2 components.
3) Cost: is an estimate of the cost associated with high school dropouts in Canada. The
failure to complete high school has fiscal consequences in terms of public expenditures on social
services and programs, education, employment, criminality, lower economic productivity and
health. According to a recent study, the annual estimated cost in 2008 per dropout in Canada is
$15,613 (Hankivsky, 2008). The cost estimates are as follows:
Health (private)21 $8,098
Social Assistance (public) $4,230
Crime (public) $224
Tax revenue loss (public) $226
Revenue loss in employment insurance premium (public) $68
Employment insurance cost (public) $2,767
Total: $15,613
21 Data on public healthcare costs are not available. Instead, private healthcare costs are used as a proxy
(Hankivsky, 2008).
59
Policy options receive a ranking (1) if they require more than $15,000 per student. I give options
a score of (2) if they require $7,500 - $15,000 per student. I assign a score of (3) if they require
less than $7,500 per student.
4) Stakeholder acceptability: is divided into three parts: acceptability by TDSB
decision-makers and acceptability by community stakeholders. For each part the total score is
divided by two to maintain equal weights across criteria. Hence, assigned to each criterion is a
ranking of high (score=1.5), medium (score=1) and low (score=.5).
Part 1: There are 22 school trustees and their support is a necessary condition for the
adoption of any policy. I estimate the acceptability of a policy option to TDSB decision-makers
based on past voting records, which are available on the TDSB website. Given that resolutions
pass by majority opinion, policies receive a rank of (.5) if they are estimated to garner 0-5 trustee
votes. I give a score of (1) if they are estimated to receive 6-11 trustee votes. Options receive a
rank of (1.5) if they are estimated to garner majority support.
Part 2: I determine how acceptable a measure is to a number of community stakeholder
groups as well. These groups, outlined in section 4, provide advocacy and culturally sensitive
services to newcomers and the Caribbean and Black communities. I also estimate how other
community groups with high dropout rates (e.g. Central and South America, Eastern Africa)
would react to targeted policies or exclusion from ESC student programs. The scoring for this
criterion is measured through an interview with a Caribbean settlement worker in the GTA and
TDSB consultation documents from Black Community Education Forums and the consultation
process from the TDSB‟s Urban Diversity Strategy.22 To determine stakeholder acceptability,
22 The Caribbean settlement worker was interviewed on March 5, 2009. For the purposes of confidentiality, the name
of the Caribbean settlement worker is withheld. Hereafter, the settlement worker is referred to as Interviewee A. The
TDSB consultation process documents are developed based on stakeholder input from Black Community Education
Forums held on December 1, 2007 at Northview Heights Secondary School and December 8, 2007 at Winston
Churchill Collegiate Institute in the GTA (TDSB, 2008f). They are also developed based on a review of submissions by
groups representing organizations at TDSB community forums, including: the Canadian Arab Federation, Hispanic,
Muslim, Portuguese, and Somali communities (TDSB, 2008g).
60
assigned to this criterion is a ranking of low (score =.5) if none or only one of the stakeholders
agree, medium (score = 1) if two of the stakeholders agree and high (score = 1.5) if all
stakeholders agree with the policy direction.
It is important to note that equity as a criterion is not used to evaluate the policy options.
The underlying principle of this policy study is how to achieve institutionalised equity for
students born in the ESC. Equity means providing for each and every student, so they can reach
or exceed a common standard and be successful in school (McIntosh, 2009). As schools
institutionalise equity, dropout rates decrease. Equity is covered by the effectiveness criterion.
61
8: Analysis of Policy Options
This section evaluates each of the policy options using the criteria outlined in the
previous section. My analysis informs the final policy recommendation.
8.1 Option 1: Provide Ongoing Diversity Training for All TDSB
Employee Groups
Effectiveness: Diversity training was introduced in Fort Wayne, Indiana, a district of
approximately 32,000 students, 26 percent of whom are black, in 1994. The dropout rate for
Black students was 10.4 percent in 1994 and by 2001 this rate had dropped to 2.6 percent, less
than one percentage point away from the dropout rate for White students (Sadowski, 2001).23
While Fort Wayne credits several ongoing initiatives for the reduction, diversity training for
school staff was central to tackling dropout rates. This dropout reduction represents a 1.1 percent
gain per year on average, but is less than 5 percent.24 Effectiveness ranks medium.
Administrative ease: First, this option would require a realignment of existing resources,
namely within the budget of the TDSB‟s Student and Community Equity office. Second, it also
demands an internal facilitator to coordinate and monitor implementation of the training. The
TDSB‟s Student and Community Equity office would possibly have the lead with the assistance
of Employee Services and respective Superintendents of Education in the TDSB. Third, this
option requires specific training on issues of equity and diversity for all employee groups.
Training would take place on weekends or outside regular school hours. Fourth, it also potentially
requires changes in classroom instruction, as teachers may need to alter their current approach to
23
In the given case, a dropout is defined as a student that has not graduated and not enrolled in a current semester, but
who was otherwise eligible for enrolment (Indiana Department of Education, 2009). 24 Correspondence was shared with the author of the Fort Wayne study, Dr. Michael Sadowski, on April 1, 2009. He
confirmed the dropout rate decline for Black students in the study (i.e. 8 percentage points) and that the reduction
happened somewhat gradually, spread evenly between 1994-2001.
62
their teaching practices. Fifth, outside assistance would be needed from the CRRF or another
consulting body, which offers diversity training to Ontario school boards. So, there are five CSR
components and administrative ease ranks low.
Cost: Training could be administered by the CRRF and SISO. Costs are $300 per school
staff member.25 Included in the costs are binders, instruction materials and six workshops
(Canada Race Relations Foundation, 2009). Staffing levels in 2007-08 indicate there were 5,847
secondary school teachers, 105 principals and 179 vice-principals in the TDSB. This includes 360
new secondary teachers. I am assuming the total number of participants will not change in the
short-run. So, the total annual cost is $1,839,300 (i.e. 5,847 +105 + 179 x $300). Using October
2005 dropout numbers in TDSB secondary schools (3,814), costs are estimated at $482 per
student (Brown & Doc, 2006). This cost does not include guidance counsellors and support staff.
Staff level breakdowns for these positions are unavailable at the secondary school level. So, this
cost is less than seventy-five hundred dollars per student and cost ranks high, meaning the dollar
amount is low.
Stakeholder acceptability: Past Board meetings indicate majority support for the
provision of board wide equity training as well as ongoing professional development on
multicultural and anti-racist education (21-0 in favour of motion and no vote cast by chair)
(TDSB, 2008f). Stakeholder acceptability among TDSB decision-makers ranks high. As for
community stakeholder acceptability, Interviewee A suggests teachers need to be more sensitive
to the cultural background of their students. Black community education forums call for the
provision of intensive training for not only teachers, but principals, guidance counsellors and
support staff in “equity issues, including anti-racism and gender equity awareness and strategies;
stereotyping; racial profiling; cross cultural differences; and understanding the immigrant and
25 This cost estimate is based on a telephone conversation with the Director of Education and Training, Canadian Race
Relations Foundation, on April 17, 2009, who indicated the cost per workshop, is $1500 for 30 participants, which is
approximately $50 per participant or $300 for all six workshops.
63
refugee experience” (TDSB, 2008h). Other community groups also call for incorporating
antiracist and equity training in new teacher education. Since all three stakeholders agree with the
policy direction, community stakeholder acceptability ranks high.
8.2 Option 2: Pilot Caribbean Academic Program
Effectiveness: Prior to the introduction of the CAP in ETHS, a disproportionate number
of the ESC students were dropping out of school or being placed in special education classes. A
decade later, the number of ESC student dropouts and those in special education had reduced
dramatically with many moving on to honours classes and going on to college (Menacker, 1998).
While specific data are not available from ETHS on reducing the dropout rate, similar transitional
bilingual programs have proven effective. In 1996, Thomas J. Rusk (TJR) Middle School in
Nacogdoches, Texas was designated as a low-performing school by the Texas Education Agency
because of a dropout rate of 8.3 percent for Hispanic students. By 2000, the dropout rate has been
reduced to less than one percent.26 This improvement is credited to increased faculty awareness of
the needs of the Hispanic population, a restructured ESL program to cater to the needs of
Hispanic students and enhanced parent involvement activities (Cassity & Harris, 2000).27 This
dropout reduction represents a 1.8 percent gain per year on average, but is less than 5 percent.
Effectiveness ranks medium.
Administrative ease: First, this option would require a realignment of financial
resources within the TDSB‟s current ESL program budget. Second, an internal facilitator would
have to be appointed to coordinate testing and placement for all CAP students (incoming Grade 9
ESC students and others new to the Board). A coordinator would also a need to establish and
26 According to the Texas Education Agency, a student is identified as a dropout if the individual is absent without an
approved excuse or documented transfer and does not return to school by the fall of the following school year, or if he
or she completes the school year, but fails to reenroll the following school year (Texas Education Agency, 1996). 27 In order to close the achievement gap, researchers at the Teaching Research Institute at Western Oregon University
argue language support programs like the CAP must be well implemented, not segregated, and sustained for 5-6 years
to achieve results. They suggest even the most effective language support programs can only close half of the
achievement gap in 2-3 years, which suggests dropout rates would not fall immediately, but would be staggered over
time (Teaching Research Institute, 2007).
64
maintain communication with parents of students in the program. This would include serving as a
liaison between students in the program and/or their parents and TDSB staff and community
services as well as facilitating workshops for parents. Third, CAP teachers and education
assistants would need to be trained about issues and needs relating to CAP students. Teachers and
education assistants would also need to be assigned duties and supervised by the CAP
coordinator. Fourth, teacher buy-in would be necessary, as the program requires a change in both
ESL curriculum and classroom instruction; CAP teachers would need to coordinate the
administration of required language proficiency and academic achievement tests for placement
and ongoing monitoring of student progress; compile and maintain a record of achievement for
each student; determine when a student is to be exited from the program; and conduct academic
support programs for CAP students as they transition to the mainstream (Evanston Township
High School, 2009). Fifth, no outside assistance is required. So, there are 4 out 5 CSR
components and administrative ease ranks low.
Cost: In Massachusetts, school districts provide transitional bilingual education programs
for students who do not perform well enough in the regular classroom. For Massachusetts, the
1999-2000 statewide average per student expenditure for transitional bilingual programs is
US$7,566 or CDN$9,35128 (Massachusetts Department of Elementary & Secondary Education,
2001). These costs reflect the time spent in bilingual education only. So, this cost is more than
seventy-five hundred dollars per student per year and cost ranks medium.
Stakeholder acceptability: Past Board meetings indicate majority support for
significantly increasing resources available for English Language Learning (TDSB, 2007b); the
2008-09 Budget Plan sets aside funding for 55 additional ESL teachers to be hired in secondary
schools to support the TDSB‟s large immigrant population (TDSB, 2008i). Trustees have also
considered Chicago Public Schools‟ transitional bilingual education model for English language
28 The exchange rate is US$1 = CDN$1.2360 (Bank of Canada, April 22, 2009).
65
learners (ELLs) at both the elementary and secondary school level; programs where the student‟s
first language is used as the medium of instruction as a bridge to academic success in the English
core curriculum (TDSB, 2007b). Despite increased funding for ESL programs and past
consideration of the proposed model, it is uncertain whether the Board would support a
transitional program specifically targeted at ESC students. Thus, stakeholder acceptability among
TDSB decision-makers ranks medium. As for community stakeholder acceptability, Interviewee
A suggests Black students should be exposed to learning about African culture, but in context of
the entire school board curriculum, which the CAP does not address. Conversely, Black
community education forums have requested targeted support for students whose learning styles
may be considered different, while making learning challenging by developing students‟
creativity and thinking skills. Forums also call for school programs around improving students‟
self esteem by focussing on what Black students do well; and the creation of strong home-school
connections with Black parents, providing opportunities for families to support student learning.
The CAP would address many of these community proposals (TDSB, 2008h). Other community
groups have requested that the TDSB integrate the references and sources of knowledge from all
peoples into all areas of instruction, which the CAP does not resolve. Since only one stakeholder
agrees with the policy direction, community stakeholder acceptability ranks low.
8.3 Option 3: Partner with Pathways to Education to Target ESC
Secondary Students
Effectiveness: Pathways to Education reduced the dropout rate for Regent Park youth in
Toronto from 56 percent to 10 percent between 2001 and 2006. The average gain per year is 9.2
percent. Since this gain is more than 5 percent per year on average, effectiveness ranks high
(Pathways to Education, 2008).29 The dropout reduction in Regent Park has been verified by an
independent third party. In 2007, a pro bono evaluation study was released by the Boston
29 In the TDSB, a student is generally considered to be a dropout, who leaves school without graduating and does not
transfer to another educational institution.
66
Consulting Group (BCG), which confirms that the program had had not only a dramatic result in
reducing the high school drop-out rate in Regent Park, but also helped increase the proportion of
young people attending post-secondary education from 20% to 80%.The BCG study also finds
that Pathways contributed significantly to social cohesion and the integration of immigrants, who
make up 60 per cent of the population of Regent Park, in which 79 per cent of residents are
visible minorities (Pathways to Education, 2007).30
Administrative ease: First, no financial resources need to be realigned within the TDSB
budget. Second, an internal facilitator is required from all participating secondary schools to
provide research data and access to student records to Pathways to Education on an ongoing
basis. Third, initial training would have to be provided to administrative staff on how to gather
student information and regularly submit it to the Pathways program. Fourth, there is no staff
development or teacher buy-in necessary. The program would also have no direct impact on
classroom instruction, but it is expected that student performance would improve. This may
alleviate pressure on teachers and their education assistants. Fifth, outside assistance is required
from Pathways to Education to recruit volunteer tutors and group mentors to provide tutoring and
mentoring to ESC students. Returning or new volunteer tutors and group mentors would need to
register and attend training sessions in September for the following school year. Training may
want to emphasize the specific needs of ESC students and some of the difficulties they face in
secondary school. So, there are 3 out of 5 CSR components and administrative ease ranks
medium.
Cost: The cost per student is approximately $4,000 per year, including immediate
financial assistance, such as bus tickets and a scholarship for post-secondary education (Pathways
30 The yearly dropout gains in Regent Park were confirmed by the Director of Research and Evaluation at Pathways to
Education in a telephone interview on Monday, May 25th, 2009, who indicated the average dropout gain per year for
the first three program cohorts, is just shy of 10 percentage points. However, he noted that recent gains with the newest
program cohort currently hover around 2 percentage points per year, but are inconclusive, since most of this cohort has
yet to complete their secondary school studies.
67
to Education, 2008). ESC students may enroll in the program over 4 years. Still, this cost is less
than seventy-five hundred dollars per year per student and cost ranks high.
Stakeholder acceptability: Past trustee meetings indicate majority support for off-site
alternative programs for at-risk students (18-0 in favour, 3 absent and no vote cast by chair)
(TDSB, 2004). So, this garners majority support and stakeholder acceptability among TDSB
decision-makers ranks high. As for community stakeholder acceptability, Interviewee A suggests
students born in the ESC need to be given proper guidance and support, so that they better
understand their options in school and are given a better opportunity to succeed. Parents also need
to be more involved in their children's education, and be aware of what is required for their
children‟s present and future success, which the Pathways program would help to address. Black
education community forums also call for more after school programs to be offered in all inner
city communities of the TDSB (TDSB, 2008h). Other community groups have called for the
Pathways to Education model to be offered to students in all inner city communities of the TDSB,
which this option does not address. Since two stakeholders agree with the policy direction,
community stakeholder acceptability ranks medium.
Table 21 summarizes the results of the policy analysis, using the three policy options and
established criteria and measures.
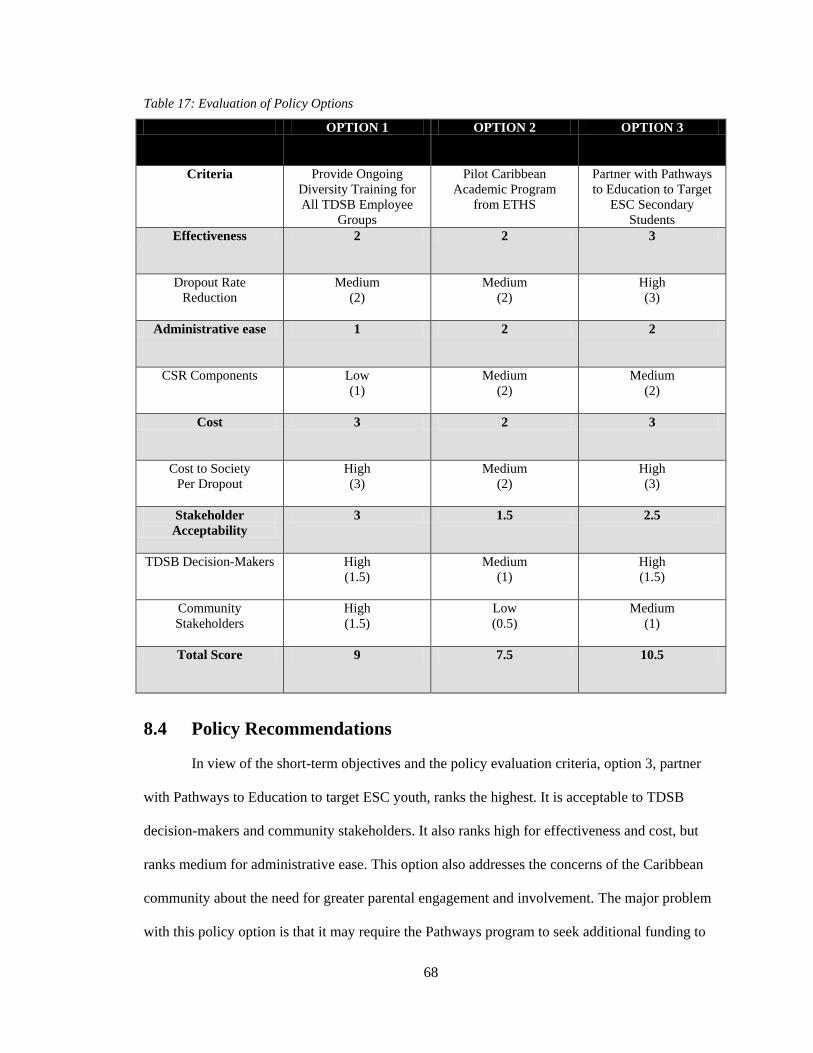
68
Table 17: Evaluation of Policy Options
OPTION 1 OPTION 2 OPTION 3
Criteria Provide Ongoing
Diversity Training for
All TDSB Employee
Groups
Pilot Caribbean
Academic Program
from ETHS
Partner with Pathways
to Education to Target
ESC Secondary
Students
Effectiveness 2 2 3
Dropout Rate
Reduction
Medium
(2)
Medium
(2)
High
(3)
Administrative ease 1 2 2
CSR Components Low
(1)
Medium
(2)
Medium
(2)
Cost 3 2 3
Cost to Society
Per Dropout
High
(3)
Medium
(2)
High
(3)
Stakeholder
Acceptability
3 1.5 2.5
TDSB Decision-Makers High
(1.5)
Medium
(1)
High
(1.5)
Community
Stakeholders
High
(1.5)
Low
(0.5)
Medium
(1)
Total Score 9 7.5 10.5
8.4 Policy Recommendations
In view of the short-term objectives and the policy evaluation criteria, option 3, partner
with Pathways to Education to target ESC youth, ranks the highest. It is acceptable to TDSB
decision-makers and community stakeholders. It also ranks high for effectiveness and cost, but
ranks medium for administrative ease. This option also addresses the concerns of the Caribbean
community about the need for greater parental engagement and involvement. The major problem
with this policy option is that it may require the Pathways program to seek additional funding to
69
target and support ESC students. In this respect, greater financial support from individual donors,
communities, corporations and possibly the provincial government would need to be secured. It
may also take time to recruit and train tutors and mentors to work directly with ESC students.
Option 1, to provide ongoing diversity training for all employee groups, ranks second in
this analysis. The cost of the policy is low and deemed highly acceptable to stakeholders. In terms
of effectiveness, this policy has shown to help lower the dropout rate in other school districts in
North America. However, this policy is difficult to implement, meaning it ranks low for
administrative ease. There could also be resistance from teacher unions with regards to the need
for such training initiatives.
Option 2, the TDSB pilot the CAP to help ESC students succeed in secondary school,
ranks third in this analysis. This option has slightly higher costs than the other options and
therefore ranks medium. It also ranks low for acceptability among TDSB decision-makers,
community stakeholders and other community groups. While the TDSB has increased funding for
ELLs, the TDSB operates under a tight budget and this option requires a realignment of financial
resources within the TDSB‟s current ESL program budget. Changes to the current ESL program
model and staff development would also need to be coordinated and implemented.
Given my analysis, I recommend implementing option 3 immediately. The TDSB should
partner with the Pathways to Education program in order to target ESC students in Toronto‟s
inner city communities. This option would help bridge the gap between Caribbean parents and
TDSB secondary schools, and provide ESC students with the necessary guidance and support
they require. Following implementation, the TDSB should conduct an ongoing evaluation of the
partnership overtime. If necessary, the TDSB may want to introduce some features of option 1,
diversity training for all TDSB employee groups, to further address some of the achievement
gaps. To this end, it is important to note that the Ministry of Education recently announced their
Equity Inclusive Education Strategy, providing $4 million to Ontario school boards to support

70
and promote equity and inclusive education (Ontario Ministry of Education, 2009). This new
funding would potentially assist the TDSB with the diversity training costs.
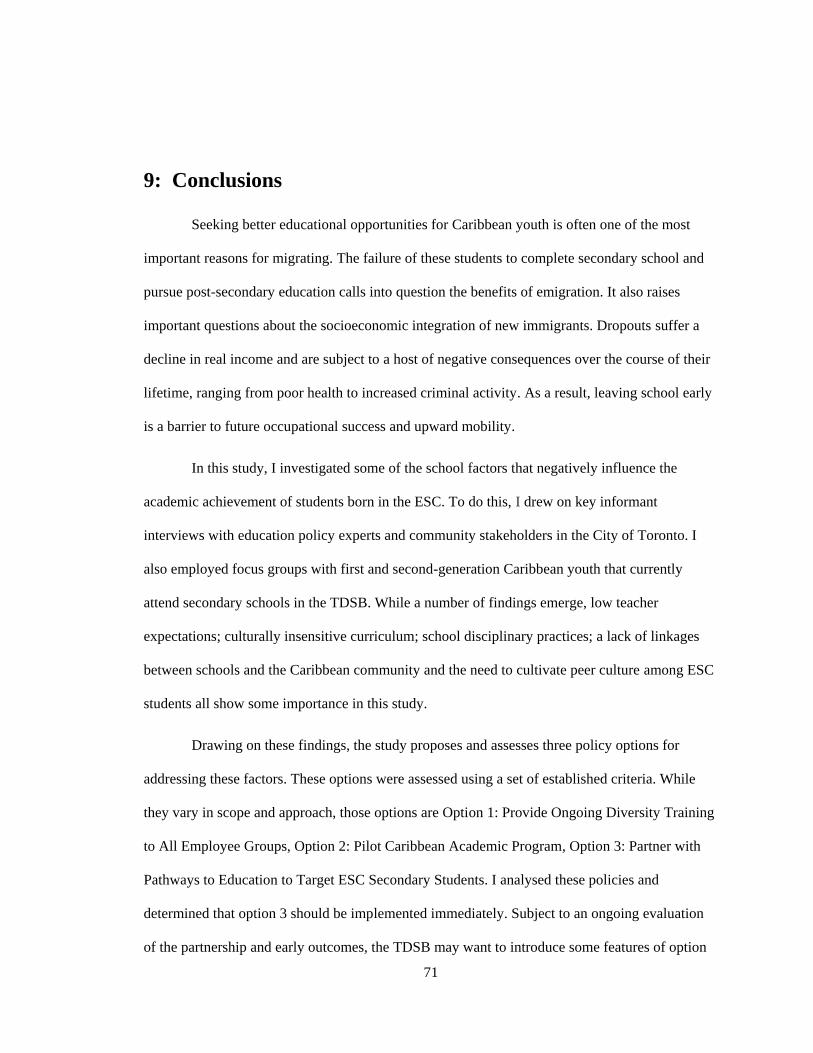
71
9: Conclusions
Seeking better educational opportunities for Caribbean youth is often one of the most
important reasons for migrating. The failure of these students to complete secondary school and
pursue post-secondary education calls into question the benefits of emigration. It also raises
important questions about the socioeconomic integration of new immigrants. Dropouts suffer a
decline in real income and are subject to a host of negative consequences over the course of their
lifetime, ranging from poor health to increased criminal activity. As a result, leaving school early
is a barrier to future occupational success and upward mobility.
In this study, I investigated some of the school factors that negatively influence the
academic achievement of students born in the ESC. To do this, I drew on key informant
interviews with education policy experts and community stakeholders in the City of Toronto. I
also employed focus groups with first and second-generation Caribbean youth that currently
attend secondary schools in the TDSB. While a number of findings emerge, low teacher
expectations; culturally insensitive curriculum; school disciplinary practices; a lack of linkages
between schools and the Caribbean community and the need to cultivate peer culture among ESC
students all show some importance in this study.
Drawing on these findings, the study proposes and assesses three policy options for
addressing these factors. These options were assessed using a set of established criteria. While
they vary in scope and approach, those options are Option 1: Provide Ongoing Diversity Training
to All Employee Groups, Option 2: Pilot Caribbean Academic Program, Option 3: Partner with
Pathways to Education to Target ESC Secondary Students. I analysed these policies and
determined that option 3 should be implemented immediately. Subject to an ongoing evaluation
of the partnership and early outcomes, the TDSB may want to introduce some features of option
72
1, diversity training for all TDSB employee groups, to further address some of the achievement
gaps.
While my research represents a very small contribution to the growing literature on the
Black education experience in Canada, future TDSB research should consider a quantitative study
on how school experiences impact student achievement among students born in the ESC.
Building on this study, the TDSB should employ data from the TDSB‟s 2006 Students Census in
an attempt to establish correlations or causal relationships among different variables such as
school experiences, involvement in extra-curricular activities and post-secondary school plans.

73
Appendices
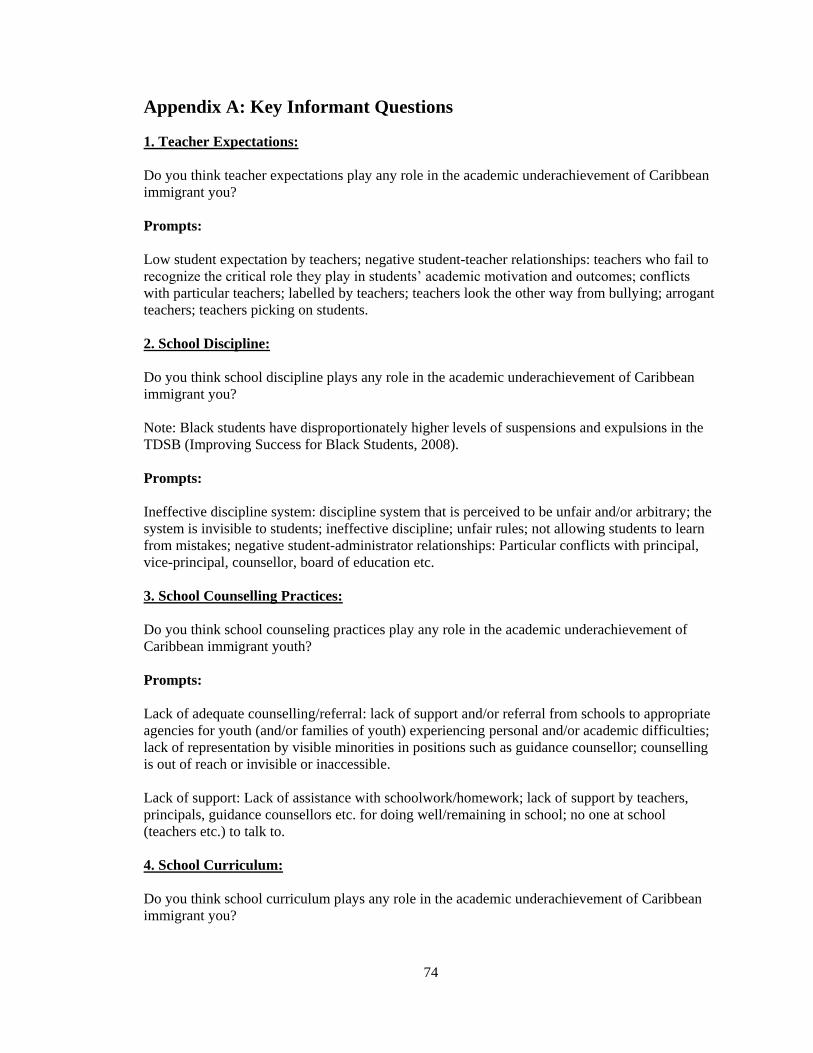
74
Appendix A: Key Informant Questions
1. Teacher Expectations:
Do you think teacher expectations play any role in the academic underachievement of Caribbean
immigrant you?
Prompts:
Low student expectation by teachers; negative student-teacher relationships: teachers who fail to
recognize the critical role they play in students‟ academic motivation and outcomes; conflicts
with particular teachers; labelled by teachers; teachers look the other way from bullying; arrogant
teachers; teachers picking on students.
2. School Discipline:
Do you think school discipline plays any role in the academic underachievement of Caribbean
immigrant you?
Note: Black students have disproportionately higher levels of suspensions and expulsions in the
TDSB (Improving Success for Black Students, 2008).
Prompts:
Ineffective discipline system: discipline system that is perceived to be unfair and/or arbitrary; the
system is invisible to students; ineffective discipline; unfair rules; not allowing students to learn
from mistakes; negative student-administrator relationships: Particular conflicts with principal,
vice-principal, counsellor, board of education etc.
3. School Counselling Practices:
Do you think school counseling practices play any role in the academic underachievement of
Caribbean immigrant youth?
Prompts:
Lack of adequate counselling/referral: lack of support and/or referral from schools to appropriate
agencies for youth (and/or families of youth) experiencing personal and/or academic difficulties;
lack of representation by visible minorities in positions such as guidance counsellor; counselling
is out of reach or invisible or inaccessible.
Lack of support: Lack of assistance with schoolwork/homework; lack of support by teachers,
principals, guidance counsellors etc. for doing well/remaining in school; no one at school
(teachers etc.) to talk to.
4. School Curriculum:
Do you think school curriculum plays any role in the academic underachievement of Caribbean
immigrant you?
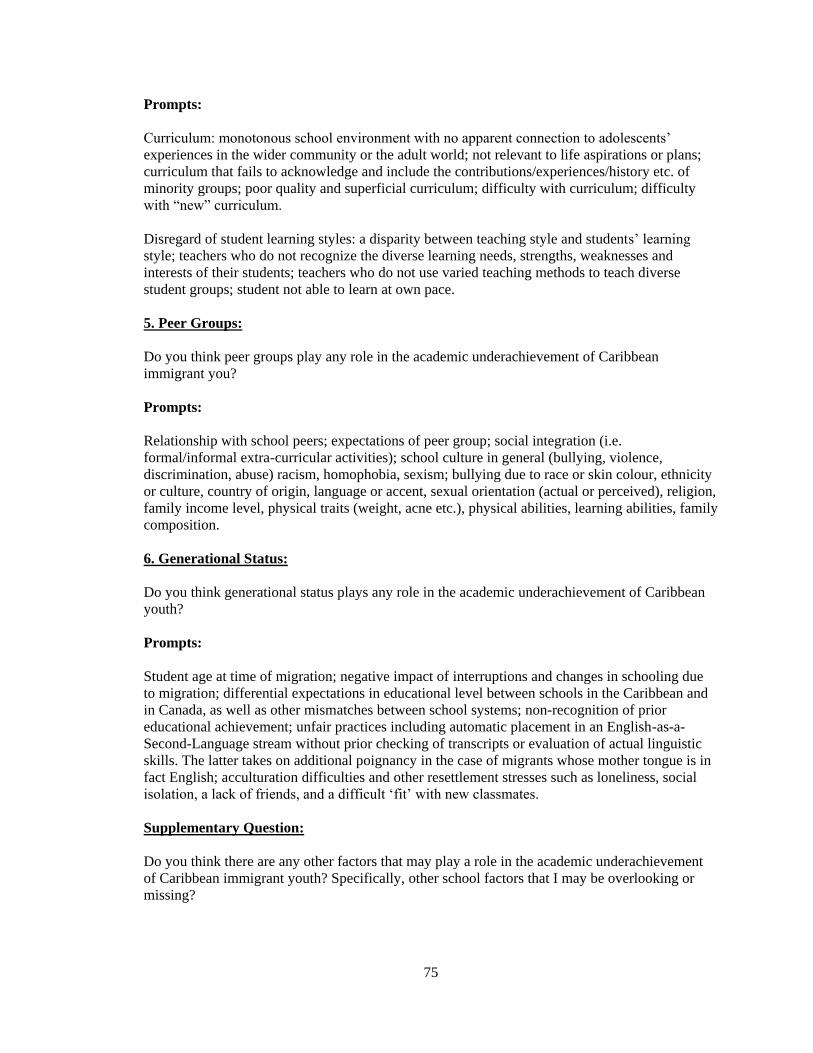
75
Prompts:
Curriculum: monotonous school environment with no apparent connection to adolescents‟
experiences in the wider community or the adult world; not relevant to life aspirations or plans;
curriculum that fails to acknowledge and include the contributions/experiences/history etc. of
minority groups; poor quality and superficial curriculum; difficulty with curriculum; difficulty
with “new” curriculum.
Disregard of student learning styles: a disparity between teaching style and students‟ learning
style; teachers who do not recognize the diverse learning needs, strengths, weaknesses and
interests of their students; teachers who do not use varied teaching methods to teach diverse
student groups; student not able to learn at own pace.
5. Peer Groups:
Do you think peer groups play any role in the academic underachievement of Caribbean
immigrant you?
Prompts:
Relationship with school peers; expectations of peer group; social integration (i.e.
formal/informal extra-curricular activities); school culture in general (bullying, violence,
discrimination, abuse) racism, homophobia, sexism; bullying due to race or skin colour, ethnicity
or culture, country of origin, language or accent, sexual orientation (actual or perceived), religion,
family income level, physical traits (weight, acne etc.), physical abilities, learning abilities, family
composition.
6. Generational Status:
Do you think generational status plays any role in the academic underachievement of Caribbean
youth?
Prompts:
Student age at time of migration; negative impact of interruptions and changes in schooling due
to migration; differential expectations in educational level between schools in the Caribbean and
in Canada, as well as other mismatches between school systems; non-recognition of prior
educational achievement; unfair practices including automatic placement in an English-as-a-
Second-Language stream without prior checking of transcripts or evaluation of actual linguistic
skills. The latter takes on additional poignancy in the case of migrants whose mother tongue is in
fact English; acculturation difficulties and other resettlement stresses such as loneliness, social
isolation, a lack of friends, and a difficult „fit‟ with new classmates.
Supplementary Question:
Do you think there are any other factors that may play a role in the academic underachievement
of Caribbean immigrant youth? Specifically, other school factors that I may be overlooking or
missing?
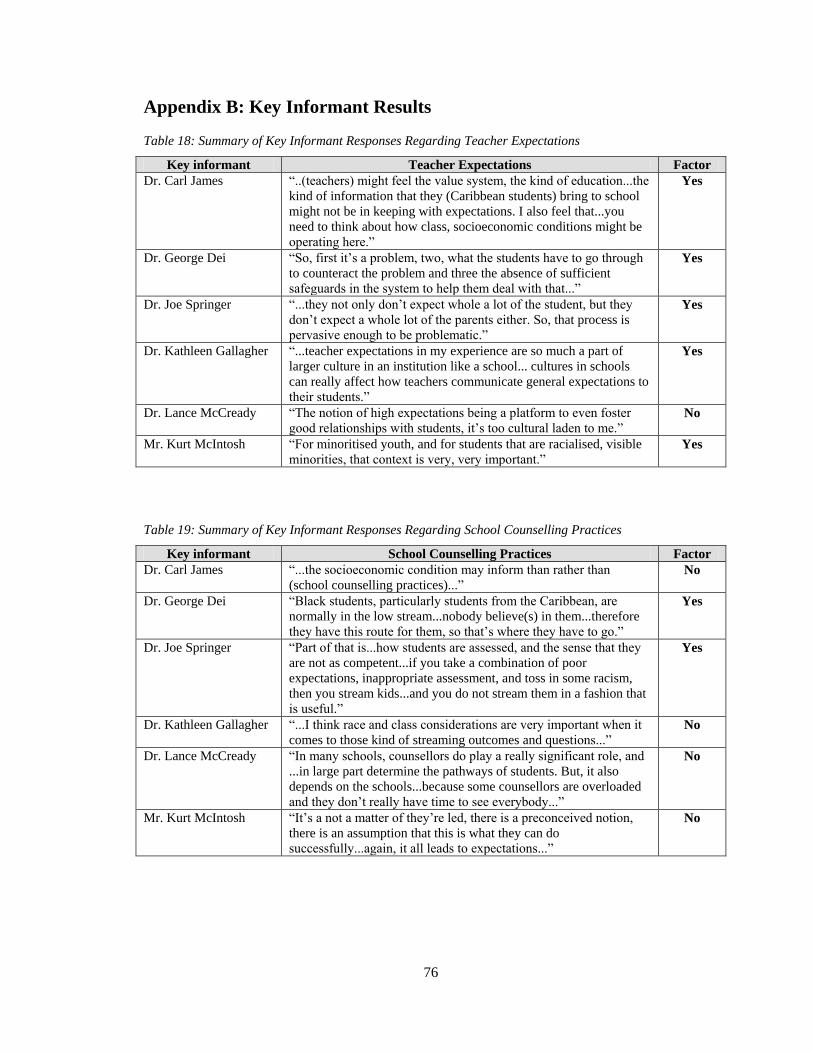
76
Appendix B: Key Informant Results
Table 18: Summary of Key Informant Responses Regarding Teacher Expectations
Key informant Teacher Expectations Factor
Dr. Carl James “..(teachers) might feel the value system, the kind of education...the
kind of information that they (Caribbean students) bring to school
might not be in keeping with expectations. I also feel that...you
need to think about how class, socioeconomic conditions might be
operating here.”
Yes
Dr. George Dei “So, first it‟s a problem, two, what the students have to go through
to counteract the problem and three the absence of sufficient
safeguards in the system to help them deal with that...”
Yes
Dr. Joe Springer “...they not only don‟t expect whole a lot of the student, but they
don‟t expect a whole lot of the parents either. So, that process is
pervasive enough to be problematic.”
Yes
Dr. Kathleen Gallagher
“...teacher expectations in my experience are so much a part of
larger culture in an institution like a school... cultures in schools
can really affect how teachers communicate general expectations to
their students.”
Yes
Dr. Lance McCready “The notion of high expectations being a platform to even foster
good relationships with students, it‟s too cultural laden to me.”
No
Mr. Kurt McIntosh “For minoritised youth, and for students that are racialised, visible
minorities, that context is very, very important.”
Yes
Table 19: Summary of Key Informant Responses Regarding School Counselling Practices
Key informant School Counselling Practices Factor
Dr. Carl James “...the socioeconomic condition may inform than rather than
(school counselling practices)...”
No
Dr. George Dei “Black students, particularly students from the Caribbean, are
normally in the low stream...nobody believe(s) in them...therefore
they have this route for them, so that‟s where they have to go.”
Yes
Dr. Joe Springer “Part of that is...how students are assessed, and the sense that they
are not as competent...if you take a combination of poor
expectations, inappropriate assessment, and toss in some racism,
then you stream kids...and you do not stream them in a fashion that
is useful.”
Yes
Dr. Kathleen Gallagher
“...I think race and class considerations are very important when it
comes to those kind of streaming outcomes and questions...”
No
Dr. Lance McCready “In many schools, counsellors do play a really significant role, and
...in large part determine the pathways of students. But, it also
depends on the schools...because some counsellors are overloaded
and they don‟t really have time to see everybody...”
No
Mr. Kurt McIntosh “It‟s a not a matter of they‟re led, there is a preconceived notion,
there is an assumption that this is what they can do
successfully...again, it all leads to expectations...”
No
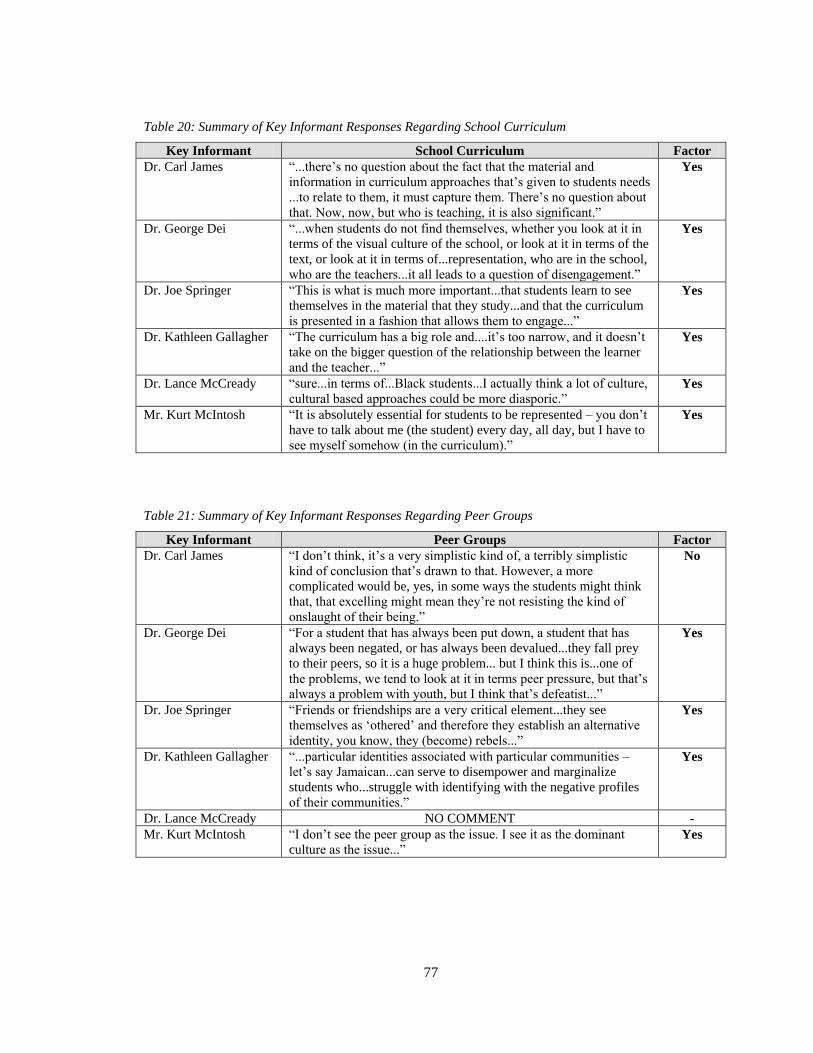
77
Table 20: Summary of Key Informant Responses Regarding School Curriculum
Key Informant School Curriculum Factor
Dr. Carl James “...there‟s no question about the fact that the material and
information in curriculum approaches that‟s given to students needs
...to relate to them, it must capture them. There‟s no question about
that. Now, now, but who is teaching, it is also significant.”
Yes
Dr. George Dei “...when students do not find themselves, whether you look at it in
terms of the visual culture of the school, or look at it in terms of the
text, or look at it in terms of...representation, who are in the school,
who are the teachers...it all leads to a question of disengagement.”
Yes
Dr. Joe Springer “This is what is much more important...that students learn to see
themselves in the material that they study...and that the curriculum
is presented in a fashion that allows them to engage...”
Yes
Dr. Kathleen Gallagher
“The curriculum has a big role and....it‟s too narrow, and it doesn‟t
take on the bigger question of the relationship between the learner
and the teacher...”
Yes
Dr. Lance McCready “sure...in terms of...Black students...I actually think a lot of culture,
cultural based approaches could be more diasporic.”
Yes
Mr. Kurt McIntosh “It is absolutely essential for students to be represented – you don‟t
have to talk about me (the student) every day, all day, but I have to
see myself somehow (in the curriculum).”
Yes
Table 21: Summary of Key Informant Responses Regarding Peer Groups
Key Informant Peer Groups Factor
Dr. Carl James “I don‟t think, it‟s a very simplistic kind of, a terribly simplistic
kind of conclusion that‟s drawn to that. However, a more
complicated would be, yes, in some ways the students might think
that, that excelling might mean they‟re not resisting the kind of
onslaught of their being.”
No
Dr. George Dei “For a student that has always been put down, a student that has
always been negated, or has always been devalued...they fall prey
to their peers, so it is a huge problem... but I think this is...one of
the problems, we tend to look at it in terms peer pressure, but that‟s
always a problem with youth, but I think that‟s defeatist...”
Yes
Dr. Joe Springer “Friends or friendships are a very critical element...they see
themselves as „othered‟ and therefore they establish an alternative
identity, you know, they (become) rebels...”
Yes
Dr. Kathleen Gallagher
“...particular identities associated with particular communities –
let‟s say Jamaican...can serve to disempower and marginalize
students who...struggle with identifying with the negative profiles
of their communities.”
Yes
Dr. Lance McCready NO COMMENT -
Mr. Kurt McIntosh “I don‟t see the peer group as the issue. I see it as the dominant
culture as the issue...” Yes
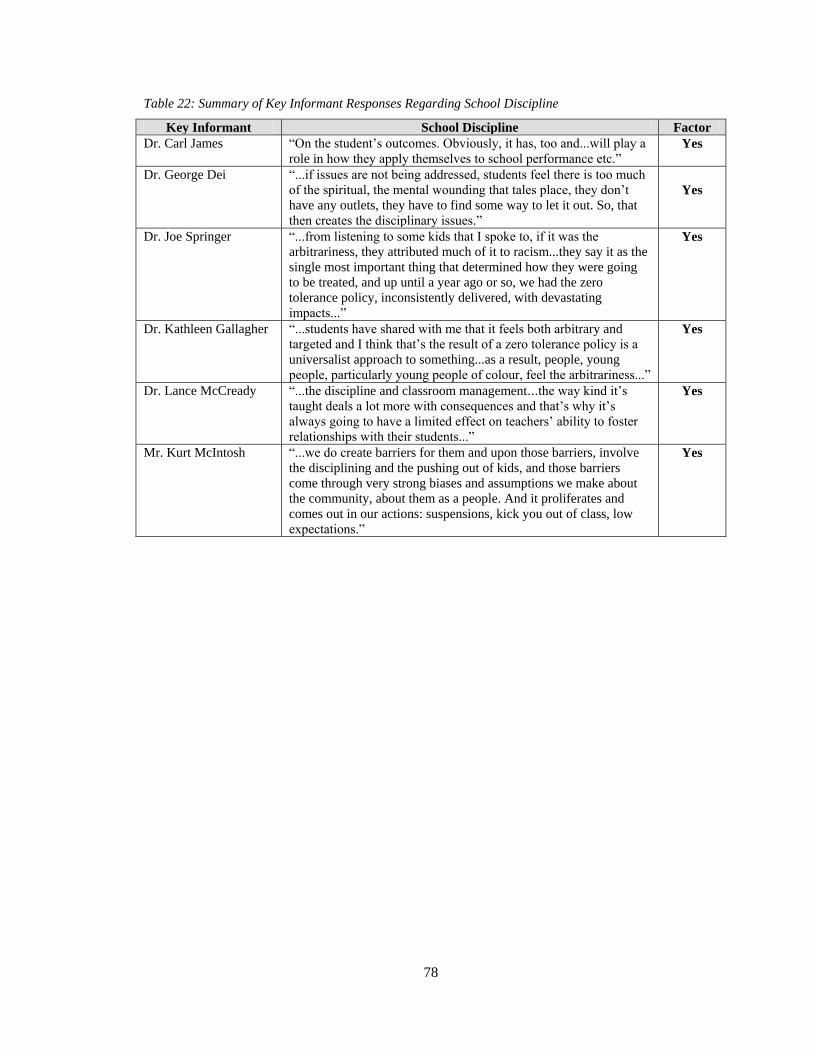
78
Table 22: Summary of Key Informant Responses Regarding School Discipline
Key Informant School Discipline Factor
Dr. Carl James “On the student‟s outcomes. Obviously, it has, too and...will play a
role in how they apply themselves to school performance etc.”
Yes
Dr. George Dei “...if issues are not being addressed, students feel there is too much
of the spiritual, the mental wounding that tales place, they don‟t
have any outlets, they have to find some way to let it out. So, that
then creates the disciplinary issues.”
Yes
Dr. Joe Springer “...from listening to some kids that I spoke to, if it was the
arbitrariness, they attributed much of it to racism...they say it as the
single most important thing that determined how they were going
to be treated, and up until a year ago or so, we had the zero
tolerance policy, inconsistently delivered, with devastating
impacts...”
Yes
Dr. Kathleen Gallagher
“...students have shared with me that it feels both arbitrary and
targeted and I think that‟s the result of a zero tolerance policy is a
universalist approach to something...as a result, people, young
people, particularly young people of colour, feel the arbitrariness...”
Yes
Dr. Lance McCready “...the discipline and classroom management...the way kind it‟s
taught deals a lot more with consequences and that‟s why it‟s
always going to have a limited effect on teachers‟ ability to foster
relationships with their students...”
Yes
Mr. Kurt McIntosh “...we do create barriers for them and upon those barriers, involve
the disciplining and the pushing out of kids, and those barriers
come through very strong biases and assumptions we make about
the community, about them as a people. And it proliferates and
comes out in our actions: suspensions, kick you out of class, low
expectations.”
Yes
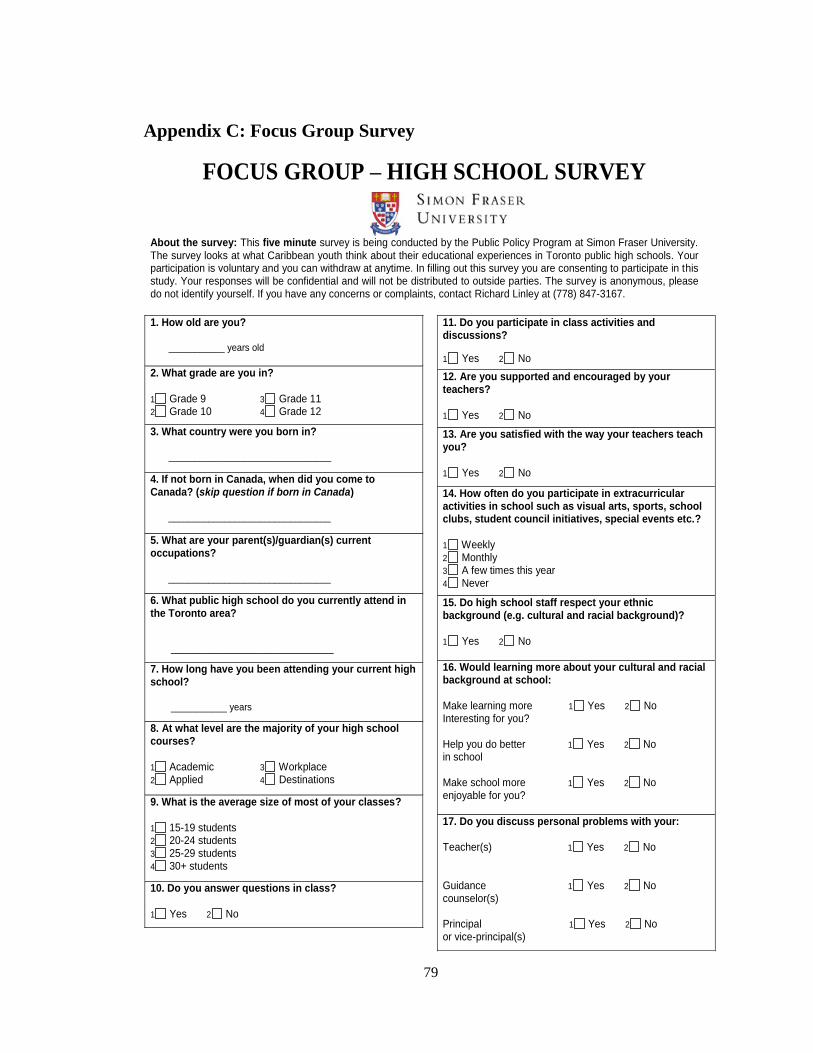
79
Appendix C: Focus Group Survey
About the survey: This five minute survey is being conducted by the Public Policy Program at Simon Fraser University. The survey looks at what Caribbean youth think about their educational experiences in Toronto public high schools. Your participation is voluntary and you can withdraw at anytime. In filling out this survey you are consenting to participate in this study. Your responses will be confidential and will not be distributed to outside parties. The survey is anonymous, please do not identify yourself. If you have any concerns or complaints, contact Richard Linley at (778) 847-3167. 1. How old are you?
___________ years old
2. What grade are you in? 1 Grade 9 3 Grade 11 2 Grade 10 4 Grade 12
3. What country were you born in? ________________________________
4. If not born in Canada, when did you come to Canada? (skip question if born in Canada) ________________________________
5. What are your parent(s)/guardian(s) current occupations? ________________________________
6. What public high school do you currently attend in the Toronto area?
________________________________
7. How long have you been attending your current high school?
___________ years
8. At what level are the majority of your high school courses? 1 Academic 3 Workplace 2 Applied 4 Destinations
9. What is the average size of most of your classes? 1 15-19 students 2 20-24 students 3 25-29 students 4 30+ students
10. Do you answer questions in class? 1 Yes 2 No
11. Do you participate in class activities and discussions? 1 Yes 2 No 12. Are you supported and encouraged by your teachers? 1 Yes 2 No
13. Are you satisfied with the way your teachers teach you? 1 Yes 2 No
14. How often do you participate in extracurricular activities in school such as visual arts, sports, school clubs, student council initiatives, special events etc.? 1 Weekly 2 Monthly 3 A few times this year 4 Never
15. Do high school staff respect your ethnic background (e.g. cultural and racial background)? 1 Yes 2 No 16. Would learning more about your cultural and racial background at school: Make learning more 1 Yes 2 No Interesting for you? Help you do better 1 Yes 2 No in school Make school more 1 Yes 2 No enjoyable for you? 17. Do you discuss personal problems with your: Teacher(s) 1 Yes 2 No Guidance 1 Yes 2 No counselor(s) Principal 1 Yes 2 No or vice-principal(s)
FOCUS GROUP – HIGH SCHOOL SURVEY
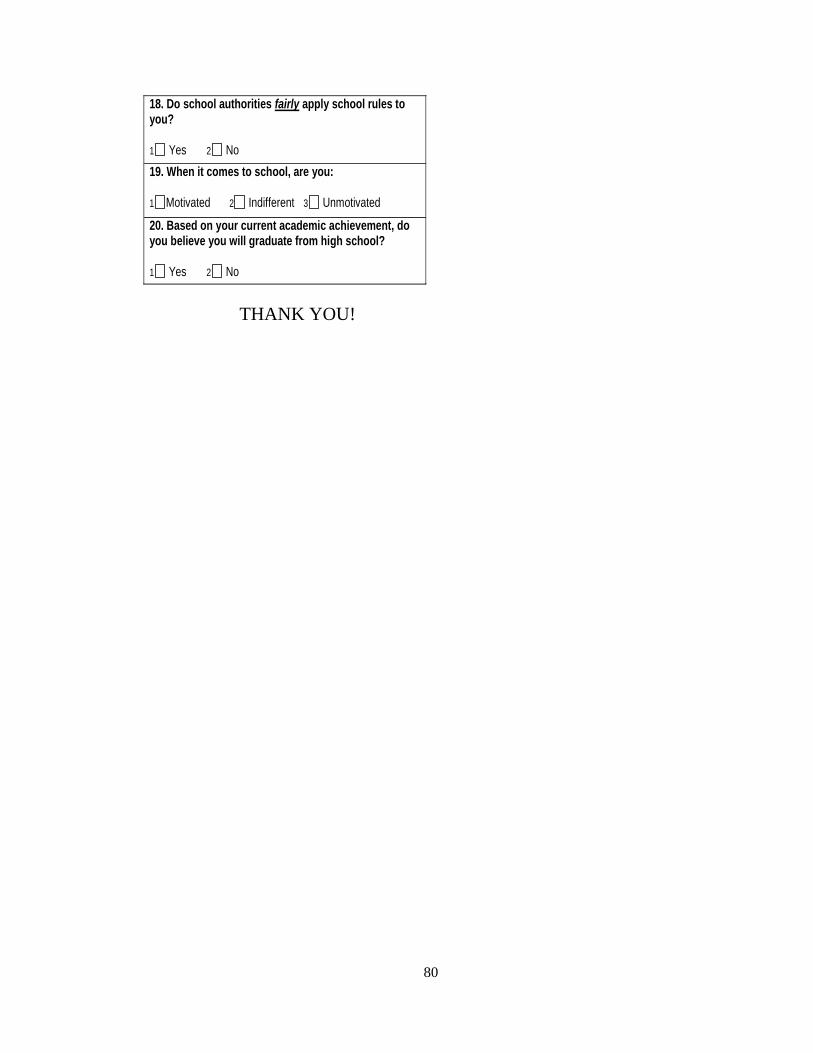
80
18. Do school authorities fairly apply school rules to you? 1 Yes 2 No 19. When it comes to school, are you: 1 Motivated 2 Indifferent 3 Unmotivated
20. Based on your current academic achievement, do you believe you will graduate from high school? 1 Yes 2 No
THANK YOU!
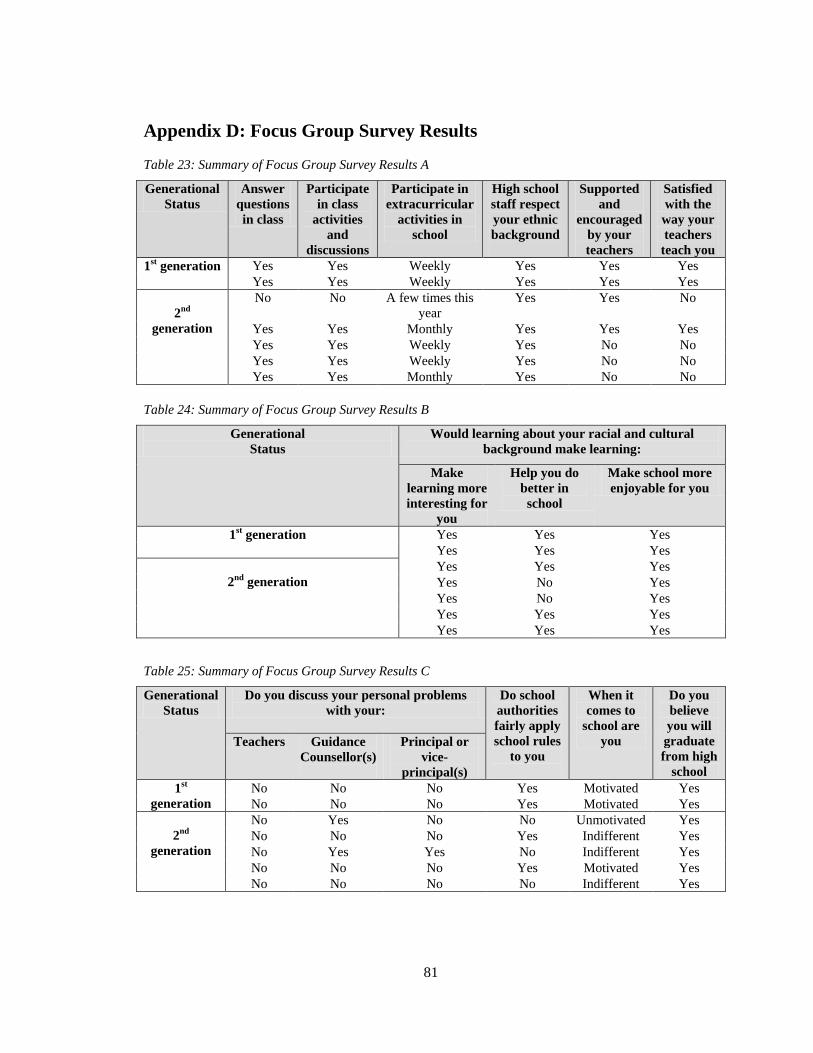
81
Appendix D: Focus Group Survey Results
Table 23: Summary of Focus Group Survey Results A
Generational
Status
Answer
questions
in class
Participate
in class
activities
and
discussions
Participate in
extracurricular
activities in
school
High school
staff respect
your ethnic
background
Supported
and
encouraged
by your
teachers
Satisfied
with the
way your
teachers
teach you
1st generation Yes Yes Weekly Yes Yes Yes
Yes Yes Weekly Yes Yes Yes
2nd
generation
No No A few times this
year
Yes Yes No
Yes Yes Monthly Yes Yes Yes
Yes Yes Weekly Yes No No
Yes Yes Weekly Yes No No
Yes Yes Monthly Yes No No
Table 24: Summary of Focus Group Survey Results B
Generational
Status
Would learning about your racial and cultural
background make learning:
Make
learning more
interesting for
you
Help you do
better in
school
Make school more
enjoyable for you
1st generation Yes Yes Yes
Yes Yes Yes
2nd
generation
Yes Yes Yes
Yes No Yes
Yes No Yes
Yes Yes Yes
Yes Yes Yes
Table 25: Summary of Focus Group Survey Results C
Generational
Status
Do you discuss your personal problems
with your:
Do school
authorities
fairly apply
school rules
to you
When it
comes to
school are
you
Do you
believe
you will
graduate
from high
school
Teachers Guidance
Counsellor(s)
Principal or
vice-
principal(s)
1st
generation
No No No Yes Motivated Yes
No No No Yes Motivated Yes
2nd
generation
No Yes No No Unmotivated Yes
No No No Yes Indifferent Yes
No Yes Yes No Indifferent Yes
No No No Yes Motivated Yes
No No No No Indifferent Yes

82
Appendix E: Focus Group Questions
1. Fair/respectful treatment of you
How are you treated at school? How do people see you?
Do you feel school staff respect your racial and cultural background?
2. Expectations of teachers, principal, guidance counsellors and other school staff
Do feel like your teachers and other school authorities expect you to succeed in school?
3. Relationship with teachers
How do you get along with your teachers?
Do you feel comfortable discussing personal problems with your teachers?
Are any of your teachers role models? Why? Why not?
4. School counsellor academic planning practices/reliance on guidance counsellors
Whom do you discuss any problems you have at school with?
What do you know about the roles and responsibilities of your school's guidance counsellors?
How often do you see a guidance counsellor?
Do you feel comfortable seeking advice and discussing your personal problems with your
guidance counsellors?
5. Interest in course material (amount/kind of curriculum)
Does the school offer courses that you need?
How do you feel about the teaching materials and school texts studied at school?
Does the material interest you?
Do you feel people of different backgrounds are represented in your school material?
6. School curriculum – representative of race and culture
Would learning be more enjoyable or interesting if you learned more about your racial and
cultural background at school?
7. Ability to follow curricular demands (keep up with lesson & homework)
How willing are you to seek extra help available at school when you need it?
8. Willingness to seek help when needed
Do you find your school workload demanding or challenging? Or, is it not demanding enough?
9. Discipline
Would you say that you are treated fairly at school by the authorities?
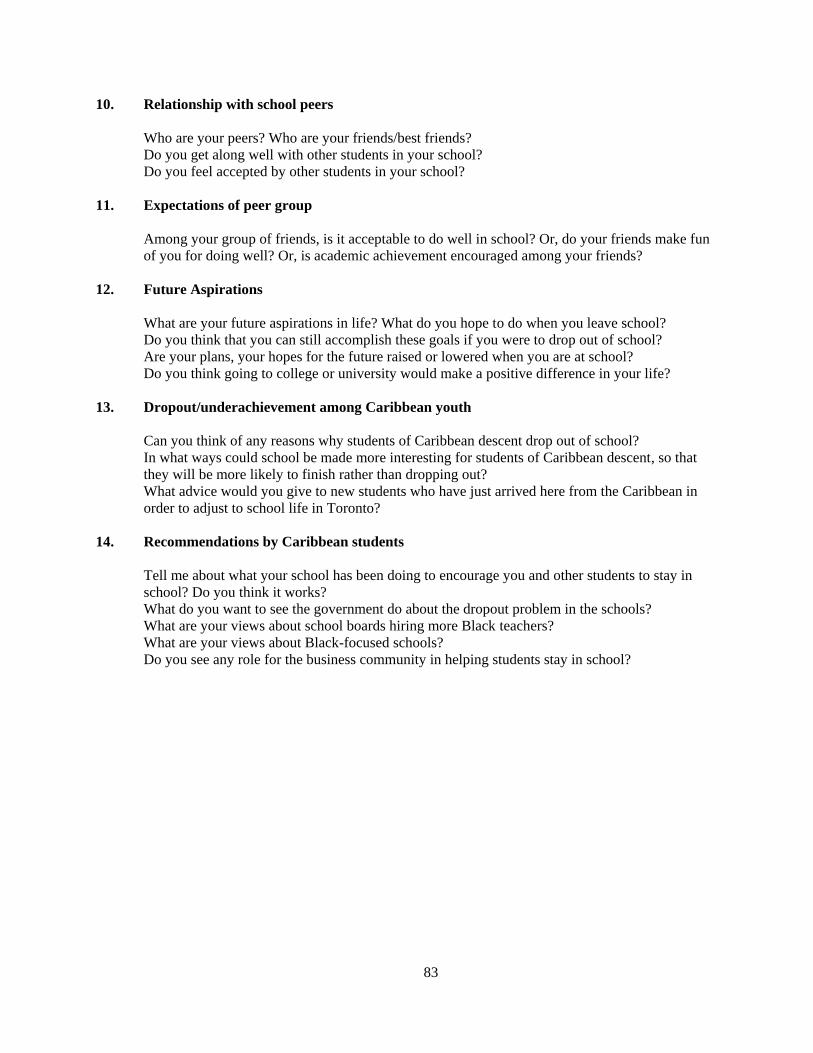
83
10. Relationship with school peers
Who are your peers? Who are your friends/best friends?
Do you get along well with other students in your school?
Do you feel accepted by other students in your school?
11. Expectations of peer group
Among your group of friends, is it acceptable to do well in school? Or, do your friends make fun
of you for doing well? Or, is academic achievement encouraged among your friends?
12. Future Aspirations
What are your future aspirations in life? What do you hope to do when you leave school?
Do you think that you can still accomplish these goals if you were to drop out of school?
Are your plans, your hopes for the future raised or lowered when you are at school?
Do you think going to college or university would make a positive difference in your life?
13. Dropout/underachievement among Caribbean youth
Can you think of any reasons why students of Caribbean descent drop out of school?
In what ways could school be made more interesting for students of Caribbean descent, so that
they will be more likely to finish rather than dropping out?
What advice would you give to new students who have just arrived here from the Caribbean in
order to adjust to school life in Toronto?
14. Recommendations by Caribbean students
Tell me about what your school has been doing to encourage you and other students to stay in
school? Do you think it works?
What do you want to see the government do about the dropout problem in the schools?
What are your views about school boards hiring more Black teachers?
What are your views about Black-focused schools?
Do you see any role for the business community in helping students stay in school?
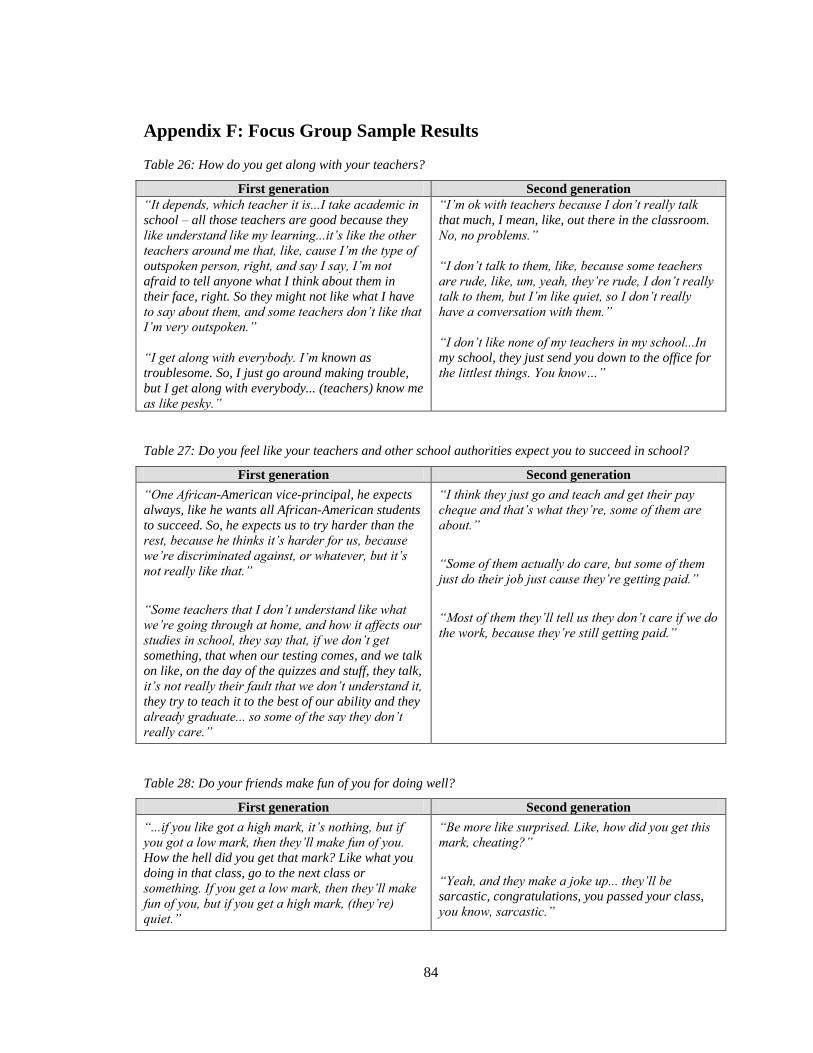
84
Appendix F: Focus Group Sample Results
Table 26: How do you get along with your teachers?
First generation Second generation
“It depends, which teacher it is...I take academic in
school – all those teachers are good because they
like understand like my learning...it‟s like the other
teachers around me that, like, cause I‟m the type of
outspoken person, right, and say I say, I‟m not
afraid to tell anyone what I think about them in
their face, right. So they might not like what I have
to say about them, and some teachers don‟t like that
I‟m very outspoken.”
“I get along with everybody. I‟m known as
troublesome. So, I just go around making trouble,
but I get along with everybody... (teachers) know me
as like pesky.”
“I‟m ok with teachers because I don‟t really talk
that much, I mean, like, out there in the classroom.
No, no problems.”
“I don‟t talk to them, like, because some teachers
are rude, like, um, yeah, they‟re rude, I don‟t really
talk to them, but I‟m like quiet, so I don‟t really
have a conversation with them.”
“I don‟t like none of my teachers in my school...In
my school, they just send you down to the office for
the littlest things. You know…”
Table 27: Do you feel like your teachers and other school authorities expect you to succeed in school?
First generation Second generation
“One African-American vice-principal, he expects
always, like he wants all African-American students
to succeed. So, he expects us to try harder than the
rest, because he thinks it‟s harder for us, because
we‟re discriminated against, or whatever, but it‟s
not really like that.”
“Some teachers that I don‟t understand like what
we‟re going through at home, and how it affects our
studies in school, they say that, if we don‟t get
something, that when our testing comes, and we talk
on like, on the day of the quizzes and stuff, they talk,
it‟s not really their fault that we don‟t understand it,
they try to teach it to the best of our ability and they
already graduate... so some of the say they don‟t
really care.”
“I think they just go and teach and get their pay
cheque and that‟s what they‟re, some of them are
about.”
“Some of them actually do care, but some of them
just do their job just cause they‟re getting paid.”
“Most of them they‟ll tell us they don‟t care if we do
the work, because they‟re still getting paid.”
Table 28: Do your friends make fun of you for doing well?
First generation Second generation
“...if you like got a high mark, it‟s nothing, but if
you got a low mark, then they‟ll make fun of you.
How the hell did you get that mark? Like what you
doing in that class, go to the next class or
something. If you get a low mark, then they‟ll make
fun of you, but if you get a high mark, (they‟re)
quiet.”
“Be more like surprised. Like, how did you get this
mark, cheating?”
“Yeah, and they make a joke up... they‟ll be
sarcastic, congratulations, you passed your class,
you know, sarcastic.”
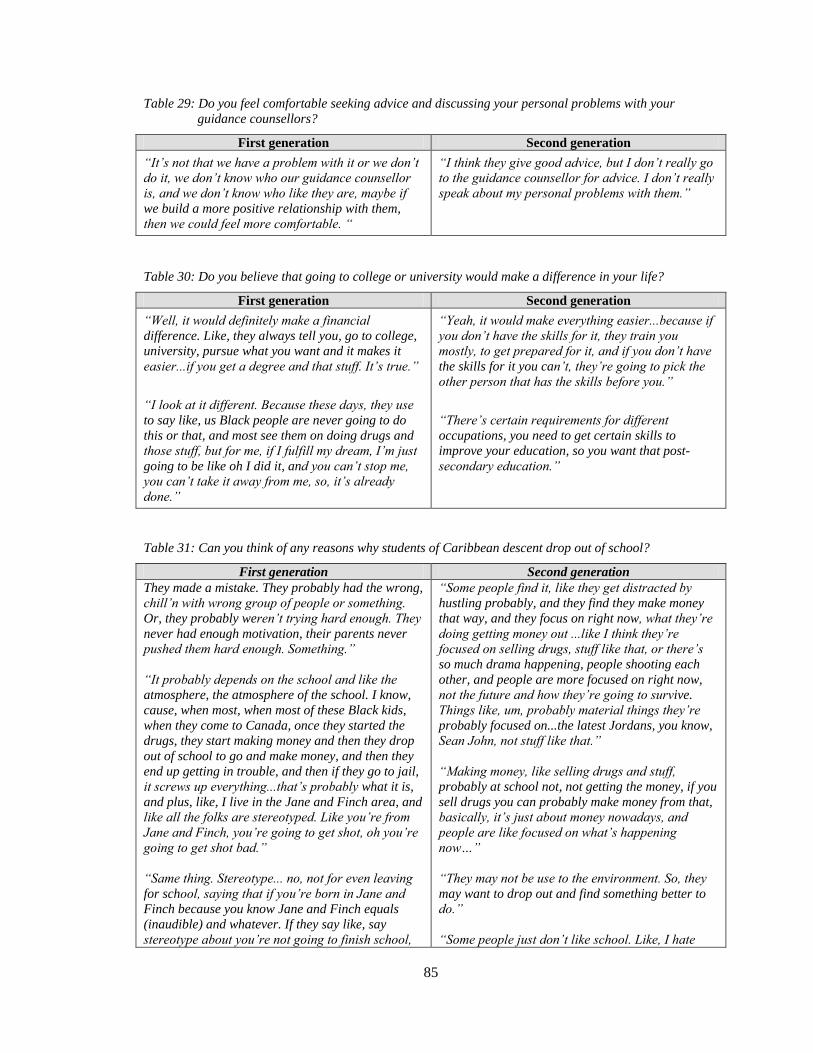
85
Table 29: Do you feel comfortable seeking advice and discussing your personal problems with your
guidance counsellors?
First generation Second generation
“It‟s not that we have a problem with it or we don‟t
do it, we don‟t know who our guidance counsellor
is, and we don‟t know who like they are, maybe if
we build a more positive relationship with them,
then we could feel more comfortable. “
“I think they give good advice, but I don‟t really go
to the guidance counsellor for advice. I don‟t really
speak about my personal problems with them.”
Table 30: Do you believe that going to college or university would make a difference in your life?
First generation Second generation
“Well, it would definitely make a financial
difference. Like, they always tell you, go to college,
university, pursue what you want and it makes it
easier...if you get a degree and that stuff. It‟s true.”
“I look at it different. Because these days, they use
to say like, us Black people are never going to do
this or that, and most see them on doing drugs and
those stuff, but for me, if I fulfill my dream, I‟m just
going to be like oh I did it, and you can‟t stop me,
you can‟t take it away from me, so, it‟s already
done.”
“Yeah, it would make everything easier...because if
you don‟t have the skills for it, they train you
mostly, to get prepared for it, and if you don‟t have
the skills for it you can‟t, they‟re going to pick the
other person that has the skills before you.”
“There‟s certain requirements for different
occupations, you need to get certain skills to
improve your education, so you want that post-
secondary education.”
Table 31: Can you think of any reasons why students of Caribbean descent drop out of school?
First generation Second generation
They made a mistake. They probably had the wrong,
chill‟n with wrong group of people or something.
Or, they probably weren‟t trying hard enough. They
never had enough motivation, their parents never
pushed them hard enough. Something.”
“It probably depends on the school and like the
atmosphere, the atmosphere of the school. I know,
cause, when most, when most of these Black kids,
when they come to Canada, once they started the
drugs, they start making money and then they drop
out of school to go and make money, and then they
end up getting in trouble, and then if they go to jail,
it screws up everything...that‟s probably what it is,
and plus, like, I live in the Jane and Finch area, and
like all the folks are stereotyped. Like you‟re from
Jane and Finch, you‟re going to get shot, oh you‟re
going to get shot bad.”
“Same thing. Stereotype... no, not for even leaving
for school, saying that if you‟re born in Jane and
Finch because you know Jane and Finch equals
(inaudible) and whatever. If they say like, say
stereotype about you‟re not going to finish school,
“Some people find it, like they get distracted by
hustling probably, and they find they make money
that way, and they focus on right now, what they‟re
doing getting money out ...like I think they‟re
focused on selling drugs, stuff like that, or there‟s
so much drama happening, people shooting each
other, and people are more focused on right now,
not the future and how they‟re going to survive.
Things like, um, probably material things they‟re
probably focused on...the latest Jordans, you know,
Sean John, not stuff like that.”
“Making money, like selling drugs and stuff,
probably at school not, not getting the money, if you
sell drugs you can probably make money from that,
basically, it‟s just about money nowadays, and
people are like focused on what‟s happening
now…”
“They may not be use to the environment. So, they
may want to drop out and find something better to
do.”
“Some people just don‟t like school. Like, I hate
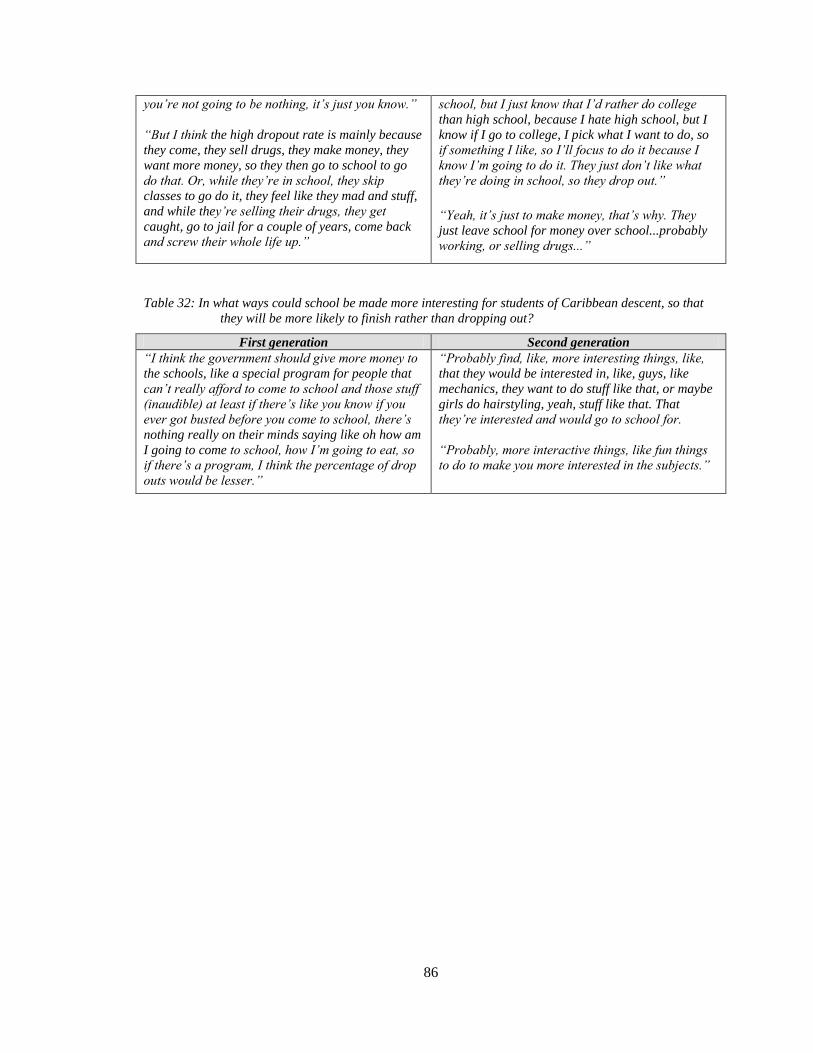
86
you‟re not going to be nothing, it‟s just you know.”
“But I think the high dropout rate is mainly because
they come, they sell drugs, they make money, they
want more money, so they then go to school to go
do that. Or, while they‟re in school, they skip
classes to go do it, they feel like they mad and stuff,
and while they‟re selling their drugs, they get
caught, go to jail for a couple of years, come back
and screw their whole life up.”
school, but I just know that I‟d rather do college
than high school, because I hate high school, but I
know if I go to college, I pick what I want to do, so
if something I like, so I‟ll focus to do it because I
know I‟m going to do it. They just don‟t like what
they‟re doing in school, so they drop out.”
“Yeah, it‟s just to make money, that‟s why. They
just leave school for money over school...probably
working, or selling drugs...”
Table 32: In what ways could school be made more interesting for students of Caribbean descent, so that
they will be more likely to finish rather than dropping out?
First generation Second generation
“I think the government should give more money to
the schools, like a special program for people that
can‟t really afford to come to school and those stuff
(inaudible) at least if there‟s like you know if you
ever got busted before you come to school, there‟s
nothing really on their minds saying like oh how am
I going to come to school, how I‟m going to eat, so
if there‟s a program, I think the percentage of drop
outs would be lesser.”
“Probably find, like, more interesting things, like,
that they would be interested in, like, guys, like
mechanics, they want to do stuff like that, or maybe
girls do hairstyling, yeah, stuff like that. That
they‟re interested and would go to school for.
“Probably, more interactive things, like fun things
to do to make you more interested in the subjects.”
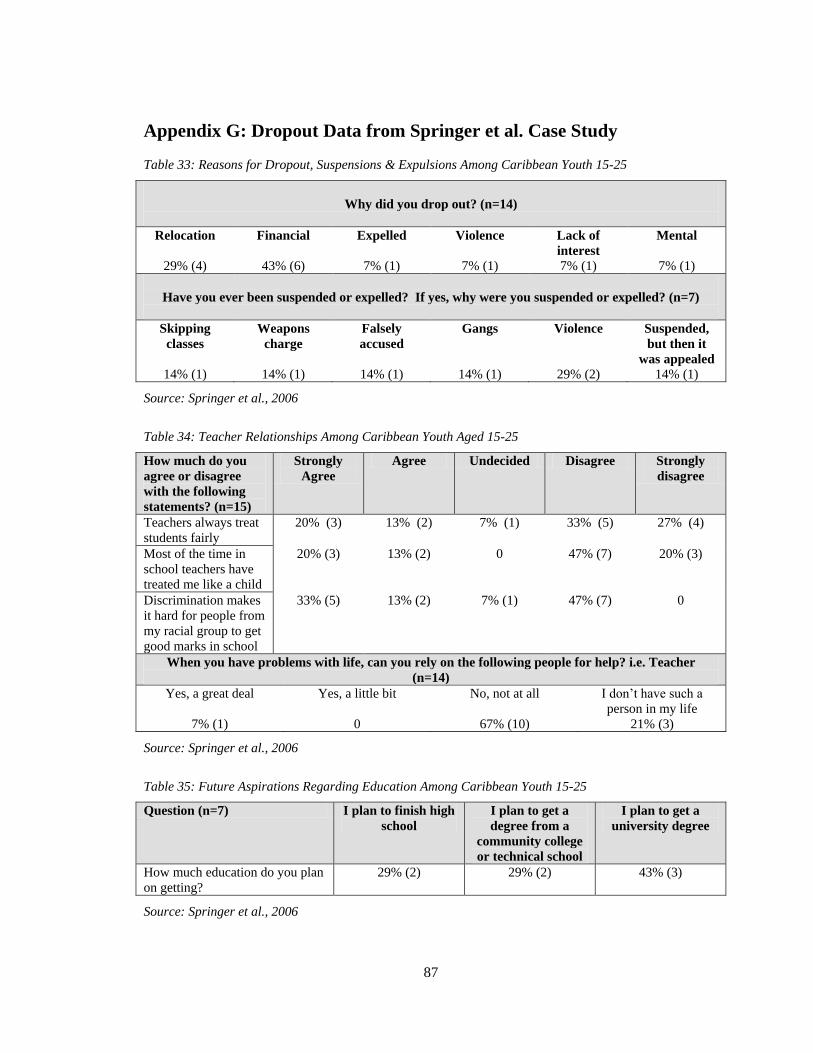
87
Appendix G: Dropout Data from Springer et al. Case Study
Table 33: Reasons for Dropout, Suspensions & Expulsions Among Caribbean Youth 15-25
Why did you drop out? (n=14)
Relocation Financial Expelled Violence Lack of
interest
Mental
29% (4) 43% (6) 7% (1) 7% (1) 7% (1) 7% (1)
Have you ever been suspended or expelled? If yes, why were you suspended or expelled? (n=7)
Skipping
classes
Weapons
charge
Falsely
accused
Gangs Violence Suspended,
but then it
was appealed
14% (1) 14% (1) 14% (1) 14% (1) 29% (2) 14% (1)
Source: Springer et al., 2006
Table 34: Teacher Relationships Among Caribbean Youth Aged 15-25
How much do you
agree or disagree
with the following
statements? (n=15)
Strongly
Agree
Agree Undecided Disagree Strongly
disagree
Teachers always treat
students fairly
20% (3) 13% (2) 7% (1) 33% (5) 27% (4)
Most of the time in
school teachers have
treated me like a child
20% (3) 13% (2) 0 47% (7) 20% (3)
Discrimination makes
it hard for people from
my racial group to get
good marks in school
33% (5) 13% (2) 7% (1) 47% (7) 0
When you have problems with life, can you rely on the following people for help? i.e. Teacher
(n=14)
Yes, a great deal Yes, a little bit No, not at all I don‟t have such a
person in my life
7% (1) 0 67% (10) 21% (3)
Source: Springer et al., 2006
Table 35: Future Aspirations Regarding Education Among Caribbean Youth 15-25
Question (n=7) I plan to finish high
school
I plan to get a
degree from a
community college
or technical school
I plan to get a
university degree
How much education do you plan
on getting?
29% (2) 29% (2) 43% (3)
Source: Springer et al., 2006
88
Bibliography
Alexander, K. L., Natriello, G., & Pallas, A.M. (1985). For whom the school bell tolls: The
impact of dropping out on cognitive performance. American Sociological Review, 50,
409-420.
Anderson, W.W. & Grant, R.W. (1987). The New Newcomers: Patterns of Adjustment of West
Indian Children in Metropolitan Toronto Schools. Toronto: Canadian Scholars‟ Press.
Angrist, J.D., and Lang, K. 2004. “Does School Integration Generate Peer Effects?
Evidence from Boston‟s Metco Program.” American Economic Review 94, no.5:1613-
1634.
Anisef, P., Brown, R.S., Phythian, K., Sweet, R. & Walters, D. (2008). Early School Leaving
Among Immigrants in Toronto Secondary Schools. The Ontario Metropolis Centre,
CERIS Working Paper No. 67.
Asanova, J. (2008). Educating Ethnic Minority Children: The Case of Canada. The Education of
Diverse Student Populations (Book), 2, 65-77.
Barro, R.J. & Lee, J.W. (2000). International Data on Educational Attainment: Updates and
Implications. Center for International Development at Harvard University, Working
Paper No. 42.
Brown, July 19th, 2006, “Making blacks feel at home at school; Program designed to boost marks
includes math unit on racial profiling”, The Toronto Star, Retrieved on March 25, 2009.
Brown, Robert S. & Doc, Ed., April 2006, “The TDSB Grade 9 Cohort Study: A Five-Year
Analysis, 2000-2005.” The Toronto District School Board, Retrieved on January 12,
2009.
Carr, P. & Klassen, T. (1997). Different perceptions of race in education: Racial minority and
White teachers. Canadian Journal of Education, 22 (1), 67-81
Cassity, J. & Harris, S. (2000). Parents of ESL Students: A Study of Parental Involvement.
National Association of Secondary School Principals Bulletin, 84, 55, 55-62.
Codjoe, H.M. (2001). Fighting a „Public Enemy‟ of Black Academic Achievement – the
persistence of racism and the schooling experiences of Black students in Canada, Race
Ethnicity and Education, 4 (4), 343-375.
Coelho, E. 1988, Caribbean Students in Canadian Schools – Book 1, Toronto: Carib-Can
Publishers.
Cooley, J. 2008. “Desegregation and the Performance Gap: Do Diverse Peers Help?”
Wisconsin Center for Education Research, University of Wisconsin, Madison. WCER
Working Paper 2008-7.
89
Cummins, J. (1980). “Psychological Assessment of Minority Language Students.” In R. J.
Samuda, J. W. Berry and M. Laferriere (Ed.) Multiculturalism in Canada: Social and
Educational Perspectives (pp. 238-249). Toronto: Allyn and Bacon.
Cummins, J. (1997). Minority Status and Schooling in Canada, Anthropology & Education
Quarterly, 28 (3), 411-430.
Dei, G.S. (1995). African Studies in Canada: Problems and Challenges, Journal of Black Studies,
26(2), 153-171.
Dei, G.S. (2008). Schooling as Community: Race, Schooling, and the Education of African
Youth, Journal of Black Studies, 38 (3), 346-366.
Dei, G.S., Mazzuca, J., McIsaac, E. & Zine, J., 1997, Reconstructing „Drop-out‟: A Critical
Ethnography of the Dynamics of Black Students‟ Disengagement from School, Toronto,
ON: University of Toronto Press Inc.
Dunham, R. & Wilson, G. (2007). Race, Within-Family Social Capital and School Dropout: An
Analysis of Whites, Blacks, Hispanics, and Asians. Sociological Spectrum, 27, 207-221.
Elliston, l. (1985). Counselling West Indian immigrants: Issues and Answers. In R.J.Samuda &
A.Wolfgang (Eds.), Intercultural counselling and assessment: Global perspectives
(pp.203-214). Lewiston, NY: Hogrefe.
Felice, L.G. (1981). Black Student Dropout Behaviour: Disengagement From School Rejection
and Racial Discrimination. The Journal of Negro Education, 50 (4), 415-424.
Ferguson et al. (2005). Early School Leavers: Understanding the Lived Reality of Students
Disengagement from Secondary School: Final Report. Toronto, ON: Community Health
Systems Resources Group, The Hospital for Sick Children.
Fischer, K. (1992) Educating speakers of Caribbean English in the United States. In J. Siegel (ed.)
Pidgins, Creoles and Nonstandard Dialects in Education (pp. 99–123) Melbourne:
Applied Linguistics Association of Australia.
Foster, C. 1996. A Place Called Heaven: The Meaning of Being Black in Canada. Toronto:
Harper Collins Publishers Ltd.
Gibson, M. (1997). Exploring and Explaining the Variability: Cross-National Perspectives on the
School Performance of Minority Students. Anthropology & Education Quarterly 28 ff(3),
318-329.
Gillborn, D. (1997). Ethnicity and Educational Performance in the United Kingdom: Racism,
Ethnicity, and Variability in Achievement, Anthropology & Education Quarterly 28(3),
375-393.
Ginwright, S.A. (2000). Identity for Sale: The Limits of Racial Reform in Urban Schools. The
Urban Review, 32 (1), 87-104.
90
Glick, J. E. & White, M. J. (2004). “Post-Secondary School Participation of Immigrant and
Native Youth: The Role of Familial Resources and Educational Expectations.” Social
Science Research, 33(2), 272-299.
Goldschmidt, P. & Wang, J. (1999) When Can Schools Affect Dropout Behaviour? A
Longitudinal Multilevel Analysis. American Educational Research Journal, 36 (4), 715-
738.
Gordesky, R., Martens, K. & Rowan, S. 2004. Influencing Systemwide Change at the Toronto
District School Board. Toronto, ON: Threshold Associates.
Griffin, B.W. (2002). Academic Disidentification, Race, and High School Dropouts. The High
School Journal, 85 (4), 71-81.
Guryan, Jonathan. 2004. Desegregation and Black Dropout Rates. American Economic
Review 94, no.4:919-943.
Hale-Benson, J. (1986). Black Children, Their Roots, Culture and Learning Styles, Baltimore,
MD: Johns Hopkins University Press.
Hankivsky, O. (2008). Cost Estimates of Dropping Out of High School in Canada. Vancouver,
B.C.: The Canadian Council on Learning.
Hanushek, E.A. & Rivkin, S.G. (2006). School Quality and the Black-White Achievement Gap.
National Bureau of Economic Research, Working Paper 12651.
Hess, F.M. & Leal, D.L. (1997). Minority Teachers, Minority Students, and College
Matriculation: A New Look at the Role-Modeling Hypothesis. Policy Studies Journal, 25
(2), 235-248.
King, S.H. (1993). The limited presence of African-American teachers. Review of Educational
Research, 63, 115-149.
Lindsay, C., August 16, 2007, The Caribbean Community in Canada, Statistics Canada, Retrieved
on October 5, 2008.
Lindsay, G., Pather, S. & Strand, S. (2006). Special Educational Needs and Ethnicity: Issues of
Over-and Under-Representation, Centre for Educational Development, Appraisal and
Research Institute of Education, Research Report 757.
Magocsi, P.R.,1999, Encyclopedia of Canada‟s Peoples, Toronto, ON: University of Toronto
Press Inc.
Menacker, T. (1998).A visit to CAP. Pidgins and Creoles in Education (PACE) Newsletter 9,
3–4.
Mitchell, N. (2005). Academic Achievement Among Caribbean Immigrant Adolescents; The
Impact of Generational Status on Academic Self-Concept, Professional School
Counseling, 8(3), 209-219.
91
Mitchell, N. & Bryan, J. A. (2007). School-Family-Community Partnerships: Strategies for
School Counselors Working with Caribbean Immigrant Families. Professional School
Counseling, 10 (4) 399-409.
Murdie, R. (1994). 'Blacks in near-ghettos?' black visible minority population in metropolitan
Toronto housing authority public housing units. Housing Studies, 4 (9), 435-457.
Murphy, James. (1973). Expectations and Working-Class Under-Achievement. The British
Journal of Sociology. 25 (3), pp. 326-344.
Ogbu, J.U. (1995). Cultural Problems in Minority Education: Their Interpretations and
Consequences, Part Two: Case Studies 1. The Urban Review, 27 (3), 271-297.
Ogbu, J. U. & Simons, H. D. (1998). Voluntary and Involuntary Minorities: A Cultural-
Ecological Theory of School Performance with Some Implications for Education,
Anthropology & Education Quarterly, 29 (2), 155-188.
Ogbu, J. U. & Davis, A., 2003, Black American students in an affluent suburb: a study of
academic disengagement, Mahwah, NJ: Lawrence Erlbaum.
Pitts, D.W. (2005). Diversity, Representation, and Performance: Evidence about Race and
Ethnicity in Public Organizations. Journal of Public Administration Research and
Theory, 15(4), 615-631.
Plaza, D. (1998) Strategies and strategizing: The struggle for upward mobility among university-
educated Black Caribbean-born men in Canada. In M. Chamberlain (Ed), Caribbean
Migration: Globalised Identities, ch. 16 (pp. 248-266). London: Routledge.
Raham, H. et al. (2008) Beyond the Grid: A Canadian Look at the Terrain of Teacher
Compensation. Society for the Advancement of Excellence in Education, 1-168.
Ruck, M.D. & Wortley, S. (2002). Racial and Ethnic Minority High School Students‟ Perceptions
of Schools Disciplinary Practices: A Look at Some Canadian Findings, Journal of Youth
and Adolescence, 31(3), 185-195.
Rumberger, R.W. (1987). High School Dropouts: A Review of Issues and Evidence, Review of
Educational Research, 57 (2), 101-121.
Rumberger, R.W. & Palardy, G.J. (2005).Test Scores, Dropout Rates, and Transfer Rates as
Alternative Indicators of High School Performance, American Educational Research
Journal, 42, 3.
Rumberger, R.W. & Thomas, S.L. (2000). The Distribution of Dropout and Turnover Rates
among urban and Suburban High Schools, Sociology of Education, 73 (1), 39-67.
Salinas, J. (2002). The Effectiveness of Minority Teachers on Minority Student Success. National
Association of African American Studies & National Association of Hispanic and Latino
Studies, 604-626.
Scott, J. L. (2000). English Language and Communication: Issues for African and Caribbean
Immigrant Youth in Toronto. Coalition of Visible Minority Women, 1-30.
92
Shield, J. (2008). Forging Ongoing Relationships with the Community is Win-Win Situation.
Texas Lone Star. Retrieved on March 22, 2009.
Smith, A., Schneider, B.H. & Ruck, M.D. (2005). “Thinking about Makin‟ It”: Canadian
Students‟ Beliefs Regarding Education and Academic Achievement, Journal of youth
and Adolescence, 34 (4), 347-359.
Solomon, P. R. (1997). Race, Role Modelling, and Representation in Teacher Education and
Teaching, Canadian Journal of Education, 22 (4), 395-410.
Springer, J., Roswell, T. & Lum, J. (2006). Pathways to Homelessness Among Caribbean Youth
Aged 15-25 in Toronto, The Ontario Metropolis Centre, Ceris Working Paper No. 44.
Stanton-Salazar, R. D., & Spina, S. U. (2000). The network orientations of highly resilient urban
minority youth. The Urban Review: Issues and Ideas in Public Education, 32(3), 227-262.
Statistics Canada, (2008c) “Canada‟s Changing Labour Force, 2006 Census: National Picture”,
2008, Statistics Canada, Retrieved on November 12, 2008.
Statistics Canada, (2008a), “Profile of Ethnic Origin and Visible Minorities for Canada,
Provinces, Territories, Census Divisions and Census Subdivisions, 2006 Census –
Ontario”, Retrieved on November 12, 2008.
Steinberg, L., Dornbusch, S. M., and Brown, B. B. (1992). Ethnic differences in adolescent
achievement: An ecological perspective, American Psychologist. 47, 723–729.
Taylor, A. R. (1991). Social competence and the early school transition: risk and protective
factors for African-American children, Education and Urban Society, 24, 15–26.
Toronto District School Board, (2008e), 2007-2008 Publication of Suspension and Expulsion
Data Key Messages, Fact Sheet and FAQ‟s, Retrieved on March 25, 2009.
Toronto District School Board, (2008d), Toronto District Urban Diversity Strategy: Focus On
Student Achievement, Raising the Bar and Closing the Gap, 1-17.
Toronto District School Board, (2008i), Toronto District School Board 2008-2009 Proposed
Budget: Fusing Resources for Student Success, 1-12.
Toronto District School Board, (2007a), Students at Risk, Retrieved on March 25, 2009.
Vernez, G., Karam, R., Mariano, L.T. & Demartini, C. (2006). Evaluating Comprehensive School
Reform Models at Scale: Focus on Implementation. The Rand Corporation, 1-267.
Walrond, J. (2008). Towards a Global Citizenship Education for Caribbean Canadian Youth,
Interchange, Vol. 39(2), 185–203.
Yau, M. & O‟Reilly, J., October 2007, “2006 Student Census, Grades 7-12: System Overview”,
The Toronto District School Board, Retrieved on November 12, 2008.
Yau, M. & O‟Reilly, J., April 2008, “2006 Student Census: Linking Demographic Data with
Student Achievement”, The Toronto District School Board, Retrieved on November 14,
2008.
93
Websites Visited
Alcoba, N., January 28, 2008, “Black leaders to come out against proposed Afrocentric school”,
The National Post, [Online] Available at:
http://network.nationalpost.com/np/blogs/toronto/archive/2008/01/28/black-leaders-to-
come-out-against-proposed-afrocentric-school.aspx
Bank of Canada, April 22, 2009, “Rate and Statistics: Exchange Rates – Daily Currency
Converter”, [Online] Available at: http://bank-banque-canada.ca/en/rates/converter.html
Bello, Nadia. March 3, 2008, “Afrocentric School Needs Our Support”, The National Post,
[Online] Available at: http://www.nadiabello.com/media.html
Bowden, David. January 23, 2009, “TDSB curriculum too „colonial,‟ trustee says”, The National
Post, [Online] Available at: http://www.financialpost.com/scripts/story.html?id=1208208
Brown, L. & Popplewell, B., January 30, 2008, “Board okays black-focused school: Toronto
board votes 11-9 after meeting filled with passionate pleas and dire warnings”, The
Toronto Star, [Online] Available at: http://www.thestar.com/News/GTA/article/298714
Brown, L., January 18, 2008, “Cut black dropout rate to 15%, schools told: mentors, diversity
plan key to 5-year strategy”, The Toronto Star, [Online] Available at:
http://www.thestar.com/article/445172
Canada Race Relations Foundation, 2009, CRRF Foundations in equity and Anti-Racism:
Towards an Inclusive School Practice, [Online] Available at:
http://www.crr.ca/content/view/471/543/lang,english/
Durham Public Schools: North Carolina, February 5, 2009, Dropout Rate Plunges 14 percent,
largest decrease in 7 years, [Online] Available at: http://www.dpsnc.net/news/news-
releases/dropout-rate-plunges-14-percent-largest-decrease
Education Quality and Accountability Office, 2008, “Student Resources: OSSLT”, [Online]
Available at: http://www.eqao.com/Students/Secondary/10/10FAQ.aspx?Lang=E&gr=10
Evanston Township High School, 2009, “English/Reading/CAP”, [Online] Available at:
http://www.eths.k12.il.us/pilothandbook/pdf/englishreadingcap.pdf
Evanston Township High School, 2009, “ETHS History”, [Online] Available at:
http://www.eths.k12.il.us/information/pdfs/ETHS_history.pdf
Ibbitson, J., March 11, 2009, “Obama‟s revolutionary reform of U.S. education”, The Globe and
Mail, [Online] Available at: http://www.globecampus.ca/in-the-news/article/obamas-
revolutionary-reform-of-us-education/
Indiana Department of Education, 2009, “Dropout Recovery Project”, [Online] Available at:
http://www.doe.in.gov/sservices/dropout_recovery.html
Massachusetts Department of Elementary & Secondary Education, 2001, “School Finance:
Statistical Components”, [Online] Available at:
http://finance1.doe.mass.edu/statistics/pp00_blngtxt.html
94
Ontario Ministry of Education, 2009, “Realizing the Promise of Diversity: Ontario‟s Equity and
Inclusive Education Strategy”, [Online] Available at:
http://www.edu.gov.on.ca/eng/policyfunding/equity.pdf
Pathways to Education, 2008, “Backgrounder”, [Online] Available at:
http://pathwaystoeducation.ca/PDF/Media%20Backgrounders/Pathways_Backgrounder.p
df
Pathways to Education, 2009, “Pathways to Education: Regent Park Backgrounder”, [Online]
Available at:
http://pathwaystoeducation.ca/PDF/Media%20Backgrounders/Regent%20Park_Backgrou
nder.pdf
Pathways to Education, July 16, 2007, “News Release: Toronto Program Major Success in
Preventing High School Drop-Outs”, [Online] Available at:
http://pathwaystoeducation.ca/boston2.html
Royson, J., November 18, 2007, “Black Schools in Focus”, The Toronto Star, [Online] Available
at: http://www.thestar.com/article/277427
Rushowy, K., January 31, 2008, “More black-focused schools? Province won‟t help out but
school board chief says demand will drive size of the program”, The Toronto Star,
[Online] Available at: http://www.thestar.com/article/299106
Sadowski, M. (2001). “Closing the gap one school at a time.” Harvard Education Letter. [Online]
Available at: http://www.edletter.org/past/issues/2001-mj/gap.shtml
Statistics Canada, June 23, 2008b, “Low income definitions”, [Online] Available at:
http://www.statcan.gc.ca/pub/75f0011x/2008001/5203392-eng.htm
Teaching Research Institute – Western Oregon University, 2007, “Special Education Assessment
Process for Culturally and Linguistically Diverse Students”, [Online] Available at:
http://www.tr.wou.edu/eec/documents/Appendix%20E%20-
%20Bilingual%20Ed%20Def.pdf
Texas Education Agency, 1996, “Dropout Definition, Data Collection and Methodology”,
[Online] Available at: http://ritter.tea.state.tx.us/reports/1996cmprpt/02drpdef.html
Toronto District School Board, 2008b, “CW Jefferys Collegiate Institute, Grade 9-12”, [Online]
Available at: http://www.tdsb.on.ca/profiles/3441.pdf
Toronto District School Board, 2008c, “Downsview Secondary School, Grade 9-12”, [Online]
Available at: http://www.tdsb.on.ca/profiles/3420.pdf
Toronto District School Board, 2008a, “Facts and Figures”, [Online] Available at:
http://www.tdsb.on.ca/_site/ViewItem.asp?siteid=302&menuid=3654&pageid=3049
Toronto District School Board, 2008f, Regular Meeting, May 21, 2008, [Online] Available at:
http://www.tdsb.on.ca/boardroom/bd_agenda/uploads/minutes/2008/080521.pdf
95
Toronto District School Board, 2007b, Regular Meeting, November 28 and 30, [Online]
Available at:
http://www.tdsb.on.ca/boardroom/bd_agenda/uploads/minutes/2007/71128_30.pdf
Toronto District School Board, 2004, Special Meeting, June 16, 2004, [Online] Available at:
http://www.tdsb.on.ca/boardroom/bd_agenda/uploads/minutes/2004/40616.pdf
Toronto District School Board, 2008h, Special Meeting, January 29, 2008, [Online] Available at:
http://www.tdsb.on.ca/boardroom/bd_agenda/uploads/minutes/2008/080129.doc
Toronto District School Board, 2008g, TDSB Urban Diversity Strategy: Consultation Process,
Online] Available at:
http://www.tdsb.on.ca/boardroom/bd_agenda/uploads/generalinfo/080620%20urban.pdf
UNESCO Institute for Statistics, 2001, “Good neighbours: Caribbean students at the tertiary level
of education”, [Online] Available at:
http://www.uis.unesco.org/file_download.php?URL_ID=4955&filename=10288852680caribbean
_2001_EN.pdf&filetype=application%2Fpdf&filesize=1261725&name=caribbean_2001_EN.pdf
&location=user-S/