Embed Size (px)
Citation preview


What Do Today’s Listener Attitudes and Behavior Tell Us About Radio’s Future?

26,000 American Consumers Answers and Strong Clues to Questions Like….
What’s the State of Radio Today?
Where Does it Fit – and How Does it Thrive – in the New World?
Does Radio Have a Youth Problem? What Can We Do About It?
Can Radio Compete with Customizable Streamers? How?
What Will Growing In-Car Internet Penetration Mean?
What’s the Economy Going to Do Near-Term?
Plus….
How Ad Agency People Perceive Radio Differently vs. Consumers
And
Some Great Data to Show Radio’s Advantages Over Other Media
(Show this to your prospects!)

Sample
Triton Digital National Consumer Database
25,000,000 Panelists
August & September 2012
All Ages, Genders and Format Fans
Total Polled = 41,252
Roughly in Line with 2010 Census
Heavily Caucasian

What Kind of Station do You Listen to Most?
Music 74.2%
News/Talk 19.0%
Sports 12.8%

Sample Included….
Primary Shoppers = 18,403
Work for an Advertising Agency = 1,498


Own or Have Access To
TV 92.7%
Home Computer (includes laptop/tablet) 88.9%
Radio at Home 86.6%
Smartphone 49.8%
Internet Access in Car 19.7%
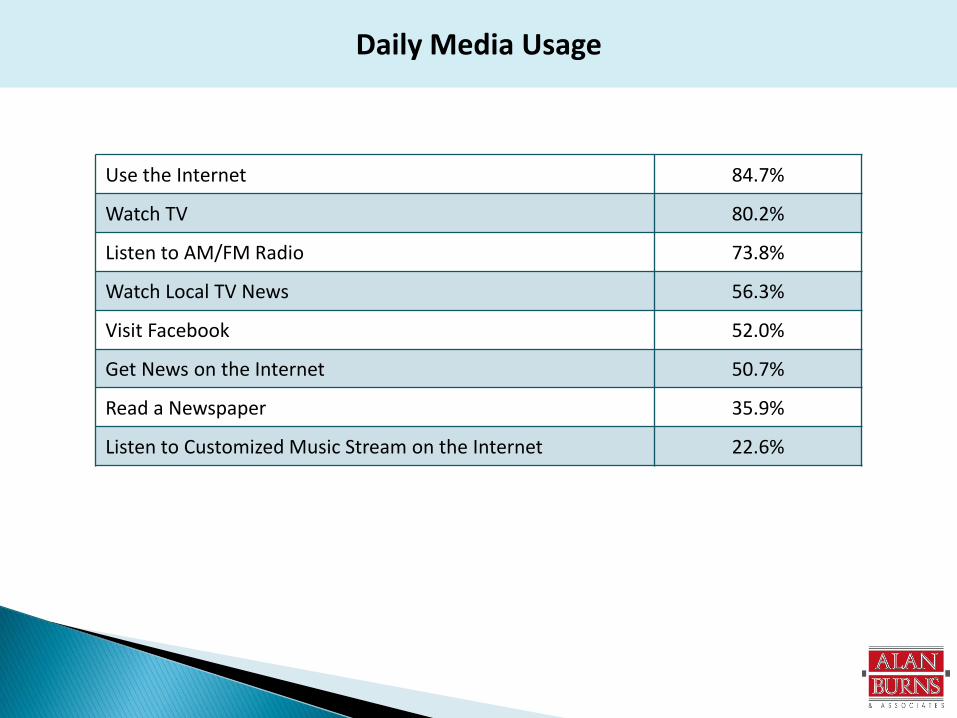
Daily Media Usage
Use the Internet 84.7%
Watch TV 80.2%
Listen to AM/FM Radio 73.8%
Watch Local TV News 56.3%
Visit Facebook 52.0%
Get News on the Internet 50.7%
Read a Newspaper 35.9%
Listen to Customized Music Stream on the Internet 22.6%

Daily Media Usage
Use the Internet 84.7%
Watch TV 80.2%
Listen to AM/FM Radio 73.8%
Watch Local TV News 56.3%
Visit Facebook 52.0%
Get News on the Internet 50.7%
Read a Newspaper 35.9%
Listen to Customized Music Stream on the Internet 22.6%

Daily Media Usage
Use the Internet 84.7%
Watch TV 80.2%
Listen to AM/FM Radio 73.8%
Watch Local TV News 56.3%
Visit Facebook 52.0%
Get News on the Internet 50.7%
Read a Newspaper 35.9%
Listen to Customized Music Stream on the Internet 22.6%

Daily Media Usage
Use the Internet 84.7%
Watch TV 80.2%
Listen to AM/FM Radio 73.8%
Watch Local TV News 56.3%
Visit Facebook 52.0%
Get News on the Internet 50.7%
Read a Newspaper 35.9%
Listen to Customized Music Stream on the Internet 22.6%

Daily Media Usage
Use the Internet 84.7%
Watch TV 80.2%
Listen to AM/FM Radio 73.8%
Watch Local TV News 56.3%
Visit Facebook 52.0%
Get News on the Internet 50.7%
Read a Newspaper 35.9%
Listen to Customized Music Stream on the Internet 22.6%

Where Radio Fits – Why People Use Radio
“What Medium or Service Best/Most….” (For you)

What Medium or Service….
For Sports Information
TV 32.6%
Internet 25.1%
None 18.0%
Radio 14.7%
Newspaper 9.8%

What Medium or Service….
For Weather
TV 37.5%
Internet 30.7%
Radio 18.8%
None 7.6%
Newspaper 5.4%

What Medium or Service….
To Find Out What Other People are Doing
Internet 48.5%
None 21.5%
TV 12.8%
Radio 11.3%
Newspaper 5.9%

What Medium or Service….
Helps You Connect with Friends
Internet 57.3%
None 21.3%
TV 9.3%
Radio 8.7%
Newspaper 3.4%

What Medium or Service….
Informs You
Internet 31.0%
TV 27.9%
Radio 19.5%
Newspaper 13.8%
None 7.9%

What Medium or Service….
Keeps You Company
Radio 36.6%
TV 30.3%
Internet 16.9%
None 12.0%
Newspaper 4.4%
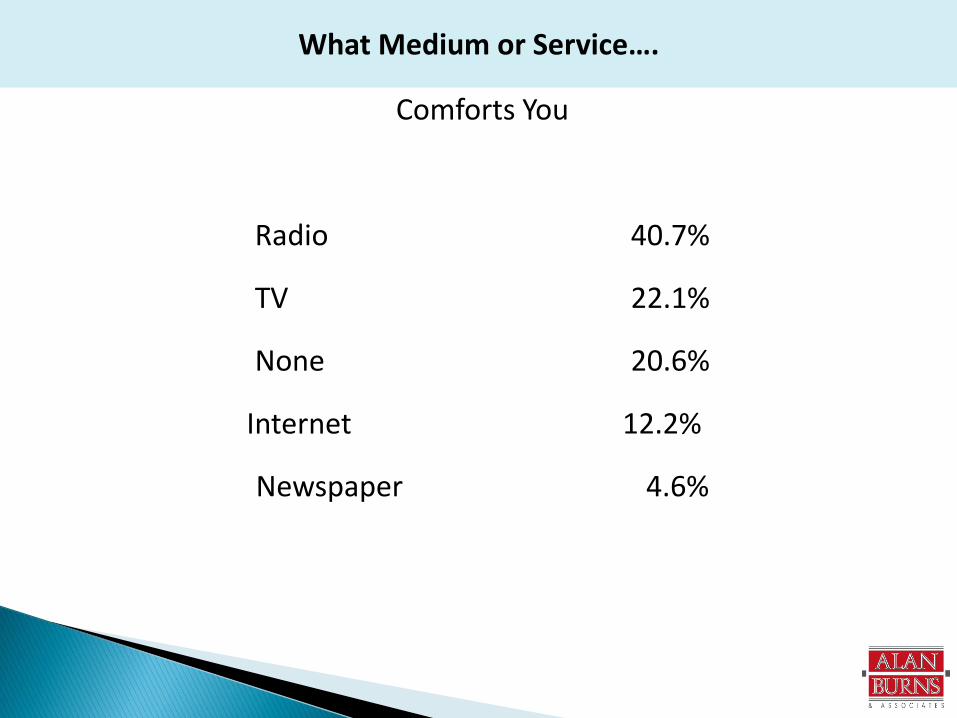
What Medium or Service….
Comforts You
Radio 40.7%
TV 22.1%
None 20.6%
Internet 12.2%
Newspaper 4.6%

What Medium or Service….
Helps You Have a Good Time
Radio 41.0%
TV 21.1%
Internet 19.0%
None 15.0%
Newspaper 4.1%

What Medium or Service….
Helps You Relax
Radio 46.8%
TV 25.4%
Internet 12.4%
None 9.2%
Newspaper 6.3%

What Medium or Service….
Energizes You
Radio 49.1%
None 23.6%
TV 12.3%
Internet 10.3%
Newspaper 4.7%

What Medium or Service….
Improves Your Mood
Radio 57.4%
TV 16.0%
None 11.4%
Internet 11.2%
Newspaper 4.1%

“I Would be Very Disappointed if My Favorite Radio Station Went Away”
12%
4%
22%
14%
48% Strongly Agree
Somewhat Agree
None
Somewhat Disagree
Strongly Disagree

Listening to Radio More, Less or the Same?
More 30.0%
Same 55.1%
Less 20.5%
Net +9.5%

Listening to Radio More, Less or the Same?
Total + 9.5%
Shoppers +11.9%
Under 18 +18.0%
18-34 + 8.5%
35-54 +12.5%
55+ + 6.1%
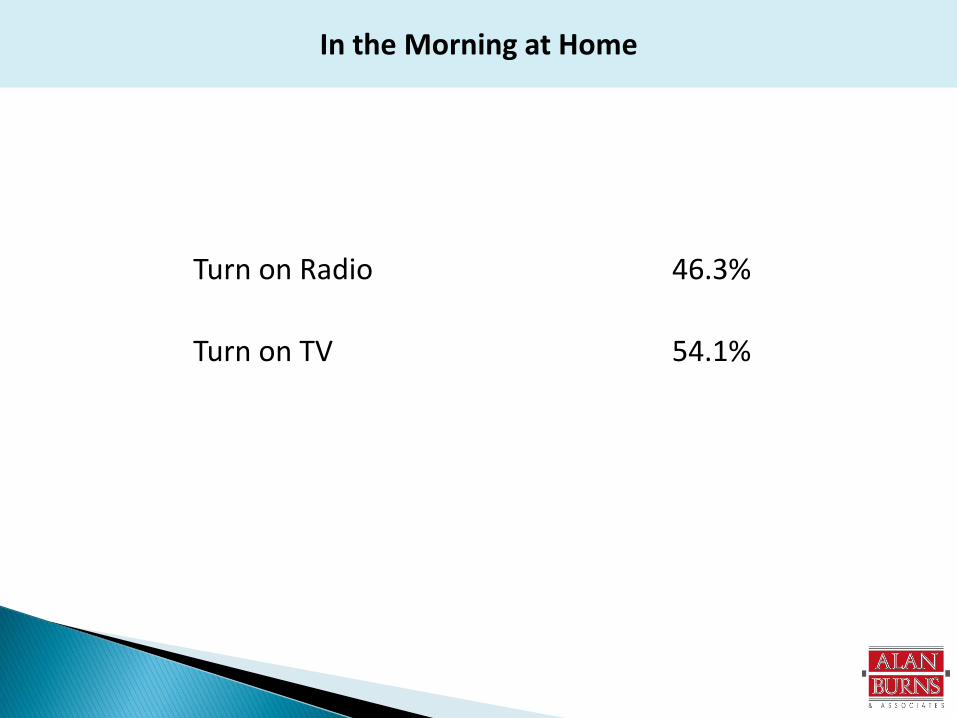
In the Morning at Home
Turn on Radio 46.3%
Turn on TV 54.1%

Is There a Person or Show You Particularly Enjoy On Radio Between 5:38 and 8:00am?
Yes 56.9%
No 46.7%

Listening to Mp3s, CDs or Records…
More 19.0%
Same 45.9%
Less 40.8%
Net -21.8%

Pandora
Aided Recall 69.1%
Most Recent Usage (Among Those Aware)
Past 24 Hours 10.8%
Past Week 15.1%
As % of Total
Past 24 Hours 3.5%
Past Week 4.9%

Using Any Music Source Less As Result of Pandora Listening?
Of Pandora Weekly Cume
No/Don’t Know 52.4%
Radio Stations 28.4%
CDs, MP3, Records 27.9%
Other Sources 23.3%
YouTube 20.0%

Radio’s Demographic Challenge: Less Attachment Under 35
Radio is the medium that best/most….
Total < 18 18-34 35-54 55+
Energizes You 49.2% 49.2% 51.5% 53.6% 40.5%
Improves Your Mood 57.4% 48.1% 50.6% 61.9% 57.8%
Helps You Relax 46.8% 43.7% 41.0% 49.2% 48.7%
Comforts You 40.7% 37.0% 36.1% 43.1% 41.4%
Keeps You Company 36.6% 26.9% 28.1% 39.5% 40.9%
Informs You 19.5% 17.3% 16.4% 21.2% 20.0%

PPM AQH Ratings Six-month Average of Multiple Markets East, West, Midwest
4.8
9.1
11.3
5.2
7.2 7.7
0.0
2.0
4.0
6.0
8.0
10.0
12.0
6-17 18-34 35-54
Mon-Friday Sat-Sunday


Streaming Music Usage on Smartphones Growing
Listening to All Music Sources – Radio streams, Pandora, Etc.
Weekly 39.3%
Daily 25.4%
1+Hour Daily 16.5%

AM/FM Radio on Other Platforms
Hour
Daily or More
On Computer 46.4% 36.2%
(incld laptop/tablet)
On Smartphone 23.0%* 18.1%
* of Smartphone owners

Smartphone Owners – Ever Downloaded….
Any App 75.2%
Specific Radio Station App 21.9%
iHeart Radio App 20.7%
TuneIn Radio App 7.9%
Unduplicated
Radio App Downloaders 39.1%

Awareness and Weekly Cume
Among Those Aware Total
Awareness
Cume
Total < 18 18-34 35-54 55+
Pandora 69.1% 25.9% 50.5% 43.0% 20.7% 14.5%
iHeart 47.7% 17.0% 26.3% 22.0% 16.3% 11.8%
HD Radio 34.8% 8.6% 16.9% 10.8% 7.6% 6.8%
TuneIn 12.7% 8.4% 12.2% 10.2% 7.5% 7.6%

Would Listen to Radio More If….
Absolutely + Very Likely Total < 18 18-34 35-54 55+
It Had Fewer Commercials 61.4%
You Can Skip Songs You Don’t Like 54.6% 64.1% 65.1% 54.7% 43.8%
You Can Control the Music 56.1% 61.5% 63.9% 56.5% 47.8%
Watch Videos of Songs as They Played 33.5%
Favorite Personality Was on Longer/More Often 34.7%
There was more/better News and Information 35.5%
If You Could Rewind Commercials 21.0%

There IS Demand for a Radio Chip
Total < 18 18-34 35-54 55+
I would be more likely to buy a specific cell phone if it had a radio receive in it
37.8% 43.9% 42.2% 39.7% 29.6%


19.7% Have Internet Access in Car Owned or Ridden in Most
What Can Their Behavior Tell Us About the Future?

In-Car Internet Impact
Have Internet Access in Car: What Do You Listen to Most?
AM/FM on the Radio 70.3%
Local AM/FM Stream 4.6%
Distant AM/FM Stream 4.0%
Other – CDs, MP3, etc. 12.6%
Personalized Music Stream 8.5%
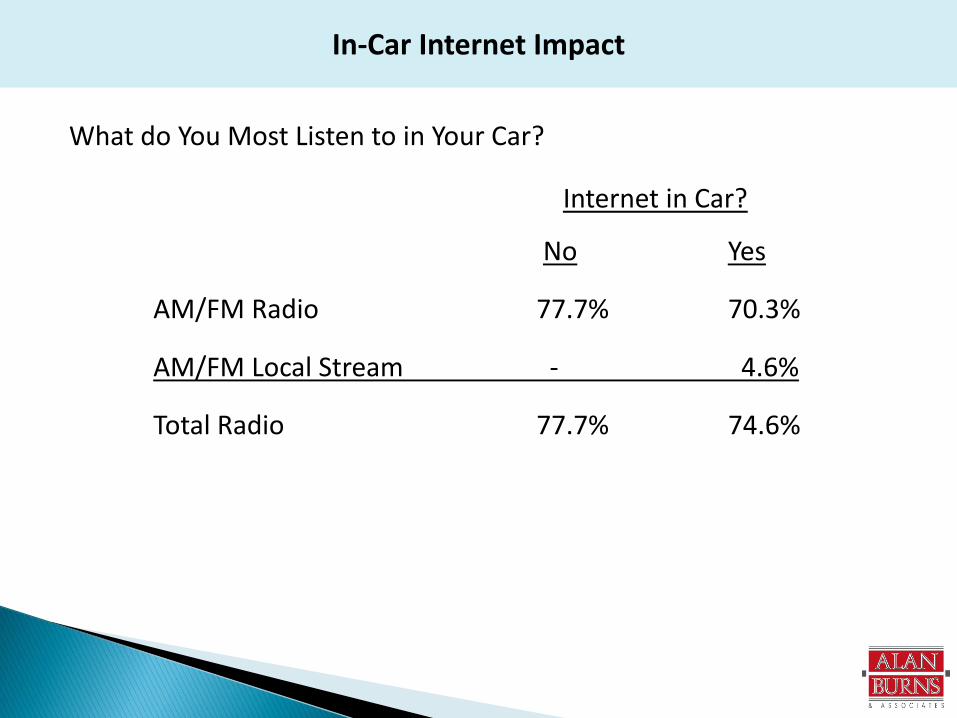
In-Car Internet Impact
What do You Most Listen to in Your Car?
Internet in Car?
No Yes
AM/FM Radio 77.7% 70.3%
AM/FM Local Stream - 4.6%
Total Radio 77.7% 74.6%

How Much of Your Time in the Car is Spent Listening to AM/FM Radio?
10.5%
4.9% 5.6% 4.7%
9.6%
3.7%
6.1%
11.2%
17.2%
26.4%
11.3%
6.1% 6.8%
6.0%
11.9%
4.8% 5.6%
9.3%
10.9%
27.6%
0.0%
5.0%
10.0%
15.0%
20.0%
25.0%
<10% 20% 30% 40% 50% 60% 70% 80% 90% 100%
No Access Access
In Car: Internet Access vs. Not

Spends 80% or More of In-Car Time With AM/FM
Those With In-Car Internet 47.8%
Those Without 54.8%
-7.0%

Smartphone Usage – Do You Have an Unlimited Data Plan?
Yes 45.5%
No 17.5%
Don’t Know 40.3%

The End of Unlimited Data Plans Means…..
“As a result of (losing unlimited data plans), do you think you
will listen to music streamed to your phone….”
Less 50.5%
No Change 49.5%
…. which improves the value proposition for over-the-air radio.


Consumers’ State of Mind
Compared to a Year Ago, You/Your Family Are……
Total 18-34 35-64
Better Off 12% 17% 11%
Worse Off 40% 32% 42%
About the Same 40% 49% 45%
Note: N= 14,803 Sept 12-20, 2012

They Plan to Vote For…
September 12-20, 2012
President Obama
Mitt Romney
Other/Undecided
18-34
52%
26%
21%
35-64
37%
36%
26%
President Obama’s Lead Widened After Conventions
N Lead
August (26,449) 1.7%
September (14,803) 3.0%
Total
38%
35%
25%

In 2013 The Economy Will……
Get Better…… Business
Total Sample Owners & Managers*
Regardless of who wins 20.6% 21.0%
if Obama wins 20.4% 18.9%
if Romney wins 22.4% 27.5%
Not Get Better 36.9% 32.6%
Regardless Who Wins
*N=6,286

Less Than Half Think Economy Will Improve in 2013
Total Sample
If Obama
Doesn’t Matter Who Wins 20.6%
If Obama Wins 20.4%
Total 41.0%
If Romney
Doesn’t Matter Who Wins 20.6%
If Romney Wins 22.4%
Total 43.0%
Business
Owners & Managers*
21.0%
18.9%
38.9%
21.0%
27.5%
48.5%
*N=6,286

This Holiday Season Will You Spend More, Less or About the Same as Last Year?
Total
More 10%
Less 42%
Same 47%
N= 14,803 Sept 12-20, 2012


Advertising Agencies
Attitudes and Perceptions Among
1,498
Advertising Agency Employees
Compared to
Primary Shoppers
(people who do most of the shopping for their household)

Advertising Agencies
What Advertising Professionals Think…..
Good News, Bad News, Useful News

Agency People Don’t See/Hear Radio as Consumers Do
Comparing Agency Employees to Primary Household Shoppers:
The medium that most…
Agency Compared to Shoppers
Shoppers Radio TV
Improves Your Mood 60.5% -19% +24%
Energizes You 51.9% -14% +48%
Has Annoying Ads 16.9% +30% -13%
How to Read: Agency employees are 19% less likely than shoppers to cite
Radio as the medium that most improves their mood

More Agency/Shopper Differences…
Agency Compared to Shoppers
Cume Daily Radio -22%
Cume Customized Music Stream Internet Daily +33%
Skips Commercials on DVR Most of the Time -24%
Likes a Specific Morning Show or Person -26%
How to Read: Agency employees are 22% less likely thank
shoppers to cume radio on a daily basis.

“I Would be Very Disappointed if My Favorite Radio Station Went Away”
Agency Compared to Shoppers
Strongly Agree - 28%
Strongly Disagree +101%
How to Read: Agency employees are 101% more likely than shoppers to strongly disagree with the statement
“I would be very disappointed if my favorite radio station went away”

The Good News
Radio Ranks #1 with Agency Folks for….
Comforts You 38.1%
Energizes You 44.6%
Helps You Have a Good Time 39.8%
Helps You Relax 43.0%
Improves Your Mood 49.0%
Keeps You Company 34.5%
Targeted Ads 23.4%


Do You Own/Use a DVR?
6.0%
21.8%
31.0%
26.7%
20.8%
How Often Do You Watch TV in Real Time ?
All the Time
Most of the Time
Occasionally
Often
Rarely/Never
32.4%
27.6%
15.0%
19.7%
11.9%
When not in Real Time How Often Do You Skip Commercials?
All the Time
Most of the Time
Occasionally
Often
Rarely/Never
Yes 53.8%

Which Are Important Parts of Your Community?
TV Stations 78.7%
Radio Stations 78.6%
Newspaper 67.6%
Internet Sites 59.3%

Anyone on___________ You Don’t Know Personally But Who Feels Like a Friend?
Yes %
Radio 46.8%
TV 35.6%
Internet 24.3%
Newspaper 12.2%

Is There a Medium That Feels Like One of Your Friends?
Yes %
Radio Station 50.3%
TV Station 31.8%
Website 26.5%

How Much Would You Trust Information About a Product or Service From…
(10 Point Scale)
A Friend 7.9
A Radio Station 5.7
Newspaper Ad 5.0
An Internet Site 4.7
Famous Person on TV 4.4

Where Do You Hear About New Products, New Services or New Stores?
TV 69.2%
Friends 56.6%
Radio 51.9%
Online 51.4%
Newspaper 32.1%
Magazines 29.1%

Ever Purchased an Item or Shopped at a Location You Heard About First on…
Yes %
TV 69.2%
Radio 58.8%
Website 49.0%
Newspaper 45.6%
Facebook 22.2%

What Medium or Service….
Has Ads That are Honest and Believable
Radio 23.3%
TV 18.9%
Newspaper 15.1%
Internet 9.5%
(None 33.2%)

What Medium or Service….
Has Ads Intended Specifically for People Like You
Internet 24.3%
Radio 23.3%
TV 18.6%
Newspaper 9.4%
(None 24.4%)

What Medium or Service….
Has Ads That are Annoying
TV 37.0%
Internet 26.7%
Radio 17.0%
Newspaper 5.2%
(None 11.2%)
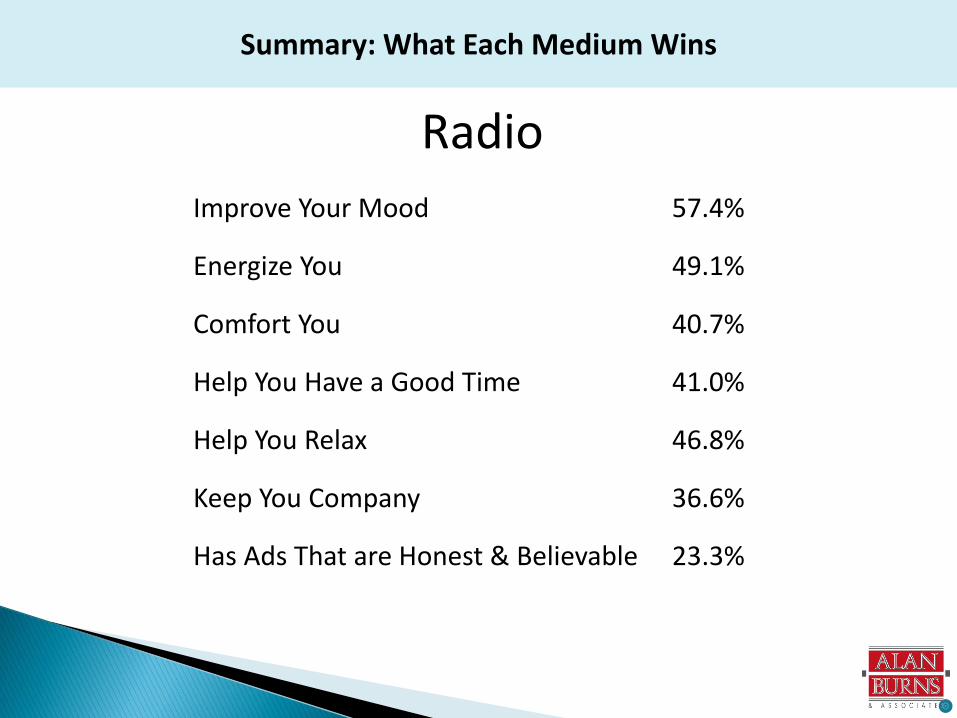
Summary: What Each Medium Wins
Radio
Improve Your Mood 57.4%
Energize You 49.1%
Comfort You 40.7%
Help You Have a Good Time 41.0%
Help You Relax 46.8%
Keep You Company 36.6%
Has Ads That are Honest & Believable 23.3%

Summary: What Each Medium Wins
TV
Sports Information 32.6%
Weather Information 37.5%
Has Ads that Are Annoying 37.0%

Summary: What Each Medium Wins
Internet
Find Out What Other People are Doing 48.5%
Helps You Connect With Friends 57.3%
Informs You 31.0%
Has Ads Intended Specifically 24.3% For People Like You Radio 23.3%

Summary: What Each Medium Wins
Newspaper
None

Media “Best For” Summary….
Internet – Other People (connecting to, keeping up with)
Television – Annoying, skippable ads
Radio – the trusted source that makes you feel better

Show This to Your Agencies!
Total Agreement with the Statement Total <18 18-34 35-54 55+
I would be very disappointed if my favorite radio station went away
61.6% 60.0% 62.0% 62.7% 59.6%
I would be very disappointed if Facebook went away
44.7% 53.3% 54.2% 44.7% 33.9%


Summary
Radio AQH may be nibbled at by other media but consumers don’t
sense themselves using it less

Summary
Radio is less loved by those under 35. Their usage may decline unless
radio acts effectively.
People – especially people under 35 – tell us they want to be able to
control the music.

Summary
Less than half of consumers turn on Radio before leaving home
in the morning.

Summary
Radio listening on other platforms becoming significant.
Is it all being captured?

Summary
Consumers with in-car Internet access are not using radio significantly
less – perhaps 7% less.
Out of market Radio listening will add 4-5% more fragmentation.

Summary
The end of unlimited data plans will bolster the value proposition of
free over the air radio.

Summary
Consumers are pessimistic about the 2013 economy, and expect to
spend less this holiday season.

Summary
Advertising agency personnel tend to use and think of radio less
favorably than the consumers their agencies – and our stations - target.

Summary
Consumers like radio.
They have personal relationships with personalities and stations.
They trust radio more than other media.
They are generally in a good mood when listening.
They find radio ads less annoying than those on TV or the Internet.

Predicting Radio’s Future
Short-term:
Continue to be strong with consumers
Struggle economically along with the consumers
Suffering unnecessarily at some agencies

Predicting Radio’s Future
Longer Term:
Issues are
Remaining the Personal Medium
Agency Perceptions
Younger Listeners
Digital Relevance

Recommendations
Remaining the Personal Medium
Short Term/Long Term
PPM Conundrum – shut up now/where are your friends later?
Saving $ on Talent Development

Recommendations
Agency Perceptions
Show them the facts
Sell Radio. Industry leaders should be devoting more resources to that
PR genius

Recommendations
Younger Listeners
Actual young people need to be represented on the air
And they need to talk to young people about young people issues
Be more responsive to their expectations
Which leads to digital relevance….

Recommendations
Digital Relevance
Best of All Worlds
Big but Personal Brands
Big Megaphone

Recommendations
Two Very Different Products and Capabilities
Start: fill stopsets with listenable material
Then: make radio streams skippable/customizable
Then: move into video

The Crystal Ball
Radio’s Future
Pandora
Apple
Others
Consumers
You