Embed Size (px)
Citation preview
What provides cerebral reserve?
Roger T. Staff,1 Alison D. Murray,2 Ian J. Deary4 and Lawrence J. Whalley3
1Department of Bio-Medical Physics and Bioengineering,
University of Aberdeen and Aberdeen Royal In®rmary,2Department of Radiology, University of Aberdeen,3Clinical Research Centre, Department of Mental Health,
Aberdeen and 4Department of Psychology, University of
Edinburgh, Edinburgh, UK
Correspondence to: Roger T. Staff, Department of
Bio-Medical Physics and Bioengineering, University of
Aberdeen, Foresterhill, Aberdeen AB25 2ZD, UK
E-mail: [email protected]
SummaryThe cerebral reserve hypothesis is a heuristic conceptused to explain apparent protection from the onset ofcerebral disease and/or cognitive decline in old age. Asigni®cant obstacle when investigating the reservehypothesis is the absence of baseline data with which tocompare current cognitive status. We tested the in¯u-ence of three hypothesized proxies of reserve (educa-tion, head size and occupational attainment [OCC]) in92 volunteers born in 1921, whose cognitive functionwas measured at age 11 and 79 years, and who under-went brain MRI. The association between each proxyand old age cognitive function was tested, adjusting forvariance contributed by childhood mental ability anddetrimental age-related pathological changes measured
using MRI. The results showed that education andOCC, but not total intracranial volume (TICV), con-tribute to cerebral reserve and help retain cognitivefunction in old age. Education was found to contributebetween 5 and 6% of the variance found in old agememory function but was found to have no signi®cantassociation with reasoning abilities. OCC was found tocontribute around 5% of the variance found in old agememory function and between 6 and 8% of the vari-ance found in old age reasoning abilities. We concludethat the intellectual challenges experienced during life,such as education and occupation, accumulate reserveand allow cognitive function to be maintained in oldage.
Keywords: cerebral reserve; education; occupation; head size; childhood intelligence
Abbreviations: AVLT = Auditory Verbal Learning Test; BF = brain fraction; GM = grey matter; MHT = Moray House
Test; OCC = occupational attainment; RPM = Raven's Progressive Matrices; TICV = total intracranial volume; WM =
white matter; WMH = white matter hyperintensities
Received August 21, 2003. Revised January 6, 2004. Accepted January 10, 2004. Advance Access publication March 26, 2004
IntroductionThe extent to which cognitive performance is retained in the
face of brain ageing is of great importance in clinical
neuroscience. Many studies of cognitive ageing and dementia
show large cognitive variations between individuals in the
presence of brain structural changes that appear similar in
location and extent (Fazekas et al., 1987; Katzman et al.,
1989; Satz 1993; Leaper et al., 2001; Meguro et al., 2001;
Bigio et al., 2002). To date, little is known of the sources of
these inter-individual variations. The largest contributor to
cognitive function in old age is cognitive function in youth,
accounting for just under half of the variance (Deary et al.,
2000). Some reports stress the importance of environmental
in¯uences on cognitive ageing, especially nutritional, during
life (Bowirrat et al., 2002; Perls et al., 2002). Others have
emphasized the importance of genetics in individual differ-
ences in cognitive ageing, to which polymorphisms in the
apolipoprotein E allele make a small but signi®cant contri-
bution (Abate et al., 1998; Bowirrat et al., 2002; Deary et al.,
2002).
The fact that substantial differences in cognitive impair-
ment exist in individuals with an identical amount of brain
ageing may be accounted for by the hypothesized protective
effect of `cerebral reserve'. Stern (Stern, 2002) made analysis
of cerebral reserve more tractable by: (i) distinguishing
between active and passive components of reserve; and
(ii) identifying the burden imposed on reserve by age-related
brain pathology. Cerebral reserve may be a passive capacity
of brain available to withstandÐup to a ®nite thresholdÐ
brain ageing, after which de®cits appear. For example, if
brain size is a proxy of passive cerebral reserve, the cerebral
reserve hypothesis predicts that those with a larger intracra-
nial capacity are able to withstand brain ageing better than
Brain Vol. 127 No. 5 ã Guarantors of Brain 2004; all rights reserved
DOI: 10.1093/brain/awh144 Brain (2004), 127, 1191±1199
at University of Sydney L
ibrary on September 3, 2014
http://brain.oxfordjournals.org/D
ownloaded from
those with a smaller intracranial capacity; it would take more
brain ageing before age-related cognitive decline was
detectable. The second component addresses the active
processes that are available to ameliorate the effects of
brain ageing. These active processes are of two types. One is
the relative ability to switch to alternative cognitive para-
digms to overcome the effects of brain ageing. The other is
the ability to recruit compensatory neuronal structures to
replace processing pathways damaged by ageing. It is
impossible to quantify the diverse positive and negative
in¯uences on brain development. However, appropriate
proxies of active reserve are education and occupation,
which are generally available. To test the cerebral reserve
hypothesis requires these passive and active indicators of
cerebral reserve, and a measure of brain ageing. To quantify
the burden imposed by brain ageing, we used an estimation of
white matter hyperintensities, which occur more frequently in
the presence of risk factors for vascular disease and are
associated with impaired cognitive function (Leaper et al.,
2001; Deary et al., 2003).
Testing the cerebral reserve hypothesis is dif®cult, because
it demands a set of measured variables that are rarely
available in a single cohort. Ideally, one requires records of
mental ability in youth and old age to measure age-related
cognitive change; measures of brain ageing to assess the
burden placed on the brain; and measures of passive (e.g.
brain size) and active (e.g. education, occupational category)
cerebral reserve that might ameliorate this burden somewhat.
Precise tests of cerebral reserve hypotheses have hitherto not
been feasible because data on mental ability from youth are
rarely available for those older people now at risk of cognitive
decline. The use of education- or occupation-related variables
by some researchers as proxies for childhood mental ability is
unsatisfactory, because these are themselves reserve factors
contributing to the active model of cerebral reserve.
Here we use cognitive test scores at age 11 years and at age
78±80 years in the same subjects to obtain a measure of age-
related cognitive change. We use a white matter hyperinten-
sity score detected on MRI, which has previously been shown
to correlate with old age cognition (Leaper et al., 2001), as a
quanti®able example of age-related brain burden. In the
active reserve model, we were also able to use brain fraction
(BF) as an additional measure of burden, which has been
shown to reduce with age (Blatter et al., 1995) and correlates
with intelligence (Willerman et al., 1990). The BF is the ratio
of the total white and grey matter volumes to the total
intracranial volume (TICV). This measure is reproducible
and suitable for a cross-sectional study such as this (Chard
et al., 2002). In the passive cerebral reserve hypothesis, TICV
is a putative index of cerebral reserve, and in the active model
education and/or occupational status are indicators of reserve.
We formulated tests of the reserve hypotheses as follows: if
the cerebral reserve hypothesis is correct, then the measure of
reserve should account for signi®cant variance in the
cognitive outcomes in old age after adjusting for variance
contributed by childhood mental ability and burden. In other
words, possessing some reserve means that one's cognitive
score is greater than would be predicted from the person's
childhood ability and the amount of overt, accumulated
burden.
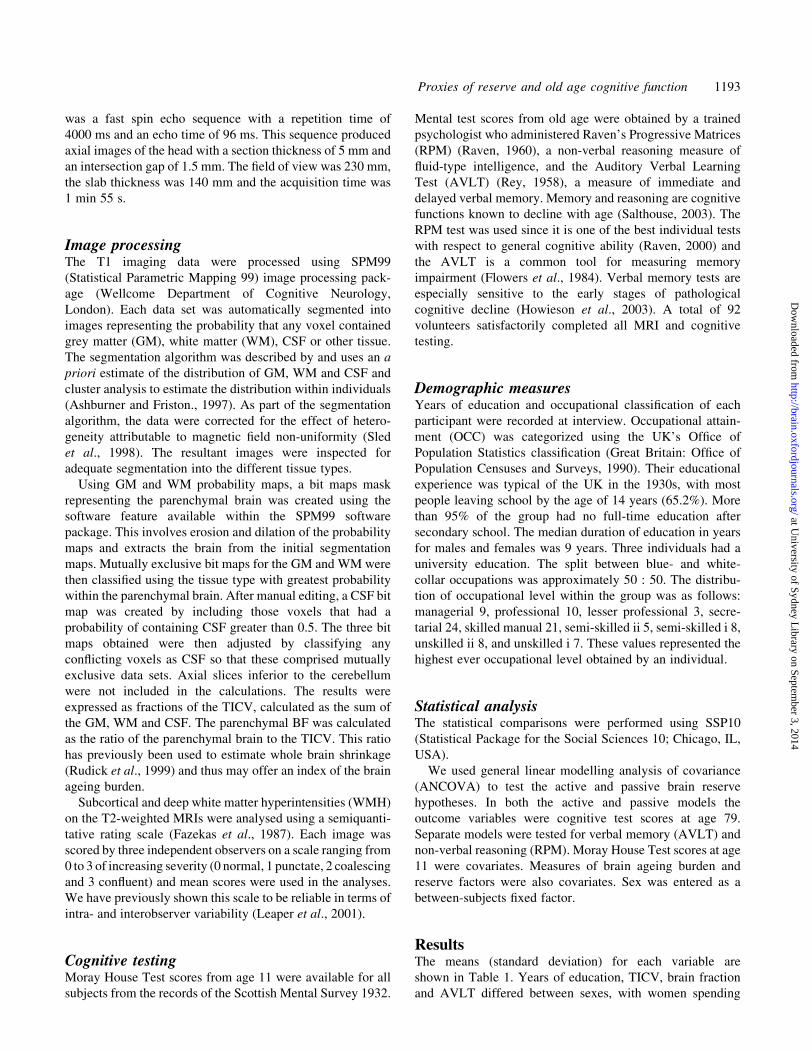
MethodSampleThe 1932 Scottish Mental Survey tested the cognitive ability
of most of the eligible Scottish children born in 1921
attending school on 1 June 1932 using a version of the Moray
House Test (MHT) (Scottish Council for Research in
Education, 1933). With the approval of the local ethics
committee, 235 of the local residents who took part in the
1932 survey were recruited into a prospective, longitudinal
study of brain ageing and health. From this sample, 144
subjects were randomly invited to undergo brain MRI
examination. Medical contraindications prevented 17 from
participating, 21 refused, and 106 volunteers (65 male and 41
female) were imaged. Eight were removed from the study (six
male and two female) because of excess movement during
acquisition of volumetric MRI data. Satisfactory MRI data
were obtained in a total of 98 volunteers. A sample derivation
¯ow chart is shown in Fig. 1.
MRI acquisitionSubjects were imaged using a 1 T Impact MRI scanner
(Siemens, Erlangen, Germany) and a RF head coil. The MRI
protocol consisted of two acquisitions: ®rst a T1-weighted
sequence, which was used to calculate the brain volume
measures, and then a T2-weighted sequence, which was used
to quantify white matter hyperintensities. The T1-weighted
sequence was a 3D-MP-RAGE (3D magnetization-prepared
rapid acquisition gradient echo) sequence. This sequence
produced 128 sagittal slices of the head with an effective
thickness of 1.41 mm. The repetition time was 11.4 ms, the
echo time was 4.4 ms, the RF ¯ip angle was 15°, the ®eld of
view was 250 mm, the slab thickness was 180 mm, and the
acquisition time was 6 min 7 s. The T2-weighted sequence
Fig. 1 A schematic ¯ow chart showing how our sample wasobtained from the original Scottish mental health survey of 1932.
1192 R. T. Staff et al.
at University of Sydney L
ibrary on September 3, 2014
http://brain.oxfordjournals.org/D
ownloaded from
was a fast spin echo sequence with a repetition time of
4000 ms and an echo time of 96 ms. This sequence produced
axial images of the head with a section thickness of 5 mm and
an intersection gap of 1.5 mm. The ®eld of view was 230 mm,
the slab thickness was 140 mm and the acquisition time was
1 min 55 s.
Image processingThe T1 imaging data were processed using SPM99
(Statistical Parametric Mapping 99) image processing pack-
age (Wellcome Department of Cognitive Neurology,
London). Each data set was automatically segmented into
images representing the probability that any voxel contained
grey matter (GM), white matter (WM), CSF or other tissue.
The segmentation algorithm was described by and uses an a
priori estimate of the distribution of GM, WM and CSF and
cluster analysis to estimate the distribution within individuals
(Ashburner and Friston., 1997). As part of the segmentation
algorithm, the data were corrected for the effect of hetero-
geneity attributable to magnetic ®eld non-uniformity (Sled
et al., 1998). The resultant images were inspected for
adequate segmentation into the different tissue types.
Using GM and WM probability maps, a bit maps mask
representing the parenchymal brain was created using the
software feature available within the SPM99 software
package. This involves erosion and dilation of the probability
maps and extracts the brain from the initial segmentation
maps. Mutually exclusive bit maps for the GM and WM were
then classi®ed using the tissue type with greatest probability
within the parenchymal brain. After manual editing, a CSF bit
map was created by including those voxels that had a
probability of containing CSF greater than 0.5. The three bit
maps obtained were then adjusted by classifying any
con¯icting voxels as CSF so that these comprised mutually
exclusive data sets. Axial slices inferior to the cerebellum
were not included in the calculations. The results were
expressed as fractions of the TICV, calculated as the sum of
the GM, WM and CSF. The parenchymal BF was calculated
as the ratio of the parenchymal brain to the TICV. This ratio
has previously been used to estimate whole brain shrinkage
(Rudick et al., 1999) and thus may offer an index of the brain
ageing burden.
Subcortical and deep white matter hyperintensities (WMH)
on the T2-weighted MRIs were analysed using a semiquanti-
tative rating scale (Fazekas et al., 1987). Each image was
scored by three independent observers on a scale ranging from
0 to 3 of increasing severity (0 normal, 1 punctate, 2 coalescing
and 3 con¯uent) and mean scores were used in the analyses.
We have previously shown this scale to be reliable in terms of
intra- and interobserver variability (Leaper et al., 2001).
Cognitive testingMoray House Test scores from age 11 were available for all
subjects from the records of the Scottish Mental Survey 1932.
Mental test scores from old age were obtained by a trained
psychologist who administered Raven's Progressive Matrices
(RPM) (Raven, 1960), a non-verbal reasoning measure of
¯uid-type intelligence, and the Auditory Verbal Learning
Test (AVLT) (Rey, 1958), a measure of immediate and
delayed verbal memory. Memory and reasoning are cognitive
functions known to decline with age (Salthouse, 2003). The
RPM test was used since it is one of the best individual tests
with respect to general cognitive ability (Raven, 2000) and
the AVLT is a common tool for measuring memory
impairment (Flowers et al., 1984). Verbal memory tests are
especially sensitive to the early stages of pathological
cognitive decline (Howieson et al., 2003). A total of 92
volunteers satisfactorily completed all MRI and cognitive
testing.
Demographic measuresYears of education and occupational classi®cation of each
participant were recorded at interview. Occupational attain-
ment (OCC) was categorized using the UK's Of®ce of
Population Statistics classi®cation (Great Britain: Of®ce of
Population Censuses and Surveys, 1990). Their educational
experience was typical of the UK in the 1930s, with most
people leaving school by the age of 14 years (65.2%). More
than 95% of the group had no full-time education after
secondary school. The median duration of education in years
for males and females was 9 years. Three individuals had a
university education. The split between blue- and white-
collar occupations was approximately 50 : 50. The distribu-
tion of occupational level within the group was as follows:
managerial 9, professional 10, lesser professional 3, secre-
tarial 24, skilled manual 21, semi-skilled ii 5, semi-skilled i 8,
unskilled ii 8, and unskilled i 7. These values represented the
highest ever occupational level obtained by an individual.
Statistical analysisThe statistical comparisons were performed using SSP10
(Statistical Package for the Social Sciences 10; Chicago, IL,
USA).
We used general linear modelling analysis of covariance
(ANCOVA) to test the active and passive brain reserve
hypotheses. In both the active and passive models the
outcome variables were cognitive test scores at age 79.
Separate models were tested for verbal memory (AVLT) and
non-verbal reasoning (RPM). Moray House Test scores at age
11 were covariates. Measures of brain ageing burden and
reserve factors were also covariates. Sex was entered as a
between-subjects ®xed factor.
ResultsThe means (standard deviation) for each variable are
shown in Table 1. Years of education, TICV, brain fraction
and AVLT differed between sexes, with women spending
Proxies of reserve and old age cognitive function 1193
at University of Sydney L
ibrary on September 3, 2014
http://brain.oxfordjournals.org/D
ownloaded from
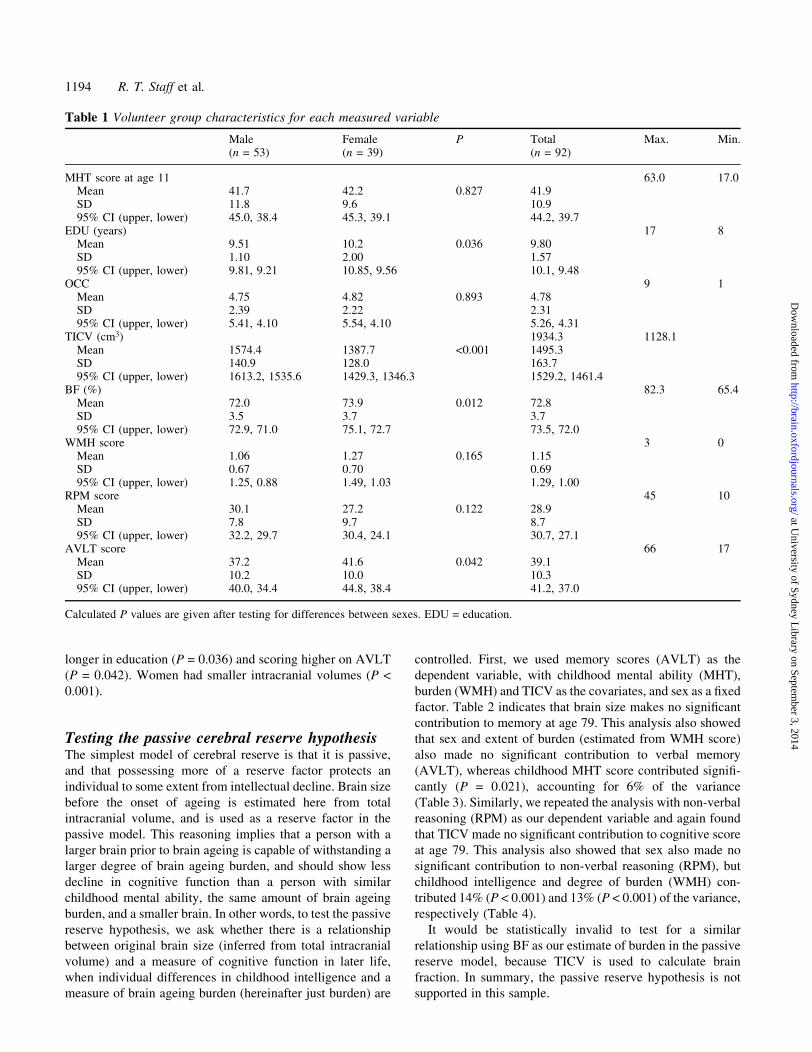
longer in education (P = 0.036) and scoring higher on AVLT
(P = 0.042). Women had smaller intracranial volumes (P <
0.001).
Testing the passive cerebral reserve hypothesisThe simplest model of cerebral reserve is that it is passive,
and that possessing more of a reserve factor protects an
individual to some extent from intellectual decline. Brain size
before the onset of ageing is estimated here from total
intracranial volume, and is used as a reserve factor in the
passive model. This reasoning implies that a person with a
larger brain prior to brain ageing is capable of withstanding a
larger degree of brain ageing burden, and should show less
decline in cognitive function than a person with similar
childhood mental ability, the same amount of brain ageing
burden, and a smaller brain. In other words, to test the passive
reserve hypothesis, we ask whether there is a relationship
between original brain size (inferred from total intracranial
volume) and a measure of cognitive function in later life,
when individual differences in childhood intelligence and a
measure of brain ageing burden (hereinafter just burden) are
controlled. First, we used memory scores (AVLT) as the
dependent variable, with childhood mental ability (MHT),
burden (WMH) and TICV as the covariates, and sex as a ®xed
factor. Table 2 indicates that brain size makes no signi®cant
contribution to memory at age 79. This analysis also showed
that sex and extent of burden (estimated from WMH score)
also made no signi®cant contribution to verbal memory
(AVLT), whereas childhood MHT score contributed signi®-
cantly (P = 0.021), accounting for 6% of the variance
(Table 3). Similarly, we repeated the analysis with non-verbal
reasoning (RPM) as our dependent variable and again found
that TICV made no signi®cant contribution to cognitive score
at age 79. This analysis also showed that sex also made no
signi®cant contribution to non-verbal reasoning (RPM), but
childhood intelligence and degree of burden (WMH) con-
tributed 14% (P < 0.001) and 13% (P < 0.001) of the variance,
respectively (Table 4).
It would be statistically invalid to test for a similar
relationship using BF as our estimate of burden in the passive
reserve model, because TICV is used to calculate brain
fraction. In summary, the passive reserve hypothesis is not
supported in this sample.
Table 1 Volunteer group characteristics for each measured variable
Male Female P Total Max. Min.(n = 53) (n = 39) (n = 92)
MHT score at age 11 63.0 17.0Mean 41.7 42.2 0.827 41.9SD 11.8 9.6 10.995% CI (upper, lower) 45.0, 38.4 45.3, 39.1 44.2, 39.7
EDU (years) 17 8Mean 9.51 10.2 0.036 9.80SD 1.10 2.00 1.5795% CI (upper, lower) 9.81, 9.21 10.85, 9.56 10.1, 9.48
OCC 9 1Mean 4.75 4.82 0.893 4.78SD 2.39 2.22 2.3195% CI (upper, lower) 5.41, 4.10 5.54, 4.10 5.26, 4.31
TICV (cm3) 1934.3 1128.1Mean 1574.4 1387.7 <0.001 1495.3SD 140.9 128.0 163.795% CI (upper, lower) 1613.2, 1535.6 1429.3, 1346.3 1529.2, 1461.4
BF (%) 82.3 65.4Mean 72.0 73.9 0.012 72.8SD 3.5 3.7 3.795% CI (upper, lower) 72.9, 71.0 75.1, 72.7 73.5, 72.0
WMH score 3 0Mean 1.06 1.27 0.165 1.15SD 0.67 0.70 0.6995% CI (upper, lower) 1.25, 0.88 1.49, 1.03 1.29, 1.00
RPM score 45 10Mean 30.1 27.2 0.122 28.9SD 7.8 9.7 8.795% CI (upper, lower) 32.2, 29.7 30.4, 24.1 30.7, 27.1
AVLT score 66 17Mean 37.2 41.6 0.042 39.1SD 10.2 10.0 10.395% CI (upper, lower) 40.0, 34.4 44.8, 38.4 41.2, 37.0
Calculated P values are given after testing for differences between sexes. EDU = education.
1194 R. T. Staff et al.
at University of Sydney L
ibrary on September 3, 2014
http://brain.oxfordjournals.org/D
ownloaded from
Testing the active cerebral reserve hypothesisThe active model of cerebral reserve was tested in the same
way. For each potential measure of reserve, a general linear
model was used to examine its association with the dependent
variable (AVLT or RPM) adjusting for childhood mental
ability and one of the brain ageing burden measures (WMH or
BF), with sex as a ®xed factor. Table 2 shows that occupation
contributes signi®cant variance to verbal memory (AVLT)
and non-verbal reasoning (RPM) scores (i.e. occupation acts
as a reserve factor) when BF is used as an estimate of burden,
and acts as a signi®cant reserve factor for non-verbal
reasoning, but not verbal memory, when WMH is used as
an estimate of brain ageing burden. Education acts as a
reserve factor for verbal memory but not non-verbal reason-
ing when either measure of the brain ageing burden is used.
Table 2 also shows that occupation contributes approximately
5% of the variance in memory function at age 79, and
between 5 and 8 % of the variance in non-verbal reasoning
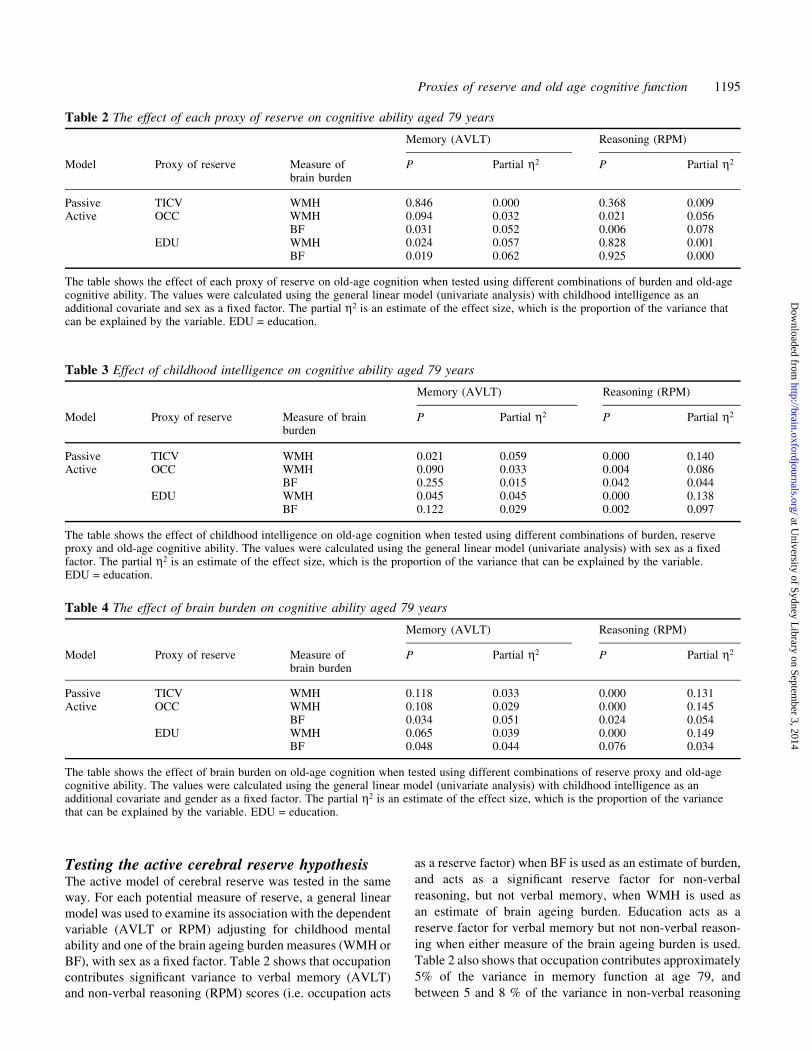
Table 3 Effect of childhood intelligence on cognitive ability aged 79 years
Memory (AVLT) Reasoning (RPM)
Model Proxy of reserve Measure of brainburden
P Partial h2 P Partial h2
Passive TICV WMH 0.021 0.059 0.000 0.140Active OCC WMH 0.090 0.033 0.004 0.086
BF 0.255 0.015 0.042 0.044EDU WMH 0.045 0.045 0.000 0.138
BF 0.122 0.029 0.002 0.097
The table shows the effect of childhood intelligence on old-age cognition when tested using different combinations of burden, reserveproxy and old-age cognitive ability. The values were calculated using the general linear model (univariate analysis) with sex as a ®xedfactor. The partial h2 is an estimate of the effect size, which is the proportion of the variance that can be explained by the variable.EDU = education.
Table 4 The effect of brain burden on cognitive ability aged 79 years
Memory (AVLT) Reasoning (RPM)
Model Proxy of reserve Measure ofbrain burden
P Partial h2 P Partial h2
Passive TICV WMH 0.118 0.033 0.000 0.131Active OCC WMH 0.108 0.029 0.000 0.145
BF 0.034 0.051 0.024 0.054EDU WMH 0.065 0.039 0.000 0.149
BF 0.048 0.044 0.076 0.034
The table shows the effect of brain burden on old-age cognition when tested using different combinations of reserve proxy and old-agecognitive ability. The values were calculated using the general linear model (univariate analysis) with childhood intelligence as anadditional covariate and gender as a ®xed factor. The partial h2 is an estimate of the effect size, which is the proportion of the variancethat can be explained by the variable. EDU = education.
Table 2 The effect of each proxy of reserve on cognitive ability aged 79 years
Memory (AVLT) Reasoning (RPM)
Model Proxy of reserve Measure ofbrain burden
P Partial h2 P Partial h2
Passive TICV WMH 0.846 0.000 0.368 0.009Active OCC WMH 0.094 0.032 0.021 0.056
BF 0.031 0.052 0.006 0.078EDU WMH 0.024 0.057 0.828 0.001
BF 0.019 0.062 0.925 0.000
The table shows the effect of each proxy of reserve on old-age cognition when tested using different combinations of burden and old-agecognitive ability. The values were calculated using the general linear model (univariate analysis) with childhood intelligence as anadditional covariate and sex as a ®xed factor. The partial h2 is an estimate of the effect size, which is the proportion of the variance thatcan be explained by the variable. EDU = education.
Proxies of reserve and old age cognitive function 1195
at University of Sydney L
ibrary on September 3, 2014
http://brain.oxfordjournals.org/D
ownloaded from
function at that age. Similarly, education contributes 6% of
the memory variance but has no signi®cant effect on non-
verbal reasoning. In summary, the active reserve hypothesis is
supported and its effect size is moderate.
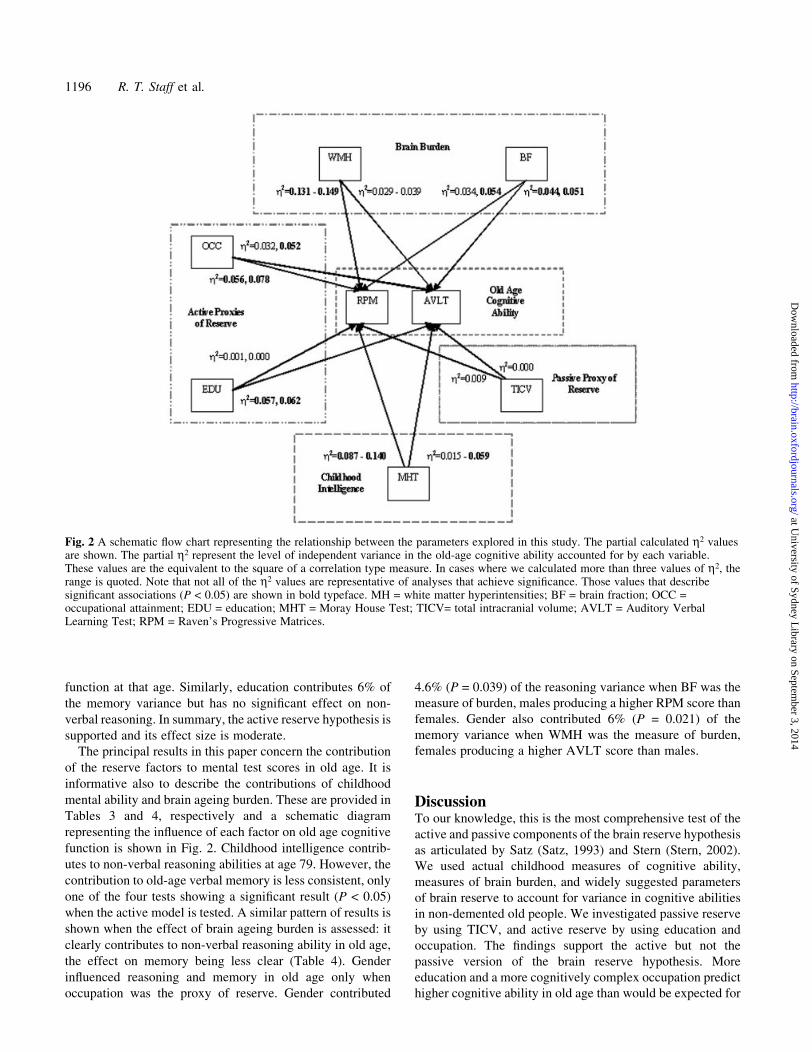
The principal results in this paper concern the contribution
of the reserve factors to mental test scores in old age. It is
informative also to describe the contributions of childhood
mental ability and brain ageing burden. These are provided in
Tables 3 and 4, respectively and a schematic diagram
representing the in¯uence of each factor on old age cognitive
function is shown in Fig. 2. Childhood intelligence contrib-
utes to non-verbal reasoning abilities at age 79. However, the
contribution to old-age verbal memory is less consistent, only
one of the four tests showing a signi®cant result (P < 0.05)
when the active model is tested. A similar pattern of results is
shown when the effect of brain ageing burden is assessed: it
clearly contributes to non-verbal reasoning ability in old age,
the effect on memory being less clear (Table 4). Gender
in¯uenced reasoning and memory in old age only when
occupation was the proxy of reserve. Gender contributed
4.6% (P = 0.039) of the reasoning variance when BF was the
measure of burden, males producing a higher RPM score than
females. Gender also contributed 6% (P = 0.021) of the
memory variance when WMH was the measure of burden,
females producing a higher AVLT score than males.
DiscussionTo our knowledge, this is the most comprehensive test of the
active and passive components of the brain reserve hypothesis
as articulated by Satz (Satz, 1993) and Stern (Stern, 2002).
We used actual childhood measures of cognitive ability,
measures of brain burden, and widely suggested parameters
of brain reserve to account for variance in cognitive abilities
in non-demented old people. We investigated passive reserve
by using TICV, and active reserve by using education and
occupation. The ®ndings support the active but not the
passive version of the brain reserve hypothesis. More
education and a more cognitively complex occupation predict
higher cognitive ability in old age than would be expected for
Fig. 2 A schematic ¯ow chart representing the relationship between the parameters explored in this study. The partial calculated h2 valuesare shown. The partial h2 represent the level of independent variance in the old-age cognitive ability accounted for by each variable.These values are the equivalent to the square of a correlation type measure. In cases where we calculated more than three values of h2, therange is quoted. Note that not all of the h2 values are representative of analyses that achieve signi®cance. Those values that describesigni®cant associations (P < 0.05) are shown in bold typeface. MH = white matter hyperintensities; BF = brain fraction; OCC =occupational attainment; EDU = education; MHT = Moray House Test; TICV= total intracranial volume; AVLT = Auditory VerbalLearning Test; RPM = Raven's Progressive Matrices.
1196 R. T. Staff et al.
at University of Sydney L
ibrary on September 3, 2014
http://brain.oxfordjournals.org/D
ownloaded from
a person's childhood ability and accumulated brain burden.
Possession of a bigger brain in earlier life conferred no such
reserve.
The passive model, with head size as the potential proxy of
reserve, has been investigated with con¯icting results (Graves
et al., 1996; Jack et al., 1997; Mori et al., 1997; Scho®eld
et al., 1997; Jenkins et al., 2000). Scho®eld and colleagues
(Scho®eld et al., 1997) reported that old people with smaller
head sizes were more likely to have Alzheimer's disease,
whereas Jenkins and colleagues (Jenkins et al., 2000) found
that larger head size did not delay the onset of Alzheimer's
disease. These reports were not able to control for measured
premorbid cognitive ability, and do not attempt to assess the
effect of brain burden as a potential confounding variable. We
used white matter hyperintensity lesion score as a measure of
burden. These lesions are often associated with changes in
brain blood vessels. Numerous reports (Double et al., 1996;
Fox and Freeborough, 1997; Mouton et al., 1998; Leaper
et al., 2001) have found relationships between the measures
of burden used here (WMH and BF) and cognitive ability in
old age. Currently, a complex model of the summative effects
of this cerebrovascular pathology, the density of plaques and
tangles of Alzheimer's disease, and the amount of reserve
seems best placed to explain the threshold between brain
ageing and dementia (Esiri et al., 2001; Whalley, 2002). We
have found that bigger brains do not act as a proxy of reserve
in terms of the passive model for reserve mediation. The
result does not refute the passive model as a whole but shows
that TICV is not a proxy for passive reserve in this sample.
Alternative proxies could include synaptic count, which is not
necessarily re¯ected in total or regional brain size. It may be
that the size of speci®c brain structures, such as the
hippocampus, could be a proxy of passive reserve and these
should be considered in the design of future studies. An
alternative explanation for TICV not acting as a proxy of
reserve is that head size is a poor predictor of performance.
Further, in the largest study of brain size and cognition
conducted to date, the association between memory and brain
size was to overall size and not to speci®c regions. Also, the
memory contribution operated via the general cognitive
factor (MacLullich et al., 2002).
Investigations into the relationship between demographic
measures and cognitive function in later life have show
signi®cant correlations (Snowdon et al., 1989; Plassman et al.,
1995; Kidron et al., 1997; Coffey et al., 1999). Studies have
suggested that education and occupational status contribute
independently to reserve (Mortel et al., 1995). This study
shows relationships between memory (AVLT) and education,
memory and occupation, reasoning (RPM) and occupation,
but not reasoning and education. This raises the possibility
that different life experiences may contribute to the reserve of
different cognitive domains. It may also re¯ect the nature of
the education received in the 1920s and 1930s, when there
was a greater emphasis on verbatim learning rather than
problem-solving. The neurobiological correlates of higher
educational attainment and occupational complexity are
uncertain but neurodevelopmental studies in animals suggest
that exposure to an enriched or more stimulating environment
before completion of sexual maturation is associated with
greater synaptic density and more complex neocortical
interneuronal connections (Rapp and Bachevalier, 2003). In
later life, synaptic density falls in the frontal cortex and this
fall is greater in early Alzheimer's disease (Small et al.,
2001). It is plausible, therefore, that the detection of roles for
education and occupation in this study points to differences in
synaptic function as the underlying source of variance in
active reserve.
A possible explanation for the correlation between demo-
graphic measures such as education and occupation and
decline in old age is that those of lower of socio-economic
status might have an increased risk of toxic or environmental
exposures, nutritional de®ciencies and/or perinatal insult
(Katzman, 1993). These issues are confounded by the well-
established roles of education and occupation as risk factors
for many multifactorial, late-onset diseases, especially
ischaemic vascular disease (Hemingway and Marmot, 1999)
and Alzheimer's disease (Stern et al., 1994). Many reports
suggest that low educational attainment is associated with
increased dementia risk and there are clear socio-economic
gradients with risk of ischaemic vascular disease (Katzman,
1993; Mortimer and Graves. 1993; Mortel et al., 1995; Qiu
et al., 2001). These associations point to complex inter-
relations occurring at several levels between late life
cognitive function, cerebrovascular disease and differences
in education and occupation. Controlling for all potential risk
factors is a dif®cult undertaking. In this study education had
signi®cant predictive value after we controlled for estimates
of the brain burden of cerebrovascular pathology, the latter
possibly recording life-long environmental exposure.
Potential criticisms of this study are related to sample size
and bias, particularly survival bias; that is, only those who
survived to 1999±2000 were able to participate. Our MRI
sample was drawn from the larger 1921 Aberdeen sample.
The fact that we investigated healthy survivors creates an
unavoidable bias in the imaged group. The general population
would contain those ageing less successfully who potentially
have a greater degree of brain burden. There is an additional
potential for bias attributable to those excluded for medical
contraindications such as the presence of a cardiac pace-
maker, a tremor involving the head and neck and other
conditions that would not allow them to be imaged. Arguably,
this group has a greater potential for vascular disease and
would exhibit a larger level of brain burden. Similarly, those
who refused to be imaged or who were eliminated due to
excessive movement during acquisition potentially have a
greater degree of burden, which would bias our results. The
net result would be to lower the effect sizes with regard to
those expected in a more representative sample. The imaging
protocol, processing and analysis tools used in this study are
straightforward and the software used is available in the
public domain. It is possible that the use of different imaging
protocols of more elaborate forms of processing and image
Proxies of reserve and old age cognitive function 1197
at University of Sydney L
ibrary on September 3, 2014
http://brain.oxfordjournals.org/D
ownloaded from
classi®cation techniques may produce results that are more
sensitive.
ConclusionThe maintenance of cognitive function in old age has become
increasingly desirable to society with an ageing population.
This work investigates a range of potential factors that
contribute to cognitive function in old age, based around the
concept of the reserve hypothesis. We found no evidence of
reserve being implemented through a passive process, with
TICV as a measure of reserve capacity. The results show that
education and occupation can be considered as proxies of
active reserve. Our results suggest that these two measures of
active reserve in¯uence different cognitive domains to
varying extents.
AcknowledgementsThe authors would like to thank S. A. Leaper, H. A. Lemmon,
A. Lyburn, L. Frisch and J. Walker for their help during this
project. The project was funded by a grant from the Chief
Scientist Of®ce of the Scottish Executive. I.J.D. is the
recipient of a Royal Society-Wolfson Research merit award.
L.J.W. holds a Career Development Award from the
Wellcome Trust.
References
Abate G, Ferrari-Ramondo V, Di Iorio A. Risk factors for cognitive
disorders in the elderly: a review. Arch Gerontol Geriatr 1998 26 Suppl 1;
7±15.
Ashburner J, Friston K. Multimodal image coregistration and partitioningÐa
uni®ed framework. Neuroimage 1997; 6: 209±17.
Bigio EH, Hynan LS, Sontag E, Satumtira S, White CL. Synapse loss is
greater in presenile than senile onset Alzheimer disease: implications for
the cognitive reserve hypothesis. Neuropathol Appl Neurobiol 2002; 28:
218±27.
Blatter DD, Bigler ED, Gale SD, Johnson SC, Anderson CV, Burnett BM,
et al. Quantitative volumetric-analysis of brain MRÐnormative database
spanning 5 decades of life. AJNR Am J Neuroradiol 1995; 16: 241±51.
Bowirrat A, Friedland RP, Farrer L, Baldwin C, Korczyn A. Genetic and
environmental risk factors for Alzheimer's disease in Israeli Arabs. J Mol
Neurosci 2002; 19: 239±45.
Chard DT, Parker GJM, Grif®n CMB, Thompson AJ, Miller DH. The
reproducibility and sensitivity of brain tissue measurements derived from
an SPM-based segmentation methodology. J Magn Reson Imaging 2002;
15: 259±67.
Coffey CE, Saxton JA, Ratcliff G, Bryan RN, Lucke JF. Relation of
education to brain size in normal aging: implications for the reserve
hypothesis. Neurology 1999; 53: 189±96.
Deary IJ, Whalley LJ, Lemmon H, Crawford JR, Starr JM. The stability of
individual differences in mental ability from childhood to old age: follow-
up of the 1932 Scottish Mental Survey. Intelligence 2000; 28: 49±55.
Deary IJ, Whiteman MC, Pattie A, Starr JM, Hayward C, Wright AF, et al.
Cognitive change and the APOE epsilon 4 allele. Nature 2002; 418: 932.
Deary IJ, Leaper SA, Murray AD, Staff RT, Whalley LJ. Cerebral white
matter abnormalities and lifetime cognitive change: a 67-year follow-up
of the Scottish Mental Survey of 1932. Psychol Aging 2003; 18: 140±8.
Double KL, Halliday GM, Kril JJ, Harasty JA, Cullen K, Brooks WS, et al.
Topography of brain atrophy during normal aging and Alzheimer's
disease. Neurobiol Aging 1996; 17: 513±21.
Esiri MM, Matthews F, Brayne C, Ince PG. Pathological correlates of late-
onset dementia in a multicentre, community-based population in England
and Wales. Lancet 2001; 357: 169±75.
Fazekas F, Chawluk JB, Alavi A, Hurtig HI, Zimmerman RA. MR signal
abnormalities at 1.5-T in Alzheimer's dementia and normal aging. AJR
Am J Roentgenol 1987; 149: 351±6.
Flowers KA, Pearce I, Pearce JMS. Recognition memory in Parkinson's
disease. J Neurol Neurosurg Psychiatry 1984; 47: 1174±81.
Fox NC, Freeborough PA. Brain atrophy progression measured from
registered serial MRI: validation and application to Alzheimer's disease. J
Magn Reson Imaging 1997; 7: 1069±75.
Graves AB, Mortimer JA, Larson EB, Wenzlow A, Bowen JD, McCormick
WC. Head circumference as a measure of cognitive reserve. Association
with severity of impairment in Alzheimer's disease. Br J Psychiatry 1996;
169: 86±92.
Great Britain: Of®ce of Population Censuses and Surveys. Standard
occupational classi®cation. London: HMSO; 1990.
Hemingway H, Marmot M. Evidence based cardiology: psychosocial factors
in the aetiology and prognosis of coronary heart disease: systematic
review of prospective cohort studies. BMJ 1999; 318: 1460±7.
Howieson DB, Camicioli R, Quinn J, Sibert LC, Care B, Moore MM, et al.
Natural history of cognitive decline in the old old. Neurology 2003; 60:
1489±94.
Jack CR Jr, Petersen RC, Xu YC, Waring SC, O'Brien PC,Tangalos EG,
et al. Medial temporal atrophy on MRI in normal aging and very mild
Alzheimer's disease. Neurology 1997; 49: 786±94.
Jenkins R, Fox NC, Rossor AM, Harvey RJ, Rossor MN. Intracranial volume
and Alzheimer disease: evidence against the cerebral reserve hypothesis.
Arch Neurol 2000; 57: 220±224.
Katzman R. Education and the prevalence of dementia and Alzheimer's
disease. Neurology 1993; 43: 13±20.
Katzman R, Aronson M, Fuld P, Kawas C, Brown T, Morgenstern H, et al.
Development of dementing illnesses in an 80-year-old volunteer cohort.
Ann Neurol 1989; 25: 317±24.
Kidron D, Black SE, Stanchev P, Buck B, Szalai JP, Parker J, et al.
Quantitative MR volumetry in Alzheimer's disease. Topographic markers
and the effects of sex and education. Neurology 1997; 49: 1504±12.
Leaper SA, Murray AD, Lemmon HA, Staff RT, Deary IJ, Crawford JR,
et al. Neuropsychologic correlates of brain white matter lesions depicted
on MR images: 1921 Aberdeen Birth Cohort. Radiology 2001; 221: 51±5.
MacLullich AMJ, Ferguson KJ, Deary IJ, Seckl JR, Starr JM, Wardlaw JM.
Intracranial capacity and brain volumes are associated with cognition in
healthy elderly men. Neurology 2002; 59: 169±74.
Meguro K, Shimada M, Yamaguchi S, Ishizaki J, Ishii H, Shimada Y, et al.
Cognitive function and frontal lobe atrophy in normal elderly adults:
implications for dementia not as aging-related disorders and the reserve
hypothesis. Psychiatry Clin Neurosci 2001; 55: 565±72.
Mori E, Hirono N, Yamashita H, Imamura T, Ikejiri Y, Ikeda M, et al.
Premorbid brain size as a determinant of reserve capacity against
intellectual decline in Alzheimer's disease. Am J Psychiatry 1997; 154:
18±24.
Mortel KF, Meyer JS, Herod B, Thornby J. Education and occupation as risk
factors for dementias of the Alzheimer and ischemic vascular types.
Dementia 1995; 6: 55±62.
Mortimer JA, Graves AB. Education and other socioeconomic determinants
of dementia and Alzheimer's disease. Neurology 1993; 43 Suppl 4: S39±
S44.
Mouton PR, Martin LJ, Calhoun ME, Dal Forno G, Price DL. Cognitive
decline strongly correlates with cortical atrophy in Alzheimer's dementia.
Neurobiol Aging 1998; 19: 371±7.
Neuropathology Group. Medical Research Council Cognitive Function and
Aging Study. Pathological correlates of late-onset dementia in a
multicentre, community-based population in England and Wales. Lancet
2001; 357: 169±75.
Perls T, Kunkel LM, Puca AA. The genetics of exceptional human
longevity. J Mol Neurosci 2002; 19: 233±8.
Plassman BL, Welsh KA, Helms M, Brandt J, Page WF, Breitner JCS.
1198 R. T. Staff et al.
at University of Sydney L
ibrary on September 3, 2014
http://brain.oxfordjournals.org/D
ownloaded from
Intelligence and education as predictors of cognitive state in late-life: a
50-year follow-up. Neurology 1995; 45: 1446±50.
Qiu CX, Backman L, Winblad B, Aguero-Torres H, Fratiglioni L. The
in¯uence of education on clinically diagnosed dementia incidence and
mortality data from the Kungsholmen Project. Arch Neurol 2001; 58:
2034±9.
Rapp PR, Bachevalier J. Cognitive development and ageing. In: Squire LR,
Bloom FE, McConnell SK, Roberts JL, Spitzeer NC, Zigmond MJ,
editors. Fundamental neuroscience. 2nd ed. San Diego: Academic Press,
2003. p. 1167±200.
Raven JC. Guide to the standard progressive matrices. London: H. K. Lewis;
1960.
Raven J. The Raven's progressive matrices: change and stability over culture
and time. Cogn Psychol 2000; 41: 1±48.
Rey A. L'examen clinique en psychologie. Paris: Presses Universitaire de
France; 1958.
Rudick RA, Fisher E, Lee JC, Simon J, Jacobs L. Use of the brain
parenchymal fraction to measure whole brain atrophy in relapsing-
remitting MS. Neurology 1999; 53: 1698±704.
Salthouse TA. Memory aging from 18 to 80. Alzheimer Dis Assoc Disord
2003; 17: 162±7.
Satz P. Brain reserve capacity on symptom onset after brain injury: a
formulation and review of evidence for threshold theory.
Neuropsychology 1993; 7: 273±95.
Scho®eld PW, Logroscino G, Andrews HF, Albert S, Stern Y. An
association between head circumference and Alzheimer's disease in a
population-based study of aging and dementia. Neurology 1997; 49: 30±7.
Scottish Council for Research in Education. The intelligence of Scottish
school children: a national survey of an age-group. London: University of
London Press; 1933.
Sled JG, Zijdenbos AP, Evans AC. A nonparametric method for automatic
correction of intensity nonuniformity in MRI data. IEEE Trans Med
Imaging 1998; 17: 87±97.
Small DH, Mok SS, Bornstein JC. Alzheimer's disease and Abeta toxicity:
from top to bottom. Nat Rev Neurosci 2001; 2: 595±8.
Snowdon DA, Ostwald SK, Kane RL. Education, survival, and independence
in elderly catholic sisters, 1936±1988. Am J Epidemiol 1989; 130: 999±
1012.
Stern Y. What is cognitive reserve? Theory and research application of the
reserve concept. J Int Neuropsychol Soc 2002; 8: 448±60.
Stern Y, Gurland B, Tatemichi TK, Tang MX, Wilder D, Mayeux R.
In¯uence of education and occupation on the incidence of Alzheimer's
disease. JAMA 1994; 271: 1004±10.
United Kingdom Of®ce of Population Statistics classi®cation. The
Classi®cation of Occupations. HMSO, London, 1990.
Whalley LJ. Brain ageing and dementia: what makes the difference? Br J
Psychiatry 2002; 181: 369±71.
Willerman L, Loehlin JC, Horn JM. A 10-year follow-up of adoptees whose
biological mothers had differed greatly in Iq. Behav Genet 1990; 20: 754.
Proxies of reserve and old age cognitive function 1199
at University of Sydney L
ibrary on September 3, 2014
http://brain.oxfordjournals.org/D
ownloaded from