Embed Size (px)
Citation preview
International Journal for the Scholarship ofTeaching and Learning
Volume 1 | Number 1 Article 7
1-2007
What Motivates Students to Provide Feedback toTeachers About Teaching and Learning? AnExpectancy Theory PerspectiveJohnette CaulfieldMarquette University, [email protected]
Recommended CitationCaulfield, Johnette (2007) "What Motivates Students to Provide Feedback to Teachers About Teaching and Learning? An ExpectancyTheory Perspective," International Journal for the Scholarship of Teaching and Learning: Vol. 1: No. 1, Article 7.Available at: https://doi.org/10.20429/ijsotl.2007.010107

What Motivates Students to Provide Feedback to Teachers AboutTeaching and Learning? An Expectancy Theory Perspective
AbstractThe purpose of this empirical research study was to investigate what motivates students to provide formativeanonymous feedback to teachers regarding their perceptions of the teaching and learning experience in orderto improve student learning. Expectancy theory, specifically Vroom’s Model, was used as the conceptualframework for the study. Multiple regression analysis was employed to test both the valence and forceequations. Statistically significant results indicated that students’ motivation was dependent upon theimportance to them of improving the value of the class and of future classes, and the expectation that theirformative feedback would lead to increased value for them, their peers in the classroom and for students infuture classes. Based on these findings, it is important for teachers who request students to participate inproviding anonymous feedback to emphasize that this feedback is a valuable tool to assist in improvingcurrent and future teaching and learning experiences.
KeywordsStudent evaluations of teaching, Expectancy theory of motivation, Victor Vroom, Vroom's expectancy model
What Motivates Students to Provide Feedback to Teachers
About Teaching and Learning? An Expectancy Theory Perspective
Jay Caulfield Marquette
University Milwaukee,
Wisconsin, USA
Abstract
The purpose of this empirical research study was to investigate what motivates students to
provide formative anonymous feedback to teachers regarding their perceptions of the
teaching and learning experience in order to improve student learning. Expectancy theory,
specifically Vroom’s Model, was used as the conceptual framework for the study. Multiple
regression analysis was employed to test both the valence and force equations. Statistically
significant results indicated that students’ motivation was dependent upon the importance
to them of improving the value of the class and of future classes, and the expectation that
their formative feedback would lead to increased value for them, their peers in the
classroom and for students in future classes. Based on these findings, it is important for
teachers who request students to participate in providing anonymous feedback to
emphasize that this feedback is a valuable tool to assist in improving current and future
teaching and learning experiences.
Introduction
Much attention has been given to student evaluations of teaching in higher education, and
there are a number of studies that investigate the value of this practice (Aleamoni, 1999;
Giles, Martin, Bryce & Hendry, 2004; Goldstein & Benassi, 2006; Hativa, 1996; Martin,
1987; Melland, 1996; Kohlan, 1973), which has now become very common on American
campuses. This type of evaluation is most often completed at the close of the course and is
frequently linked to future tenure and promotion decisions. Although much has been
published about the value of student feedback, including what to ask students about their
teaching and learning experience (Brown & Race, 1995; Race, 2000), very little has been
written about what motivates students to provide anonymous feedback to the teacher
frequently throughout the semester. This type of formative assessment may often be used
by the teacher to make improvements in the course almost immediately for the purpose of
improving student learning.
1
IJ-SoTL, Vol. 1 [2007], No. 1, Art. 7
https://doi.org/10.20429/ijsotl.2007.010107

Student feedback has been identified as one of the most important considerations when
assessing teaching (Race, 2000), and research findings indicate that adult students are
fairly good evaluators of their own learning (Giese, 2006; Kerka, 1997; Knowles, Holton &
Swanson, 1998). Therefore knowing what motivates students to provide this type of “just-
in-time” anonymous feedback is an important question to investigate. Obtaining feedback
from students provides teachers with opportunities to improve the classroom teaching and
learning experience while it is occurring. If research can help determine under what
conditions students are motivated to provide meaningful feedback to teachers in order to
improve student learning, then teachers have the opportunity to better ensure that those
conditions exist in the classroom.
Expectancy Theory of Motivation
Over the past sixty years, numerous researchers have published findings on various
applications of expectancy theory of motivation (Atkinson, 1964; Bonner & Sprinkle, 2002;
Chen & Lou, 2004; DeSanctis, 1983; Edwards, 1961; Lawler, 1973; Lewin, 1947; Tolman, 1959; Vroom, 1964; Walker & Johnson, 1999), indicating continued interest in the theory
and its ability to predict what motivates us to behave in certain ways. Expectancy theory
purports that we are motivated to behave in a certain way dependent upon the strength of
the belief that (1) specific behaviors will result in specific outcomes, (2) our confidence in the
belief that we are capable of achieving those outcomes and (3) that those outcomes have
varying degrees of attractiveness dependent upon our perception that achieving the
outcome will lead to attaining a second level outcome. First level outcomes are behaviors
that help to attain the more desirable second level outcomes. As an example, a sales person
may strongly believe that if she meets her sales target (specific behavior), she will receive a
substantial bonus (first level outcome) resulting in her ability to take a vacation in Hawaii
(second level outcome). Because of the attractiveness of the Hawaii vacation (second level
outcome) and because she is fairly confident that she can achieve the sales target (first
level outcome), she is willing to put forth a substantial amount of force (she is motivated) to
achieve the first level outcome, which she believes will enable her to achieve the more
desirable second level outcome. As an application of expectancy theory, Victor Vroom’s expectancy model (1964) is one of
the most widely accepted and researched models in the field of work motivation (Donovan,
2001). Several research studies indicate that the model is a fairly good predictor of motivation (Arnold, 1981; Chen & Lou, 2004; Donovan, 2001; Parker, 2000; Porter &
Lawler, 1968), although it does have its critics (Campbell & Pritchard, 1976; Mitchell, 1974; Pinder, 1987). Much of the criticism is a result of what some have described as an
inappropriate application of the model, which is likely to underestimate the predictive
validity of the theory (Donovan, 2001). According to some researchers (Campbell &
Pritchard, 1976; Mitchell, 1974; Pinder, 1987), the model is intended to be a within subjects
design versus an across subjects design; to date many studies have used an across subjects
design (Graen, 1969; Jorgenson, Dunette & Pritchard, 1973). Vroom (1964) himself,
identifies a number of approaches to measure the constructs in his model including multiple
regression analysis, indicating that more than one type of research design may be
appropriate when applying his model. As multiple regression analysis was used in this
study, the criticisms regarding across subjects design are not applicable to this study.
2
What Motivates Students to Provide Feedback to Teachers
https://doi.org/10.20429/ijsotl.2007.010107

Expectancy theory was applied in this study to investigate the motivational factors that may
contribute to students providing anonymous feedback to teachers. Expectancy theory has
been more effective in predicting motivation when the subjects being studied had more
discretion in performing a task (Robbins, 2005). Thus, as students have complete discretion
in whether or not they choose to provide anonymous feedback to teachers, expectancy
theory would seem to be a good choice in predicting students’ motivation for doing so.
Research Questions Vroom’s model of expectancy theory was used to determine retrospectively what second
level outcomes students believed would be attained by providing anonymous evaluative
feedback (first level outcome) regarding the teaching and learning experience. In other
words, the purpose of the study was to determine what attracted students in providing
anonymous evaluative feedback by asking those students who had stated that they had
already done so to identify why they had done so in order to better predict what would
motivate future students to provide similar feedback. For this study, the research questions are stated as follows:
1. Are the expectancy theory constructs as defined in Vroom’s model of expectancy
theory a good predictor of what motivates students to participate in providing
anonymous evaluative feedback to a teacher regarding the teaching and learning
experience?
2. From those perceived outcomes identified by students, which are the ones that are
likely to motivate students to provide anonymous feedback to a teacher in order that
student learning may be improved?
Vroom’s Model
The much earlier work of Tolman (1959) is at least part of the theoretical foundation on
which Vroom’s expectancy model is built. According to Tolman, expectancy theory is based
on the assumption that we consciously make choices regarding the actions we take based on perceived outcomes associated with those actions and based on the perceived probability
of obtaining the outcomes. According to Vroom (1964), his model is comprised of two
related propositions: the valence model and the force model, represented mathematically as
follows.
The Valence Model
n
Vj = Σ (Vk * Ijk) j-1
Where:
Vj = valence or overall attractiveness of first level outcome j;
3
IJ-SoTL, Vol. 1 [2007], No. 1, Art. 7
https://doi.org/10.20429/ijsotl.2007.010107
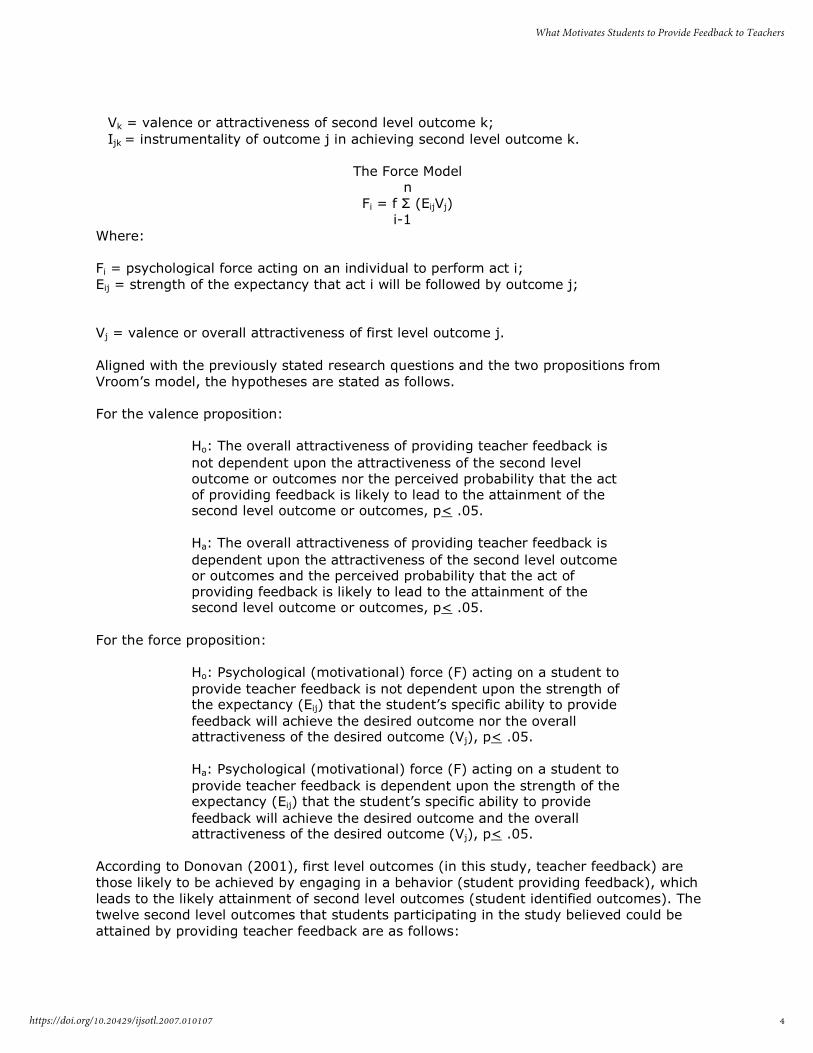
Vk = valence or attractiveness of second level outcome k;
Ijk = instrumentality of outcome j in achieving second level outcome k. Where:
The Force Model n
Fi = f Σ (EijVj) i-1
Fi = psychological force acting on an individual to perform act i;
Eij = strength of the expectancy that act i will be followed by outcome j;
Vj = valence or overall attractiveness of first level outcome j.
Aligned with the previously stated research questions and the two propositions from
Vroom’s model, the hypotheses are stated as follows.
For the valence proposition:
Ho: The overall attractiveness of providing teacher feedback is
not dependent upon the attractiveness of the second level outcome or outcomes nor the perceived probability that the act of providing feedback is likely to lead to the attainment of the second level outcome or outcomes, p< .05.
Ha: The overall attractiveness of providing teacher feedback is
dependent upon the attractiveness of the second level outcome or outcomes and the perceived probability that the act of providing feedback is likely to lead to the attainment of the second level outcome or outcomes, p< .05.
For the force proposition:
Ho: Psychological (motivational) force (F) acting on a student to
provide teacher feedback is not dependent upon the strength of the expectancy (Eij) that the student’s specific ability to provide
feedback will achieve the desired outcome nor the overall attractiveness of the desired outcome (Vj), p< .05.
Ha: Psychological (motivational) force (F) acting on a student to
provide teacher feedback is dependent upon the strength of the expectancy (Eij) that the student’s specific ability to provide
feedback will achieve the desired outcome and the overall attractiveness of the desired outcome (Vj), p< .05.
According to Donovan (2001), first level outcomes (in this study, teacher feedback) are
those likely to be achieved by engaging in a behavior (student providing feedback), which
leads to the likely attainment of second level outcomes (student identified outcomes). The
twelve second level outcomes that students participating in the study believed could be
attained by providing teacher feedback are as follows:
4
What Motivates Students to Provide Feedback to Teachers
https://doi.org/10.20429/ijsotl.2007.010107

1. Help future students who are taking the same class.
2. Help improve the management of the current class.
3. Opportunity to discuss feedback in class.
4. May improve my grade.
5. May improve course content.
6. Decrease time spent on non-value added work.
7. Improve the method of course content delivery.
8. No fear of negative repercussions related to my responses.
9. Show respect for my professor.
10. Show respect for my colleagues in the class.
11. Increase the value of the class.
12. Reduce the work required for the course.
The diagram below illustrates the specific application of the valence and force propositions
in this study.
Methodology There is a fair amount of discussion in the literature about how to identify second level
outcomes (Donovan, 2001; Mitchell, 1974; Vroom, 1964); predominantly, two methods of
identification are discussed. The first involves having the researcher identify the outcomes
based on intuition and what is known about the outcomes from the literature. Here the
challenge is one of successful identification of the correct outcomes while not omitting ones
of significance. The second method discussed is having the subjects, themselves,
individually identify a list of outcomes. The challenge here is one of interpreting and
5
IJ-SoTL, Vol. 1 [2007], No. 1, Art. 7
https://doi.org/10.20429/ijsotl.2007.010107

managing the volume of data. For this study, a modification of the second method of
identifying outcomes was employed. Fifty graduate students from two universities who had previously participated in providing
anonymous feedback to the teacher through the use of a course management system were
asked to identify the second level outcomes that they associated with providing that
feedback. During class, they worked in groups of four to six using a brainstorming technique
to identify the second level outcomes that they believed had been attained by previously
providing that anonymous teacher feedback. Through discussion, each group eliminated any
duplicate outcomes they had identified. These same students then assembled in two larger
groups of 25 to evaluate the second level outcomes identified by the smaller groups. Following student discussion, outcomes that students found to be duplicative were
eliminated. The two lists of remaining outcomes from each group of 25 were then
compared; again, through student discussion any duplicate outcomes were eliminated. At
this point, 19 second level outcomes remained. Then, each of the 19 outcomes was placed
on a flip chart and each of the 50 students was given 15 self-adhesive dots to assign to the
remaining 19 outcomes according to how attractive they perceived each outcome to be;
students individually assigned the dots to the outcomes that were most attractive to them,
using as many points as they wished for any one or more of the 19 outcomes. Findings from
a study by Hackman and Porter (1968) indicated that reducing the list of outcomes included
in an expectancy model does not significantly decrease its predictability. Knowing that a
multiple regression model was to be used in this study and knowing the approximate sample size for the study, the 12 outcomes receiving the highest number of points were
selected for further study.
According to Vroom (1964), one of the ways to measure the attractiveness of a second level
outcome is through the use of verbal reports. Based on this idea, the 12 remaining
outcomes were included in a self-report expectancy survey pilot instrument. Similar to other studies (Chen & Lou, 2004; Reinharth & Wahba, 1975), these items (Ijk) were
measured using a 7-point Likert Scale ranging from -3 (Highly Unlikely) to +3 (Extremely
Likely). An example of an outcome statement with the scale is listed below. I believe that my completing the survey shows respect for my colleagues in the class:
-3 -2 -1 0 +1 +2 +3
Highly Highly
Unlikely Likely The personal probability of achieving each of these outcomes by providing feedback (Ijk)
was also measured using the same scale. An example of the personal probability statement and accompanying scale is listed below.
How likely do you believe that your personal effort in providing teacher feedback will
contribute to achieving the underlined outcome above? -3 -2 -1 0 +1 +2 +3
Highly Highly
Unlikely Likely
6
What Motivates Students to Provide Feedback to Teachers
https://doi.org/10.20429/ijsotl.2007.010107

Questions specific to the measurement of motivational force, expectancy and overall attractiveness of providing feedback were included in the pilot expectancy survey instrument in addition to demographic information. The pilot expectancy survey self-report instrument was then administered to 108 graduate and upper division undergraduate students. For the 12 outcomes (Vk) and their 12 accompanying personal probability
statements (Ijk), Cronbach’s Alpha determined by SPSS was .89, indicating the
unidimensionality of the valence construct (Vj).
When creating the final expectancy survey instrument, a few improvements were made. The
final instrument contained a single measure of valence (V) asking students to rate the
attractiveness of providing anonymous teacher feedback on a 7-point Likert Scale ranging
from -3 ( Very Unattractive) to +3 (Very Attractive). The construct of force (F) or effort
exerted by the student when completing the anonymous teacher feedback was measured by
three separate statements, each utilizing a 7-point Likert Scale ranging from 0 – 7, with 0
indicating no effort and 7 indicating very high effort. The three statements used to measure
force are listed below.
F1: How much effort did you put into answering the survey?
F2: How much of the survey did you complete?
F3: How important to you was it to complete the survey?
One item assessed the strength of expectancy (E) that the student’s specific feedback would
lead to a successful contribution in attaining the second level outcome or outcomes; this
was again measured by a 7-point Likert Scale ranging from extremely unlikely (0) to
extremely likely (7).
To be included in the study, students had to be given the opportunity by the teacher to
provide anonymous feedback within two weeks of completing the self-report expectancy
survey instrument. Based on meeting this criterion, students from two Midwestern
universities who were enrolled in one of six classes being taught by one of five teachers
were asked to complete the self-report expectancy instrument within two weeks after being
asked to provide anonymous evaluative teacher feedback in a course management system.
At the beginning of these six classes, the expectancy survey was administered to 344
students. The first question on the survey instrument asked students whether they had
previously participated in providing anonymous teacher feedback. Regardless of how
students responded to the initial question, “Earlier this semester, I completed an
anonymous survey that was intended to let the teacher know how I thought the class was
going,” students were instructed to complete the remainder of the survey. Seventeen
students responded “No” to the preceding statement and seven did not respond at all.
These surveys were removed from the study with a remaining N of 320 students or 93%
who had affirmed that they had provided anonymous teacher feedback. Remaining participants included 117 females, 200 males and three undetermined, including
304 upper division undergraduates and 16 graduate students. Participation in the study was
voluntary. Students were told prior to survey administration that completing or not
completing the survey instrument would have no impact on their grade for the course.
Students were also told that the purpose of completing the survey instrument was to help
identify why they had chosen to provide anonymous teacher feedback about how the class
was going. Finally, participants were told that the outcomes that they saw listed on the
survey instrument where identified by graduate students who had provided anonymous
7
IJ-SoTL, Vol. 1 [2007], No. 1, Art. 7
https://doi.org/10.20429/ijsotl.2007.010107

teacher feedback in the past. Data from the expectancy survey instrument was entered into
SPSS.
Results
Multiple linear regression analysis was used to analyze data for both the valence and force propositions. However, prior to running the regression analyses, a reliability analysis was conducted on the survey items pertaining to the student identified second level outcomes associated with providing teacher feedback (Iks). This was done to assess the internal
consistency of the Ik items, or to determine if all the items similarly contributed to second
level outcomes perceived attractive by students. The scale of Ik items was found to have a
Cronbach’s Alpha of .85. Perusal of the reliability analysis item-total statistics flagged one item (I8: One of the reasons I completed the anonymous teacher feedback is because I
need not fear any negative repercussions related to my responses.) as being spurious. When I8 was deleted from the scale, Cronbach’s Alpha increased to .86 and the corrected
item-total correlation for I8 was .10, indicating this item was not measuring what the other
eleven Ik items were measuring (the remaining items all had corrected item-total correlations ranging from .34 to .81). As a result of the reliability analyses, I8 was removed from the scale and not included in the multiple regression analyses.
The contribution of each second level outcome (k) to the overall valence (V) or
attractiveness of providing anonymous teacher feedback was assessed through the use of
multiple regression analysis similar to that used in the work of Chen and Lou (2004).
Valence (V) served as the dependent variable and the items representing the students’ perceived likelihood of achieving each of the eleven remaining second level outcomes (Ik) by
giving anonymous teacher feedback served as the independent variables. Collinearity diagnostics were run on the 11 remaining independent variables to evaluate whether multicollinearity existed. Results of the diagnostics indicated 18.84 as the highest condition index value, 3.26 as the highest variance inflation factor (VIF) and .31 as the smallest tolerance value. Thus, there was no support for the existence of multicollinearity in the regression multiple regression analysis.
To maintain consistency with the analyses conducted by Chen and Lou (2004) as well as those of Stahl and Harrell (1981), the scale on which the Ik items (personal probabilities)
were measured was transformed so that likelihood was represented by a percentage. Table
1 illustrates the transformation.
Table 1: Transformation of the Ik’s
Highly Extremely
Unlikely Likely
Original Ik -3 -2 -1 0 +1 +2 +3
Transformed Ik 0% 12.5% 37.5% 50% 62.5% 87.5% 100%
Table 2 presents the means and standard deviations of valence (V) and the eleven Ik’s used
in the regression analysis. The resulting regression coefficients (βk) represent the relative
attractiveness, or Vk, of each individual second level outcome k in making a decision about
the overall attractiveness (V) of providing anonymous teacher feedback. Results indicate
that roughly 21% (R2) of the variance in valence can be predicted by the combination of the
8
What Motivates Students to Provide Feedback to Teachers
https://doi.org/10.20429/ijsotl.2007.010107

Ik’s. Furthermore, the regression analysis predicting valence from the perceived likelihoods
of the eleven personal outcomes being achieved by providing anonymous teacher feedback (Ik’s) resulted in an F-test statistic of F(11,295) = 7.15, p < .0001, indicating that there is a
statistically significant association between valence and the combination of the eleven Ik’s.
In other words, together, students’ perceived likelihoods of the eleven personal outcomes
occurring as a result of participating in anonymous teacher feedback significantly predict the
attractiveness of participating in providing that feedback.
Table 2: Means and Standard Deviations of Valence and Ik’s; N = 307
Valence (on a scale of -3 to +3) Mean Std. Dev.
V: How attractive to you was providing anonymous feedback to
your teacher?
Second Level Outcomes (Applying probability scale from Table 1)
1.28 1.24
Highly Extremely
Unlikely Likely
-3 -2 -1 0 +1 +2 +3
0% 12.5% 37.5% 50% 62.5% 87.5% 100%
I1: I believe the likelihood my feedback will help future
students taking this class is:
I2: I believe the likelihood my responses will help improve the management of current class is:
I3: I believe the likelihood of discussing my responses in class
is:
I4: I believe the likelihood of my responses actually improving
my grade is:
I5: I believe the likelihood my responses will help improve the
course content is:
I6: I believe the likelihood my responses will decrease the time
spent on non-value added work in class is:
I7: I believe the likelihood of my responses improving the
method of course content delivery is:
I9: I believe the likelihood that my completing the survey
shows respect for my instructor is:
I10: I believe the likelihood that my completing the survey
shows respect for colleagues in my class is:
I11: I believe the likelihood my responses will increase value of
class is:
I12: I believe the likelihood my responses will reduce the work
required for class is:
62.78 25.41 57.78 26.06 51.46 29.20 22.96 25.42 51.42 26.13 48.70 23.71 53.95 24.36 78.22 21.37 66.50 24.43 57.90 25.80 28.09 22.86
9
IJ-SoTL, Vol. 1 [2007], No. 1, Art. 7
https://doi.org/10.20429/ijsotl.2007.010107
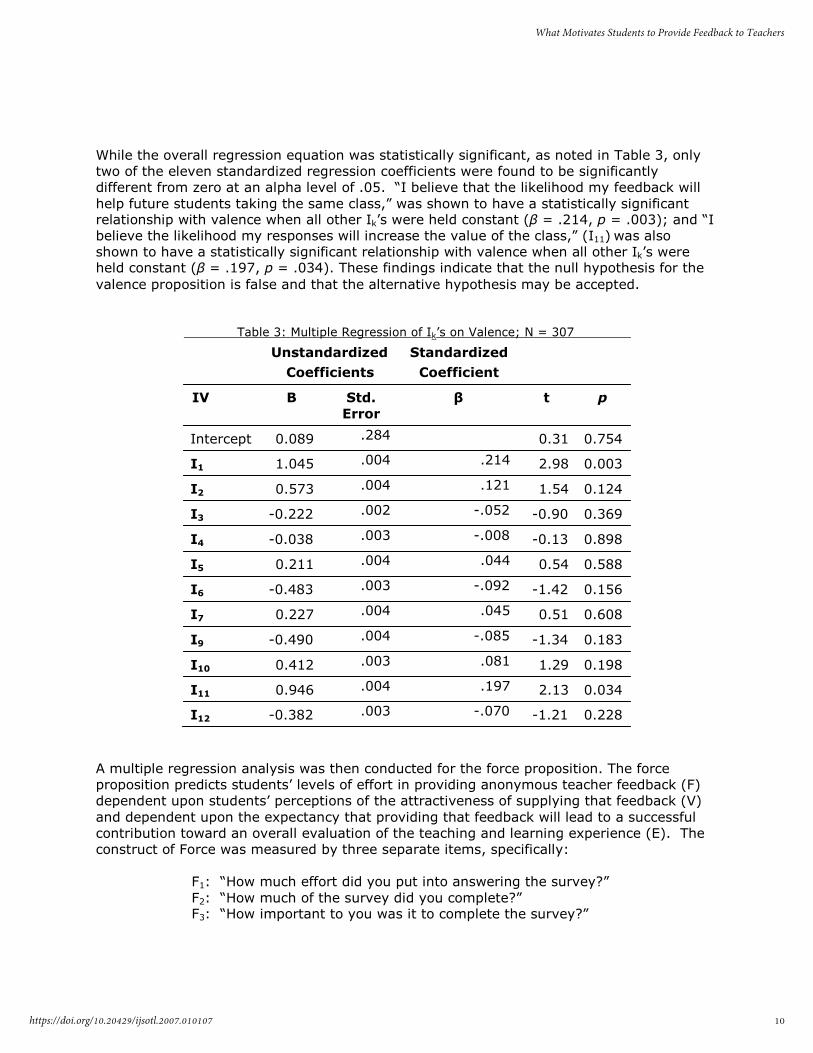
While the overall regression equation was statistically significant, as noted in Table 3, only
two of the eleven standardized regression coefficients were found to be significantly
different from zero at an alpha level of .05. “I believe that the likelihood my feedback will
help future students taking the same class,” was shown to have a statistically significant relationship with valence when all other Ik’s were held constant (β = .214, p = .003); and “I
believe the likelihood my responses will increase the value of the class,” (I11) was also shown to have a statistically significant relationship with valence when all other Ik’s were held constant (β = .197, p = .034). These findings indicate that the null hypothesis for the
valence proposition is false and that the alternative hypothesis may be accepted.
Table 3: Multiple Regression of Ik’s on Valence; N = 307
Unstandardized
Coefficients
IV B Std.
Error
Standardized
Coefficient
β t p
Intercept 0.089 .284 0.31 0.754
I1 1.045 .004 .214 2.98 0.003
I2 0.573 .004 .121 1.54 0.124
I3 -0.222 .002 -.052 -0.90 0.369
I4 -0.038 .003 -.008 -0.13 0.898
I5 0.211 .004 .044 0.54 0.588
I6 -0.483 .003 -.092 -1.42 0.156
I7 0.227 .004 .045 0.51 0.608
I9 -0.490 .004 -.085 -1.34 0.183
I10 0.412 .003 .081 1.29 0.198
I11 0.946 .004 .197 2.13 0.034
I12 -0.382 .003 -.070 -1.21 0.228
A multiple regression analysis was then conducted for the force proposition. The force
proposition predicts students’ levels of effort in providing anonymous teacher feedback (F)
dependent upon students’ perceptions of the attractiveness of supplying that feedback (V)
and dependent upon the expectancy that providing that feedback will lead to a successful
contribution toward an overall evaluation of the teaching and learning experience (E). The
construct of Force was measured by three separate items, specifically:
F1: “How much effort did you put into answering the survey?”
F2: “How much of the survey did you complete?” F3: “How important to you was it to complete the survey?”
10
What Motivates Students to Provide Feedback to Teachers
https://doi.org/10.20429/ijsotl.2007.010107

To make the items consistent with each other, F2 and F3 were reverse coded so that
responses smaller in numeric value indicated less completion of the survey and less feeling of importance, respectively. The recoded scale ranged from 0 to 7. Descriptive analyses of the three items showed little variability in F2; thus it was decided to omit this item from the
overall calculation of force (i.e., the majority of students responded that they completed all or almost all of the teacher feedback). Table 4 illustrates the force statistics.
Table 4: Means and Standard Deviations of F1, F2, & F3; N = 320
Force (scale of 0 – 7) Mean Std.
Dev.
F1: How much effort did you put into answering the survey? 4.47 1.15
F2: How much of the survey did you complete? 6.61 1.02
F3: How important to you was it to complete the survey? 3.79 1.54
The final measure of Force used in the regression equation was the student’s average response to F1 and F3 with higher responses indicating higher levels of effort exerted on
providing anonymous teacher feedback. As done with F2 and F3, the scale for expectancy
(E) needed to be reverse coded so that lower responses corresponded with more negative attitudes of the students. In keeping with the format of Chen and Lou’s (2004) regression analysis and as done above with the Ik items, the scale for expectancy (E) was then
transformed as indicated in Table 5 so that E was represented by percentages indicating personal probabilities.
Table 5: Expectancy statement: “My perception is that my level of participation or effort in completing the survey has resulted in a successful contribution to providing teacher feedback.”
Highly Extremely
Unlikely Likely
Expectancy -3 -2 -1 0 +1 +2 +3
Transformed 0% 12.5% 37.5% 50% 62.5% 87.5% 100%
Expectancy
Table 6 presents the means and standard deviations of overall force, valence, and expectancy used in the multiple regression analysis.
Table 6: Means and Standard Deviations of FOverall, Valence, and Expectancy; N = 320
11
IJ-SoTL, Vol. 1 [2007], No. 1, Art. 7
https://doi.org/10.20429/ijsotl.2007.010107

Item Mean Std.
Dev.
FOverall (Scale of 0 – 7) 4.08 1.17
Valence: How attractive to you was providing anonymous feedback to
your teacher? (Scale of -3 - +3)
Expectancy: I believe the likelihood that my level of effort in
completing the survey has resulted in a successful contribution to
providing teacher feedback is: (mean percentage using values from
Table 5)
1.28 1.23 57.03% 24.11%
Results of the multiple regression analysis indicate that roughly 22.5% (R2) of the variance in overall Force can be predicted by the combination of Valence and Expectancy (see Table
7). Furthermore, this regression analysis resulted in an F-test statistic of F(2,317) = 49.19, p < .0001, indicating that there is a statistically significant association between force, or
the overall effort a student put forth in completing the anonymous teacher feedback survey;
and the combination of valence, the attractiveness of providing the feedback; and
expectancy, the student’s perceived likelihood that providing feedback would lead to a
successful contribution to the teacher’s feedback. In other words, together, students’
perceived likelihood of their providing feedback leading to a successful outcome and the attractiveness of providing such feedback are able to significantly predict the effort a
student exerts when providing that feedback.
As indicated in Table 7, the standardized regression coefficient for both valence and
expectancy were found to be statistically significant at an alpha level of .05 (β = .257, p <
.0001 and β = .312, p < .0001, respectively), indicating that valence has a statistically significant relationship with force when expectancy is held constant. Likewise, expectancy
has a statistically significant relationship with force when valence is held constant. These
findings indicate that the null hypothesis for the force proposition is false and that the
alternative hypothesis may be accepted.
Table 7: Multiple Regression of Expectancy and Valence on Force; N = 320
Unstandardized
Coefficients
Standardized
Coefficient
IV B Std. β t p
Error
Intercep t 4.701 .191 24.586 .000
Valence .266 .048 .257 4.970 .000
Expecta ncy .014 .042 .312 6.027 .000
Discussion
12
What Motivates Students to Provide Feedback to Teachers
https://doi.org/10.20429/ijsotl.2007.010107

When reviewing the descriptive statistics, it is noted that the mean values for all but three
of the 11 secondary outcomes are exceeding 50%, indicating that the majority of students
perceived the outcome would occur as a result of providing anonymous feedback to the
instructor. However, in terms of the valence proposition, only two of the 11 outcomes
included in the analysis were statistically significant in identifying what attracted students to
provide anonymous feedback. This could imply that although students believed that most of
the secondary outcomes were attained as a result of providing anonymous student
feedback, only two of those outcomes motivated them significantly to provide teacher
feedback, those being the belief that doing so would improve the value of the current class
as well as improve the value of future classes. What is interesting to note is that the same eight secondary level outcomes supported by
students as reasons to provide student feedback, including the two statistically significant
ones, according to definition could be considered intrinsic motivators, or motivators that are
defined as leading to behavior that is enjoyable versus leading to any specific material
reward (Pintrick & Schunk, 1996). The three remaining secondary level outcomes, which
were not supported by the majority of students as reasons to provide teacher feedback,
were extrinsic motivators, or motivators leading to material reward, specifically likelihood of
improving my grade, likelihood of spending decreased time on non-value added work and
likelihood of reduced work in the course. Research findings indicate that intrinsic motivators
are better at predicting satisfaction and performance (Ewen, Smith, Hulin & Locke, 1966;
Wernimount, 1966). Thus, in this particular study, the findings regarding intrinsic and
extrinsic motivators are in agreement with findings from previous studies. Vroom (1964)
suggests, however, that intrinsic rewards should not be considered for his model or should
at least be considered separately, as they are not externally administered. On the other
hand, current research findings by Reiss (Ohio State University, Research News; 2005),
indicate that defining the existence of intrinsic and extrinsic motivators lacks empirical
evidence. Thus, separation of outcomes was not attempted in this study.
Another finding worth discussing is that students do not seem to see a relationship between
providing teacher feedback and improving their grade for the course. That may be because
they perceive that their ability to achieve a higher grade in the course is independent of how
the course is taught, or that the teacher feedback given will not change how the course is
taught; yet if the second premise were true, than the findings that indicate that students
provide feedback to increase the value of the course appear contradictory. A major premise
in education, which forms the foundation of this study, is that teaching methodology does
impact learning, and the educational literature in support of this premise is abundant (Angelo & Cross, 1993; Bersin, 2004; Bonk & Graham, 2006; Fink, 2003; Michaelsen,
Jarvis, P., Holford, J. & Griffin, C., 1999; Knight & Fink, 2004; Palmer, 1998; Walvoord,
2004). Additionally, as aforementioned, adult students are fairly good evaluators of their
own learning (Giese, 2006; Kerka, 1997; Knowles, Holton & Swanson, 1998). Therefore it
may be of value for teachers to point out that students providing teacher feedback not only
have the potential of improving the value of the course as perceived by the students, but
the teacher feedback also has the potential of improving individual student performance as
measured by grades through improved student learning.
13
IJ-SoTL, Vol. 1 [2007], No. 1, Art. 7
https://doi.org/10.20429/ijsotl.2007.010107

Two more points worthy of mention arise from two statements measured on a 7-point Likert
scale that were included in the expectancy survey instrument. Eighty-three percent (83%) of the students responded that formally evaluating a teaching and learning experience was
useful to them and 93% responded that they felt comfortable participating in such
evaluations. These responses provide further supporting evidence that students see the
value in providing teachers with anonymous feedback and that they are comfortable in
doing so. Furthermore, these findings are in agreement with former research where
students expressed similar perspectives regarding their participation in evaluating learning
(Giles, et. al., 2004).
The remainder of the discussion is focused on the two statistically significant outcomes.
Findings from the study indicate that it is important for teachers to let students know that
the feedback they receive from them will be used to improve the value of the current class
and future classes. There are many ways that teachers may do this, including the most
obvious way of telling students that the reason they are requesting feedback is to improve
the value of the current class and future classes. As an example, teachers may tell students
at the beginning of the semester that student feedback is welcomed and expected in order
that improvement in teaching methods may lead to improved student learning. However,
there are additional less direct ways of letting students know that their feedback is valuable
in leading to improved learning experiences. One of the major ways that this may be done is by sharing the anonymous feedback
received with the students in the classroom, which was one of the 11 second level outcomes
that students identified as desirable when providing teacher feedback. Sharing feedback
serves five purposes. First, it demonstrates that the teacher is serious about using the
feedback given to improve teaching and learning. Second, it provides the teacher an
opportunity to seek clarification on feedback received. Third, it gives the teacher and
students the opportunity to better determine if the feedback exhibits the beliefs of one or
two students or if it is more universal in nature, possibly indicating the need for more
serious evaluation. Fourth, it permits the teacher to identify potential changes in teaching
that may address some of the feedback received, permitting students to react to these
potential changes right on the spot. Finally, it gives the teacher an opportunity to explain
why feedback may not, in some instances, result in any change. The only downside of
sharing and discussing anonymous feedback in the classroom is that through discussion, it
may make the feedback less anonymous. However, it is been the experience of the author
that often times students will say, “I am the one who said that and here is what I meant by
it,” which generally opens the door to further rich discussion from others in the class. Being willing to incorporate recommended changes into the teaching plan is another way to
demonstrate to students that their feedback is valued. One thing the author has learned
from teaching is that different methods of teaching for different learners may be important.
For example, when utilizing a hybrid or blended teaching format where asynchronous
discussion assignments are part of the teaching plan, graduate business students who are
frequently working full time jobs, find it difficult to complete asynchronous discussion
assignments with due dates occurring during the work week as they are often traveling,
which many times causes difficulty in accessing a computer and the internet. A change in
assignment due dates is an example of a fairly easy change to incorporate into a teaching
plan almost immediately without decreasing the rigor of the teaching plan.
14
What Motivates Students to Provide Feedback to Teachers
https://doi.org/10.20429/ijsotl.2007.010107
Finally, telling students that an important part of the teacher’s responsibility is to help them
learn, letting them know that most teachers are interested in their having the best learning
experience possible and asking for feedback regularly regarding certain aspects of teaching
is likely to lessen the risk that students may perceive is present when they provide teacher
feedback. In this study 270 (84.5%) of the participants agreed that students should
evaluate classroom learning experiences and only one student (.3%) strongly disagreed
with this practice, indicating that students do see the value in providing teacher feedback.
There are some excellent resources available to help teachers clearly identify to students
what aspects of their teaching they would like to have assessed. One of the most
comprehensive resources in this area is the work of Brown and Race (1995).
Limitations
Based on the nature of the study, sample selection was not random; therefore results cannot necessarily be generalized to other student populations. Secondly, it may be possible
that the fifty students who identified the secondary outcomes used in the expectancy survey
instrument failed to identify all of the outcomes that could be significant motivators in
predicting why students would provide anonymous teacher feedback. Thirdly, a within subjects model was not used in the application of Vroom’s Model as the purpose of the
study was to determine whether there was a statistically significant relationship between the variables in the model for the purpose of predicting students’ motivation in providing
teacher feedback based on previously identified second level outcomes. Therefore results of
the study cannot be compared to results from other studies that used within subjects or
across subjects research designs and the criticisms associated with the use of those designs
do not apply to the research design used in this study. Finally, as with any self-report
survey responses, there exists speculation as to the assumptions on which those responses
are based.
Future Research
An area of interest for future consideration and study is exploring the effects of teaching
style on students’ motivation to provide evaluative feedback regarding the teaching and
learning experience. A number of studies in contingency theory demonstrate that in any
environment the interaction between the leader (teacher) and followers (students) impacts
the behavior of both the leader and the followers (Fiedler, 2002; House, 1996; Northouse,
2004). In fact, the very foundation of path-goal contingency theory of leadership is based
on expectancy theory of motivation (Northouse, 2004). It seems likely that teaching style
would impact students’ motivation to provide teacher feedback. Furthermore, findings from contingency theory studies would seem to indicate that different
student traits may benefit from different teaching styles. As an example when applying
concepts from path-goal theory, students who tend to be more pragmatic and authoritarian
may prefer a more directive teaching style that provides them with more structure and less
ambiguity when completing an assignment, whereas students who have a greater need for
affiliation may prefer a teaching style that is more participatory and supportive of their
needs.
15
IJ-SoTL, Vol. 1 [2007], No. 1, Art. 7
https://doi.org/10.20429/ijsotl.2007.010107

In conclusion, the purpose of this study was to investigate what might motivate students to
provide anonymous formative teacher feedback during the course of a class in order that
teachers may use that feedback to improve student learning. The benefit of receiving this
feedback gives teachers the opportunity to improve the teaching and learning experience for
the current class as well as for future classes. Vroom’s model of expectancy theory formed
the basis of the investigation. Regression analysis was employed to investigate both the
valence and force equations. Statistically significant findings indicated that students’
motivation was dependent upon the importance to them of improving the value of the
current class and that of future classes, and the expectation that their evaluative feedback
would lead to increased value for them and for future students. Based on these findings, it
is important for teachers who request students to participate in providing anonymous
feedback to emphasize that this feedback is a valuable tool used to assist them in improving
current and future teaching and learning experiences.
Author’s Acknowledgements
This research was supported in part by a grant received from Marquette University.
The author would like to acknowledge Ms. Jacqueline Gosz, doctoral candidate at the
University of Wisconsin, for her assistance with the statistical work in this study, Dr. Carolyn
Kelly Ottman, a lecturer at the University of Wisconsin, for permitting the author to survey
her students and Mr. David Holder, the author’s graduate research assistant, for his
assistance in entering data into SPSS and accessing literature for this study.
References
Aleamoni, L. (1999). Student rating myths versus research facts from 1924 to 1998. Journal
of Personnel Evaluation in Education, 13(2), 153-166.
Angelo, T. Cross, K. P. (1994). Classroom assessment techniques (2nd ed.). San Francisco:
Jossey-Bass Publishers. Arnold, H. J. (1981). A test of the validity of the multiplicative hypothesis of expectancy-
valence theories of work motivation. Academy of Management Journal, 24, 128-141. Atkinson, J. W. (1964). An introduction to motivation. Princeton: Van Nostrand.
Bersin, J. (2004). The blended learning book. San Francisco: Pfeiffer.
Bonk, C. & Graham, C. (2006). The handbook of blended learning. San Francisco: Pfeiffer.
Bonner, S. E. & Sprinkle, G. B. (2002). The effects of monetary incentives on effort and task
performance: Theories, evidence and a framework for research. Accounting, Organizations
and Society, 27(4 - 5), 303 - 345.
Brown, S. & Race, P. (1995). Assess your own teaching quality. Philadelphia: Kogan Page.
Campbell, J. P. & Pritchard, R. D. (1976). Motivation theory in industrial and organizational
psychology. In M. D. Dunette (Ed.), Handbook of industrial and organizational psychology. Chicago: Rand-McNally.
16
What Motivates Students to Provide Feedback to Teachers
https://doi.org/10.20429/ijsotl.2007.010107

Chen, Y. Lou, H. (2004). Students' perceptions of peer evaluation: An expectancy perspective. Journal of Education for Business, 275-282.
DeSanctis, G. (1983). Expectancy theory as an explanation of voluntary use of a decision
support system. Psychological Reports, 52, 247 - 260. Donovan, J. (2001). Work motivation. In N. Anderson, D. Ones, H. Sinangil & C.
Viswesvaran (Ed.), Handbook of industrial, work and organizational psychology, volume 2.
Thousand Oaks: Sage Publications.
Edwards, W. (1961). Behavioral decision theory. Annual Review of Psychology, 12, 473-498.
Erwen, R. B., Smith, P. C., Hulin, C. L. & Locke, E. A. (1966). An empirical test of the
Herzberg two-factor theory. Journal of Applied Psychology, 50, 544-550. Fiedler, F. (2002). The curious role of cognitive resources in leadership. In S. E. M. F. J. P.
Ronald E. Riggio (Ed.), Multiple intelligences and leadership (pp. 91 - 104). Mahwah:
Lawrence Erlbaum Associates, Publishers.
Fink, L. D. (2003). Creating significant learning experiences. San Francisco: Jossey-Bass.
Giese, A. (2006). Implementing learning-how-to-learn-strategies. Chief Learning Officer
Magazine, June. Giles, A., Martin, S. C., Bryce, D. & Hendry, G. D. (2004). Students as partners in
evaluation: Student and teacher perspectives. Assessment & Evaluation in Higher
Education, 29(6), 681 - 685. Goldstein, G. & Benassi, V. (2006). Students' and instructors beliefs about excellent
lecturers and discussion leaders. Research in Higher Education, 47(6), 685 - 707. Ohio State University, Research News. (2005, May). Intrinsic motivation doesn't exist,
researcher says. Retrieved August 2, 2006, from the Research News Web site:
http://researchnews.osu.edu/archive/inmotiv.htm/
Graen, G. (1969). Instrumentality theory of work motivation: Some experimental results
and suggested modifications. Journal of Applied Psychology Monograph, 53, 1-25. Hackman, J. R. & Porter, L. W. (1968). Expectancy theory of work effectiveness.
Organizational behavior and human performance, 3, 417-426.
Hativa, N. (1996). University instructors' rating files: Stability over time, and disciplinary
differences. Research in Higher Education, 37(3), 341-365.
House, R. J. (1996). Path-goal theory of leadership: Lessons, legacy, and a reformulated
theory. Leadership Quarterly, 7(3), 323-352. Jarvis, P., Holford, J. & Griffin, C. (1999). The theory and practice of learning. Sterling:
Kogan Page.
17
IJ-SoTL, Vol. 1 [2007], No. 1, Art. 7
https://doi.org/10.20429/ijsotl.2007.010107
Kerka, S. (1997). Information management: Myths and realities. ERIC Clearing House on
Adult, Career and Vocational Education: Center on Education and Training for Employment,
College of Education; Ohio State University. (ERIC Document Reproduction No. 417296). Knowles, M., Holton, E. F. III & Swanson, R. A. (1998). The adult learner: The definitive
classic in adult education and human resource development. Houston: Gulf Professional
Publishing. Kohlan, R. G. (1973). A comparison of faculty evaluations early and late in the course.
Journal of Higher Education, 44, 587-595. Lawler, E. E. (1973). Motivation in work organizations. Belmont: Brooks/Cole.
Lewin, K. (1947). Group decision and social change. In T. M. Hartley & E. L. Newcomb (Ed.),
Readings in social psychology (pp. 330-344). New York: Holt. Marlin, J. J. (1987). Student perceptions of end-of-course evaluations. The Journal of Higher
Education, 58(6), 704-716.
Melland, H. I. (1996). Great researcher . . . good teacher? Journal of Professional Nursing,
12(1), 31-38. Michaelson, L., Knight, A., & Fink, L. D. (2004). Team-based learning. Sterling: Stylus
Publishing.
Mitchell, T. (1974). Expectancy models of job satisfaction, occupational preference and
effort: A theoretical, methodological, and empirical appraisal. Psychological Bulletin, 81(12),
1053-1077.
Northouse, P. G. (2004). Leadership: Theory and practice (3rd ed.). Thousand Oaks: Sage
Publications, Inc.
Palmer, P. (1998). The courage to teach. San Francisco: Jossey-Bass.
Parker, S. K. (2000). From passive to proactive motivation: The importance of flexible role
orientations and role breadth self-efficacy. Applied Psychology: An International Review, 49,
447-469. Pinder, C. C. (1987). Valence-instrumentality-expectancy theory. In R. M. S. L. W. Porter
(Ed.), Motivation and work behavior (4th ed., pp. 144-164). New York: McGraw-Hill.
Pintrick, P. & Shunk, D. (2001). Motivation in education: Theory, research, and applications
(2nd ed.). Englewood Cliffs: Prentice Hall.
Porter, L. W. Lawler, E.E. (1968). Managerial attitudes and performance. Homewood:
Dorsey Press.
Race, P. (2000). Audit your own teaching. In A. Brown & S. Holmes (Ed.), Internal audit in
higher education (pp. 163-181). Sterling: Stylus Publishing Inc.
18
What Motivates Students to Provide Feedback to Teachers
https://doi.org/10.20429/ijsotl.2007.010107

Reinharth, L. Wahba, M. (1975). Expectancy theory as a predictor of work motivation, effort expenditure and job performance. The Academy of Management Journal, 18(3), 520 - 537.
Robbins, S. (2005). Organizational behavior. Upper Saddle River: Pearson Prentice Hall.
Tolman, E. C. (1959). Principles of purposive behavior. In S. Koch (Ed.), Psychology: A
study of science, volume 2 (pp. 92-157). New York: McGraw-Hill. Vroom, V. H. (1964). Work and motivation. New York: Wiley.
Walker, K. B. J., E. N. (1999). The effects of a budget-based incentive compensation
scheme on the budgeting behavior of managers and subordinates. Journal of Management
Accounting Research, 11, 1 - 28.
Walvoord, B. (2004). Assessment clear and simple. San Francisco: John Wiley & Sons, Inc.
Wernimount, P. F. (1966). Intrinsic and extrinsic factors in job satisfaction. Journal of
Applied Psychology, 50, 41-50.
19
IJ-SoTL, Vol. 1 [2007], No. 1, Art. 7
https://doi.org/10.20429/ijsotl.2007.010107