Embed Size (px)
Citation preview

page 112 National Nanotechnology Infrastructure Network
Physics
What Makes Peacock Feathers Colorful?
Suntrana (Tran) SmythPhysics, University of Alaska, Fairbanks
NNIN REU Site: Cornell NanoScale Science & Technology Facility, Cornell UniversityNNIN REU Principal Investigator: Professor Sandip Tiwari, Electrical and Computer Engineering, Cornell UniversityNNIN REU Mentor: Brian Bryce, Electrical and Computer Engineering, Cornell UniversityContact: [email protected], [email protected], [email protected]
IntroductionThe iridescence of peacock feathers is fascinating because of their range of colors and their brightness in a filament. Color can arise from wavelength selective absorption and wavelength selective reflection. Bright colors of many butterflies are now known to arise from reflection. Yoshioka and Kinoshita [1] found that the pigmentation in peacock feathers, instead of reflecting light, serves “...to absorb the randomly scattered light and [thus] make vivid the interference color.” Zi et al. concluded that periodic structures caused the reflection properties that lead to the colors [2]. We undertook this effort to clarify the nature of the color phenomena in peacocks in view of earlier seemingly contradictory reports.
Previous WorkZi et al. [2] of Fudan University reported that two mechanisms are the cause of the iridescent colors in peacock feather barbules: varying size of the lattice constant and varying numbers of melanin rod layers normal to the cortex surfaces. Zi found that the green and blue barbule lattice constants were ~ 150 nm and ~ 140 nm respectively. The authors concluded that that Fabry-Perot interference was central to the coloration phenomena; the number of melanin rod layers parallel to the cortex surface was reported as “~ 9-12 for the blue and green barbules, and ~ 4 for the brown barbules.” Zi et al. also reported that the brown barbules possess a (non-square) rectangular lattice structure. They observed ~ 185 nm along the direction perpendicular to the cortex surface by ~ 150 nm along the parallel, and that brown barbule structures possess no air hole array between the melanin layers nearest to the surface [3].
Methods and ObservationsA peacock feather consists of a shaft from which barbs extend spirally. Tiny barbules protrude from each barb shaft. Visible under a scanning electron microscope (SEM), the perimeter of the cross-section of every barbule contains an ordered structure
(Figure 1). This structure consists of melanin rods interspaced with air holes, possibly integrated with keratin. We probed the structures by taking SEM images of feather cross-sections, measuring the geometries, and modeling the interaction of light striking those geometries with the M.I.T. electromagnetic equation program (MEEP).
A spatially periodic dielectric material (in the case of peacock feather, melanin rods interspaced with air holes and keratin) that inhibits the propagation of light waves at certain frequencies and energies is called a “photonic crystal.” It creates blocking and passing bands for photons similar to those of electrons in a semi conducting crystal. The feather structures give rise to what’s known as a “partial” band gap, in which light is blocked (and therefore reflected) only at certain polarizations and angles of incident.
A variety of sampling techniques were attempted intending to produce high quality SEM images: barbule slices were imbedded in polymer which was cut to expose cross sections; glass and diamond microtomes were used to slice microscopic samples; an ineffectual attempt was made to break barbules cleanly using a hardened structure by cooling it with liquid nitrogen.
The most effective sampling strategy consisted of simply laying a barb down on copper tape, slicing the barbules from it with a razor blade, removing the stem, and gold sputtering to reduce charging by incident electrons. This yielded good quality SEM images of the barbule cross sections and of their longitudinal structure. However, there remained difficulties in structural measurement. First, even with sputtering, prolonged charging due to the electron beam was still apt to destroy parts of the sample. Second, the sputtering itself caused error, as it obscured the actual structures. Third, it was difficult to make a precise judgment as to the angles of the lense versus the cross-sectional face. Random errors were greatly reduced by averaging sizes of several lattices measured simultaneously.
Figure 1
2007 REU Research Accomplishments page 113
Physics
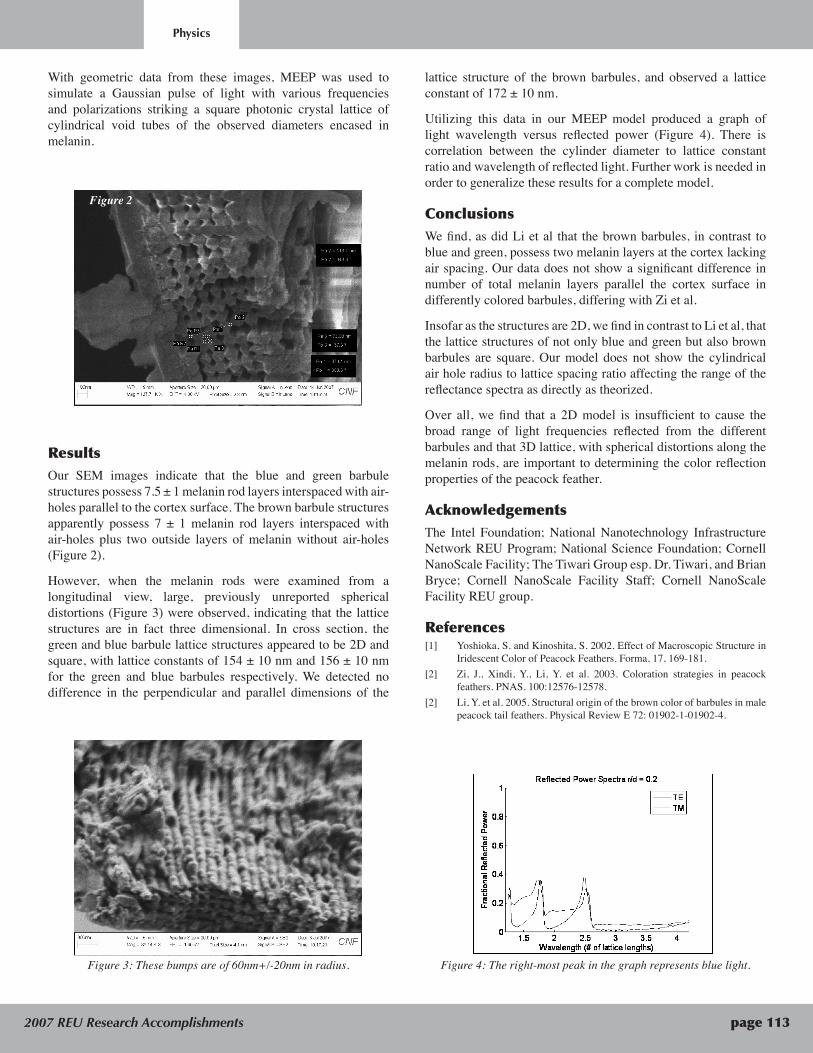
With geometric data from these images, MEEP was used to simulate a Gaussian pulse of light with various frequencies and polarizations striking a square photonic crystal lattice of cylindrical void tubes of the observed diameters encased in melanin.
lattice structure of the brown barbules, and observed a lattice constant of 172 ± 10 nm.
Utilizing this data in our MEEP model produced a graph of light wavelength versus reflected power (Figure 4). There is correlation between the cylinder diameter to lattice constant ratio and wavelength of reflected light. Further work is needed in order to generalize these results for a complete model.
ConclusionsWe find, as did Li et al that the brown barbules, in contrast to blue and green, possess two melanin layers at the cortex lacking air spacing. Our data does not show a significant difference in number of total melanin layers parallel the cortex surface in differently colored barbules, differing with Zi et al.
Insofar as the structures are 2D, we find in contrast to Li et al, that the lattice structures of not only blue and green but also brown barbules are square. Our model does not show the cylindrical air hole radius to lattice spacing ratio affecting the range of the reflectance spectra as directly as theorized.
Over all, we find that a 2D model is insufficient to cause the broad range of light frequencies reflected from the different barbules and that 3D lattice, with spherical distortions along the melanin rods, are important to determining the color reflection properties of the peacock feather.
AcknowledgementsThe Intel Foundation; National Nanotechnology Infrastructure Network REU Program; National Science Foundation; Cornell NanoScale Facility; The Tiwari Group esp. Dr. Tiwari, and Brian Bryce; Cornell NanoScale Facility Staff; Cornell NanoScale Facility REU group.
References[1] Yoshioka, S. and Kinoshita, S. 2002. Effect of Macroscopic Structure in
Iridescent Color of Peacock Feathers. Forma, 17, 169-181.[2] Zi, J., Xindi, Y., Li, Y. et al. 2003. Coloration strategies in peacock
feathers. PNAS. 100:12576-12578.[2] Li, Y. et al. 2005. Structural origin of the brown color of barbules in male
peacock tail feathers. Physical Review E 72: 01902-1-01902-4.
ResultsOur SEM images indicate that the blue and green barbule structures possess 7.5 ± 1 melanin rod layers interspaced with air-holes parallel to the cortex surface. The brown barbule structures apparently possess 7 ± 1 melanin rod layers interspaced with air-holes plus two outside layers of melanin without air-holes (Figure 2).
However, when the melanin rods were examined from a longitudinal view, large, previously unreported spherical distortions (Figure 3) were observed, indicating that the lattice structures are in fact three dimensional. In cross section, the green and blue barbule lattice structures appeared to be 2D and square, with lattice constants of 154 ± 10 nm and 156 ± 10 nm for the green and blue barbules respectively. We detected no difference in the perpendicular and parallel dimensions of the
Figure 2
Figure 3: These bumps are of 60nm+/-20nm in radius. Figure 4: The right-most peak in the graph represents blue light.


![What Makes Peacock Feathers Colorful? · clarify the nature of the color phenomena in peacocks in view of earlier seemingly contradictory reports. Previous Work Zi et al. [2] of Fudan](https://img.pdfslide.us/doc/110x75/60576a3b8c8fd005680b871d/what-makes-peacock-feathers-colorful-clarify-the-nature-of-the-color-phenomena.jpg)