Embed Size (px)
Citation preview

What is weather?What is weather? The state of the atmosphere
at any given time.
What is climate?What is climate? The aggregate of weather conditions
~ the sum of statistical weather information that describes a place or region.


Earth’s Orientation
Tropic of Cancer
Arctic Circle
Equator
Tropic ofCapricorn
Arctic Circle
Ecliptic Plane
23.5o 23.5o
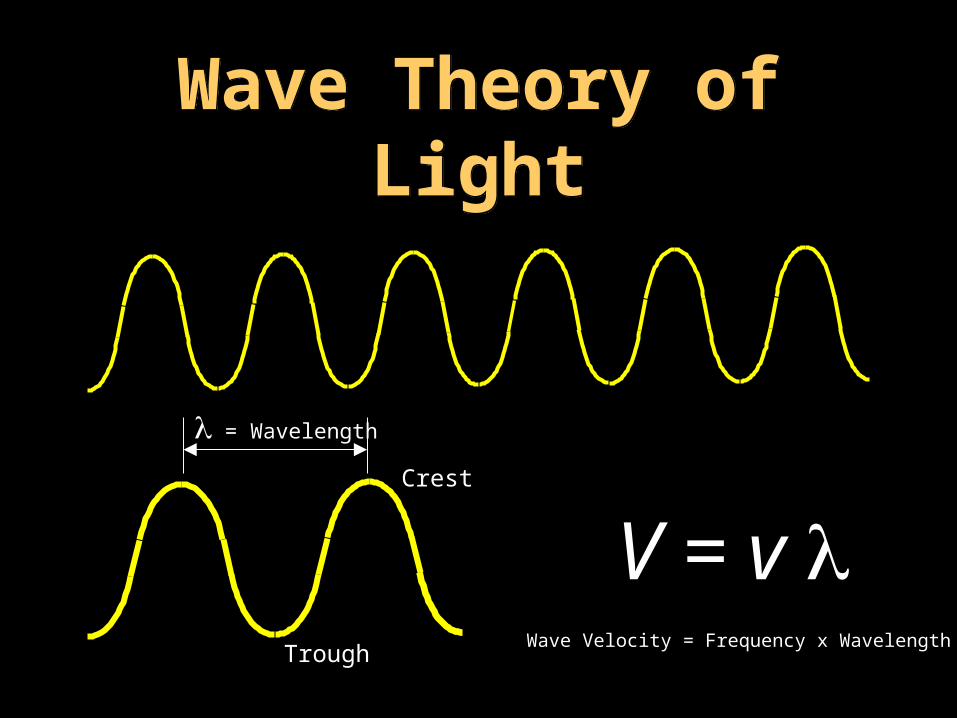
Wave Theory of LightWave Theory of Light
= Wavelength
Trough
Crest
V = v Wave Velocity = Frequency x Wavelength

Gamma Rays U
ltrav
iole
t
Sta
ndar
d A
M r
adio
Bro
adca
st b
and
Electromagnetic Spectrum
0.001micrometer
1,000micrometers
1meter
1,000meters
1micrometer
Short-wave radiation Long-wave radiation
X Rays Infrared Microwaves Sho
rt-w
ave
Rad
io
Long radio waves
Tel
evis
ion,
FM
Rad
ioVisible Light
0.4Violet Blue Yellow
0.5Green
0.6Orange
0.7Red

Radiation from the Sun vs. Earth
0.1 0.5 1.0 1.5 2.0 2.5 10 20 30 40 50 60Wavelength in Micrometers
Ultra-Violet Infrared
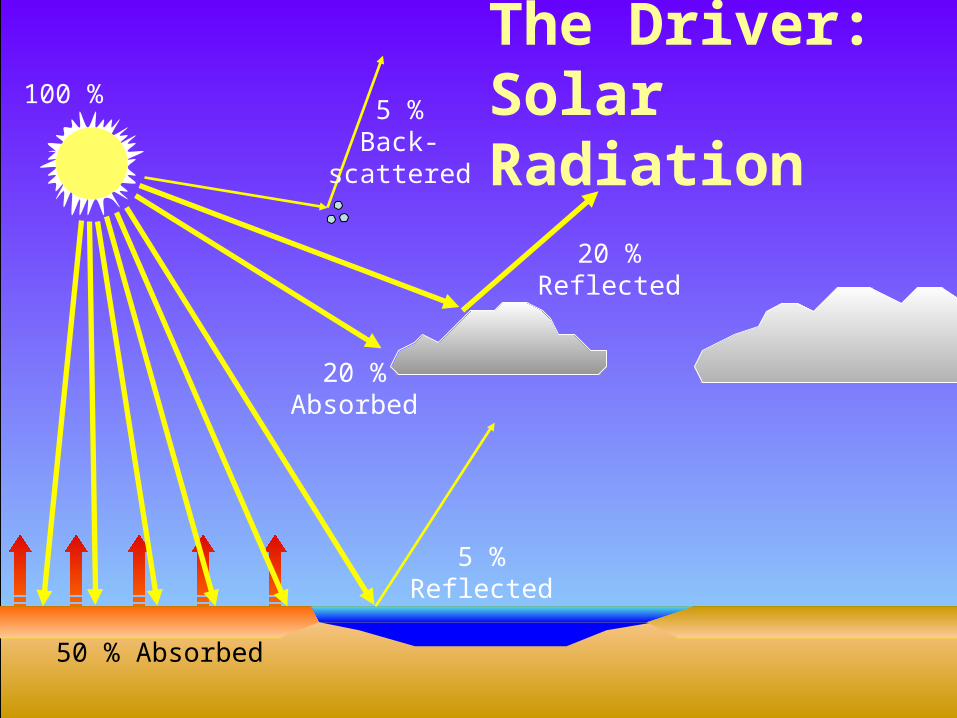
The Driver: Solar Radiation
100 %
20 %Reflected
20 %Absorbed
5 %Back-
scattered
5 %Reflected
50 % Absorbed

Atmospheric Pressure Varies with Altitude
5
10
15
20
25
30
35
0 200 400 600 800 1000
Atmospheric Pressure in millibars
5
10
15
20
25
30
35
50 % of our atmospherelies below an altitude of 5.6 Km
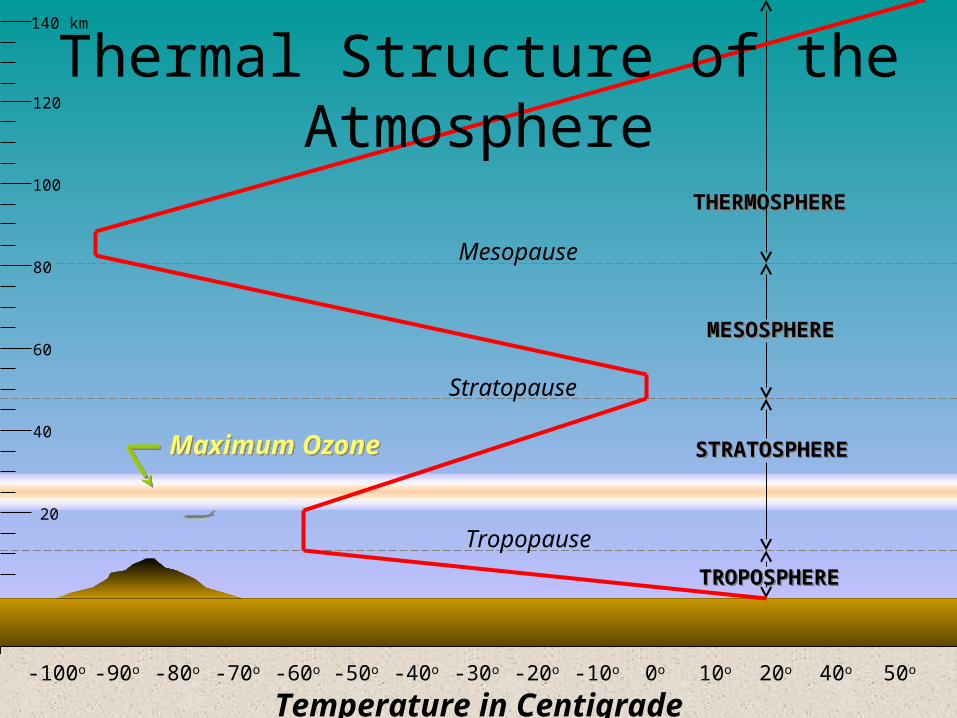
-100o -90o -80o -70o -60o -50o -40o -30o -20o -10o 0o 10o 20o 40o 50o
Temperature in Centigrade
20
40
60
80
100
120
140 km
MESOSPHEREMESOSPHERE
STRATOSPHERESTRATOSPHERE
TROPOSPHERETROPOSPHERE
THERMOSPHERETHERMOSPHERE
Thermal Structure of the Atmosphere
Mesopause
Tropopause
Stratopause
Maximum OzoneMaximum Ozone

Atmospheric CompositionAtmospheric Composition
CO2 0.036 %(Carbon Dioxide)
Ne 0.0018 %(Neon)
He 0.0005 %(Helium)
CH4 0.00015 %(Methane)
Kr 0.00011 %(Krypton)
H2 0.00005 %(Hydrogen)
Nitrogen( N2 )
78.084 %
Oxygen( O2 ) 20.946 %
Argon( Ar ) 0.946 %
All Other Gases 0.039 %
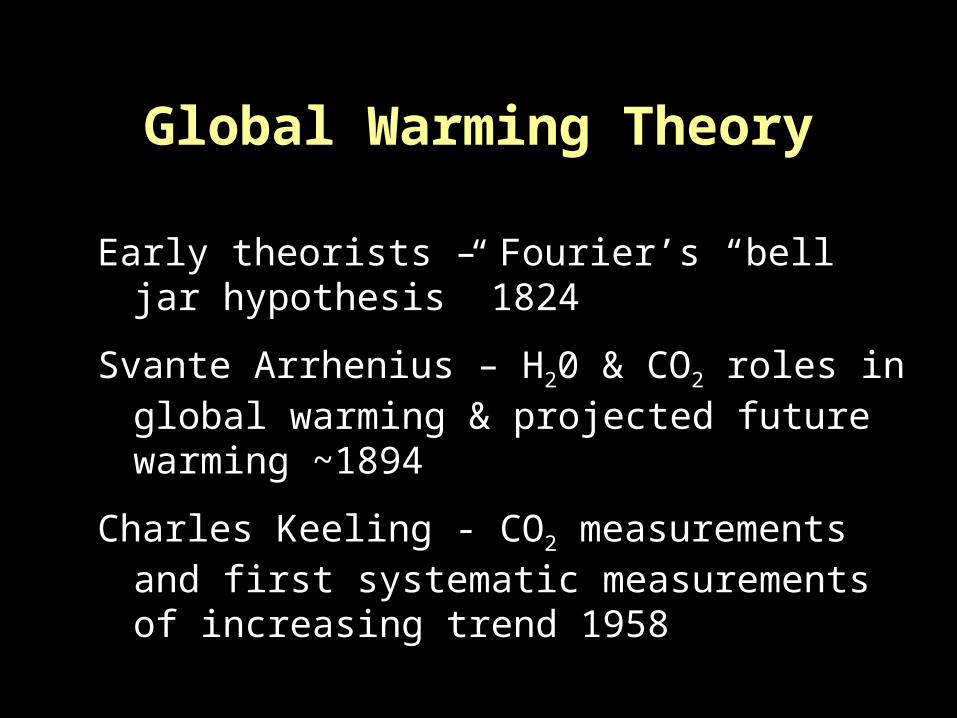
Global Warming Theory
Early theorists – Fourier’s “bell jar hypothesis” 1824
Svante Arrhenius – H20 & CO2 roles in global warming & projected future warming ~1894
Charles Keeling - CO2 measurements and first systematic measurements of increasing trend 1958
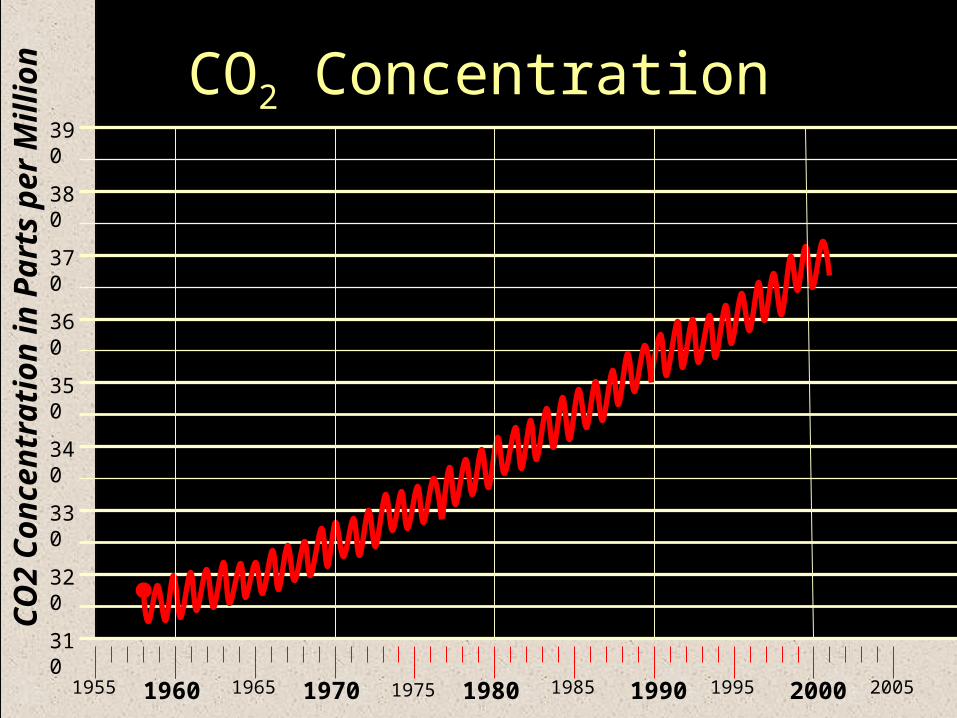
CO2 Concentration390
380
370
360
350
340
330
320
310
1960 1965 1970 1975 19801955 1985 1990 1995 2000 2005
CO
2 C
on
cen
trat
ion
in
Par
ts p
er M
illi
on

Greenhouse Gases
The three most important greenhouse gases are:• water vapor (H20)• carbon dioxide (CO2) • methane (CH4)
Other greenhouse gases include: • nitrous Oxide (N20)• fluorinated compounds (CFCs, HFCs & PFCs)

Global Warming Potential
► CO2 = 1
► CH4 = 21
► N2O = 310
► HFC (hydrofluorocarbons) = 1,300
► CFCs (chlorofluorocarbons) = 6,500
► SF6 (sulphur hexafluoride) = 23,900
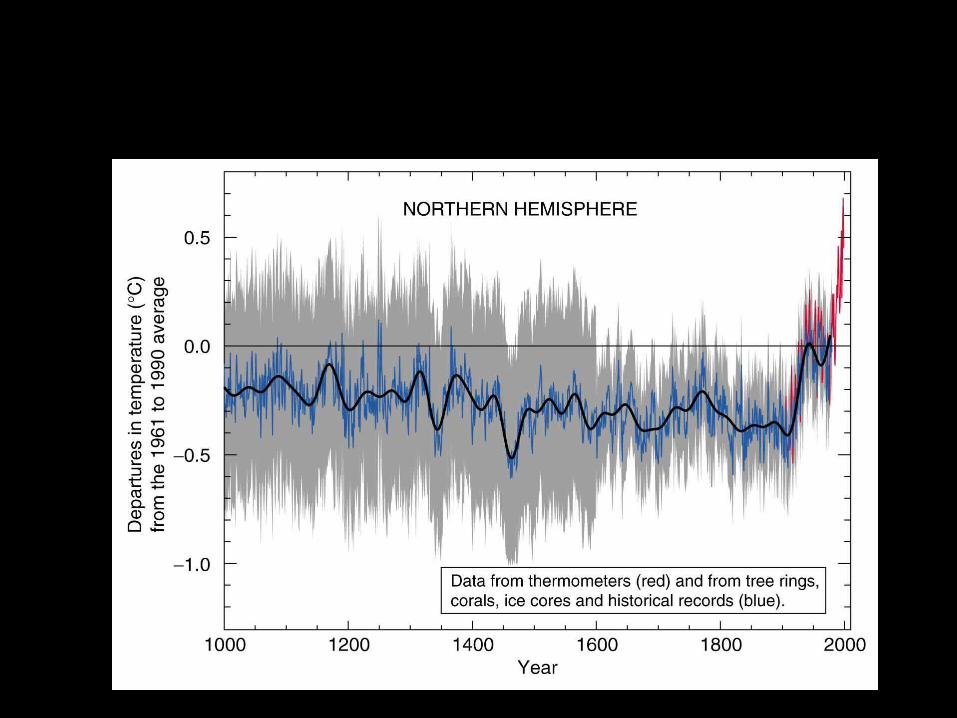
Variations of the Earth’s surface temperature for the past 1,000 years
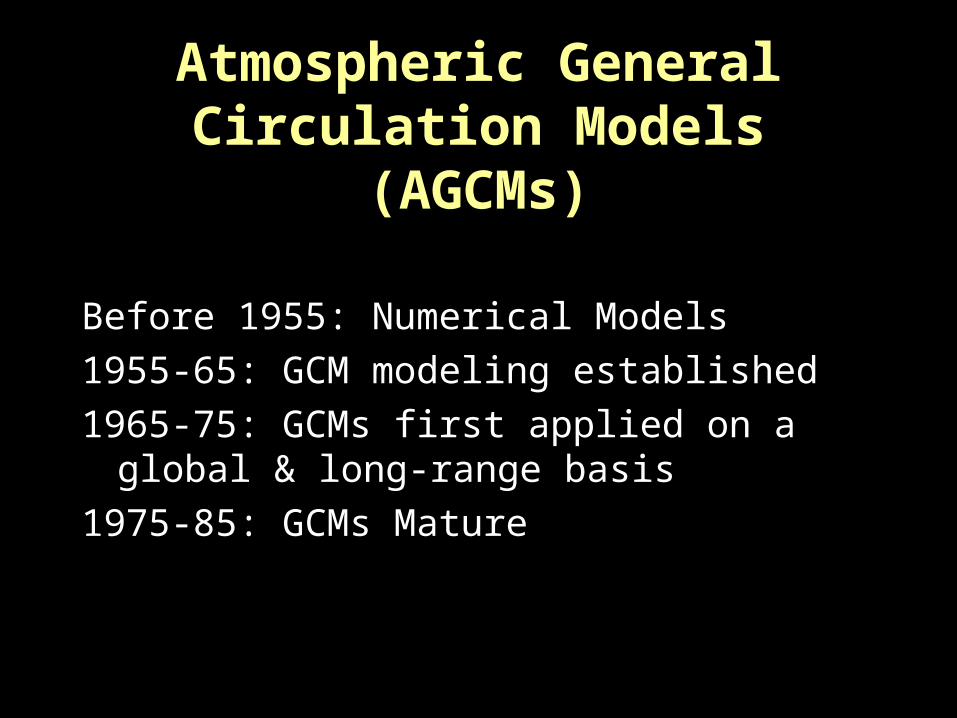
Atmospheric General Circulation Models (AGCMs)
Before 1955: Numerical Models
1955-65: GCM modeling established
1965-75: GCMs first applied on a global & long-range basis
1975-85: GCMs Mature

Oceanic CirculationOceanic Circulation

Global ocean circulation
A simplified view of the global thermohaline conveyor belt, showing cooling and downwelling in the North Atlantic, warming and freshening in the southern hemisphere, and return flow as a warm surface current.

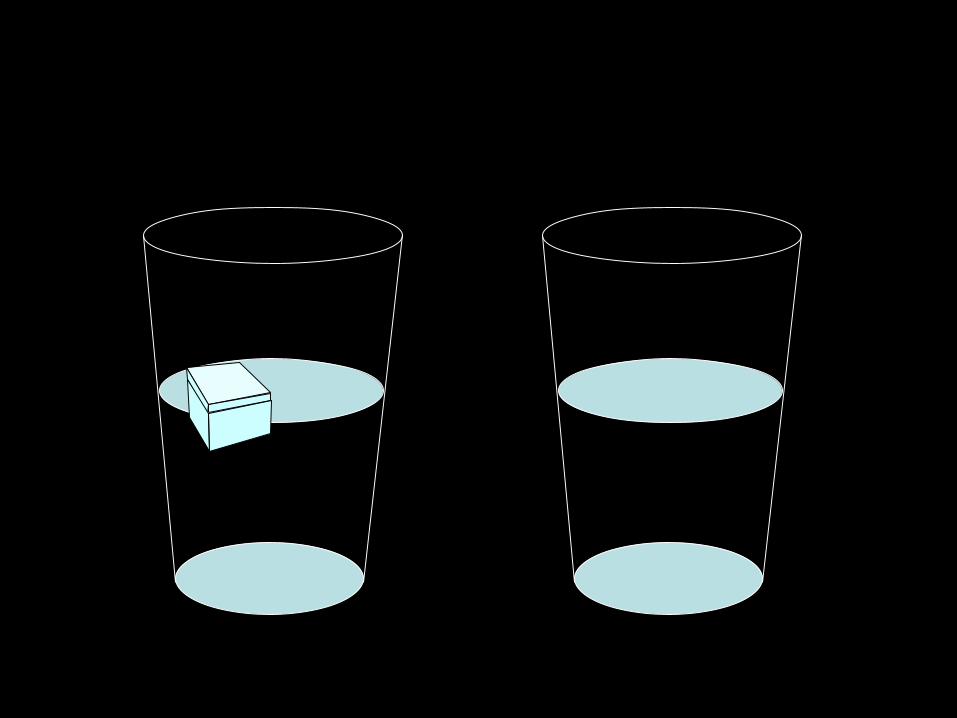
Clouds Reduce Temperature Range
Clouds Reduce Temperature Range
Clouds reflect solar radiation during the day.
Clouds retard loss ofheat during the night.

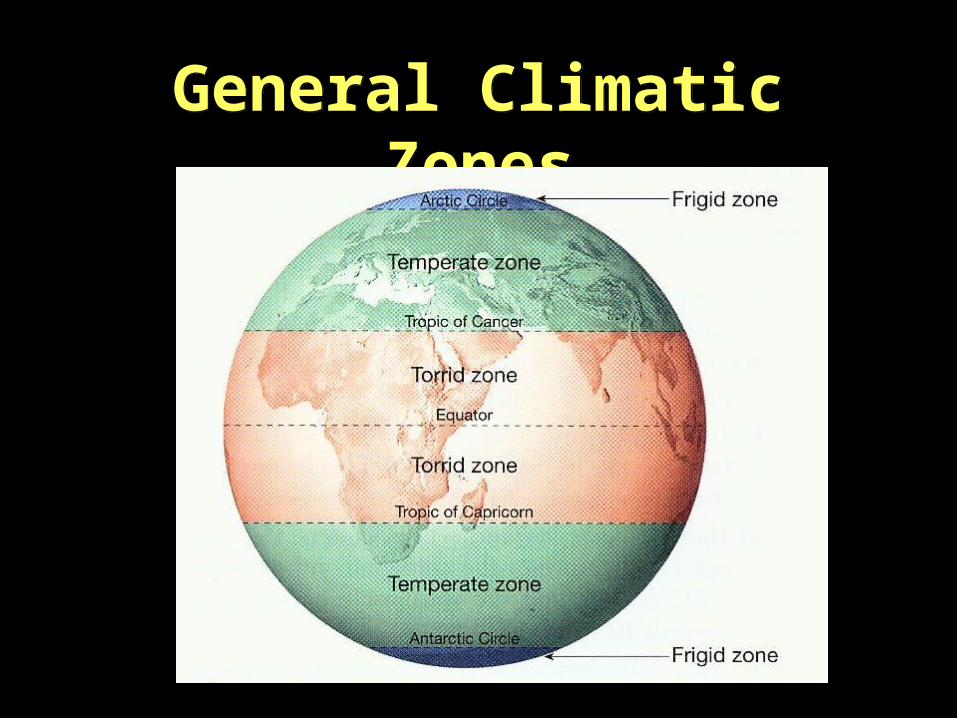
General Climatic ZonesGeneral Climatic Zones

Coriolis Effect:The deflective effect of Earth’s rotation on free-moving objects.
Deflection is to the right in the Northern Hemisphere & to the left in the Southern Hemisphere


Variation inTroposphere Depth

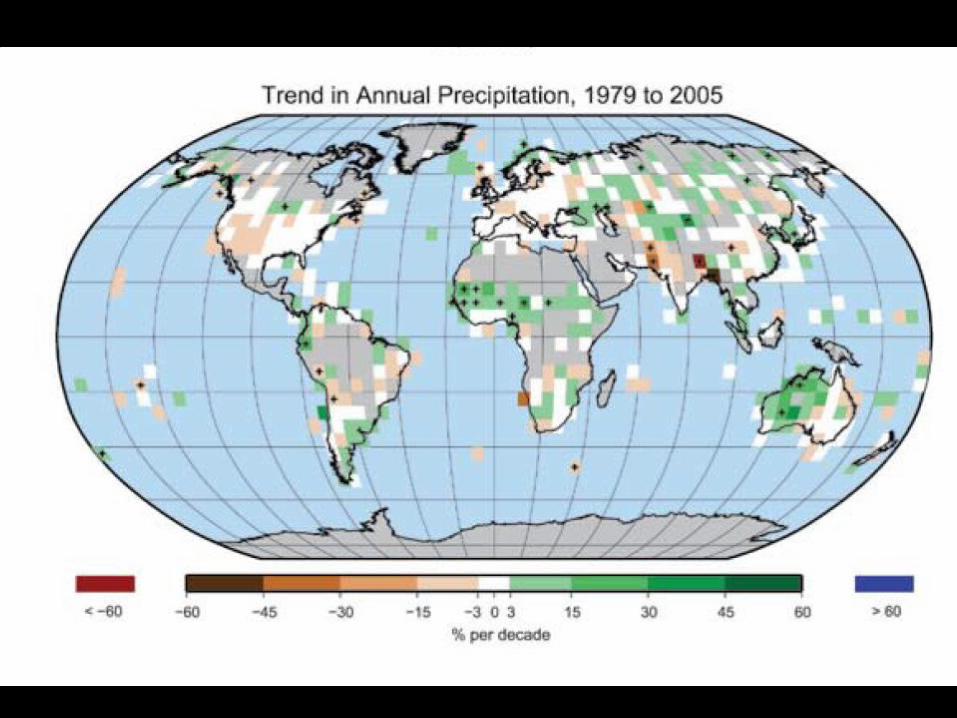
Zonal Precipitation
Patterns
Zonal Precipitation
Patterns

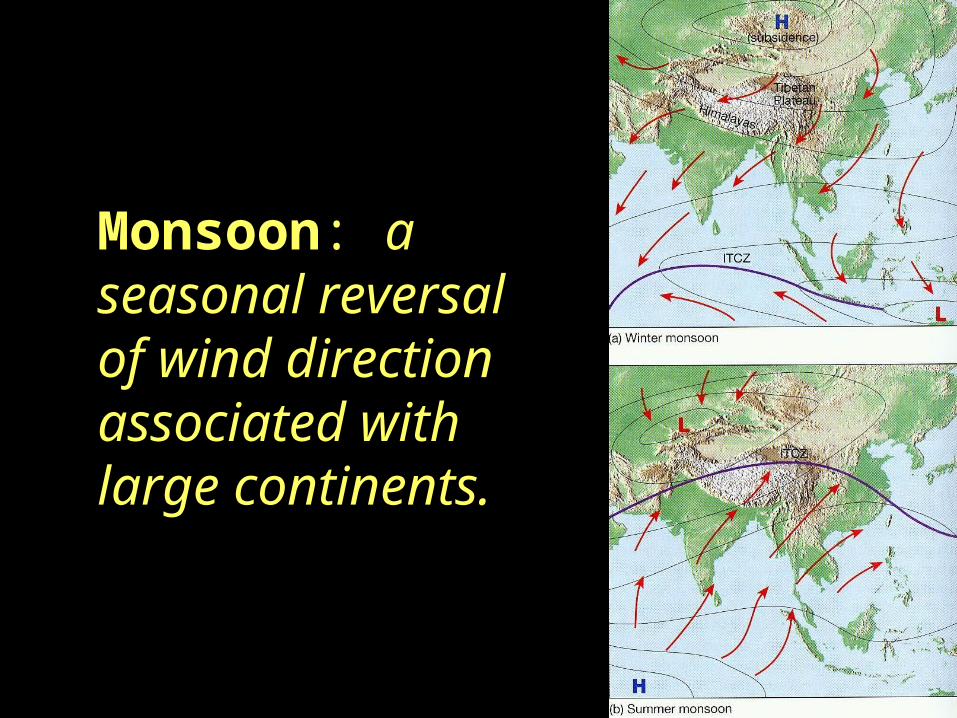
Monsoon: a seasonal reversal of wind direction associated with large continents.


Global Distribution of Precipitation - JanuaryGlobal Distribution of Precipitation - January

What is the Intergovernmental Panel on Climate Change?
The IPCC was set up jointly by the World Meteorological Organization and the United Nations Environment Programme in November 1988. Its mandate is to:
“Assess the scientific, technical, and socio-economic information relevant for the
understanding of the risk of human-induced climate change.”

The IPCC does NOT conduct any research nor does it monitor climate related data or parameters.
The IPCC role is to assess on a comprehensive, objective, open and transparent basis the latest scientific, technical and socio-economic literature produced worldwide relevant to the understanding of the risk of human-induced climate change, its observed and projected impacts and options for adaptation and mitigation.
IPCC reports are intended to be NEUTRAL with respect to policy, although they need to deal objectively with policy relevant scientific, technical and socio economic factors.
IPCC reports are to be of high scientific and technical standards, and aim to reflect a range of views, expertise and wide geographical coverage.”

Working Groups of the IPCC:
Working Group I (WG1) Assesses the physical scientific aspects of the climate system & climate change
Working Group II (WG2) Assesses the vulnerability of socio-economic & natural systems to climate change, negative & positive consequences of climate change, & options for adapting to it.
Working Group III (WG3) Assesses options for mitigating climate change through limiting or preventing greenhouse gas emissions & enhancing activities that remove them from the atmosphere.
Task Force on National oversees the National Greenhouse GasGreenhouse Gas Inventories ProgrammeInventories


What do critics say of the IPCC?
Critics contend that expression of reservations by scientists regarding an impending ‘climate catastrophe’ are sometimes castigated by others within the scientific community, thereby undermining the scientific process
“[S]elf-censorship in the minds of scientists ultimately leads to a sort of deafness toward new, surprising insights that compete with or even contradict the conventional explanatory models. Science is deteriorating into a repair shop for conventional, politically opportune scientific claims. Not only does science become impotent; it also loses its ability to objectively inform the public.”
Hans von StorchDirector of the Institute for Coastal ResearchGKSS Research Centre (Germany)Professor, Meteorological InstituteUniversity of Hamburg

What is the source of controversy provoked by the IPCC?
“Given authority by supranational bodies such as the UN, but unaccountable to their own national governments, a handful of scientific activists could make a disproportionate impact upon the debate, and make policy recommendations outside of the constraints of policy and practicality … [This is part of a ] trend towards ‘international’ policymaking, where the authority of national governments is diminished in relation to institutions such as the United Nations or the European Union … [R]emote, yet powerful, bureaucracies raises a number of questions about democracy and accountability … [S]cience becomes allied with advocating what should be done rather than telling us what is currently known and what the complexities and uncertainties involved with that knowledge are.”
Tony GillandScience & Society DirectorInstitute of Ideas (Great Britain)[holds a degree in philosophy, politics & economics from Oxford)
Published in Spiked, a British on-line journal that hails itself as being dedicated “to raising the horizons of humanity by waging a culture war of words against misanthropy, priggishness, prejudice, luddism, illiberalism and irrationalism in all their ancient and modern forms.”
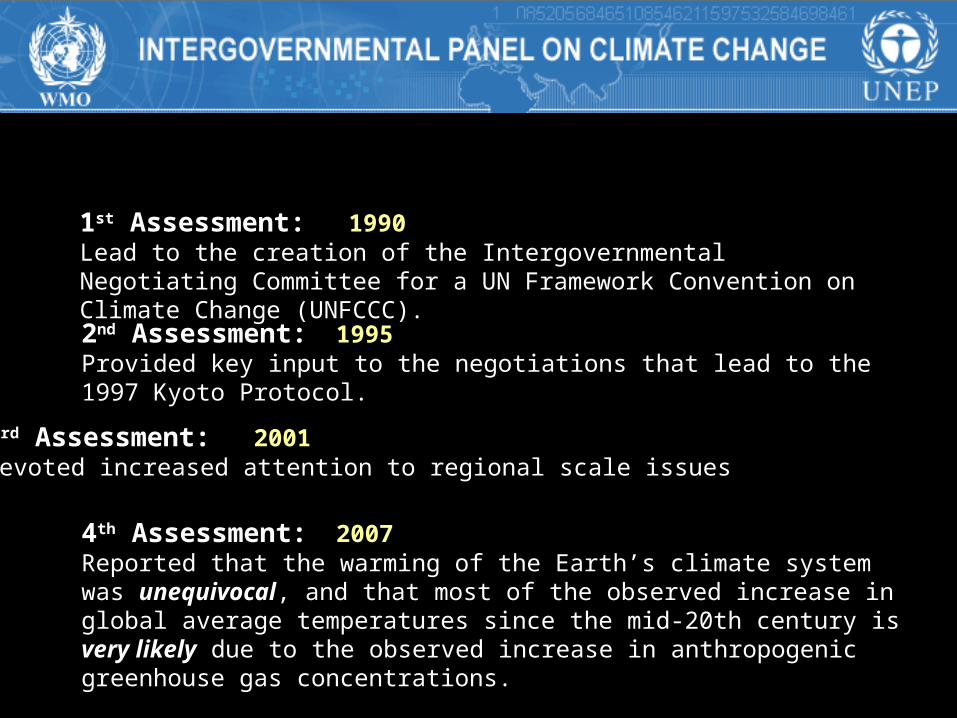
1st Assessment: 1990Lead to the creation of the Intergovernmental Negotiating Committee for a UN Framework Convention on Climate Change (UNFCCC).
2nd Assessment: 1995Provided key input to the negotiations that lead to the 1997 Kyoto Protocol.
3rd Assessment: 2001Devoted increased attention to regional scale issues
4th Assessment: 2007Reported that the warming of the Earth’s climate system was unequivocal, and that most of the observed increase in global average temperatures since the mid-20th century is very likely due to the observed increase in anthropogenic greenhouse gas concentrations.

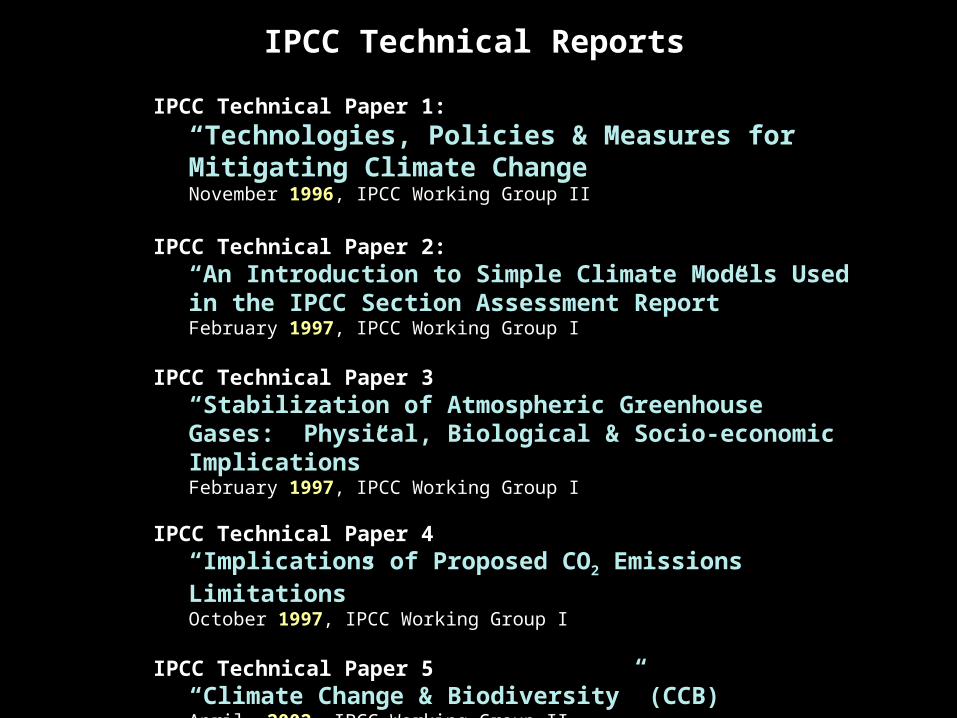
IPCC Technical Paper 1:
“Technologies, Policies & Measures for Mitigating Climate Change”November 1996, IPCC Working Group II
IPCC Technical Paper 2: “An Introduction to Simple Climate Models Used in the IPCC Section Assessment Report”February 1997, IPCC Working Group I
IPCC Technical Paper 3 “Stabilization of Atmospheric Greenhouse Gases: Physical, Biological & Socio-economic Implications”February 1997, IPCC Working Group I
IPCC Technical Paper 4 “Implications of Proposed CO2 Emissions Limitations”October 1997, IPCC Working Group I
IPCC Technical Paper 5“Climate Change & Biodiversity” (CCB)April 2002, IPCC Working Group II
IPCC Technical Reports

June
20
08
IP
CC
Wor
king
Gro
up
II

“virtually certain” > 99%
“extremely likely” > 95%
“very likely” > 90%
“likely” > 66%
“more likely than not” > 50%
“about as likely as not” 33% to 66%
“unlikely” < 33%
“very unlikely” < 10%
“extremely unlikely” < 5%
“exceptionally unlikely” < 1%
IPCC standardized “uncertainty language”IPCC standardized “uncertainty language”
“Attribution studies show that most of the observed increase in global temperatures since the mid-20th century is very likely due to the observed
increase in anthropogenic greenhouse gas concentrations.”
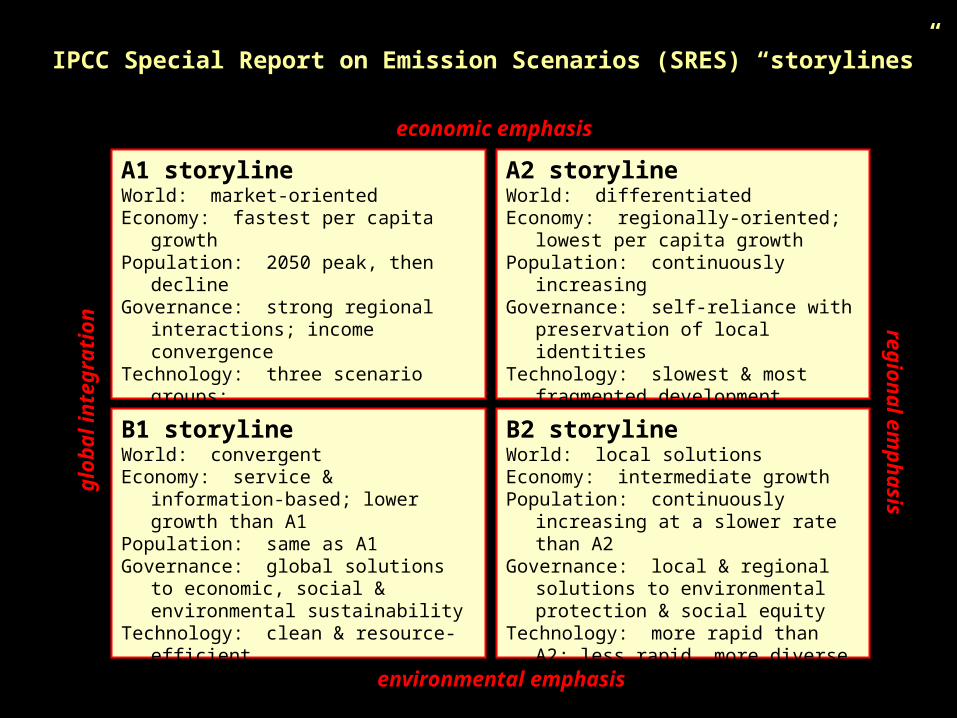
A1 storylineWorld: market-orientedEconomy: fastest per capita growthPopulation: 2050 peak, then declineGovernance: strong regional interactions;
income convergenceTechnology: three scenario groups:• A1FI: fossil-intensive• A1T: non-fossil energy sources• A1B: balanced across all sources
B1 storylineWorld: convergentEconomy: service & information-based;
lower growth than A1Population: same as A1Governance: global solutions to
economic, social & environmental sustainability
Technology: clean & resource-efficient
A2 storylineWorld: differentiatedEconomy: regionally-oriented; lowest per
capita growthPopulation: continuously increasingGovernance: self-reliance with
preservation of local identitiesTechnology: slowest & most fragmented
development
B2 storylineWorld: local solutionsEconomy: intermediate growthPopulation: continuously increasing at a
slower rate than A2Governance: local & regional solutions to
environmental protection & social equity
Technology: more rapid than A2; less rapid, more diverse than A1/B1
environmental emphasis
economic emphasis
glo
bal
inte
gra
tio
n regio
nal em
ph
asisIPCC Special Report on Emission Scenarios (SRES) “storylines”

Millennium Ecosystem Assessment - 4 ScenariosMillennium Ecosystem Assessment - 4 Scenarios
Global Orchestration
Order from
Strength
Adapting
Mosaic
TechnoGarden
sustainable fair trade (reduction improve world; transnationaldevelopment; of tariff boundaries), global public companies; globaleconomic growth; with enhancement of health; global NGO and public goods global public goods education multilateral
organizations
reserves; parks; regional trade blocs; security and multinational national-level mercantilism protection companiespolicies; conservation
local-regional integration of local local communities cooperatives, global co-management rules regulate linked to global organizationscommon-property trade; local non- communities; localinstitutions market rights equity important
green technology; global reduction technical expertise transnational eco-efficiency; of trade boundaries; valued; follow professionaltradable ecological fairly free movement opportunity; associations; NGOsproperty rights of goods, capital, & competition;
people; global openness markets inecological property
Dominant Approach Economic Social Policy Dominant SocialScenario Name for Sustainability Approach Foci Organizations

“… per capita domestic water use in 2050 is broadly similar in all world regions, at around
100 m3/yr …”
100 m3/yr = 72.4 gpcd


total column water vapor
the amount of water vapor contained in a column over a given area on Earth
cryosphere
the sum of snow, ice & frozen water on land – said to store about 75% of the
world’s fresh water