Embed Size (px)
Citation preview

What is the Risk of European Sovereign Debt Defaults?
Fiscal Space, CDS Spreads and Market Pricing of Risk
September 2011 Joshua Aizenman Department of Economics University of California Santa Cruz, CA 95064 [email protected]
Michael Hutchison Department of Economics University of California Santa Cruz, CA 95064 [email protected]
Yothin Jinjarak DeFiMS, SOAS University of London UK WC1H0XG [email protected]
Abstract
We estimate the pricing of sovereign risk for sixty countries based on fiscal space (debt/tax; deficits/tax) and other economic fundamentals over 2005-10. We measure how accurately the model predicts sovereign credit default swap (CDS) spreads, focusing in particular on the five countries in the South-West Eurozone Periphery (Greece, Ireland, Italy, Portugal, and Spain). Dynamic panel estimates of the model suggest that fiscal space and other macroeconomic factors are statistically significant and economically important determinants of market-based sovereign risk. Although the explanatory power of fiscal space measures drop during the crisis, the TED spread, trade openness, external debt and inflation play a larger role. As expectations of market volatility jumped during the crisis, the weakly concavity of creditors’ payoff probably accounts for the emergence of TED spread as a key pricing factor. However, risk-pricing of the South-West Eurozone Periphery countries is not predicted accurately by the model either in-sample or out-of-sample: unpredicted high spreads are evident during global crisis period, especially in 2010 when the sovereign debt crisis swept over the periphery area. We “match” the periphery group with five middle income countries outside Europe that were closest in terms of fiscal space during the European fiscal crisis. We find that Eurozone periphery default risk is priced much higher than the “matched” countries in 2010, even allowing for differences in fundamentals. One interpretation is that the market has mispriced risk in the Eurozone periphery. An alternative interpretation is that the market is pricing not on current fundamentals but future fundamentals, expecting the periphery fiscal space to deteriorate markedly and posing a high risk of debt restructuring. Adjustment challenges of the Eurozone periphery may be perceived as economically and politically more difficult than the matched group of middle income countries because of exchange rate and monetary constraints. Keywords: CDS spreads, sovereign risk, fiscal space, default risk, Eurozone JEL: E43, F30, G01, H63 *We thank seminar participants at the Bank for International Settlements, Danmarks Nationalbank, the Bank of Canada, Columbia-Tsinghua international economics workshop, Chulalongkorn University (Sasin), and Association for Public Economic Theory 2011 Conference for very helpful comments.
2
1. Introduction
During 2000 to 2006, the OECD and most emerging markets experienced a
remarkable decline in macroeconomic volatility and the price of risk. This period turned
out to be the tail-end of the Great Moderation, a precursor of the turbulences leading to
the global financial crisis of 2008-09, the consequent increase in risk premia, and the
focus on fiscal challenges and the importance of fiscal space in navigating future
economic challenges. The latter stages of the crisis, unfolding in 2010, focused attention
on the heterogeneity of the Euro block, and the unique challenges facing the five South-
West Eurozone Periphery countries, or SWEAP group (Greece, Ireland, Italy, Portugal,
and Spain), in adjusting to fiscal fragility in the context of a ten-year old currency union.1
This paper investigates the pricing of risk associated with the sovereign debt crisis
that escalated during 2010 in several European countries. Our objective is to determine
whether the perception of relatively high sovereign default risk of the fiscally distressed
Euro area countries, as seen in market pricing of credit default swap (CDS) spreads, may
be explained by existing past or current fundamentals of debt and deficits relative to tax
revenues – which we term de facto fiscal space – and other economic determinants.2 Our
analysis allows us to address several questions. Does fiscal space help systematically
explain the evolution of the market pricing of risk beyond that embedded in other
macroeconomic indicators? Was risk in some markets (e.g. SWEAP) “overpriced” in
1 The SWEAP acronym for these five countries is used in Buiter and Rahbari (2010). 2Our measure of fiscal space is from Aizenman and Jinjarak (2011). They propose a stock and flow measure of de facto fiscal space. The stock variable is defined as the inverse of the tax-years it would take to repay the public debt. In this paper, fiscal space is measured both as outstanding government debt and government deficits, relative to the de facto tax base. The deficits measure is the realized tax collection, averaged across several years to smooth for business cycle fluctuations.
3
2010 judging by model predictions using the prevailing values of fiscal space other
macro variables?
Our objectives for the empirical work are three-fold. Firstly, we determine
whether CDS spreads (in a panel regression setting) are related to fiscal space measures
and other economic determinants. Secondly, we address whether there is an identifiable
dynamic pattern to CDS spreads during the crisis period. Thirdly, we investigate pricing
differentials of CDS spreads in the Euro area, and the SWEAP in particular, compared to
other countries. We seek to answer the question of whether Euro area and SWEAP CDS
spreads follow the same pattern as the rest of the world or may they considered
“mispriced” in some sense, especially during the 2010 European debt crisis.
To this end, we develop a pricing model of sovereign risk for a large number of
countries (60) within and outside of Europe, before and after the global financial crisis,
based on fiscal space and other economic fundamentals including the foreign interest
rate, external debt, trade openness, nominal depreciation, inflation, GDP/Capita and
economic growth. We use this dynamic panel model to explain CDS spreads and
determine whether the market pricing of risk is comparable in the affected European
countries and elsewhere in the world. By this methodology, and using in-sample and out-
of-sample predictions, we can determine whether there are systematically large prediction
errors for the CDS spreads during the global financial crisis and in 2010 when the
sovereign debt crisis in Europe intensified. Systematically large prediction errors may be
due to mispricing of risk or may be attributable to expectations of a future decline in
fundamentals that lead to higher default risk. We also “match,” on the basis of similar
fiscal space, each SWEAP country with a corresponding Middle Income country. This
4
provides additional information on the market pricing of risk between SWEAP and
countries with similar fiscal conditions but, unlike SWEAP, with histories of debt
restructuring.
Our investigation reveals a complex and time-varying environment in the market
for sovereign default risk. Specifically, we find empirically a key role of fiscal space in
pricing sovereign risk, controlling for other relevant macro variables. The link is
economically and statistically strong, and robust to the time dimension of the CDS
premium, sample period, included control variables and estimation technique. We find
that risk of default in the SWEAP group appeared to be somewhat “underpriced” relative
to international norms in the period prior to the global financial crisis and substantially
“overpriced” countries during and after the crisis, especially in 2010, with actual CDS
values much higher than the model would predict given fundamentals. In addition,
compared to the matched group, controlling for fiscal space and macroeconomic
conditions, all of the SWEAP countries have much higher default risk assessments
measured by CDS premiums.
The next section discusses the data. The third section provides a preliminary
statistical analysis. The fourth section presents the empirical results. We close the paper
with a discussion on possible interpretation of the emerging SWEAP risk premia,
including the handicapping effect of being a member of a currency union, which reduces
the country’s scope of adjustment via exchange rate and monetary policy.
2. CDS Spreads as a Measure of Sovereign Default Risk
2.1 CDS Spreads on Sovereign Bonds

5
We measure the market perception of sovereign default risk by the spreads on
sovereign credit default swaps (CDS) at various maturities (tenors).3 CDS instruments
are mainly transacted in over-the-counter (OTC) derivative markets. The spreads
represent the quarterly payments that must be paid by the buyer of CDS to the seller for
the contingent claim in the case of a credit event, in this case non-payment (or forced
restructuring) of sovereign debt, and is therefore an excellent proxy for market-based
default risk pricing.4 The total CDS market grew from about 10 trillion USD in 2004,
when statistics were first systematically reported, to a peak prior to the global financial
crisis of almost 60 trillion USD in mid-2008, and then fell sharply. The estimated gross
(net) notional amount of sovereign CDS outstanding was 2,447 (233) billion USD in
2010, compared to about 2,196 billion USD in government-issued international debt
securities (BIS, 2010). Figure 1 shows the outstanding notional amounts of CDS
instruments on sovereign bonds across countries in late February 2011. Italy has the
largest outstanding CDS notional amounts, at almost USD 300 billion, followed by
Brazil, Spain and Turkey with notional amounts outstanding of over USD 150 billion.
3 See Packer and Suthiphongchai (2003) and Fontana and Scheicher (2010) for discussions of sovereign CDS markets. 4 An alternative proxy for default risk is the interest rate spread of sovereign debt. From an empirical standpoint, there are three main advantages of using CDS spreads rather than interest rate spreads. Firstly, CDS statistics provide timelier market-based pricing with larger coverage of industrial and developing countries than sources for national bond market rates. Secondly, using CDS spreads avoids the difficulty in dealing with time to maturity as in the case of using interest rate spreads (of which the zero yields would be preferred). Recent estimates from the Bank for International Settlements suggest that the average original and the remaining maturities of government debt instruments vary markedly across countries (BIS, 2010). Thirdly, interest rate spreads embed inflation expectations and demand/supply for credit conditions as well as default risk. We are only interested in default risk.
6
Sovereign CDS provide a market-based real time indicator of sovereign credit
quality and default risk. We consider sovereign CDS spreads at several maturities—three,
five and ten-year maturities, across industrial countries and emerging markets. Despite
the low probability of a credit event in most advanced economies, CDS markets are still
active in most markets as buyers can use the sovereign CDS as a hedge and for mark-to-
market response.5 Buyers of the sovereign CDS may or may not own the underlying
government bonds. The latter case is termed ‘naked’ sovereign CDS, and frequently
labeled as a speculation.
CDS prices in our study are taken from CMA Datavision, a platform that is based
on quotes collected from a consortium of over thirty independent swap market
participants. CMA aggregates the most recent quotes and delivers the data intraday. The
quoting convention for CDSs is the annual premium payment as a percentage of the
notional amount of the reference obligation. The sovereign CDS spreads are reported in
basis points, with a basis point equals to $1,000 to insure $10 million of debt.6 CDS
spreads are London closing values. While CMA is not the sole provider of CDS prices,
Mayordomo et al. (2010) find that, in a comparison of six major providers, CMA quotes
are most consistent with a price discovery process. The majority of sovereign CDS in the
market are denominated in the US dollar; in our sample, about one-third of the CDS is
Euro-denominated. The CMA data set provides a broad coverage of CDS pricing over
countries and years.
5 Sovereign CDS can also be used to supplement corporate CDS to hedge for country risk. 6 For example, if the spread is 197 basis points, meaning 197,000 USD to insure against 10,000,000 in sovereign debt for 10 years; 1.97% of notional amount needs to be paid each year, so 0.0197 x 10 million = $197,000 per year.

7
Appendix A provides data sources and Appendix B a list of countries in the entire
sample, the subset of countries included in the empirical estimation, and means of 3, 5
and10-year CDS spreads (in basis points), fiscal space and other macroeconomic
indicators during the sample (2005-10).
2.2 Empirical Studies on CDS Spreads
Empirical studies of CDS (corporate and sovereign) are relatively new and
usually deal with market microstructure issues. Our study, by contrast, is in line with the
macro/international finance literature which considers macroeconomic determinants of
country risk assessments and financial crises.
Several findings are particularly relevant to our analysis. As noted by Packer and
Suthiphongchai (2003) and others, the CDS premium should in principle be
approximately equal to the credit spread of the reference bond of the same maturity under
certain conditions. However, Fontana and Scheicher (2010) demonstrate that the “basis”,
i.e. difference between CDS spreads and the spreads on the underlying government
bonds, was not zero in Eurozone CDS markets during late 2010. They suggest that
sizable deviations are attributable to limits to arbitrage and slow moving capital.
Secondly, at high frequency (intraday), differences in credit quality (measured by CDS
prices) are found to explain sovereign yield spreads of the Euro area governments (Beber,
Brandt, and Kavajecz, 2009).7 Fontana and Scheicher (2010) argue that high CDS
premium in late 2010 during the Eurozone debt crisis may be partly attributable to a
7 Beber et al. study microstructure data of bond quotes and transactions from the interdealer markets, covering Austria, Belgium, Finland, France Germany Greece, Italy, Netherlands, Portugal and Spain. Their sample period is April 2003 to December 2004.
8
decline in the appetite for credit-risky instruments and falling market liquidity rather than
entirely due concerns about principle losses on outstanding sovereign debt. In addition,
empirical research finds that daily sovereign interest spreads are more likely to lead
sovereign CDS spreads in emerging markets (Ammer and Cai, 2007).8 Taken together,
both studies suggest that sovereign interest rates and CDS spreads have common
underlying causes, rather than one driving the other.
There is evidence that CDS spreads may be driven by macro economic
conditions. Amato (2005) decomposes CDS spreads into risk premium and risk aversion
and finds that both are influenced by macroeconomic conditions. Packer and Zhu (2005)
find that contractual terms influence CDS spreads, but that significant “regional effects”
(differential pricing across regions) is also evident. Micu et al. (2006) also find that credit
rating announcements have a large influence on CDS spreads. In explaining recent
developments, Berndt and Obreja (2010) suggest that “economic catastrophe risk” rose
sharply in 2007-08 pushing up CDS spreads. Cecchetti et al. (2010) plot several fiscal
indicators against CDS spreads for advanced economies. They find correlations across
countries with substantial heterogeneity.9 Longstaff et al. (2011) study sovereign CDS of
several emerging markets from October 2000 to January 2010. They found that the
sovereign spreads are more associated with global factors (US stock, treasury, and high
8 Ammer and Cai examine daily data from February 2001 to March 2005, covering Brazil, China, Colombia, Mexico, Philippines, Turkey, and Uruguay. On interest rates, CDS spreads, and speculation, see also the discussion of findings from the European Commission (Tait and Oakley, 2010), which suggests no strong causality between the two. 9For example,theyplottheforecastlevelofgeneralgovernmentdebt/GDPagainstJanuary2010CDSspreadsfor21advancedeconomiesandfindapositivecorrelation.

9
yield markets) than local factors (stock return, exchange rate, and foreign reserve).
Dooley and Hutchison (2009) find that financial, economic and regulatory “news”
emanating from the U.S. during the global financial crisis quickly impacted sovereign
CDS spreads in emerging markets.
3. Statistical Contours
Monthly 5-year CDS spreads from 2005-2011 are plotted for the SWEAP and
other selected countries (countries which are matched with the SWEAP group, discussed
below) in Figure 2. Judging by these spreads, financial stress in global markets emerged
in early 2008 but became dramatic and widespread in late 2008. The turbulence subsided
by mid-2009 in most countries, with the notable exception of the SWEAP group: Greece,
Ireland, Italy, Portugal, and Spain. For Greece, the unraveling of its fiscal condition in
late 2009 resulted in a manifold increase in sovereign CDS spreads. For Ireland, the
sovereign CDS spreads have widen sharply twice, in early 2009 and in late 2010. By
2010, spreads of the SWEAP group were already much higher than those of most
emerging market countries (e.g. above the spreads of South Africa, Mexico, Panama,
Malaysia and Colombia in Figure 2). On the other hand, sovereign spreads of Germany
and the US remained very low throughout the period (not shown).
Table 1 reports the annual mean values (standard deviation in parentheses) of
sovereign CDS spreads (5-year tenor), fiscal space and macroeconomic fundamentals for
SWEAP and other country groupings. The table shows average values for the period
before crisis (2005-07) and during the crisis (2008-10 and individual years). The fall of
10
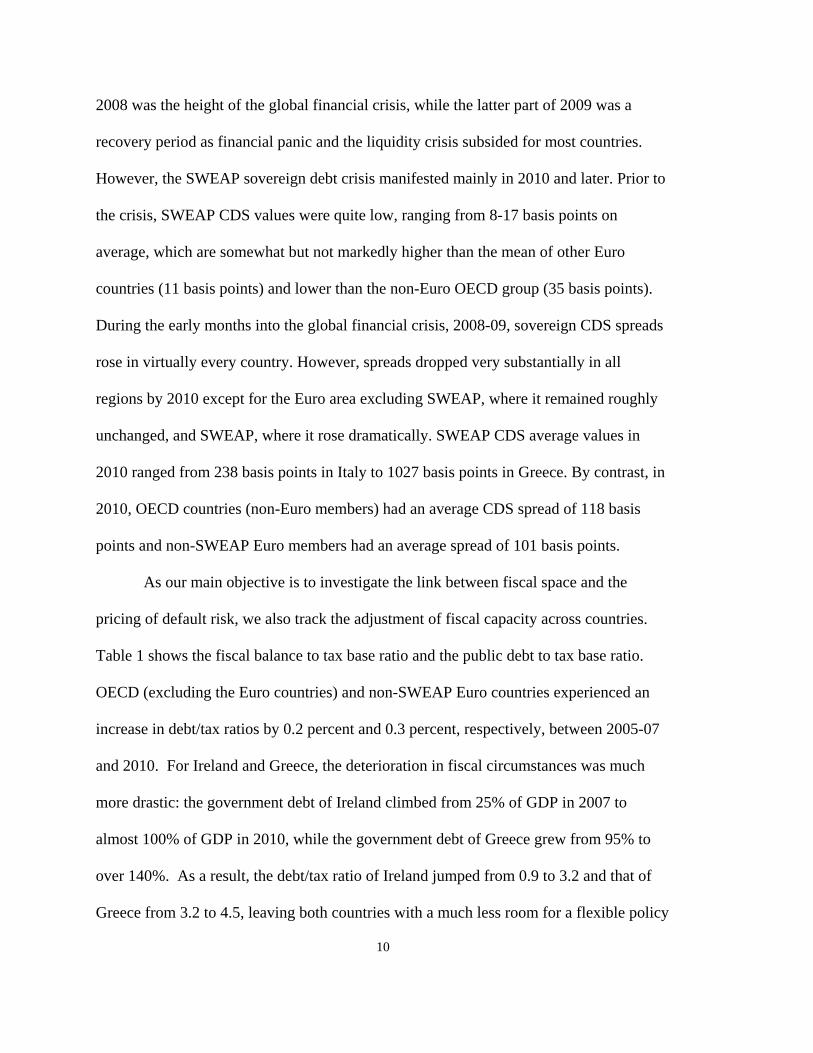
2008 was the height of the global financial crisis, while the latter part of 2009 was a
recovery period as financial panic and the liquidity crisis subsided for most countries.
However, the SWEAP sovereign debt crisis manifested mainly in 2010 and later. Prior to
the crisis, SWEAP CDS values were quite low, ranging from 8-17 basis points on
average, which are somewhat but not markedly higher than the mean of other Euro
countries (11 basis points) and lower than the non-Euro OECD group (35 basis points).
During the early months into the global financial crisis, 2008-09, sovereign CDS spreads
rose in virtually every country. However, spreads dropped very substantially in all
regions by 2010 except for the Euro area excluding SWEAP, where it remained roughly
unchanged, and SWEAP, where it rose dramatically. SWEAP CDS average values in
2010 ranged from 238 basis points in Italy to 1027 basis points in Greece. By contrast, in
2010, OECD countries (non-Euro members) had an average CDS spread of 118 basis
points and non-SWEAP Euro members had an average spread of 101 basis points.
As our main objective is to investigate the link between fiscal space and the
pricing of default risk, we also track the adjustment of fiscal capacity across countries.
Table 1 shows the fiscal balance to tax base ratio and the public debt to tax base ratio.
OECD (excluding the Euro countries) and non-SWEAP Euro countries experienced an
increase in debt/tax ratios by 0.2 percent and 0.3 percent, respectively, between 2005-07
and 2010. For Ireland and Greece, the deterioration in fiscal circumstances was much
more drastic: the government debt of Ireland climbed from 25% of GDP in 2007 to
almost 100% of GDP in 2010, while the government debt of Greece grew from 95% to
over 140%. As a result, the debt/tax ratio of Ireland jumped from 0.9 to 3.2 and that of
Greece from 3.2 to 4.5, leaving both countries with a much less room for a flexible policy

11
response on the fiscal side. The large increase of debt/tax ratios in both countries captures
a high degree of distress in their economic fundamentals, including the government
assumption of banking sector liabilities in the case of Ireland. Similarly large
deteriorations in fiscal space for these countries are also evident in the fall in fiscal
balance to tax ratios.
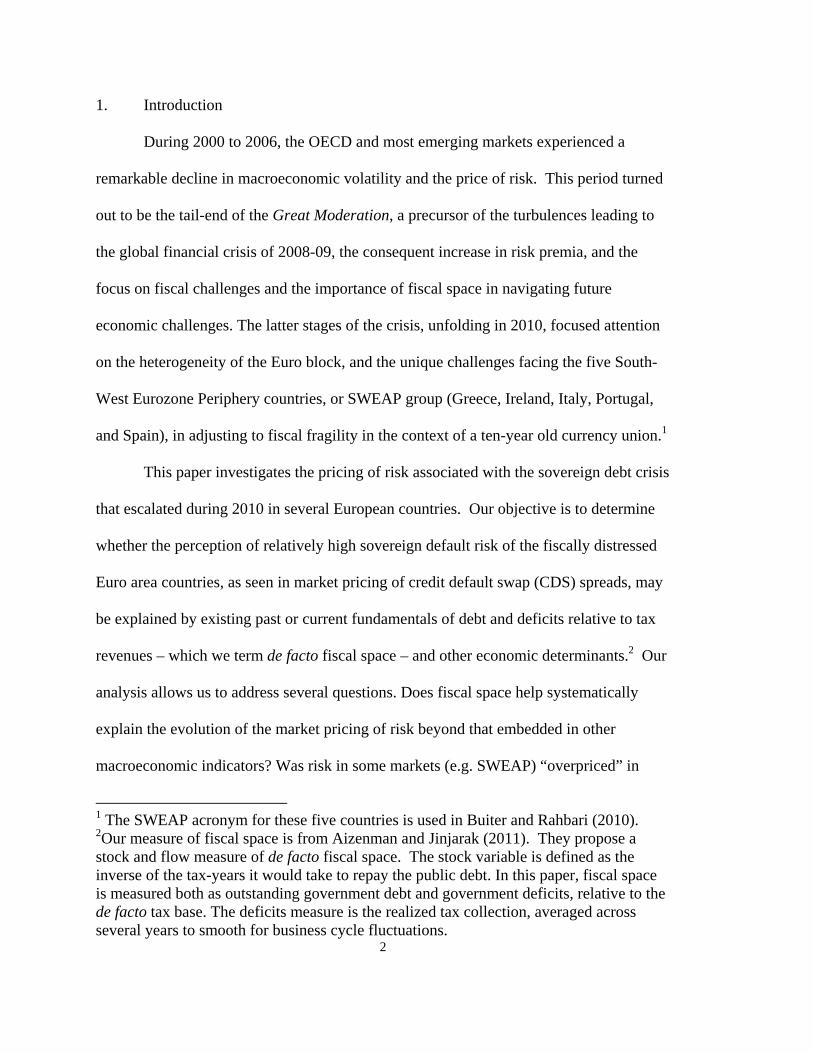
We illustrate further the 2005-07 fiscal preconditions, as measured by debt/tax
(and debt/gdp) and deficit/tax (deficit/gdp), in the two panels of Figure 3 by country
group. Lower pre-crisis government debt and lower fiscal deficits relative to the tax base
imply greater fiscal capacity. The figure shows that fiscal space was weakest (highest
levels of debt and deficits relative to the tax base) in the middle-income countries,
although the average debt to gdp ratio was lower than the other groups. This reflects
generally lower tax bases in the middle income countries. Generally, the SWEAP had
more limited fiscal space during the tranquil period than other high-income groups –
higher average debt and deficits to the relative to the tax base (despite a significant
budget surplus in Ireland during this period), and a higher level of debt to GDP.
4. Methodology and Empirical Results
4.1 Methodology
The dependent variables in our formal empirical work are sovereign CDS spreads
of 5 year maturity (regressions with 3 and 10-year maturities are shown in the appendix
table),10 estimated in a panel regression, yit i t yit1 it+ it ; where y is the
10 Our CDS data set contains 1-10 year maturities. We focus on the 5-year maturity since this is the deepest and most actively traded CDS market. While there is no precise

12
CDS spread, i stands for country and t for year; X is a vector of controls. The sample
covers a panel of 60 countries from 2005-10. The vector X includes fiscal space
(government debt/tax and fiscal deficit/tax)—the focus of our work—as well as several
other variables that frequently employed in the literature to explain country risk. These
variables are the TED spread, external debt (total foreign liabilities/GDP), trade openness
(trade/GDP) and inflation.
As the conditions for consistent estimation in the dynamic panel are known to be
demanding, our solution is to work with both a simple fixed-effects model and other
estimation specifications, including clustered standard errors and the Arellano-Bond
dynamic panel estimator. Arellano-Bond is a GMM estimator with a instruments
(exogenous and lagged values), well suited to the problem at hand, with a substantially
larger number of cross-section units (50 countries), but requires many period of data as
the instruments to account for the correlation of lagged dependent variable and the
unobserved error terms. We consider fixed effects, clustered standard errors, and GMM
in several variants of the model as bounding the causal effects of interest. The sovereign
spreads are estimated in level. We also consider for GMM the dependent variable in log
multiplied by a hundred, allowing the coefficients to be interpreted in terms of a
percentage change of sovereign default risks (this terminology also aligns with standard
practice in the financial sector that discusses the percentage change of CDS spreads).
international account of government debt maturity, recent statistics suggest that the average original maturity of central government debts is around 10 years for both emerging markets and industrial countries (BIS, 2010). Hence, we also report results for 10-year maturities in the appendix, as well as 3-year maturities for a robustness test.
13
4.2 Dynamics of CDS Spreads and Euro/SWEAP Pricing Differentials
Table 2 considers the dynamics and structure of CDS pricing over the 2005-10
sample period. Differential pricing for the SWEAP and other Eurozone countries (non-
SWEAP) is investigated. To focus on CDS pricing dynamics during the global and
European financial turmoil, we include time dummy variables (t2008-t2010) for three
crisis years: 2008 is identified as the central part of the global financial crisis, 2009 is
identified as a partial recovery period, and 2010 is identified with the SWEAP debt crisis
and post-global financial crisis. We also include interaction terms between the three time
dummy variables and the SWEAP countries (dummy variables denoting a SWEAP
country) and between the three dummy variables and the non-SWEAP Euro countries.
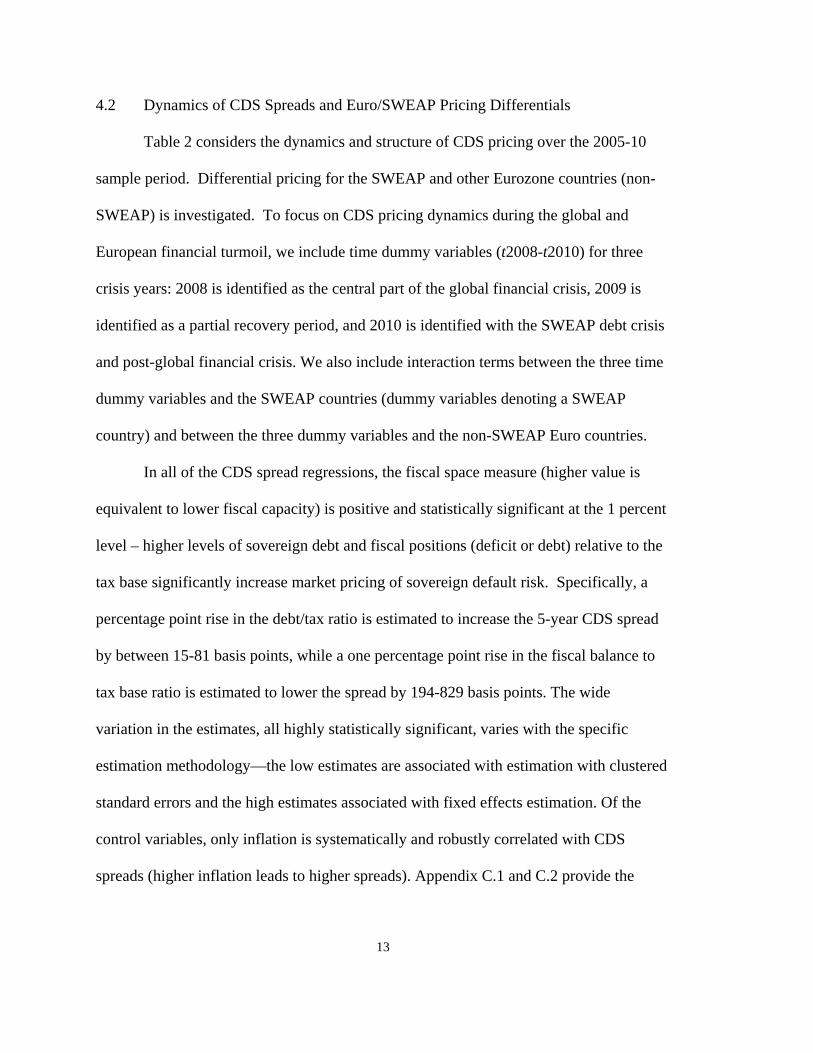
In all of the CDS spread regressions, the fiscal space measure (higher value is
equivalent to lower fiscal capacity) is positive and statistically significant at the 1 percent
level – higher levels of sovereign debt and fiscal positions (deficit or debt) relative to the
tax base significantly increase market pricing of sovereign default risk. Specifically, a
percentage point rise in the debt/tax ratio is estimated to increase the 5-year CDS spread
by between 15-81 basis points, while a one percentage point rise in the fiscal balance to
tax base ratio is estimated to lower the spread by 194-829 basis points. The wide
variation in the estimates, all highly statistically significant, varies with the specific
estimation methodology—the low estimates are associated with estimation with clustered
standard errors and the high estimates associated with fixed effects estimation. Of the
control variables, only inflation is systematically and robustly correlated with CDS
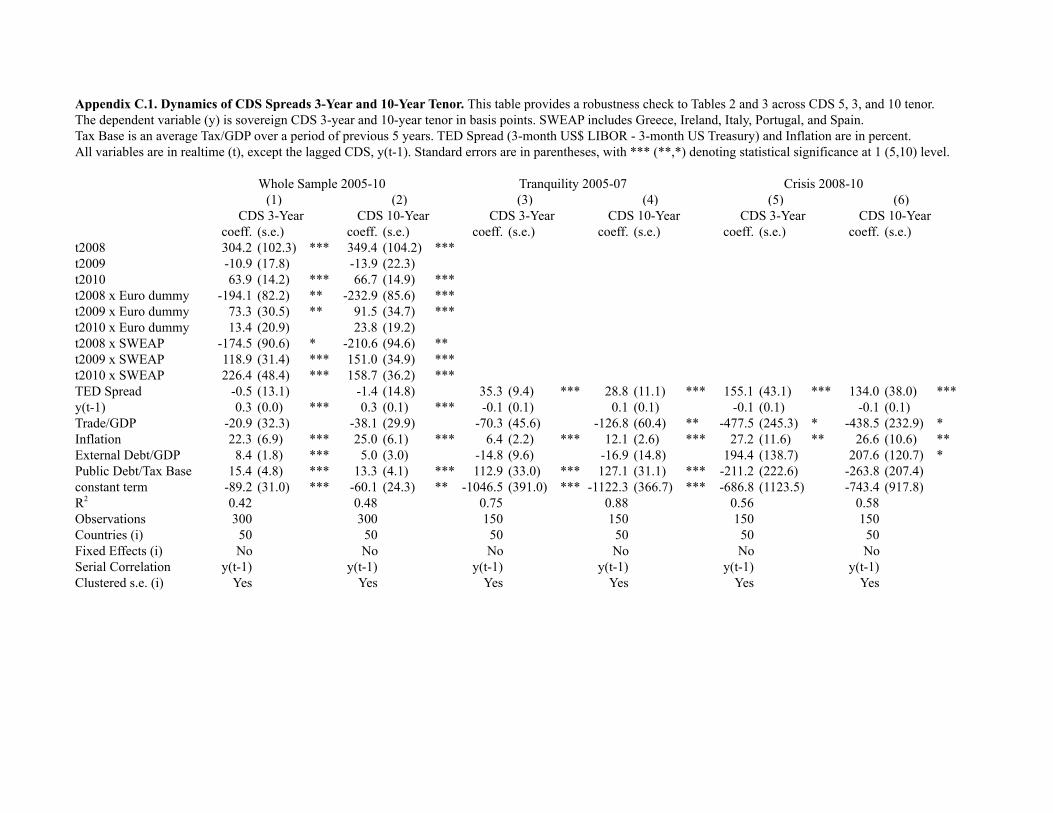
spreads (higher inflation leads to higher spreads). Appendix C.1 and C.2 provide the
14
robustness checks, supporting the effect of fiscal conditions on sovereign spreads in
different econometric specifications.11
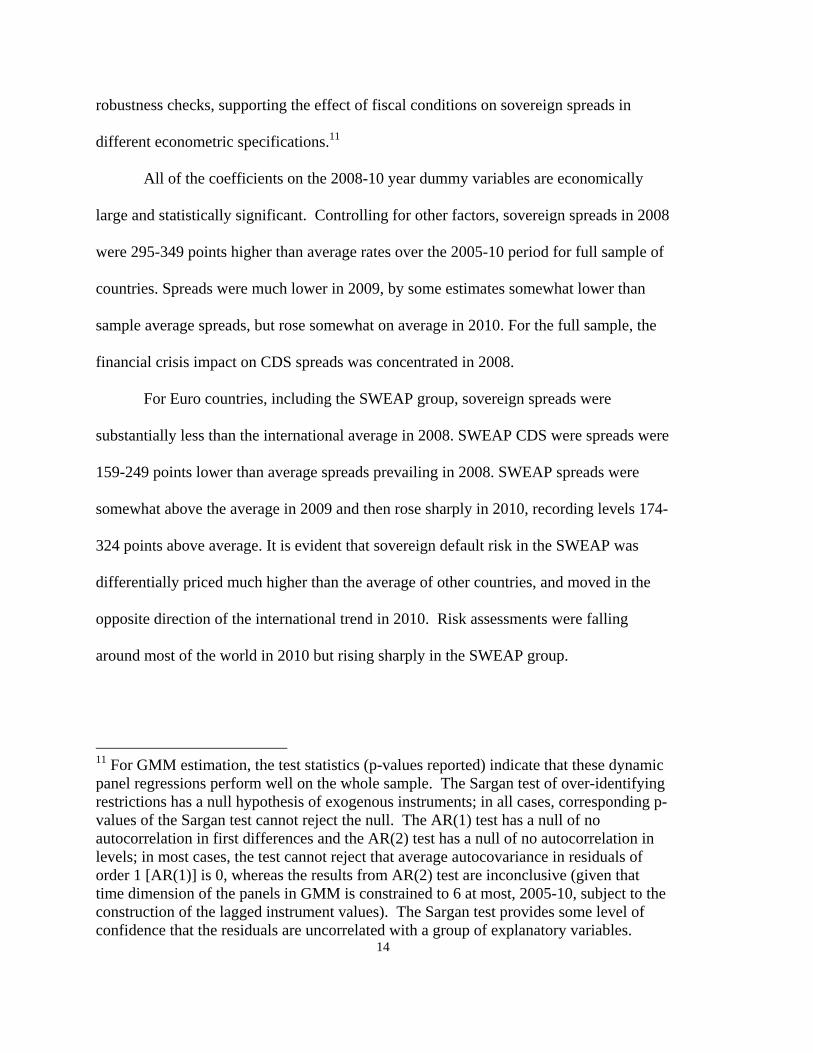
All of the coefficients on the 2008-10 year dummy variables are economically
large and statistically significant. Controlling for other factors, sovereign spreads in 2008
were 295-349 points higher than average rates over the 2005-10 period for full sample of
countries. Spreads were much lower in 2009, by some estimates somewhat lower than
sample average spreads, but rose somewhat on average in 2010. For the full sample, the
financial crisis impact on CDS spreads was concentrated in 2008.
For Euro countries, including the SWEAP group, sovereign spreads were
substantially less than the international average in 2008. SWEAP CDS were spreads were
159-249 points lower than average spreads prevailing in 2008. SWEAP spreads were
somewhat above the average in 2009 and then rose sharply in 2010, recording levels 174-
324 points above average. It is evident that sovereign default risk in the SWEAP was
differentially priced much higher than the average of other countries, and moved in the
opposite direction of the international trend in 2010. Risk assessments were falling
around most of the world in 2010 but rising sharply in the SWEAP group.
11 For GMM estimation, the test statistics (p-values reported) indicate that these dynamic panel regressions perform well on the whole sample. The Sargan test of over-identifying restrictions has a null hypothesis of exogenous instruments; in all cases, corresponding p-values of the Sargan test cannot reject the null. The AR(1) test has a null of no autocorrelation in first differences and the AR(2) test has a null of no autocorrelation in levels; in most cases, the test cannot reject that average autocovariance in residuals of order 1 [AR(1)] is 0, whereas the results from AR(2) test are inconclusive (given that time dimension of the panels in GMM is constrained to 6 at most, 2005-10, subject to the construction of the lagged instrument values). The Sargan test provides some level of confidence that the residuals are uncorrelated with a group of explanatory variables.
15
4.2 CDS Spreads, Fundamentals and Structural Change
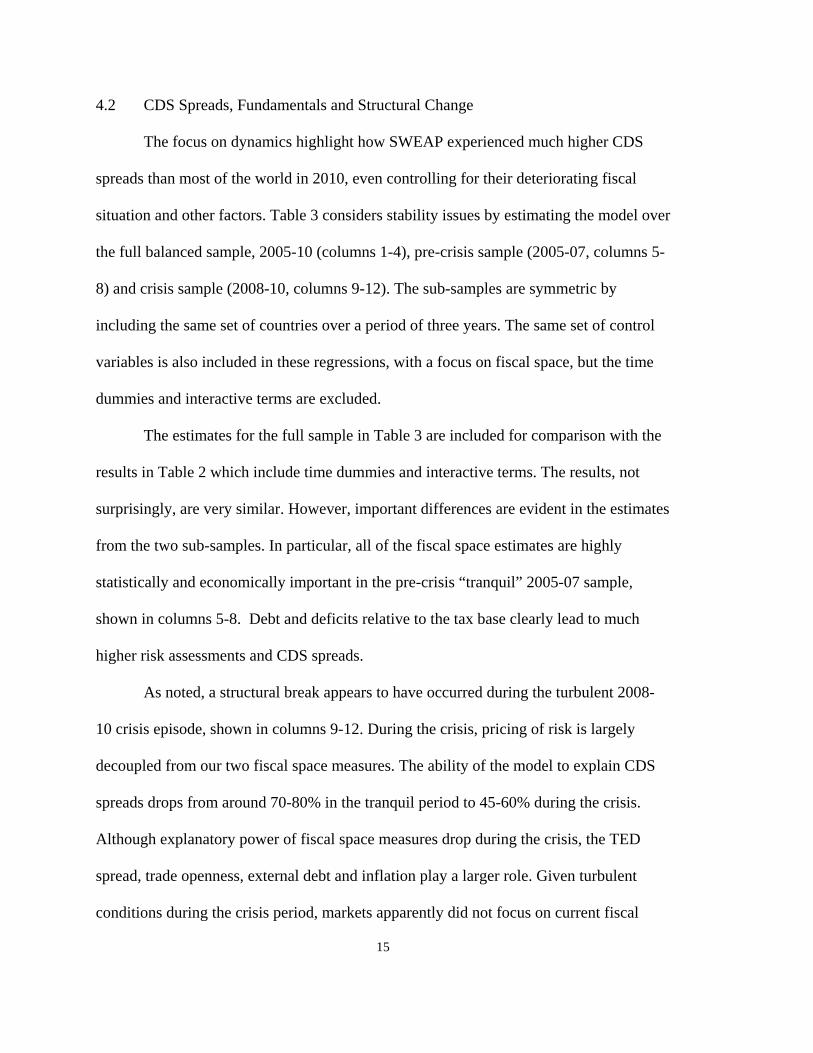
The focus on dynamics highlight how SWEAP experienced much higher CDS
spreads than most of the world in 2010, even controlling for their deteriorating fiscal
situation and other factors. Table 3 considers stability issues by estimating the model over
the full balanced sample, 2005-10 (columns 1-4), pre-crisis sample (2005-07, columns 5-
8) and crisis sample (2008-10, columns 9-12). The sub-samples are symmetric by
including the same set of countries over a period of three years. The same set of control
variables is also included in these regressions, with a focus on fiscal space, but the time
dummies and interactive terms are excluded.
The estimates for the full sample in Table 3 are included for comparison with the
results in Table 2 which include time dummies and interactive terms. The results, not
surprisingly, are very similar. However, important differences are evident in the estimates
from the two sub-samples. In particular, all of the fiscal space estimates are highly
statistically and economically important in the pre-crisis “tranquil” 2005-07 sample,
shown in columns 5-8. Debt and deficits relative to the tax base clearly lead to much
higher risk assessments and CDS spreads.
As noted, a structural break appears to have occurred during the turbulent 2008-
10 crisis episode, shown in columns 9-12. During the crisis, pricing of risk is largely
decoupled from our two fiscal space measures. The ability of the model to explain CDS
spreads drops from around 70-80% in the tranquil period to 45-60% during the crisis.
Although explanatory power of fiscal space measures drop during the crisis, the TED
spread, trade openness, external debt and inflation play a larger role. Given turbulent
conditions during the crisis period, markets apparently did not focus on current fiscal
16
fundamentals. One interpretation is that the markets simply overreacted and mispriced
risk of default. Another interpretation is that markets may have emphasized more on
expectations of future deterioration in fiscal space that were not fully reflected in current
economic conditions.12 The emergence of the TED spread as a key pricing factor in the
crisis also suggests that expectations of market volatility jumped during the crisis and that
this pushed up CDS spreads. In particular, possible default implies that the payoff to
creditors is weakly concave (fixed payoff in good times, declining with an adverse shock
above a threshold in bad times), suggesting that higher volatility will reduce the expected
payoff in countries exposed to higher volatility during a crisis for a given debt/tax or
debt/gdp and thereby increasing CDS spreads.13 This also explains the impact of the end
of the Great Moderation—countries with greater exposure to volatility, other things
equal, are facing higher spreads.
4.3 SWEAP and the Euro-Area CDS Pricing Before and During the Crisis
12 We also investigated whether the pricing of CDS spreads amongst the SWEAP and the non-SWEAP Euro countries (Euro-SWEAP) respond differently to fundamentals than the rest of world when the full set of fundamental explanatory variables is included. We estimated the model over 2005-10, reflecting the full sample and consisting of both the tranquil and turbulent periods. We focused on 10-year CDS spreads and considered interaction terms of SWEAP and Euro-SWEAP with all of the fundamental variables. The point estimates of interaction terms on government debt/tax suggest that the non-SWEAP Euro area countries have much narrower spreads than the sample average and the SWEAP area have much larger spreads. However, these differences are not statistically significant. The same result holds for the other fundamental factors. One exception is the trade openness variable: on average, trade openness is positively associated with CDS spreads, but less than average for non-SWEAP Euro area and more than average for SWEAP. We omit these results for brevity. They are available upon request. 13A related point is made by Aizenman and Marion (2002).

17
In order to determine how the balanced sample (2005-10) and pre-crisis sample
(2005-07) models of Table 3 predict for various country groups and the SWEAP
countries, we report the in-sample and out-of-sample prediction errors over various years
in Table 4. Our objective is to determine whether prediction errors demonstrate a
discernable pattern. The in-sample prediction errors are estimated from the full sample
model estimates reported in column 3 of Table 3 and the out-of-sample errors are
estimated from the pre-crisis sample estimates reported in column 9 of Table 3.
For exposition purposes, we calculate the prediction errors in Table 4 as a ratio of
the actual relative to the predicted CDS spreads as:
5 . 5
Hence, if the prediction error is greater than 1, we have a case of under-prediction
which provides supportive evidence that the CDS is over-priced. Table 4 reports the
prediction errors by individual SWEAP countries and country grouping for the 2008-10
and a breakdown for years 2008, 2009 and 2010.
The table shows that in-sample and out-of-sample prediction errors were very
substantial across countries and country-groups during the crisis period, with out-of-
sample errors particularly large. Average errors over 2008-10, for example, indicate that
actual CDS spreads exceeded out-of-sample forecast spreads with multiples ranging from
2.3 (Middle Income countries) to 12.9 (non-Euro OECD). Under predictions of CDS
spreads of this magnitude are extraordinary. Under predictions (out-of-sample) for the
SWEAP countries are not particularly high in relative terms, ranging from 2.6 (Italy) to
5.3 (Ireland).
18
However, the pattern across years of the crisis sample shows a divergence
between the SWEAP and other country groups. In particular, the SWEAP prediction
errors were relatively low in 2008 but climbed marked in 2010 compared to other regions
(except the non-SWEAP Euro area). The financial crisis that emerged in 2008 struck the
OECD (non-Euro) area particularly hard, with very high out-of-sample prediction errors
(31.6). These errors were only 1.6 in 2009, and climbed to 5.4 in 2010. By contrast, the
SWEAP area did not experience such dramatic prediction errors in 2008 but these errors
rose marked in 2009 and especially 2010. Perhaps reflecting some contagious effect, the
Euro area (excluding SWEAP), also experience a dramatic climb in prediction errors in
2010—much larger than the SWEAP group.
4.4 Preconditions: Fiscal Positions Prior to the Financial Crisis
Figure 3 suggests that, in the run up to the global financial crisis, fiscal positions
in the Euro area were relatively strong, and the SWEAP area roughly in line with other
OECD countries. The figure shows the fiscal balance and public debt positions by
country group--middle income, high income (non-OECD), SWEAP, OECD (non-Euro
area) and the Euro area (non-SWEAP) -- before the global financial crisis: the 2005-07
average for fiscal balance to GDP and fiscal balance to tax base in the first part of the
figure, and the 2005-07 average public debt to GDP and public debt to tax base ratio in
the second part of the figure.
Fiscal conditions in Euro countries less the SWEAP were in line with other
countries prior to the global financial crisis. The average debt/tax ratio (1.38) was lower
than the average of other OECD countries (1.66). The Euro area debt/GDP (55%) was

19
slightly higher than other OECD countries (51%). The SWEAP group had a somewhat
worse fiscal position, but not markedly so, with an average debt/tax ratio of 1.94 over the
period, somewhat above the non-Euro OECD group average (1.66). This is much less
than the average for the middle income group (2.75). However, the SWEAP debt to GDP
ratio was higher than the other groups at an average 68% over the period running up to
the financial crisis. A similar pattern is seen for fiscal balance measures, shown in the
second part of Figure 3.
Are fiscal conditions prior to the crisis linked to market responses during the
crisis episode? To recall, in the years leading to the Euro, prominent US economists
were skeptical about the Euro project, raising questions about the logic of monetary
unification without deep fiscal unification. Arguably, the first ten years of the Euro,
celebrated in 2008, were taken by the market and key observers as an illustration that the
earlier fiscal concerns were overblown. This view was supported by the remarkable
switch of the initial depreciation of the Euro against the US dollar, into a solid
appreciation. In his Keynote at Frankfurt am Main 30 May 2008, “The Eurosystem and its
Prospects - History in the Making” Professor Axel Weber, President of the Deutsche
Bundesbank, noted
“In 1998, however, the kick-off of the Eurosystem was regarded not only with curiosity and optimism, but also with concern and skepticism. On the one hand, pessimists predicted that the euro would be short-lived. They did not want to part with their respective national currencies, which – as in the case of the D-Mark – had often evolved into a symbol of national identity. On the other hand, the euro's proponents believed that the single currency would become a major catalyst for structural reform, thereby significantly boosting economic growth in the euro area. Today, with the benefit of hindsight, we know that neither excessive pessimism nor exuberant optimism was justified. Nonetheless, the Eurosystem has delivered a remarkable performance over its first decade.”
20
“Now, what are the determinants of the Eurosystem’s success? Why did a currency area with no track record of its own attain such a high degree of credibility in so short a time? As I have already indicated, the bulk of confidence in the fledgling European single currency was generated by the Eurosystem’s institutional framework, which encompasses its independence, its mandate and its monetary policy strategy, plus an institutional framework geared at commanding the support of equally stability-oriented fiscal policies, as embedded in the Stability and Growth Pact (SGP). Key elements of this institutional framework have been transferred to the Eurosystem from the national central banks (NCBs), including the Deutsche Bundesbank. Consequently, with the transfer of parts of the NCBs’ structure and ethos, the reputation of the currencies that were stable prior to EMU has lived on in the euro.”
With the benefit of hindsight, in the years prior to the 2008-9 crisis hitting
SWEAP, the market may have underestimated the fiscal challenges facing the Euro
block, believing that Weber’s position “with the transfer of parts of the national central
banks’ structure and ethos, the reputation of the currencies that were stable prior to
EMU has lived on in the euro.” was accurate.
Has the SWEAP crisis has been a wake-up call regarding the fiscal vulnerabilities
of the Euro Zone? Figure 4 shows a scatter plot of government fiscal space in 2005-07
prior to the financial crisis against 2008-10 prediction errors in Euro and non-Euro zone
countries (using equations 6 and 8 from Table 3). The left panels show the debt/tax
revenue measure and the right panels show the deficit/tax revenue fiscal space measure.
The correlation in the Euro zone (non-Euro area) between government debt/tax revenues
and prediction error is -.72 (-.28). And the correlation in the Euro zone (non-Euro area)
between fiscal balances to tax revenues and prediction error is .59 (.09) for other (non
Euro) countries in the sample. Euro area countries with high debt and deficits (surpluses)
during the pre-crisis period experienced lower (higher) CDS spreads (relative to
predicted values) than did the non-Euro area countries.
21
Overall, these data do not support the argument that the market was particularly
sanguine about Euro area sovereign risk during the tranquil period and that this led to an
over-reaction (over pricing risk) during the crisis period. CDS spreads relative to out-of-
sample predicted values in the SWEAP group are high, but not out of line with other
country groups. Moreover, there is no evidence that debt and deficits in the SWEAP
countries prior to the crisis led to high prediction errors during the crisis.
4.5 SWEAP Compared to “Matched” Middle Income Countries
To gain further insight, we “match” the SWEAP countries with 5 middle-income
countries (MI) that in 2010, at the peak of the European crisis, were closest in terms of
fiscal space (2010 debt/tax). The objective is to see if the pricing of risk in the SWEAP
was different than corresponding MI countries. The matches (SWEAP to MI), shown in
Table 5, are Spain – South Africa, Greece – Panama, Ireland – Malaysia, Italy – Mexico
and Portugal – Colombia. These countries had similar debt to tax base ratios in 2010. The
question is whether they had other similar economic characteristics, especially the price
of sovereign default risk.
Figure 5 shows a cluster diagram of the prediction errors during these two
periods, depicting the size of debt/tax by circles. The prediction errors are based on the
in-sample prediction errors from equations 2 and 4 in Table 3. The circle size is
proportional to the 2005-07 pre-crisis public debt to tax base ratio. There is a negative
correlation (-0.62) between 2005-07 pre-crisis and 2008-10 crisis prediction errors, i.e.
large (small) prediction errors in the tranquil period tend to be followed by small (large)
prediction errors in the crisis period. However, there is a wide asymmetry between the
22
clusters of errors of the SWEAP and the clusters of errors of their matched MI countries.
In particular, the relatively small prediction errors of the SWEAP countries in the pre-
crisis period are followed by quite large prediction errors in the crisis period. By contrast,
little relation is seen in the error clusters of the MI countries—a wide variation among the
prediction errors in this group in the pre-crisis period is not seen in the crisis period,
during which time all of the matched MI country predictions were quite close to realized
CDS spreads.
The data in Figure 5 suggest that sovereign risk in SWEAP countries is over-
priced in comparison with corresponding MI countries. Pursuing this further, Table 5
summarizes in more detail the characteristics of the SWEAP with the matched countries.
The table shows, before and during the crisis, the evolution of CDS spreads, fiscal space,
the tax base, inflation, currency depreciation, inflation external debt, foreign reserves,
trade openness and real GDP growth.
This table allows a detailed comparison of the matched countries. In terms of
initial conditions, for example, Italy and Mexico had very similar debt/tax ratios in 2005-
07 (2.2-2.5), but Mexico had much higher borrowing costs and sovereign CDS premium
which were more than four times higher than Italy (57 points versus 13 points).
Differential borrowing costs, however, were consistent with a weaker currency and
higher inflation rates in Mexico. The difference in CDS spreads between the two
countries at this time appears is in line with relative fiscal space—similar debt and deficit
positions-- and economic performance. By 2010, however, the roles were reversed: Italy
had a CDS spread of 238 and Mexico 113, despite still having very similar debt/tax and
deficit/tax ratios and Mexico maintaining higher rates of inflation. Pessimism about
23
Europe in 2010 appears to have led to higher risk perceptions in Italy compared to
Mexico than would be justified by fundamentals. This observation is seen as well in
Figure 5, where the prediction errors for 2008-10 averaged about 1.0 in Mexico and 2.6
in Italy. (It should be noted, however, that real GDP growth was stronger in Mexico than
Italy at this time, and its currency stronger. So not all fundamentals pointed to more equal
CDS spreads).
Another illustrative case is Spain and South Africa. The 2005-07 (debt/tax) ratios
were very similar, but South Africa was subject to higher government borrowing costs
and had a substantially higher CDS spread (53 points versus 17 points). Partly this
reflected the respective political situations but also that South Africa had higher inflation
and a higher rate of currency depreciation. Again, the market pricing of risk was reversed
in the two countries by 2010 with the CDS spread in Spain averaging 348 points
compared to 124 in South Africa. This difference may be partly due to fundamentals—
real GDP growth was higher and the debt/tax ratio lower in South Africa. On the other
hand, the inflation rate in South Africa was almost 6% in 2010, compared to less than 3%
in Spain. The suspicion that default risk in Spain is mispriced compared to South Africa
is also suggested by the prediction error given in Figure 5—the average CDS spread to
predicted spread for Spain during 2008-10 is almost 4 but about 1 in South Africa, where
the later indicates no under- or over-pricing.
On the other hand, Table 5 also shows that SWEAP had lower foreign reserves
than the matched MI countries. Given the Euro status of SWEAP, however, it is uncertain
what would be the role of the reserves (compared to a precautionary rationale for reserves
hoarding of the emerging markets). Nonetheless, in all cases SWEAP countries had

24
larger external debt (%GDP) and the government bond markets that performed worse in
2010 than the matched MI countries.
In summary, there is strong evidence that high market default risk assessments in
the SWEAP are partly attributable to deteriorating fundamentals but that a large
component is unpredicted. Actual CDS spreads in the SWEAP much higher than what
the model predicts, given the actual realization of fundamentals. In terms of the model,
these spreads may be “mispriced” due to excessive pessimism on the part of market
participants about the SWEAP or expectations of the further deterioration of
fundamentals. This point is well illustrated by a comparison of SWEAP with MI
countries with similar fiscal conditions. In every case, risk pricing of the SWEAP is
comparatively high given current economic conditions. However, a comparison with
other country groupings, outside of the Middle Income countries, provides less support
for relative over-pricing of risk in SWEAP. In particular, other OECD countries (outside
of the Euro zone) and non-SWEAP Euro zone countries have also experienced very high
CDS premiums—much higher than model predictions—during the crisis period.
5. Conclusion
We develop a model of pricing of sovereign risk for a large number of countries
within and outside of Europe, before and after the global financial crisis, based on fiscal
space and other economic fundamentals. We use this model to explain CDS spreads and
determine whether the market pricing of risk is comparable in the affected European
countries and elsewhere in the world. By this methodology and using out-of-sample
predictions, we determine whether there are systematically large prediction errors for the
25
CDS spreads during the global financial crisis period 2008-10 and especially 2010 when
the sovereign debt crisis in Europe surfaced.
We find that market-priced risk of sovereign debt as measured by CDS spreads is
partly explained by fiscal space and other economic determinants. Fiscal space is an
economically important and robust predictor of CDS spreads using a data set of more
than fifty countries over 2005-10, measured either by government debt/tax base or
government deficits/tax base. In addition to validating that fiscal space is an important
determinant of market-based sovereign risk, we find evidence of mispricing in SWEAP
given current fiscal space and other current fundamentals: unpredicted low CDS in
tranquil period and unpredicted high during global crisis period, especially 2010 when
sovereign debt crisis swept over Euro area. We also matched the SWEAP with 5 middle-
income countries outside Europe that were closest in terms of fiscal space (debt/tax)
during the crisis period. We find that SWEAP default risk is priced much higher than the
“matched” countries in 2010, even allowing for differentials in fiscal space and other
fundamentals.
On the other hand, outside of the Middle Income countries, several country
groups experienced similarly “mispriced” CDS spreads during the crisis period, though
the dynamics are different than with SWEAP. Other OECD countries tended to have very
high prediction errors—high CDS spreads compared with model predictions—during the
first year of the international financial and liquidity crisis (2008), while SWEAP
experienced very substantial prediction errors in 2010 when the sovereign debt crisis
initially swept over Europe.

26
One interpretation of these findings is that market-priced risk of sovereign default
follows waves of contagion, overreacting and mispricing risk of sovereign default over a
period of several years. The extraordinarily high CDS spreads in SWEAP in 2010,
largely unpredicted by the model, may be attributable to excessive pessimism and an
overreaction to the fiscal deterioration. Another interpretation, of course, is that the CDS
market is pricing default risk not primarily on current fundamentals but future
fundamentals, expecting the SWEAP fiscal space to deteriorate markedly. The
adjustment challenges of the SWEAP may be viewed as economically and politically
more difficult due to exchange rate inflexibility associated with participation in the Euro
area that is not a constraint in the matched group of the middle income countries.

27
References Aizenman, Joshua, and Yothin Jinjarak. 2011. “The Fiscal Stimulus of 2009-10: Trade Openness, Fiscal Space and Exchange Rate Adjustment,” forthcoming, NBER International Seminar on Macroeconomics 2011. Aizenman, Joshua and Nancy Marion. 2002. “Reserve Uncertainty and the Supply of International Credit,” Journal of Money Credit and Banking, 34(3), (August, Part 1). Amato, Jeffry D. 2005 “Risk Aversion and Risk Premia in the CDS Market”, BIS Quarterly Review, Part 5 (December), 55-68. Ammer, John, and Fang Cai. 2007. “Sovereign CDS and Bond Pricing Dynamics in Emerging Markets.” Board of Governors of the Federal Reserve System, December. Bank for International Settlements. 2010. BIS Quarterly Review, OTC Derivatives Statistics. December. Beber, Alessandro, Michael W. Brandt, and Kenneth A. Kavajecz. 2009. “Flight-to-Quality or Flight-to-Liquidity? Evidence from the Euro-area bond market.” Review of Financial Studies 22, 925-957. Berndt, Antje and Iulian Obreja. 2010. “Decomposing European CDS Returns,” Review of Finance. 14: 189-233. Buiter, Willem and Ebrahim Rahbari. 2010. “Greece and the fiscal crisis in the Eurozone.” Centre for Economic Policy Research Policy Insight No. 51 (October). Buiter, Willem. 2010. Global Economists View, “Sovereign Debt Problems in Advanced Industrial Countries.” CITI Economics, April 26. Cecchetti, Stephan, M S Mohanty and Fabrizio Zampolli. 2010. “The Future of Public Debt: Prospects and Implications,” BIS Working Paper No. 300 (March). Chamley, Christophe and Brian Pinto. 2011. “Why Official Bailouts Tend Not to Work: An Example Motivated by Greece 2010.” The Economists Voice (February), pp. 1-5. www.bepress.com. Dooley, Michael and Michael Hutchison. 2009. “Transmission of the U.S. Subprime Crisis to Emerging Markets: Evidence on the decoupling-recoupling hypothesis,” Journal of International Money and Finance. 28, 1331-1349. Fontana, Alessandro and Martin Scheicher. 2010. “An Analysis of Euro Area Sovereign CDS and their Relation with Government Bonds.” ECB Working Paper No. 1271 (December). Gros, Daniel. 2010. “The senority conundrum: Bail out countries but bail in private, short-term creditors?” VOX December 5, 2010. www.voxeu.org Lane, Phillip R. 2011. “The Irish Crisis.” CEPR Discussion Paper No. 8287 (March).

28
Longstaff, Francis A., Jun Pan, Lasse H. Pedersen, and Kenneth J. Singleton. 2011. “How Sovereign is Sovereign Credit Risk?” American Economic Journal: Macroeconomics, 3(2), 75-103. Mayordomo, Sergio, Juan Ignacio Peña, and Eduardo S. Schwartz. 2010. “Are all Credit Default Swap Databases Equal?” NBER Working Paper No. 16590, December. Micu, Marian, Eli Remolona and Philip Woolridge. 2006. “The Price Impact of Rating Announcements: Which Announcements Matter?” BIS Working Paper No. 207 (June). Packer, Frank and Chamaree Suthiphongchai. 2003. “Sovereign Credit Default Swaps.” BIS Quarterly Review (December). Packer, Frank and Haibin Zhu. 2005. “Contractual Terms and CDS Pricing,” BIS Quarterly Review, Part 8 (March), 89-100. Tait, Nikki, and David Oakley. 2010. “Brussels gives sovereign CDS trading all-clear.” Financial Times, December 6th. International Monetary Fund. 2011. Fiscal Monitor Update. 2011. IMF Fiscal Affairs Department, January. International Monetary Fund. 2011. Fiscal Monitor “Shifting Gears: Tackling Challenges on the Road to Fiscal Adjustment.” April. Global Sovereign Credit Risk. 2010. Credit Market Analysis Ltd. London. Quarterly Report, December.
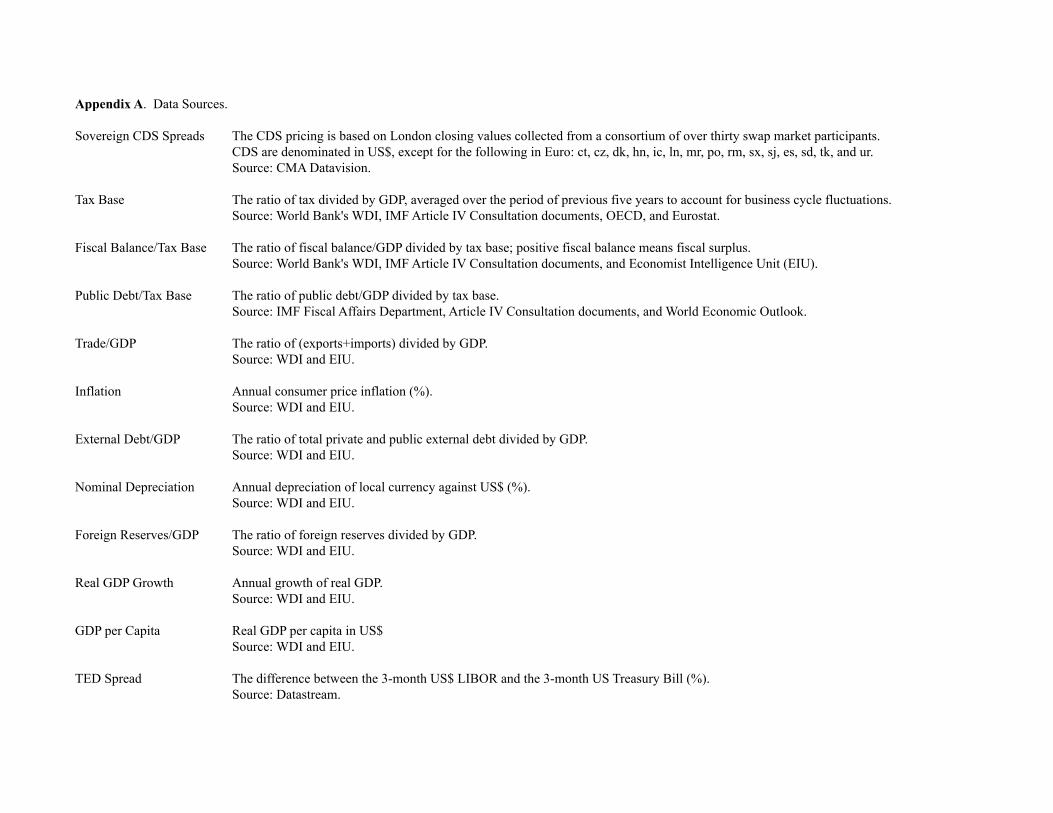
Appendix A. Data Sources.
Sovereign CDS Spreads The CDS pricing is based on London closing values collected from a consortium of over thirty swap market participants.CDS are denominated in US$, except for the following in Euro: ct, cz, dk, hn, ic, ln, mr, po, rm, sx, sj, es, sd, tk, and ur.Source: CMA Datavision.
Tax Base The ratio of tax divided by GDP, averaged over the period of previous five years to account for business cycle fluctuations.Source: World Bank's WDI, IMF Article IV Consultation documents, OECD, and Eurostat.
Fiscal Balance/Tax Base The ratio of fiscal balance/GDP divided by tax base; positive fiscal balance means fiscal surplus.Source: World Bank's WDI, IMF Article IV Consultation documents, and Economist Intelligence Unit (EIU).
Public Debt/Tax Base The ratio of public debt/GDP divided by tax base.Source: IMF Fiscal Affairs Department, Article IV Consultation documents, and World Economic Outlook.
Trade/GDP The ratio of (exports+imports) divided by GDP.Source: WDI and EIU.
Inflation Annual consumer price inflation (%).Source: WDI and EIU.
External Debt/GDP The ratio of total private and public external debt divided by GDP.Source: WDI and EIU.
Nominal Depreciation Annual depreciation of local currency against US$ (%).Source: WDI and EIU.
Foreign Reserves/GDP The ratio of foreign reserves divided by GDP.Source: WDI and EIU.
Real GDP Growth Annual growth of real GDP.Source: WDI and EIU.
GDP per Capita Real GDP per capita in US$Source: WDI and EIU.
TED Spread The difference between the 3-month US$ LIBOR and the 3-month US Treasury Bill (%).Source: Datastream.

Appendix B. Country Details and Average Statistics for 2005-10.Group Country World Bank Datastream CDS 5-yr. CDS 3-yr. CDS 10-yr. Fiscal Balance/Tax Base Public Debt/Tax Base Trade/GDP Inflation (%) External Debt/GDPMiddle-Income Argentina ARG ag 1075.29 1117.72 1124.23 0.07 4.40 0.43 9.42 0.46
Brazil BRA br 159.93 119.36 201.43 -0.08 2.02 0.25 4.90 0.17Bulgaria BGR bl 184.12 174.90 200.47 0.04 0.67 1.22 6.38 0.89China CHN ch 65.01 54.53 74.05 -0.09 1.13 0.62 2.97 0.10Colombia COL cb 162.89 123.63 205.50 -0.05 1.88 0.36 4.65 0.22Indonesia IDN id 239.35 194.73 285.49 -0.07 2.89 0.55 8.39 0.34Kazakhstan KAZ kz 231.61 215.06 231.58 -0.05 0.33 0.89 9.68 0.84Lebanon LBN lb 355.40 313.76 390.27 -0.65 10.98 0.69 4.30 1.12Lithuania LTU ln 219.50 205.86 231.34 -0.18 1.14 1.25 4.87 0.65Malaysia MYS my 79.16 64.84 89.04 -0.30 3.03 1.92 2.72 0.32Morocco MAR mc 141.84 128.77 158.56 -0.10 2.52 0.75 2.04 0.27Panama PAN pa 147.52 112.87 186.98 -0.03 4.80 1.49 4.25 0.53Peru PER pe 161.63 124.87 201.94 0.06 2.20 0.48 2.59 0.27Phillipines PHL ph 202.85 155.23 248.76 -0.15 3.93 0.81 5.04 0.45Romania ROM rm 224.50 225.68 243.59 -0.14 0.87 0.74 6.52 0.54Russia RUS rs 212.01 217.74 221.97 0.07 0.29 0.53 10.44 0.28South Africa ZAF sa 137.14 121.33 157.06 -0.06 1.22 0.61 5.08 0.14Thailand THA th 95.42 81.22 109.01 -0.08 2.68 1.40 3.24 0.26Tunisia TUN tu 101.13 89.59 117.74 -0.13 2.19 1.12 8.23 0.57Ukraine UKR ur 898.71 930.54 898.67 -0.08 0.68 0.97 13.71 0.57Venezuela VEN ve 1024.69 1037.80 1011.23 -0.20 2.49 0.52 22.82 0.23Vietnam VNM vi 226.40 174.97 249.79 -0.32 2.66 1.58 11.01 0.32
High-Income (non OECD) Croatia HRV ct 175.44 160.03 185.98 -0.16 1.71 0.87 3.01 0.85Qatar QAT qa 78.93 63.71 100.60 0.45 0.80 0.87 8.02 0.58
South-West Euro Area Greece GRC gr 264.49 223.60 215.45 -0.27 3.60 0.54 5.49 1.46Peripherals (SWEAP) Ireland IRL ir 163.98 131.80 134.86 -0.27 1.58 1.44 2.02 8.99
Italy ITA it 90.72 72.00 91.55 -0.09 2.62 0.55 2.05 1.10Portugal PRT pt 119.41 101.44 103.67 -0.18 2.05 0.69 1.84 2.03Spain ESP es 102.02 82.57 104.57 -0.09 1.30 0.56 2.61 1.50
OECD (non Euro) Australia AUS au 41.52 32.55 49.27 -0.02 0.46 0.40 2.91 0.95Chile CHL cl 71.59 59.67 81.52 0.18 0.29 0.77 3.78 0.38Czech CZE cz 65.23 54.69 73.90 -0.09 0.87 1.47 2.72 0.41Denmark DNK dk 50.59 35.87 61.70 0.04 0.84 0.98 2.20 1.72Hungary HUN hn 189.46 169.18 184.27 -0.15 1.86 1.54 5.16 1.01Iceland ISL ic 288.02 303.63 266.12 -0.07 1.47 0.81 7.15 6.77Israel ISR is 81.52 67.28 96.03 -0.06 2.30 0.80 2.68 0.52Japan JPN jp 33.92 20.94 42.01 -0.17 7.39 0.30 -0.13 0.38Korea KOR ko 97.59 89.40 107.91 0.03 1.23 0.90 3.14 0.35Mexico MEX mx 118.24 97.59 142.15 -0.05 2.31 0.58 4.27 0.19Norway NOR nw 18.19 13.04 23.16 0.35 1.29 0.73 2.30 1.25Poland POL po 96.25 82.10 102.61 -0.07 1.48 0.81 2.67 0.46Sweden SWE sd 52.76 37.19 66.38 0.03 0.88 0.94 1.68 1.86Turkey TUR tk 201.54 165.60 242.63 -0.10 1.78 0.49 8.13 0.39
Euro (excluding SWEAP) Austria AUT oe 55.06 43.84 55.61 -0.05 1.49 1.07 1.88 2.05Belgium BEL bg 61.43 39.22 50.78 -0.06 2.06 1.59 2.37 2.97France FRA fr 34.58 24.04 34.78 -0.10 1.61 0.53 1.74 1.75Germany DEU bd 23.77 16.76 24.59 -0.05 1.97 0.83 1.65 1.44Netherlands NLD nl 45.84 33.15 68.73 -0.04 1.43 1.39 1.65 2.98Slovak SVK sx 58.41 49.48 66.85 -0.13 1.06 1.73 2.92 0.57Slovenia SVN sj 51.91 41.17 60.92 -0.06 0.75 1.28 2.74 0.97

Table 1. Summary Statistics of Sovereign CDS Values and Fundamentals. This table reports mean and standard deviation (in parenthesis) of sovereign CDS spreads (basis points) and macro fundamentals.Tax Base is an average Tax/GDP over a period of previous 5 years. Appendix A provides data sources and Appendix B details the country groups.
Country 05-07 08 09 10 08-10 05-07 08 09 10 08-10 05-07 08 09 10 08-10Spain 16.7 100.7 113.5 347.7 187.3 0.05 -0.12 -0.31 -0.27 -0.23 1.1 1.1 1.5 1.7 1.4
Greece 15.0 232.1 283.4 1026.5 514.0 -0.18 -0.29 -0.48 -0.33 -0.37 3.2 3.5 4.0 4.5 4.0
Ireland 8.6 181.0 158.0 619.2 319.4 0.05 -0.24 -0.47 -1.08 -0.60 0.9 1.5 2.2 3.2 2.3
Italy 13.4 156.9 109.2 238.0 168.0 -0.07 -0.07 -0.13 -0.11 -0.10 2.5 2.5 2.8 2.8 2.7
Portugal 10.4 96.3 91.7 497.3 228.4 -0.13 -0.11 -0.30 -0.27 -0.22 1.9 1.9 2.2 2.4 2.2
Middle-Income group 124.2 829.9 295.2 233.2 452.8 -0.06 -0.08 -0.22 -0.19 -0.16 2.7 2.2 2.3 2.3 2.3(102.8) (1069.4) (331.3) (221.5) (540.7) (0.2) (0.2) (0.2) (0.1) (0.2) (2.6) (2.1) (1.9) (1.9) (2.0)
High-Income (non OECD) 32.1 330.7 164.0 172.3 222.3 0.13 0.24 0.10 0.16 0.17 1.2 1.0 1.7 1.4 1.4(13.9) (158.9) (90.5) (118.4) (122.6) (0.4) (0.5) (0.4) (0.5) (0.5) (0.8) (0.6) (0.1) (0.8) (0.5)
OECD (non Euro) 34.8 260.3 120.3 117.8 166.2 0.04 0.01 -0.12 -0.08 -0.06 1.7 1.7 1.9 1.9 1.8(41.5) (238.8) (103.5) (96.4) (146.2) (0.2) (0.2) (0.1) (0.1) (0.1) (1.7) (1.7) (1.8) (1.8) (1.8)
Euro (excluding SWEAP) 11.0 95.1 54.2 101.3 83.5 -0.03 -0.02 -0.15 -0.14 -0.10 1.4 1.4 1.6 1.7 1.6(13.3) (40.2) (24.6) (55.2) (40.0) (0.0) (0.0) (0.1) (0.1) (0.1) (0.5) (0.5) (0.5) (0.4) (0.5)
05-07 08 09 10 08-10 05-07 08 09 10 08-10 05-07 08 09 10 08-10Spain 0.6 0.6 0.5 0.5 0.5 3.55 1.40 0.80 2.78 1.66 1.4 1.5 1.7 1.5 1.6
Greece 0.6 0.6 0.5 0.5 0.5 3.32 2.64 2.97 17.34 7.65 1.3 1.4 1.8 1.7 1.7
Ireland 1.5 1.6 1.6 0.9 1.4 3.75 4.05 -4.48 1.30 0.29 7.8 8.9 10.7 11.0 10.2
Italy 0.6 0.6 0.5 0.6 0.5 2.30 2.26 1.02 2.10 1.79 1.1 1.0 1.2 1.1 1.1
Portugal 0.7 0.8 0.6 0.7 0.7 2.60 0.71 0.00 2.52 1.08 1.9 1.9 2.3 2.4 2.2
Middle-Income group 0.9 0.9 0.8 0.9 0.9 6.74 9.73 5.24 6.61 7.19 0.5 0.4 0.4 0.4 0.4(0.5) (0.5) (0.4) (0.5) (0.4) (4.7) (6.8) (5.9) (5.4) (6.0) (0.3) (0.3) (0.3) (0.2) (0.3)
High-Income (non OECD) 0.9 0.9 0.8 0.8 0.8 8.20 8.02 -0.90 1.37 2.83 0.6 0.7 0.9 0.8 0.8(0.0) (0.1) (0.0) (0.0) (0.0) (6.2) (7.3) (3.9) (0.7) (4.0) (0.2) (0.2) (0.2) (0.2) (0.2)
OECD (non Euro) 0.8 0.9 0.8 0.8 0.8 3.38 4.60 3.02 3.08 3.57 1.0 1.3 1.5 1.5 1.4(0.3) (0.4) (0.3) (0.4) (0.4) (2.3) (3.4) (3.5) (1.4) (2.8) (1.1) (2.0) (2.5) (2.4) (2.3)
Euro (excluding SWEAP) 1.2 1.3 1.2 1.2 1.2 2.56 2.13 0.94 2.05 1.71 1.8 1.8 2.0 1.9 1.9(0.4) (0.4) (0.5) (0.4) (0.4) (1.0) (1.1) (0.5) (0.6) (0.7) (1.0) (0.9) (0.9) (0.9) (0.9)
Sovereign CDS 5-yr tenor (basis points) Fiscal Balance/Tax Base Public Debt/Tax Base
Trade/GDP Inflation (%) External Debt/GDP

Table 2. Dynamics of CDS Spreads. The dependent variable (y) is sovereign CDS 5-year tenor in basis points.South-West Euro Area Periphery (SWEAP) includes Greece, Ireland, Italy, Portugal, and Spain.Tax Base is an average Tax/GDP over a period of previous 5 years. TED Spread (3-month US$ LIBOR - 3-month US Treasury) and Inflation are in percent.All variables are in realtime (t), except the lagged CDS, y(t-1). Standard errors are in parentheses, with *** (**,*) denoting statistical significance at 1 (5,10) level.
Balanced (Whole) Sample: 2005-10 (1) (2) (3) (4) coeff. (s.e.) coeff. (s.e.) coeff. (s.e.) coeff. (s.e.)t2008 295.6 (78.3) *** 334.1 (102.3) *** 328.0 (78.0) *** 349.3 (97.5) ***t2009 35.4 (27.7) -4.7 (21.0) -36.8 (33.7) -35.5 (16.7) **t2010 92.9 (27.1) *** 58.8 (12.7) *** 2.5 (32.6) 42.5 (14.0) ***t2008 x Euro dummy -209.5 (80.7) *** -216.0 (84.5) ** -225.3 (82.3) *** -238.6 (80.3) ***t2009 x Euro dummy -15.0 (30.8) 80.5 (30.4) *** 14.6 (30.1) 84.2 (29.4) ***t2010 x Euro dummy -29.1 (28.0) 56.2 (24.3) ** 5.2 (26.6) 48.0 (26.5) *t2008 x SWEAP -159.3 (82.7) * -194.4 (93.2) ** -249.5 (98.2) ** -235.6 (86.6) ***t2009 x SWEAP 73.4 (36.1) ** 136.1 (30.8) *** 18.7 (58.6) 113.8 (34.1) ***t2010 x SWEAP 261.9 (63.7) *** 324.4 (58.1) *** 174.4 (107.9) 287.7 (53.6) ***TED Spread 7.3 (27.8) -0.8 (13.6) 3.2 (27.3) 1.3 (11.3)y(t-1) 0.3 (0.1) *** 0.3 (0.1) *** 0.2 (0.1) *** 0.3 (0.0) ***Trade/GDP -118.0 (128.8) -24.9 (29.2) -86.1 (150.7) -41.9 (28.1)Inflation 19.8 (10.3) * 24.6 (6.2) *** 24.5 (11.9) ** 23.8 (6.0) ***External Debt/GDP -1.9 (17.9) 7.9 (2.3) *** -36.6 (30.1) 3.7 (2.3)Public Debt/Tax Base 81.0 (29.9) *** 14.7 (3.9) ***Fiscal Balance/Tax Base -829.4 (302.0) *** -194.1 (55.9) ***constant term -710.7 (347.2) ** -87.7 (25.6) *** 286.0 (271.7) -37.3 (26.0)R2 0.46 0.48 0.52 0.48Observations 300 300 300 300Countries (i) 50 50 50 50Fixed Effects (i) Yes No Yes NoSerial Correlation y(t-1) y(t-1) y(t-1) y(t-1)Clustered s.e. (i) No Yes No Yes

Table 3. CDS Spreads, Fundamentals and Structural Change. The dependent variable (y) is sovereign CDS 5-year tenor in basis points.Tax Base is an average Tax/GDP over a period of previous 5 years. TED Spread (3-month US$ LIBOR - 3-month US Treasury) and Inflation are in percent.All variables are in realtime (t), except the lagged CDS, y(t-1). Standard errors are in parentheses, with *** (**,*) denoting statistical significance at 1 (5,10) level.
(1) (2) (3) (4) (5) (6)Sample Years 2005-10 Years 2005-10 Years 2005-10 Years 2005-10 Years 2005-07 Years 2005-07 coeff. (s.e.) coeff. (s.e.) coeff. (s.e.) coeff. (s.e.) coeff. (s.e.) coeff. (s.e.)TED Spread -29.6 (38.7) 17.5 (12.1) 64.1 (42.2) 43.6 (13.2) *** 34.5 (10.2) *** 23.2 (7.7) ***y(t-1) 0.3 (0.1) *** 0.3 (0.0) *** 0.2 (0.1) *** 0.3 (0.0) *** 0.0 (0.1) 0.4 (0.1) ***Trade/GDP -186.7 (168.9) 1.2 (21.9) 182.7 (182.2) -12.4 (25.3) -92.8 (50.8) * -14.0 (9.3)Inflation 38.6 (12.3) *** 28.1 (3.0) *** 35.7 (12.9) *** 29.9 (3.5) *** 9.8 (2.2) *** 8.7 (1.3) ***External Debt/GDP 57.0 (32.9) * 17.0 (3.5) *** -53.9 (37.2) 9.8 (4.7) ** -13.7 (11.2) 0.6 (1.3)Public Debt/Tax Base 48.2 (48.7) 13.8 (4.6) *** 123.4 (33.1) *** 18.3 (3.0) ***Fiscal Balance/Tax Base -910.3 (236.2) *** -418.7 (87.1) ***constant term -389.5 (541.5) -87.3 (20.7) *** -501.7 (267.5) * -82.5 (30.0) *** 81.9 (100.1) -44.1 (10.9) ***R2 0.19 0.35 0.18 0.35 0.84 0.76Observations 300 300 300 300 150 150Countries (i) 50 50 50 50 50 50Fixed Effects (i) Yes No Yes No Yes NoSerial Correlation y(t-1) y(t-1) y(t-1) y(t-1) y(t-1) y(t-1)Clustered s.e. (i) No Yes No Yes No Yes
(7) (8) (9) (10) (11) (12)Sample Years 2005-07 Years 2005-07 Years 2008-10 Years 2008-10 Years 2008-10 Years 2008-10 coeff. (s.e.) coeff. (s.e.) coeff. (s.e.) coeff. (s.e.) coeff. (s.e.) coeff. (s.e.)TED Spread 21.7 (7.7) *** 24.9 (6.6) *** 150.2 (42.1) *** 190.6 (65.7) *** 186.7 (45.1) *** 197.3 (62.8) ***y(t-1) 0.2 (0.1) *** 0.5 (0.1) *** -0.1 (0.1) 0.2 (0.0) *** -0.1 (0.1) 0.2 (0.0) ***Trade/GDP -58.9 (37.5) -24.6 (9.1) *** -489.7 (244.5) ** -94.5 (63.7) -191.4 (199.6) -96.4 (65.2)Inflation 6.5 (1.7) *** 7.5 (1.4) *** 29.5 (11.6) ** 52.2 (5.3) *** 27.2 (9.0) *** 52.9 (5.2) ***External Debt/GDP -5.2 (9.6) 1.4 (1.4) 189.3 (138.7) 28.6 (13.0) ** 33.0 (102.2) 21.5 (12.2) *Public Debt/Tax Base -182.1 (218.7) 14.4 (13.1)Fiscal Balance/Tax Base -291.7 (86.5) *** -202.9 (40.2) *** -567.4 (606.0) -150.7 (163.8)constant term 107.4 (78.7) -6.8 (12.4) -621.4 (1134.7) -82.0 (64.0) -200.3 (801.8) -61.9 (59.9)R2 0.89 0.68 0.58 0.45 0.61 0.45Observations 150 150 150 150 150 150Countries (i) 50 50 50 50 50 50Fixed Effects (i) Yes No Yes No Yes NoSerial Correlation y(t-1) y(t-1) y(t-1) y(t-1) y(t-1) y(t-1)Clustered s.e. (i) No Yes No Yes No Yes

Table 4. Prediction Errors of Sovereign CDS Spreads. Based on the predicted values from estimation in Table 3 (eqs. (3) and (9)) using CDS 5-year tenor.The out-sample prediction uses 2005-07 (pre-crisis period) observations. The in-sample prediction uses 2005-10 (whole sample) observations.Where Actual CDS > Predicted CDS, there is a signal of under-prediction (i.e. the sovereign default risk is over-priced).The min and max provide lower and upper bounds of prediction errors extracted from the all the specifications with Fiscal Balance/Tax Base and macro controls.
Country/Group2008 2009 2010 2008-10
out (in) sample predictionSpain out 3.9 3.6 6.5 4.7
in 3.5 4.0 4.1 3.8
Greece out 2.7 2.2 3.3 2.7in 2.3 1.8 1.7 1.9
Ireland out 4.2 3.8 7.9 5.3in 0.8 1.7 2.6 1.7
Italy out 2.6 1.6 3.6 2.6in 2.3 1.9 3.3 2.5
Portugal out 2.8 2.9 6.9 4.2in 3.2 4.0 4.5 3.9
Middle-Income group out 3.9 1.0 1.8 2.3in 2.7 1.2 1.2 1.7
OECD (non Euro) out 31.6 1.6 5.4 12.9in 2.6 1.2 1.4 1.7
Euro (excluding SWEAP) out 5.0 5.8 13.7 8.2in 2.1 4.2 3.2 3.2
Prediction Error = Actual CDS values divided by Predicted CDS values
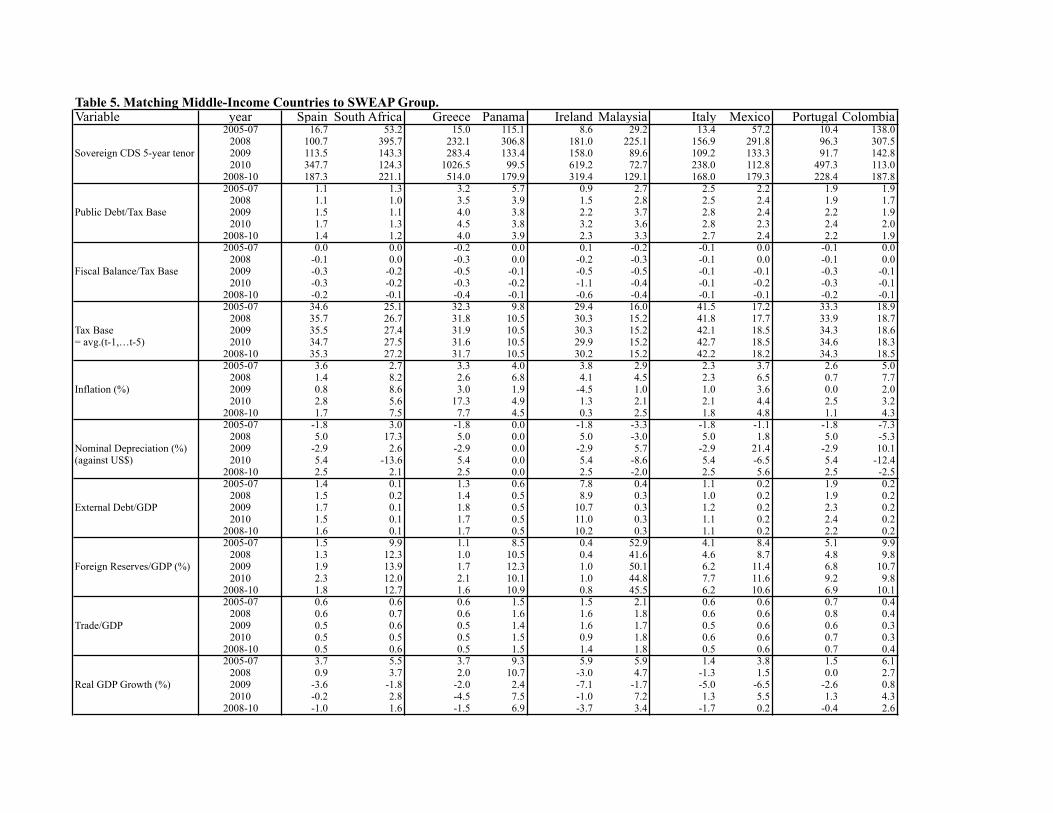
Table 5. Matching Middle-Income Countries to SWEAP Group.Variable year Spain South Africa Greece Panama Ireland Malaysia Italy Mexico Portugal Colombia
2005-07 16.7 53.2 15.0 115.1 8.6 29.2 13.4 57.2 10.4 138.02008 100.7 395.7 232.1 306.8 181.0 225.1 156.9 291.8 96.3 307.5
Sovereign CDS 5-year tenor 2009 113.5 143.3 283.4 133.4 158.0 89.6 109.2 133.3 91.7 142.82010 347.7 124.3 1026.5 99.5 619.2 72.7 238.0 112.8 497.3 113.0
2008-10 187.3 221.1 514.0 179.9 319.4 129.1 168.0 179.3 228.4 187.82005-07 1.1 1.3 3.2 5.7 0.9 2.7 2.5 2.2 1.9 1.9
2008 1.1 1.0 3.5 3.9 1.5 2.8 2.5 2.4 1.9 1.7Public Debt/Tax Base 2009 1.5 1.1 4.0 3.8 2.2 3.7 2.8 2.4 2.2 1.9
2010 1.7 1.3 4.5 3.8 3.2 3.6 2.8 2.3 2.4 2.02008-10 1.4 1.2 4.0 3.9 2.3 3.3 2.7 2.4 2.2 1.92005-07 0.0 0.0 -0.2 0.0 0.1 -0.2 -0.1 0.0 -0.1 0.0
2008 -0.1 0.0 -0.3 0.0 -0.2 -0.3 -0.1 0.0 -0.1 0.0Fiscal Balance/Tax Base 2009 -0.3 -0.2 -0.5 -0.1 -0.5 -0.5 -0.1 -0.1 -0.3 -0.1
2010 -0.3 -0.2 -0.3 -0.2 -1.1 -0.4 -0.1 -0.2 -0.3 -0.12008-10 -0.2 -0.1 -0.4 -0.1 -0.6 -0.4 -0.1 -0.1 -0.2 -0.12005-07 34.6 25.1 32.3 9.8 29.4 16.0 41.5 17.2 33.3 18.9
2008 35.7 26.7 31.8 10.5 30.3 15.2 41.8 17.7 33.9 18.7Tax Base 2009 35.5 27.4 31.9 10.5 30.3 15.2 42.1 18.5 34.3 18.6= avg.(t-1,…t-5) 2010 34.7 27.5 31.6 10.5 29.9 15.2 42.7 18.5 34.6 18.3
2008-10 35.3 27.2 31.7 10.5 30.2 15.2 42.2 18.2 34.3 18.52005-07 3.6 2.7 3.3 4.0 3.8 2.9 2.3 3.7 2.6 5.0
2008 1.4 8.2 2.6 6.8 4.1 4.5 2.3 6.5 0.7 7.7Inflation (%) 2009 0.8 8.6 3.0 1.9 -4.5 1.0 1.0 3.6 0.0 2.0
2010 2.8 5.6 17.3 4.9 1.3 2.1 2.1 4.4 2.5 3.22008-10 1.7 7.5 7.7 4.5 0.3 2.5 1.8 4.8 1.1 4.32005-07 -1.8 3.0 -1.8 0.0 -1.8 -3.3 -1.8 -1.1 -1.8 -7.3
2008 5.0 17.3 5.0 0.0 5.0 -3.0 5.0 1.8 5.0 -5.3Nominal Depreciation (%) 2009 -2.9 2.6 -2.9 0.0 -2.9 5.7 -2.9 21.4 -2.9 10.1(against US$) 2010 5.4 -13.6 5.4 0.0 5.4 -8.6 5.4 -6.5 5.4 -12.4
2008-10 2.5 2.1 2.5 0.0 2.5 -2.0 2.5 5.6 2.5 -2.52005-07 1.4 0.1 1.3 0.6 7.8 0.4 1.1 0.2 1.9 0.2
2008 1.5 0.2 1.4 0.5 8.9 0.3 1.0 0.2 1.9 0.2External Debt/GDP 2009 1.7 0.1 1.8 0.5 10.7 0.3 1.2 0.2 2.3 0.2
2010 1.5 0.1 1.7 0.5 11.0 0.3 1.1 0.2 2.4 0.22008-10 1.6 0.1 1.7 0.5 10.2 0.3 1.1 0.2 2.2 0.22005-07 1.5 9.9 1.1 8.5 0.4 52.9 4.1 8.4 5.1 9.9
2008 1.3 12.3 1.0 10.5 0.4 41.6 4.6 8.7 4.8 9.8Foreign Reserves/GDP (%) 2009 1.9 13.9 1.7 12.3 1.0 50.1 6.2 11.4 6.8 10.7
2010 2.3 12.0 2.1 10.1 1.0 44.8 7.7 11.6 9.2 9.82008-10 1.8 12.7 1.6 10.9 0.8 45.5 6.2 10.6 6.9 10.12005-07 0.6 0.6 0.6 1.5 1.5 2.1 0.6 0.6 0.7 0.4
2008 0.6 0.7 0.6 1.6 1.6 1.8 0.6 0.6 0.8 0.4Trade/GDP 2009 0.5 0.6 0.5 1.4 1.6 1.7 0.5 0.6 0.6 0.3
2010 0.5 0.5 0.5 1.5 0.9 1.8 0.6 0.6 0.7 0.32008-10 0.5 0.6 0.5 1.5 1.4 1.8 0.5 0.6 0.7 0.42005-07 3.7 5.5 3.7 9.3 5.9 5.9 1.4 3.8 1.5 6.1
2008 0.9 3.7 2.0 10.7 -3.0 4.7 -1.3 1.5 0.0 2.7Real GDP Growth (%) 2009 -3.6 -1.8 -2.0 2.4 -7.1 -1.7 -5.0 -6.5 -2.6 0.8
2010 -0.2 2.8 -4.5 7.5 -1.0 7.2 1.3 5.5 1.3 4.32008-10 -1.0 1.6 -1.5 6.9 -3.7 3.4 -1.7 0.2 -0.4 2.6
Appendix C.1. Dynamics of CDS Spreads 3-Year and 10-Year Tenor. This table provides a robustness check to Tables 2 and 3 across CDS 5, 3, and 10 tenor.The dependent variable (y) is sovereign CDS 3-year and 10-year tenor in basis points. SWEAP includes Greece, Ireland, Italy, Portugal, and Spain.Tax Base is an average Tax/GDP over a period of previous 5 years. TED Spread (3-month US$ LIBOR - 3-month US Treasury) and Inflation are in percent.All variables are in realtime (t), except the lagged CDS, y(t-1). Standard errors are in parentheses, with *** (**,*) denoting statistical significance at 1 (5,10) level.
Whole Sample 2005-10 Tranquility 2005-07 Crisis 2008-10
CDS 3-Year CDS 10-Year CDS 3-Year CDS 10-Year CDS 3-Year CDS 10-Year coeff. (s.e.) coeff. (s.e.) coeff. (s.e.) coeff. (s.e.) coeff. (s.e.) coeff. (s.e.)t2008 304.2 (102.3) *** 349.4 (104.2) ***t2009 -10.9 (17.8) -13.9 (22.3)t2010 63.9 (14.2) *** 66.7 (14.9) ***t2008 x Euro dummy -194.1 (82.2) ** -232.9 (85.6) ***t2009 x Euro dummy 73.3 (30.5) ** 91.5 (34.7) ***t2010 x Euro dummy 13.4 (20.9) 23.8 (19.2)t2008 x SWEAP -174.5 (90.6) * -210.6 (94.6) **t2009 x SWEAP 118.9 (31.4) *** 151.0 (34.9) ***t2010 x SWEAP 226.4 (48.4) *** 158.7 (36.2) ***TED Spread -0.5 (13.1) -1.4 (14.8) 35.3 (9.4) *** 28.8 (11.1) *** 155.1 (43.1) *** 134.0 (38.0) ***y(t-1) 0.3 (0.0) *** 0.3 (0.1) *** -0.1 (0.1) 0.1 (0.1) -0.1 (0.1) -0.1 (0.1)Trade/GDP -20.9 (32.3) -38.1 (29.9) -70.3 (45.6) -126.8 (60.4) ** -477.5 (245.3) * -438.5 (232.9) *Inflation 22.3 (6.9) *** 25.0 (6.1) *** 6.4 (2.2) *** 12.1 (2.6) *** 27.2 (11.6) ** 26.6 (10.6) **External Debt/GDP 8.4 (1.8) *** 5.0 (3.0) -14.8 (9.6) -16.9 (14.8) 194.4 (138.7) 207.6 (120.7) *Public Debt/Tax Base 15.4 (4.8) *** 13.3 (4.1) *** 112.9 (33.0) *** 127.1 (31.1) *** -211.2 (222.6) -263.8 (207.4)constant term -89.2 (31.0) *** -60.1 (24.3) ** -1046.5 (391.0) *** -1122.3 (366.7) *** -686.8 (1123.5) -743.4 (917.8)R2 0.42 0.48 0.75 0.88 0.56 0.58Observations 300 300 150 150 150 150Countries (i) 50 50 50 50 50 50Fixed Effects (i) No No No No No NoSerial Correlation y(t-1) y(t-1) y(t-1) y(t-1) y(t-1) y(t-1)Clustered s.e. (i) Yes Yes Yes Yes Yes Yes
(6)(1) (2) (3) (4) (5)

Appendix C.2. Dynamics of CDS Spreads (continued). This table provides robustness checks to results in Tables 2 and 3.The dependent variable (y) is sovereign CDS 5-year tenor in basis points. SWEAP includes Greece, Ireland, Italy, Portugal, and Spain.Tax Base is an average Tax/GDP over a period of previous 5 years. TED Spread (3-month US$ LIBOR - 3-month US Treasury) and Inflation are in percent.The Sargan test of over-identifying restrictions has a null hypothesis of exogenous instruments. The AR(#) test has a null of no autocorrelation in # differences.All variables are in realtime (t), except the lagged CDS. Standard errors are in parentheses, with *** (**,*) denoting statistical significance at 1 (5,10) level.
y = CDS in level y = CDS in 1st difference Whole Sample 2005-10 Whole Sample 2005-10
(1) (2) (3) (4) coeff. (s.e.) coeff. (s.e.) coeff. (s.e.) coeff. (s.e.)t2008 372.1 (91.3) *** 378.0 (100.9) ***t2009 -38.5 (17.3) ** 10.5 (22.4)t2010 42.8 (16.2) *** 63.4 (14.4) ***t2008 x Euro dummy -261.4 (75.7) *** -260.1 (86.1) ***t2009 x Euro dummy 64.2 (36.9) * 53.1 (34.4)t2010 x Euro dummy 24.3 (32.0) 27.4 (26.9)t2008 x SWEAP -274.5 (80.1) *** -250.4 (94.9) ***t2009 x SWEAP 79.8 (50.1) 100.0 (43.6) **t2010 x SWEAP 242.5 (63.1) *** 260.0 (62.2) ***TED Spread 0.5 (11.8) -10.1 (15.5) 103.8 (10.9) *** 70.7 (13.3) ***y(t-1) 0.3 (0.0) *** 0.3 (0.0) *** -0.7 (0.0) *** -0.7 (0.0) ***y(t-2) -0.8 (0.0) *** -0.7 (0.0) ***y(t-3) 0.8 (0.1) *** 0.1 (0.1)Trade/GDP -46.0 (27.3) * -23.0 (31.2) -273.2 (40.8) *** -186.8 (34.5) ***Inflation 24.3 (5.7) *** 30.3 (6.5) *** 0.3 (1.4) 3.7 (1.9) **External Debt/GDP 0.7 (3.5) 6.2 (5.3) 128.2 (20.7) *** 38.3 (8.9) ***Fiscal Balance/Tax Base -134.2 (56.7) **Fiscal Balance/GDP -10.1 (4.0) **Public Debt/Tax Base 240.3 (14.8) ***Public Debt/GDP 1.5 (0.4) ***constant term -31.8 (28.2) -150.4 (41.4) *** 88.8 (9.9) *** 52.1 (10.2) ***R2 0.48 0.48 .48 .44Observations 300 300 100 100Countries (i) 50 50 50 50Fixed Effects (i) No No Yes YesSerial Correlation y(t-1) y(t-1) Arellano-Bond Arellano-BondClustered s.e. (i) Yes Yes -- --
p-value: Sargan tests -- -- 0.6165 0.8504AR(1) tests -- -- 0.2406 0.9842
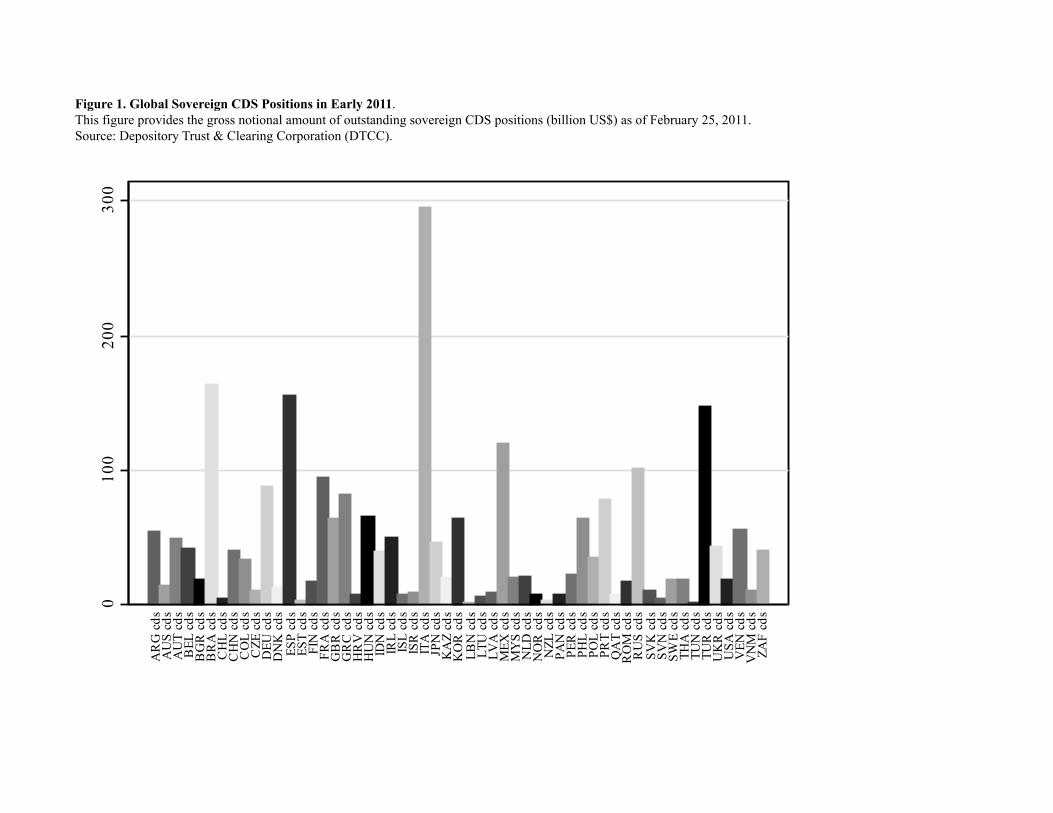
Figure 1. Global Sovereign CDS Positions in Early 2011.This figure provides the gross notional amount of outstanding sovereign CDS positions (billion US$) as of February 25, 2011.Source: Depository Trust & Clearing Corporation (DTCC).
010
020
030
0
AR
G c
dsA
US
cds
AU
T cd
sB
EL c
dsB
GR
cds
BR
A c
dsC
HL
cds
CH
N c
dsC
OL
cds
CZE
cds
DEU
cds
DN
K c
dsES
P cd
sES
T cd
sFI
N c
dsFR
A c
dsG
BR
cds
GR
C c
dsH
RV
cds
HU
N c
dsID
N c
dsIR
L cd
sIS
L cd
sIS
R c
dsIT
A c
dsJP
N c
dsK
AZ
cds
KO
R c
dsLB
N c
dsLT
U c
dsLV
A c
dsM
EX c
dsM
YS
cds
NLD
cds
NO
R c
dsN
ZL c
dsPA
N c
dsPE
R c
dsPH
L cd
sPO
L cd
sPR
T cd
sQ
AT
cds
RO
M c
dsR
US
cds
SVK
cds
SVN
cds
SWE
cds
THA
cds
TUN
cds
TUR
cds
UK
R c
dsU
SA c
dsV
EN c
dsV
NM
cds
ZAF
cds

Figure 2. Evolution of Sovereign CDS Prices. This figure plots CDS 5-year tenor (basis points) for selected middle-income countries and Eurozone members.
0
100
200
300
400 ESP
0
100
200
300
400 ZAF
02004006008001000 GRC
100
200
300
400 PAN
0
200
400
600
800 IRL
050100150200250 MYS
050100150200250 ITA
0
100
200
300
400 MEX
0
200
400
600
2005q1 2006q3 2008q1 2009q3 2011q1
PRT
100
200
300400
2005q1 2006q3 2008q1 2009q3 2011q1
COL
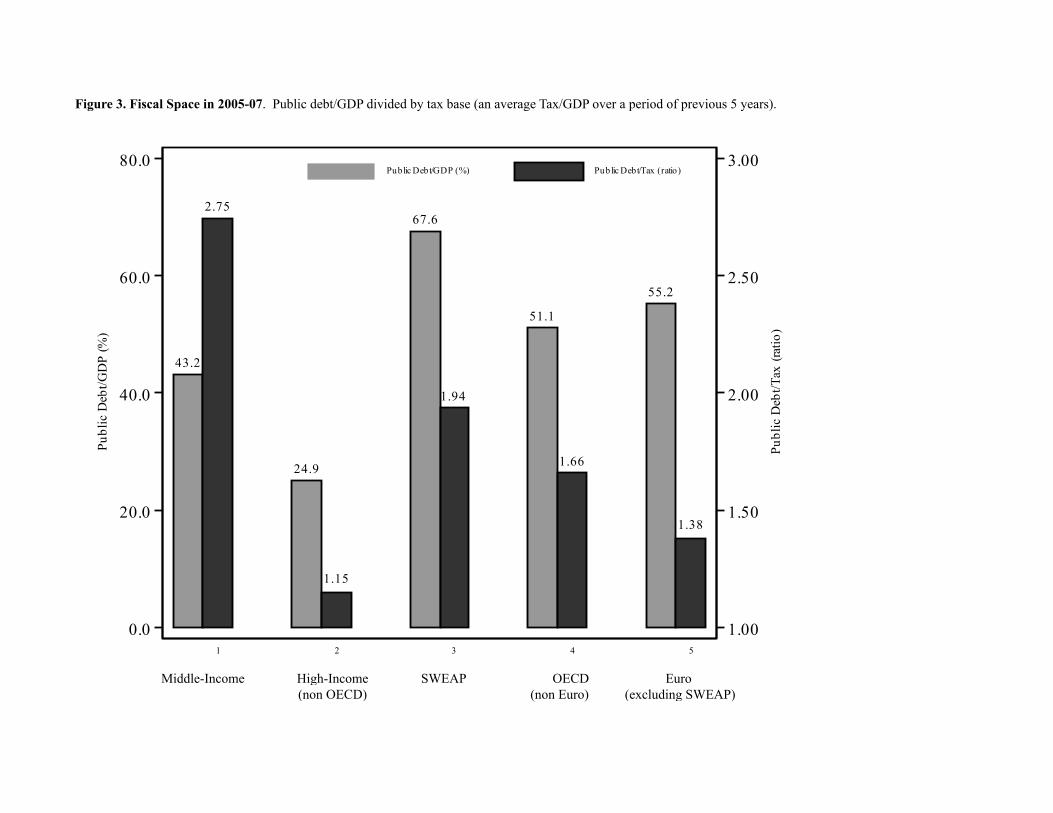
Figure 3. Fiscal Space in 2005-07. Public debt/GDP divided by tax base (an average Tax/GDP over a period of previous 5 years).
Middle-Income SWEAP OECD (non Euro)
High-Income(non OECD)
Euro (excluding SWEAP)
1 2 3 4 5
43.2
24.9
67.6
51.1
55.2
2.75
1.15
1.94
1.66
1.38
1.00
1.50
2.00
2.50
3.00
Publ
ic D
ebt/T
ax (r
atio
)
0.0
20.0
40.0
60.0
80.0
Publ
ic D
ebt/G
DP
(%)
Public Debt/GDP (%) Public Debt/Tax (ratio)
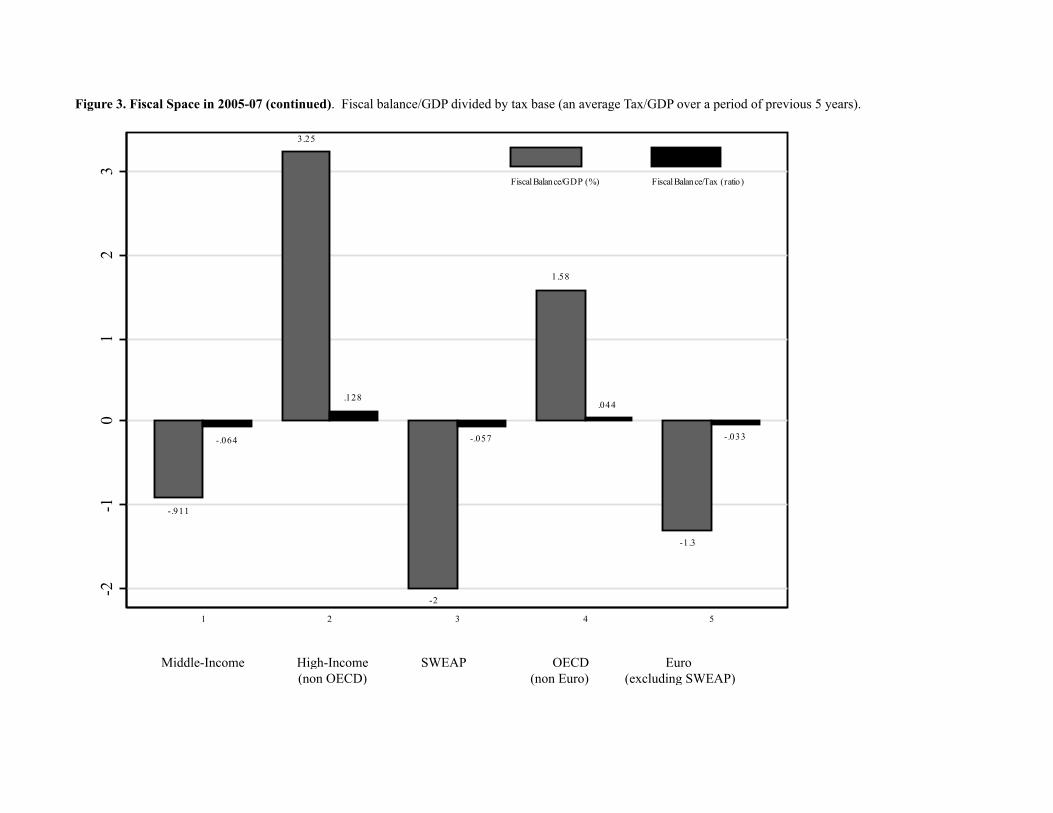
Figure 3. Fiscal Space in 2005-07 (continued). Fiscal balance/GDP divided by tax base (an average Tax/GDP over a period of previous 5 years).
Middle-Income SWEAP OECD (non Euro)(non OECD) (excluding SWEAP)
High-Income Euro
-.911
-.064
3.25
.128
-2
-.057
1.58
.044
-1.3
-.033
-2-1
01
23
1 2 3 4 5
Fiscal Balance/GDP (%) Fiscal Balance/Tax (ratio)
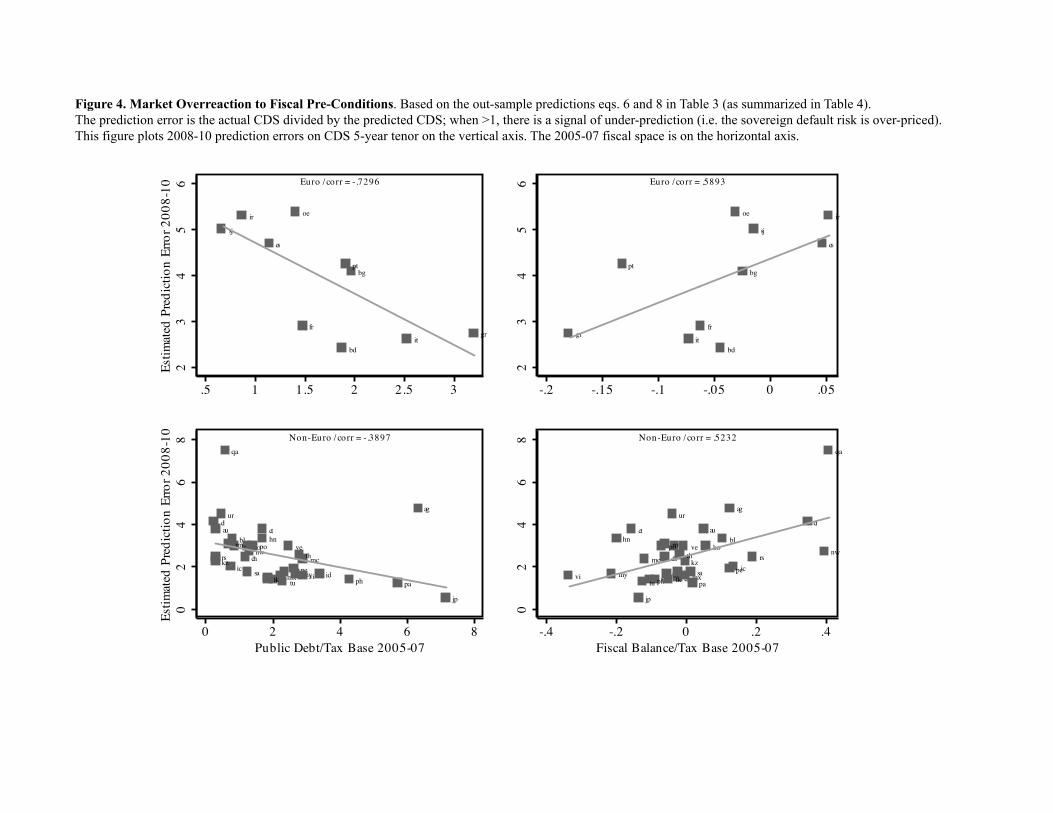
Figure 4. Market Overreaction to Fiscal Pre-Conditions. Based on the out-sample predictions eqs. 6 and 8 in Table 3 (as summarized in Table 4).The prediction error is the actual CDS divided by the predicted CDS; when >1, there is a signal of under-prediction (i.e. the sovereign default risk is over-priced).This figure plots 2008-10 prediction errors on CDS 5-year tenor on the vertical axis. The 2005-07 fiscal space is on the horizontal axis.
oe
bg
bd
es
frgr
ir
it
pt
sj
23
45
6Es
timat
ed P
redi
ctio
n Er
ror 2
008-
10
.5 1 1.5 2 2.5 3
Euro / corr = -.7296
ag
aubl
br
cl
ch
cb
cthn
idic is
jp
kz
koln
mc
mx my
nw
pa
peph
po
qa
rm
rs th
tutk
ur
ve
visa
02
46
8Es
timat
ed P
redi
ctio
n Er
ror 2
008-
10
0 2 4 6 8Public Debt/Tax Base 2005-07
Non-Euro / corr = -.3897
oe
bg
bd
es
frgr
ir
it
pt
sj
23
45
6
-.2 -.15 -.1 -.05 0 .05
Euro / corr = .5893
ag
aubl
br
cl
ch
cb
cthn
idicis
jp
kz
koln
mc
mxmy
nw
pa
peph
po
qa
rm
rsth
tu tk
ur
ve
vi sa
02
46
8
-.4 -.2 0 .2 .4Fiscal Balance/Tax Base 2005-07
Non-Euro / corr = .5232
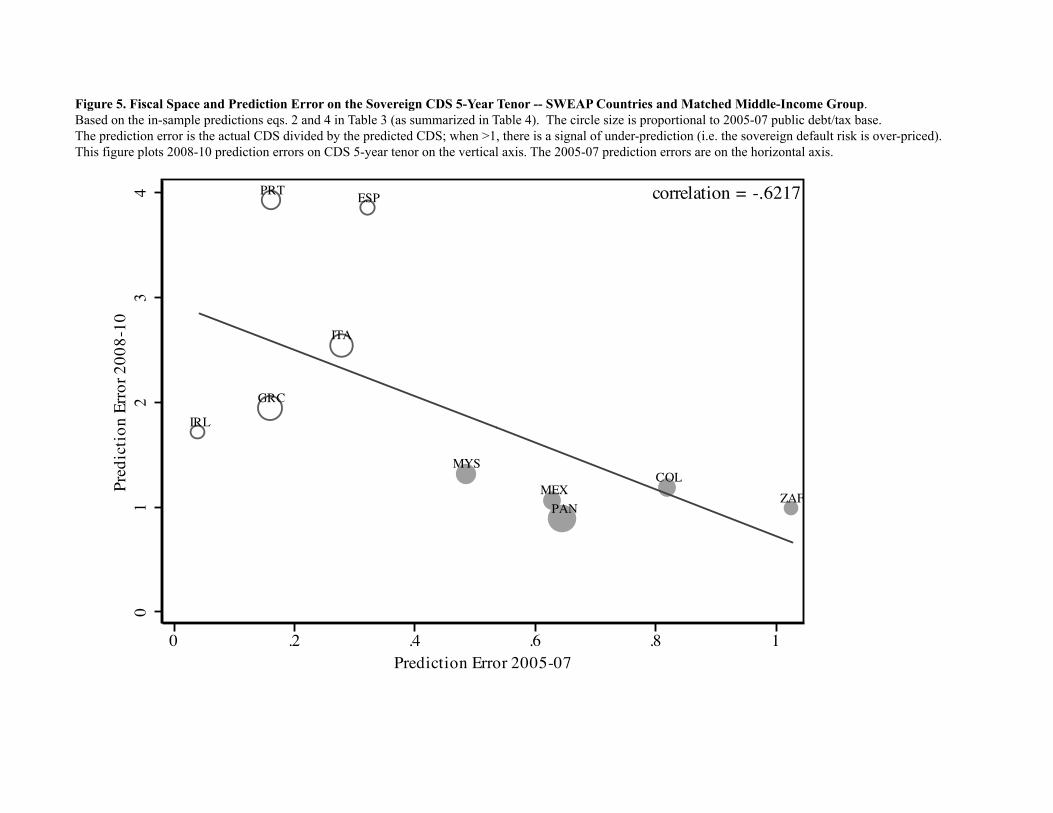
Figure 5. Fiscal Space and Prediction Error on the Sovereign CDS 5-Year Tenor -- SWEAP Countries and Matched Middle-Income Group.Based on the in-sample predictions eqs. 2 and 4 in Table 3 (as summarized in Table 4). The circle size is proportional to 2005-07 public debt/tax base.The prediction error is the actual CDS divided by the predicted CDS; when >1, there is a signal of under-prediction (i.e. the sovereign default risk is over-priced).This figure plots 2008-10 prediction errors on CDS 5-year tenor on the vertical axis. The 2005-07 prediction errors are on the horizontal axis.
COL
ESP
GRC
IRL
ITA
MEX
MYS
PAN
PRT
ZAF
01
23
4Pr
edic
tion
Erro
r 200
8-10
0 .2 .4 .6 .8 1Prediction Error 2005-07
correlation = -.6217