Embed Size (px)
Citation preview
V 11 no 5 bull MayJune 2008
What is the Price of Oil Joeri de Wit and Aaron Smith
A quoted price for a commodity such as oil is specific to a particular location at a particular time This article describes how the crude oil prices reported in the media relate to world oil prices and local gasoline prices
Oil prices first hit $100 per barrel on January 2 2008 On that day a single trader look-
which describes the grade of oil delivershyable on this market In the remainder of this article we describe how the WTI
An Oil Pipeline Hub
ing for notoriety bid $100 to buy the spot price relates to world crude oil minimum 1000 barrels before unload- prices and California gasoline prices ing the position immediately for a
Cushing Oklahoma small loss This trader did not physically
Also in this issue
Farmland Conversion in California Evidence from the Williamson Act Program Kent Kovacs5
Californiarsquos Water Problems Why a Comprehensive Solution Makes Sense Leo Simon and Susan Stratton9
In the next issue
Correct (and Misleading) Arguments for Market-Based Pollution Control Policies Larry Karp
take possession of any oil and being a floor trader on the New York Mercantile Exchange (NYMEX) did not have the capacity to take possession of 1000 barshyrels of oil How do NYMEX futures prices relate to prices of physical barrels of oil in world markets and how do they relate to the price of gasoline at Califorshynia pumps
NYMEX operates a futures market in crude oil among other commodities Contracts in this market constitute the promise to buy or sell crude oil in the city of Cushing Oklahoma at a fixed price in a particular month in the future The media usually quotes the nearby price ie the price for delivery next month Thus the buyer of $100 oil on January 2 specifically entered a contract to buy 1000 barrels of oil in Cushing for $100 per barrel in February Instead of following through on this commitshyment the trader canceled it by entershying an offsetting contract to sell exactly the same quantity of oil in February
Although most futures contracts do not end in delivery the nearby NYMEX futures price is almost identical to the spot price for immediate delivery at Cushing This spot price carries the label West Texas Intermediate (WTI)
Oklahoma is a natural choice for delivshyeries on futures and spot crude oil conshytracts because of its close historical ties with the oil industry and proximity to Texas and the Gulf Coast Cushing is a hub at which WTI and other domestic crude oils come together with supplies imported through the Gulf Coast and are re-distributed mostly northward to Chicago-area refineries The Gulf Coast is not only the largest producer of crude oil but also the largest importer currently importing 50 percent of all foreign crudes This oil needs to be directed northward and is divided equally between deliveries to the East Coast and to the Midwest Cushing lying en route right above the two largshyest producing states is well-situated for delivery across the United States
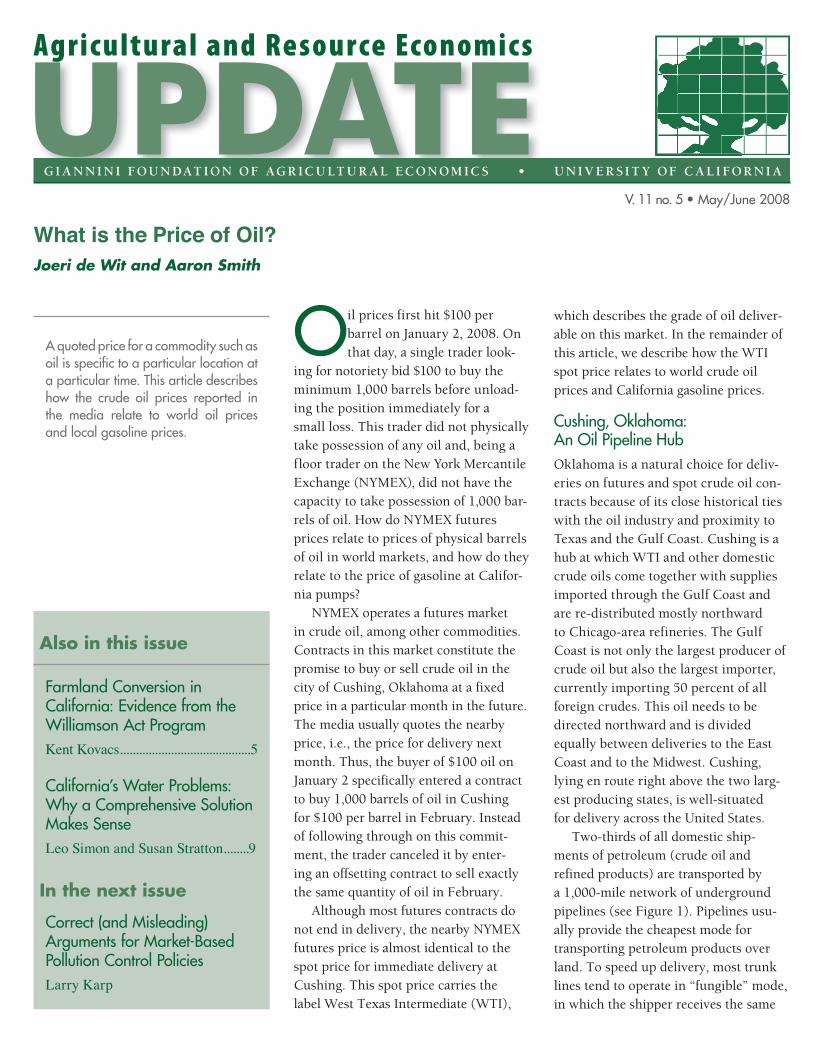
Two-thirds of all domestic shipshyments of petroleum (crude oil and refined products) are transported by a 1000-mile network of underground pipelines (see Figure 1) Pipelines usushyally provide the cheapest mode for transporting petroleum products over land To speed up delivery most trunk lines tend to operate in ldquofungiblerdquo mode in which the shipper receives the same
Figure 1 Select Delivery Lines
Source API Cushing Oklahoma
quality of product that it tendered for transport but not the same molecules The alternative is batch mode in which the shipper receives the exact molshyecules that it tendered for transport
Flexibility in oil supply through the pipeline system is essential for suppliers to be able to respond to price signals Storage tanks at logistics hubs enhance the flexibility of supply by reducing the average distance and therefore time until oil can be supplied to consumers Their central role is to enable markets to clear because their storage and supply options allow market participants to respond to price signals by adjusting their demand and supply to restore balance
Limits to Arbitrage The flexibility of petroleum supply is limited by pipeline and storage tank capacity and by the time it takes to move oil from one place to another As a consequence local supply gluts and shortages affect local prices For example increases in stock of crude oil in Cushing put downward presshysure on the WTI spot price To bring out this relationship Figure 2 plots the stock of crude oil in Cushing (excluding the Strategic Petroleum Reserve) against the difference between WTI and Brent crude oil prices
Brent crude is produced in Northshyern Europe and is used as a pricing benchmark for 60 percent of crude streams around the world It can be thought of as a measure of world crude prices By taking the difference between the WTI and Brent spot prices we filter out movements in the WTI spot price that result from changes in world crude prices thereby illuminatshying the relationship between Cushshying stocks and the WTI spot price Figure 2 shows evidence of an inverse relationship between the WTIndashBrent price spread and stocks at Cushing In other words high levels of stocks at Cushing tend to depress the WTI spot price relative to the Brent spot price
In the time frame of Figure 2 stockshypiles at Cushing reached their highest level in AprilndashMay 2007 due to a comshybination of three factors the shutdown of Valero Energy Corporationrsquos McKee refinery in Texas on April 13 high volumes of Canadian imports and low refinery throughput in general These factors caused a slump in the spot price of WTI which traded at $834 per barrel less than Brent on May 24 2007 a record price difference This difference is especially notable because WTI trades at an average premium of about $2 per barrel over Brent WTI is lighter (lower
wax content) and sweeter (less sulfur) than Brent crude properties that make WTI more desirable for the producshytion of refined products Therefore this episode reveals the significant limitashytions of short-term price arbitrage in the current oil distribution network
There is anecdotal evidence that WTI has become more sensitive to local market conditions in recent years to the extent that some market analysts view WTI as no longer an appropriate benchshymark for pricing international crude streams One reason for this increased sensitivity may be reduced flexibility in pipeline transport arising from increasshyingly heterogeneous fuel formulations State and local government regulations specify different formulations in many parts of the country These formulations need to be transported over pipelines in batch mode effectively reducing the capacity of the refinery and distribution system in a number of ways batching produces more downgraded product and costly transmix as fuels of increased hetshyerogeneity come into contact with each other tanks must be completely empshytied before being filled with products that meet more stringent requirements batch schedules for trunklines need to be established months in advance so that more formulations make planning ahead more complex This last point is illustrated by the fact that the Coloshynial Pipeline a major trunk line from Texas to New York currently transports over 100 distinct grades of gasoline
California Gasoline Prices and WTI Although WTI may be losing its status as an international benchmark it remains the predominant benchmark in the United States Figure 3 plots the WTI spot price the spot price of regular conventional gasoline in LA and the average retail price of reforshymulated gasoline in California The LA spot gasoline price represents a wholesale price for gasoline in Calishyfornia Figure 3 shows that wholesale
Giannini Foundation of Agricultural Economics bull University of California 2
4
2
0
-2
gasoline prices have increased at the same rate as WTI crude oil
Figure 2 Prices and Supply at the Cushing Oklahoma WTI Spot Market
10California retail gasoline prices 30
have increased at a slower rate than the 8 other two prices In the last five years 25
6both the WTI price and the LA spot gasoline price have tripled whereas 20
Millions of Barrels
retail gasoline prices only doubled from about $170 to about $340 per gallon
15Put another way the retail margin has D
ollars per Barrel
remained about $080 per gallon over 10the last five years which means that
it has declined from about 50 percent -6of the retail gasoline price to about 5
30 percent This result suggests that -8
retail margins are determined mostly 0 -10 Apr-04
Jul-04
Oct-04
Jan-05
Apr-05
Jul-05
Oct-05
Jan-06
Apr-06
Jul-06
Oct-06
Jan-07
Apr-07
Jul-07
Oct-07
Jan-08
Apr-08 by factors unrelated to oil prices
Figure 3 also shows that California Stock Crude OK (Millions of Barrels) WTI minus Brent Spot Price (in Dollars per Barrel) gasoline prices exhibit higher volatility
than crude oil prices Moreover Calishyfornia has more volatile gasoline prices
Figure 3 WTI as a Benchmark for Refined Products
than the rest of the country because 45
the statersquos unique product-quality 40 requirements reduce supply flexibility Essentially all of Californiarsquos refined product demand is met by output from the statersquos refineries Although there is one pipeline carrying refined petroshyleum products from the Gulf Coast to D
ollars per Gallon 35
30
25
California its supply capacity is not 20
sufficient to enable arbitrage of price difshy15
ferentials between the West Coast and the rest of the country Other modes of 10
transportation also do not offer short-run supply flexibility For example it 05
takes 14 days to travel from the Gulf 0
1995
1996
1997
1998
1999
2000
2001
2002
2003
2004
2005
2006
2007
2008
Coast to the West Coast by barge
Price Dynamics Figure 3 reveals the long-run relashytionship between California gasoline markets and the WTI crude oil price How do average retail gasoline prices in CA respond to week-to-week flucshytuations in crude oil and wholesale gasoline markets We answer this question by plotting impulse response functions in Figures 41-44 These plots illustrate the predicted dynamic response of CA retail gasoline prices to unanticipated shocks in four prices
CA Retail Gasoline WTI Crude LA Spot Gasoline Data source wwweiadoegovoil_gaspetroleuminfo_glancepetroleumhtml
the Brent spot price the WTI spot price the LA spot gasoline price and the CA retail gasoline price itself
We define each shock conditional on those before it in the production process For example a shock to the LA spot price of gasoline represents an unanticipated change in the wholesale price of gasoline after observing the Brent spot price and the WTI spot price but not the CA average retail price of
gasoline Thus we interpret shocks to the LA gasoline spot price as represhysenting shocks to the refining margin Each shock represents a one-time one-standard deviation unanticipated price increase We use weekly data with the spot prices recorded every Friday and the retail price measured from an EIA survey on the following Monday morning We plot the responses over a period of 26 weeks all series are in
Giannini Foundation of Agricultural Economics bull University of California 3
-4
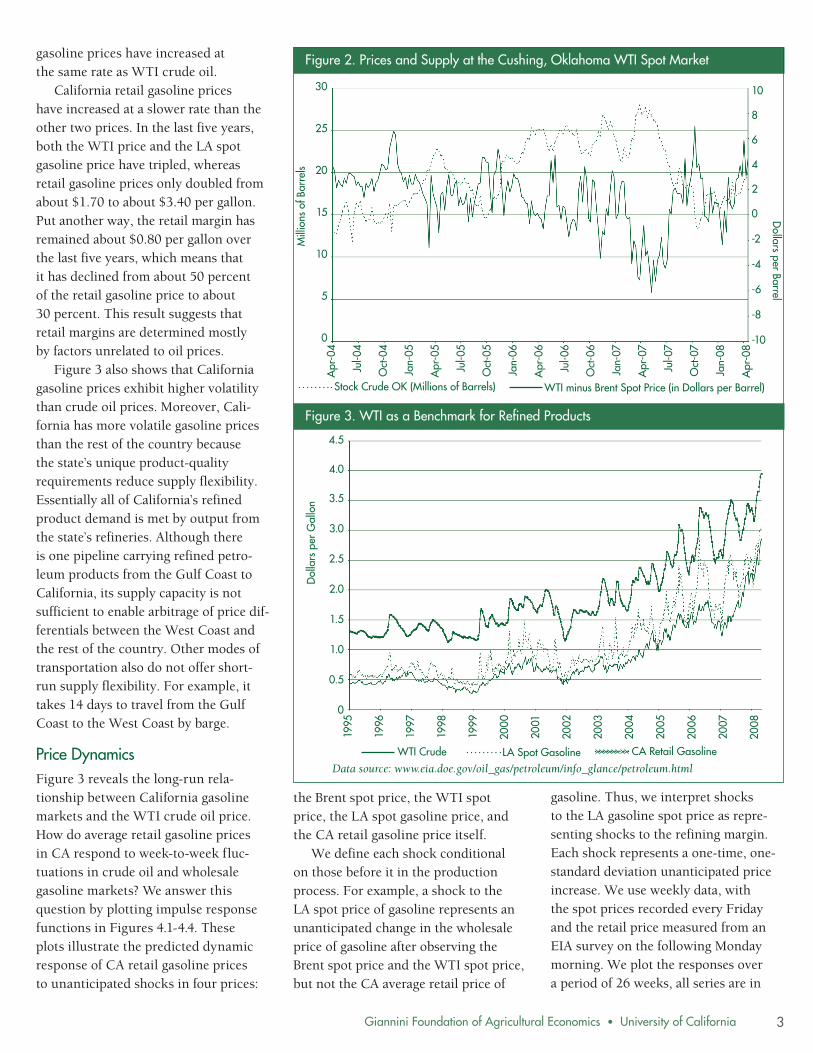
Figure 4 Predicted Responses of CA Retail Gasoline Prices to Upstream Price Shocks
Figure 41 Shock to the Brent Spot Price 5
4
3
2
1
0
-1
-2
-3
-4
-5
0 2 4 6 8 10 12 14 16 18 20 22 24 26 -1
-2
-3
-4
-5
-1
-2
-3
-4
-5
0 2 4 6 8 10 12 14 16 18 20 22 24 26
0 2 4 6 8 10 12 14 16 18 20 22 24 26
Figure 42 Shock to the WTI Spot Price 5
4
3
2
1
0
Percent Response
Percent Response
Percent Response
Percent Response
Figure 43 Shock to the LA Gasoline Spot Price 5
4
3
2
1
0
Figure 44 Shock to the CA Retail Spot Price 5
4
3
2
1
0 0 2 4 6 8 10 12 14 16 18 20 22 24 26
-1
-2
-3
-4
-5 The dashed lines represent 95 confidence intervals for the impulse response estimates Based on weekly data spanning 1995-2007 Data Source httptonto eiadoegovpetpet_pri_topasp
natural logs and our sample runs from January 1 1995 to January 7 2008
A one-standard deviation shock to the Brent spot price is equivalent to a five percent hike of this price in one week and represents a shock to world crude oil prices After a five percent shock the Brent spot price tends to pull back somewhat and settle about three percent above its initial level In response Figure 41 shows that CA retail gasoline prices increase gradushyally over a seven-week period eventushyally increasing by about two percent This predicted two percent response to a three percent long-run increase in oil prices is consistent with the declinshying percentage retail margin revealed in Figure 3 The predicted response curve also suggests that gasoline prices may start to decline at around the 20-week mark but the large confidence interval around this prediction means that it is statistically insignificant
Figure 42 shows that California gasoline prices hardly react to WTI price shocks Because we define a WTI price shock conditional on a fixed Brent price this shock represents an unanticipated change in the WTI price without a change in world prices Such shocks have little effect on California gasoline prices for two reasons First they are short-lived disappearing within a few weeks as WTI and Brent prices come back together Second almost all of the West Coast crude oil supply comes from the Alaskan North Slope oil fields or from California
California retail prices also do not respond immediately to shocks to the LA spot price As shown in Figure 43 it takes about six weeks for these shocks to fully affect retail prices The initial one-standard deviation shock is about 66 percent and it disappears after about 12 weeks The retail price reaction peaks at about 25 percent before fading to zero after about 20 weeks Figure 44 shows that shocks to retail prices that are uncorrelated with upstream prices
are small (about one percent) but they tend to persist This persistence reflects the declining percentage retail margin over time Specifically when the pershycentage retail margin decreases it tends to stay at that lower level rather than reverting back to its previous level
Conclusion When the media report the latest crude oil price they refer to a futures price that closely matches the spot price in the town of Cushing Oklahoma Much of the short-term variation in this price reflects local crude oil supply condishytions near Cushing Such variation has little or no effect on California retail gasoline prices Nonetheless California gasoline prices exhibit much greater volatility than crude oil prices This volatility reflects supply inflexibility caused by Californiarsquos unique gasoline formulation regulations It illustrates the inefficiencies generated by the curshyrent system which allows states and counties to set their own fuel standards
Long-run changes in crude oil prices affect California retail gasoline prices gradually over a couple of months After this adjustment period the final percentage change in California gasoline prices is less than the corshyresponding oil price change because retail margins do not increase with oil prices Overall month-to-month variation in crude oil prices provides a much better signal of future Calishyfornia gasoline prices than day-to-day or week-to-week price movements
Joeri de Wit is a PhD student in the Department of Agricultural and Resource Economics at UC Davis He can be reached by e-mail at jfdewitprimalucdavisedu Aaron Smith is an associate professor in the ARE department at UC Davis He can be reached at asmithprimal ucdavisedu
Giannini Foundation of Agricultural Economics bull University of California 4
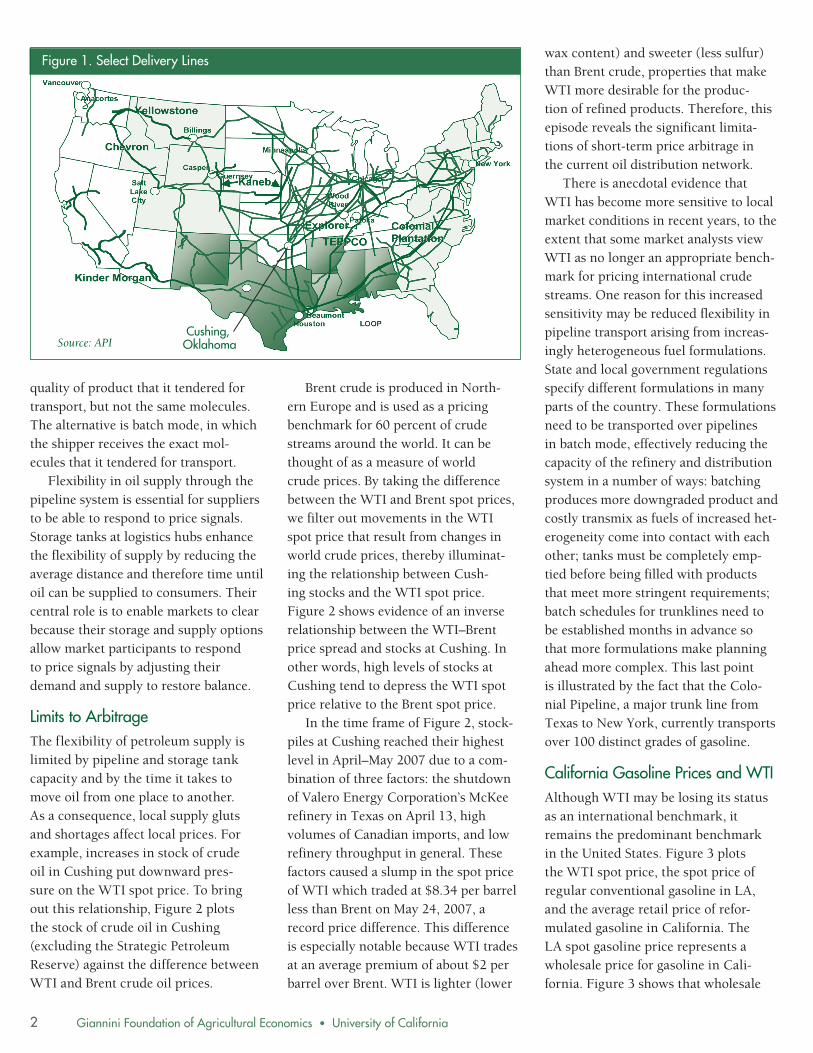
Figure 1 Select Delivery Lines
Source API Cushing Oklahoma
quality of product that it tendered for transport but not the same molecules The alternative is batch mode in which the shipper receives the exact molshyecules that it tendered for transport
Flexibility in oil supply through the pipeline system is essential for suppliers to be able to respond to price signals Storage tanks at logistics hubs enhance the flexibility of supply by reducing the average distance and therefore time until oil can be supplied to consumers Their central role is to enable markets to clear because their storage and supply options allow market participants to respond to price signals by adjusting their demand and supply to restore balance
Limits to Arbitrage The flexibility of petroleum supply is limited by pipeline and storage tank capacity and by the time it takes to move oil from one place to another As a consequence local supply gluts and shortages affect local prices For example increases in stock of crude oil in Cushing put downward presshysure on the WTI spot price To bring out this relationship Figure 2 plots the stock of crude oil in Cushing (excluding the Strategic Petroleum Reserve) against the difference between WTI and Brent crude oil prices
Brent crude is produced in Northshyern Europe and is used as a pricing benchmark for 60 percent of crude streams around the world It can be thought of as a measure of world crude prices By taking the difference between the WTI and Brent spot prices we filter out movements in the WTI spot price that result from changes in world crude prices thereby illuminatshying the relationship between Cushshying stocks and the WTI spot price Figure 2 shows evidence of an inverse relationship between the WTIndashBrent price spread and stocks at Cushing In other words high levels of stocks at Cushing tend to depress the WTI spot price relative to the Brent spot price
In the time frame of Figure 2 stockshypiles at Cushing reached their highest level in AprilndashMay 2007 due to a comshybination of three factors the shutdown of Valero Energy Corporationrsquos McKee refinery in Texas on April 13 high volumes of Canadian imports and low refinery throughput in general These factors caused a slump in the spot price of WTI which traded at $834 per barrel less than Brent on May 24 2007 a record price difference This difference is especially notable because WTI trades at an average premium of about $2 per barrel over Brent WTI is lighter (lower
wax content) and sweeter (less sulfur) than Brent crude properties that make WTI more desirable for the producshytion of refined products Therefore this episode reveals the significant limitashytions of short-term price arbitrage in the current oil distribution network
There is anecdotal evidence that WTI has become more sensitive to local market conditions in recent years to the extent that some market analysts view WTI as no longer an appropriate benchshymark for pricing international crude streams One reason for this increased sensitivity may be reduced flexibility in pipeline transport arising from increasshyingly heterogeneous fuel formulations State and local government regulations specify different formulations in many parts of the country These formulations need to be transported over pipelines in batch mode effectively reducing the capacity of the refinery and distribution system in a number of ways batching produces more downgraded product and costly transmix as fuels of increased hetshyerogeneity come into contact with each other tanks must be completely empshytied before being filled with products that meet more stringent requirements batch schedules for trunklines need to be established months in advance so that more formulations make planning ahead more complex This last point is illustrated by the fact that the Coloshynial Pipeline a major trunk line from Texas to New York currently transports over 100 distinct grades of gasoline
California Gasoline Prices and WTI Although WTI may be losing its status as an international benchmark it remains the predominant benchmark in the United States Figure 3 plots the WTI spot price the spot price of regular conventional gasoline in LA and the average retail price of reforshymulated gasoline in California The LA spot gasoline price represents a wholesale price for gasoline in Calishyfornia Figure 3 shows that wholesale
Giannini Foundation of Agricultural Economics bull University of California 2
4
2
0
-2
gasoline prices have increased at the same rate as WTI crude oil
Figure 2 Prices and Supply at the Cushing Oklahoma WTI Spot Market
10California retail gasoline prices 30
have increased at a slower rate than the 8 other two prices In the last five years 25
6both the WTI price and the LA spot gasoline price have tripled whereas 20
Millions of Barrels
retail gasoline prices only doubled from about $170 to about $340 per gallon
15Put another way the retail margin has D
ollars per Barrel
remained about $080 per gallon over 10the last five years which means that
it has declined from about 50 percent -6of the retail gasoline price to about 5
30 percent This result suggests that -8
retail margins are determined mostly 0 -10 Apr-04
Jul-04
Oct-04
Jan-05
Apr-05
Jul-05
Oct-05
Jan-06
Apr-06
Jul-06
Oct-06
Jan-07
Apr-07
Jul-07
Oct-07
Jan-08
Apr-08 by factors unrelated to oil prices
Figure 3 also shows that California Stock Crude OK (Millions of Barrels) WTI minus Brent Spot Price (in Dollars per Barrel) gasoline prices exhibit higher volatility
than crude oil prices Moreover Calishyfornia has more volatile gasoline prices
Figure 3 WTI as a Benchmark for Refined Products
than the rest of the country because 45
the statersquos unique product-quality 40 requirements reduce supply flexibility Essentially all of Californiarsquos refined product demand is met by output from the statersquos refineries Although there is one pipeline carrying refined petroshyleum products from the Gulf Coast to D
ollars per Gallon 35
30
25
California its supply capacity is not 20
sufficient to enable arbitrage of price difshy15
ferentials between the West Coast and the rest of the country Other modes of 10
transportation also do not offer short-run supply flexibility For example it 05
takes 14 days to travel from the Gulf 0
1995
1996
1997
1998
1999
2000
2001
2002
2003
2004
2005
2006
2007
2008
Coast to the West Coast by barge
Price Dynamics Figure 3 reveals the long-run relashytionship between California gasoline markets and the WTI crude oil price How do average retail gasoline prices in CA respond to week-to-week flucshytuations in crude oil and wholesale gasoline markets We answer this question by plotting impulse response functions in Figures 41-44 These plots illustrate the predicted dynamic response of CA retail gasoline prices to unanticipated shocks in four prices
CA Retail Gasoline WTI Crude LA Spot Gasoline Data source wwweiadoegovoil_gaspetroleuminfo_glancepetroleumhtml
the Brent spot price the WTI spot price the LA spot gasoline price and the CA retail gasoline price itself
We define each shock conditional on those before it in the production process For example a shock to the LA spot price of gasoline represents an unanticipated change in the wholesale price of gasoline after observing the Brent spot price and the WTI spot price but not the CA average retail price of
gasoline Thus we interpret shocks to the LA gasoline spot price as represhysenting shocks to the refining margin Each shock represents a one-time one-standard deviation unanticipated price increase We use weekly data with the spot prices recorded every Friday and the retail price measured from an EIA survey on the following Monday morning We plot the responses over a period of 26 weeks all series are in
Giannini Foundation of Agricultural Economics bull University of California 3
-4
Figure 4 Predicted Responses of CA Retail Gasoline Prices to Upstream Price Shocks
Figure 41 Shock to the Brent Spot Price 5
4
3
2
1
0
-1
-2
-3
-4
-5
0 2 4 6 8 10 12 14 16 18 20 22 24 26 -1
-2
-3
-4
-5
-1
-2
-3
-4
-5
0 2 4 6 8 10 12 14 16 18 20 22 24 26
0 2 4 6 8 10 12 14 16 18 20 22 24 26
Figure 42 Shock to the WTI Spot Price 5
4
3
2
1
0
Percent Response
Percent Response
Percent Response
Percent Response
Figure 43 Shock to the LA Gasoline Spot Price 5
4
3
2
1
0
Figure 44 Shock to the CA Retail Spot Price 5
4
3
2
1
0 0 2 4 6 8 10 12 14 16 18 20 22 24 26
-1
-2
-3
-4
-5 The dashed lines represent 95 confidence intervals for the impulse response estimates Based on weekly data spanning 1995-2007 Data Source httptonto eiadoegovpetpet_pri_topasp
natural logs and our sample runs from January 1 1995 to January 7 2008
A one-standard deviation shock to the Brent spot price is equivalent to a five percent hike of this price in one week and represents a shock to world crude oil prices After a five percent shock the Brent spot price tends to pull back somewhat and settle about three percent above its initial level In response Figure 41 shows that CA retail gasoline prices increase gradushyally over a seven-week period eventushyally increasing by about two percent This predicted two percent response to a three percent long-run increase in oil prices is consistent with the declinshying percentage retail margin revealed in Figure 3 The predicted response curve also suggests that gasoline prices may start to decline at around the 20-week mark but the large confidence interval around this prediction means that it is statistically insignificant
Figure 42 shows that California gasoline prices hardly react to WTI price shocks Because we define a WTI price shock conditional on a fixed Brent price this shock represents an unanticipated change in the WTI price without a change in world prices Such shocks have little effect on California gasoline prices for two reasons First they are short-lived disappearing within a few weeks as WTI and Brent prices come back together Second almost all of the West Coast crude oil supply comes from the Alaskan North Slope oil fields or from California
California retail prices also do not respond immediately to shocks to the LA spot price As shown in Figure 43 it takes about six weeks for these shocks to fully affect retail prices The initial one-standard deviation shock is about 66 percent and it disappears after about 12 weeks The retail price reaction peaks at about 25 percent before fading to zero after about 20 weeks Figure 44 shows that shocks to retail prices that are uncorrelated with upstream prices
are small (about one percent) but they tend to persist This persistence reflects the declining percentage retail margin over time Specifically when the pershycentage retail margin decreases it tends to stay at that lower level rather than reverting back to its previous level
Conclusion When the media report the latest crude oil price they refer to a futures price that closely matches the spot price in the town of Cushing Oklahoma Much of the short-term variation in this price reflects local crude oil supply condishytions near Cushing Such variation has little or no effect on California retail gasoline prices Nonetheless California gasoline prices exhibit much greater volatility than crude oil prices This volatility reflects supply inflexibility caused by Californiarsquos unique gasoline formulation regulations It illustrates the inefficiencies generated by the curshyrent system which allows states and counties to set their own fuel standards
Long-run changes in crude oil prices affect California retail gasoline prices gradually over a couple of months After this adjustment period the final percentage change in California gasoline prices is less than the corshyresponding oil price change because retail margins do not increase with oil prices Overall month-to-month variation in crude oil prices provides a much better signal of future Calishyfornia gasoline prices than day-to-day or week-to-week price movements
Joeri de Wit is a PhD student in the Department of Agricultural and Resource Economics at UC Davis He can be reached by e-mail at jfdewitprimalucdavisedu Aaron Smith is an associate professor in the ARE department at UC Davis He can be reached at asmithprimal ucdavisedu
Giannini Foundation of Agricultural Economics bull University of California 4
4
2
0
-2
gasoline prices have increased at the same rate as WTI crude oil
Figure 2 Prices and Supply at the Cushing Oklahoma WTI Spot Market
10California retail gasoline prices 30
have increased at a slower rate than the 8 other two prices In the last five years 25
6both the WTI price and the LA spot gasoline price have tripled whereas 20
Millions of Barrels
retail gasoline prices only doubled from about $170 to about $340 per gallon
15Put another way the retail margin has D
ollars per Barrel
remained about $080 per gallon over 10the last five years which means that
it has declined from about 50 percent -6of the retail gasoline price to about 5
30 percent This result suggests that -8
retail margins are determined mostly 0 -10 Apr-04
Jul-04
Oct-04
Jan-05
Apr-05
Jul-05
Oct-05
Jan-06
Apr-06
Jul-06
Oct-06
Jan-07
Apr-07
Jul-07
Oct-07
Jan-08
Apr-08 by factors unrelated to oil prices
Figure 3 also shows that California Stock Crude OK (Millions of Barrels) WTI minus Brent Spot Price (in Dollars per Barrel) gasoline prices exhibit higher volatility
than crude oil prices Moreover Calishyfornia has more volatile gasoline prices
Figure 3 WTI as a Benchmark for Refined Products
than the rest of the country because 45
the statersquos unique product-quality 40 requirements reduce supply flexibility Essentially all of Californiarsquos refined product demand is met by output from the statersquos refineries Although there is one pipeline carrying refined petroshyleum products from the Gulf Coast to D
ollars per Gallon 35
30
25
California its supply capacity is not 20
sufficient to enable arbitrage of price difshy15
ferentials between the West Coast and the rest of the country Other modes of 10
transportation also do not offer short-run supply flexibility For example it 05
takes 14 days to travel from the Gulf 0
1995
1996
1997
1998
1999
2000
2001
2002
2003
2004
2005
2006
2007
2008
Coast to the West Coast by barge
Price Dynamics Figure 3 reveals the long-run relashytionship between California gasoline markets and the WTI crude oil price How do average retail gasoline prices in CA respond to week-to-week flucshytuations in crude oil and wholesale gasoline markets We answer this question by plotting impulse response functions in Figures 41-44 These plots illustrate the predicted dynamic response of CA retail gasoline prices to unanticipated shocks in four prices
CA Retail Gasoline WTI Crude LA Spot Gasoline Data source wwweiadoegovoil_gaspetroleuminfo_glancepetroleumhtml
the Brent spot price the WTI spot price the LA spot gasoline price and the CA retail gasoline price itself
We define each shock conditional on those before it in the production process For example a shock to the LA spot price of gasoline represents an unanticipated change in the wholesale price of gasoline after observing the Brent spot price and the WTI spot price but not the CA average retail price of
gasoline Thus we interpret shocks to the LA gasoline spot price as represhysenting shocks to the refining margin Each shock represents a one-time one-standard deviation unanticipated price increase We use weekly data with the spot prices recorded every Friday and the retail price measured from an EIA survey on the following Monday morning We plot the responses over a period of 26 weeks all series are in
Giannini Foundation of Agricultural Economics bull University of California 3
-4
Figure 4 Predicted Responses of CA Retail Gasoline Prices to Upstream Price Shocks
Figure 41 Shock to the Brent Spot Price 5
4
3
2
1
0
-1
-2
-3
-4
-5
0 2 4 6 8 10 12 14 16 18 20 22 24 26 -1
-2
-3
-4
-5
-1
-2
-3
-4
-5
0 2 4 6 8 10 12 14 16 18 20 22 24 26
0 2 4 6 8 10 12 14 16 18 20 22 24 26
Figure 42 Shock to the WTI Spot Price 5
4
3
2
1
0
Percent Response
Percent Response
Percent Response
Percent Response
Figure 43 Shock to the LA Gasoline Spot Price 5
4
3
2
1
0
Figure 44 Shock to the CA Retail Spot Price 5
4
3
2
1
0 0 2 4 6 8 10 12 14 16 18 20 22 24 26
-1
-2
-3
-4
-5 The dashed lines represent 95 confidence intervals for the impulse response estimates Based on weekly data spanning 1995-2007 Data Source httptonto eiadoegovpetpet_pri_topasp
natural logs and our sample runs from January 1 1995 to January 7 2008
A one-standard deviation shock to the Brent spot price is equivalent to a five percent hike of this price in one week and represents a shock to world crude oil prices After a five percent shock the Brent spot price tends to pull back somewhat and settle about three percent above its initial level In response Figure 41 shows that CA retail gasoline prices increase gradushyally over a seven-week period eventushyally increasing by about two percent This predicted two percent response to a three percent long-run increase in oil prices is consistent with the declinshying percentage retail margin revealed in Figure 3 The predicted response curve also suggests that gasoline prices may start to decline at around the 20-week mark but the large confidence interval around this prediction means that it is statistically insignificant
Figure 42 shows that California gasoline prices hardly react to WTI price shocks Because we define a WTI price shock conditional on a fixed Brent price this shock represents an unanticipated change in the WTI price without a change in world prices Such shocks have little effect on California gasoline prices for two reasons First they are short-lived disappearing within a few weeks as WTI and Brent prices come back together Second almost all of the West Coast crude oil supply comes from the Alaskan North Slope oil fields or from California
California retail prices also do not respond immediately to shocks to the LA spot price As shown in Figure 43 it takes about six weeks for these shocks to fully affect retail prices The initial one-standard deviation shock is about 66 percent and it disappears after about 12 weeks The retail price reaction peaks at about 25 percent before fading to zero after about 20 weeks Figure 44 shows that shocks to retail prices that are uncorrelated with upstream prices
are small (about one percent) but they tend to persist This persistence reflects the declining percentage retail margin over time Specifically when the pershycentage retail margin decreases it tends to stay at that lower level rather than reverting back to its previous level
Conclusion When the media report the latest crude oil price they refer to a futures price that closely matches the spot price in the town of Cushing Oklahoma Much of the short-term variation in this price reflects local crude oil supply condishytions near Cushing Such variation has little or no effect on California retail gasoline prices Nonetheless California gasoline prices exhibit much greater volatility than crude oil prices This volatility reflects supply inflexibility caused by Californiarsquos unique gasoline formulation regulations It illustrates the inefficiencies generated by the curshyrent system which allows states and counties to set their own fuel standards
Long-run changes in crude oil prices affect California retail gasoline prices gradually over a couple of months After this adjustment period the final percentage change in California gasoline prices is less than the corshyresponding oil price change because retail margins do not increase with oil prices Overall month-to-month variation in crude oil prices provides a much better signal of future Calishyfornia gasoline prices than day-to-day or week-to-week price movements
Joeri de Wit is a PhD student in the Department of Agricultural and Resource Economics at UC Davis He can be reached by e-mail at jfdewitprimalucdavisedu Aaron Smith is an associate professor in the ARE department at UC Davis He can be reached at asmithprimal ucdavisedu
Giannini Foundation of Agricultural Economics bull University of California 4