Embed Size (px)
Citation preview

What is the latest picture from migration statistics?
(or ‘seeing history through another lens’)
Jon SimmonsDeputy Director
(Migration and Border Analysis)Home Office Science
Presentation to COMPAS Breakfast briefing 21st September 2012

Net migration YE Dec 2002 = +153k
Peak in Asylum applications
Net migration YE Dec 2011 =
+216k
2004 EU Accession1997 Election1971 Immigration Act 1981 Nationality Act
Long-term Migration into and out of the UK 1964-2011

Seeing history through another lens

Net migration in the UK, 1922-2010
Source: House of Commons Library

Population change in the UK, 1922-2010
Source: House of Commons Library

Net Migration – the latest statistics• Estimated long-term immigration to the UK in the
year to December 2011 was 566,000 – broadly at a similar level since 2004
• Net migration was 216,000 in the year to December 2011, lower but not statistically significantly different from 252,000 in the year to December 2010
• Study remains the most common reason for migrating to the UK at an estimated 232,000 long-term migrants in year to December 2011, similar to the 238,000 in the previous year
• So, has nothing much changed?
Inflow -25k (-4%) ±28kNet Mig- 43k (-18%) ±35k
Lowest net figure since December 2009
Inflow YE Dec 2010

The migration of British citizens
British emigration up 13k YE Dec11
Source: ONS

The UK population
• 14% born abroad, but a large proportion of these are now British citizens
• 8% of the resident population are foreign nationals, of whom– 1.9% from old EU, 1.8% from EUA8, 4.4% from outside the EU– 23% of foreign nationals from old EU, 22% from EUA8 and 52% non-EU
• 4.8 million resident foreign nationals– 2.3m from the EU, 2.5m from outside the EU
• Top 3 nationalities: – Poles (687,000 or 14% of foreign nationals), Irish (351,000), and Indians (337,000 )

The Foreign Population in the UK Foreign nationals As % of all foreign Born abroad
Top 15 Nationalities (thousands) nationals (thousands)Poland 687 14% 643Republic of Ireland 351 7% 397India 337 7% 729Pakistan 172 4% 457
United States of America 139 3% 189Lithuania 134 3% 125France 132 3% 137Italy 122 3% 124Germany 119 2% 297China 109 2% 136Nigeria 105 2% 190Portugal 105 2% 84Romania 93 2% 94South Africa 83 2% 211Philippines 82 2% 137
Poles now the largest foreign national group resident in the UK EU citizens do not tend to change nationality
Source: ONS
EU citizen movements
Net migration of EU citizens rose 9% in YE Dec 11 to +71k; Largest contribution still from EUA8
Source: ONS

Is the Eurozone crisis having an impact?
EU15 one seventh of total LTIM inflow, up 12% in 2011; Sharpest rise was in those looking for work (see chart); But overall – EU15 work-related migration rose 25%, EUA8 fell 13%; Net migration of EUA8 (+36k) citizens is still higher than EU15 (+27k) *
* None of these differences are statistically significant
Source: ONS

Non-EU migration
55% of total LTIM inflow is non-EU; Six in ten non-EU LTIM immigrants are coming to study
Source: ONS

What do we mean when we talk about student migrants?
• Only half of non-EU students are in Universities (HO Research Dec 2010)
• More study as Post-Graduates (55%) than Undergraduates (45%)
• Around a half of student migrants come for more than a year, 80% of whom are from outside the EU
• Between 2005 and 2010 non-EEA student admissions UK rose by 80% (compared to a 3% rise for non-EEA visitors)
• Around one fifth arriving in 2004 were still in the UK five years later (Achato et al ‘The Migrant Journey’ 2010); and one fifth of those who returned home following recent enforcement action in London were former students (Op Mayapple).
• Student visitors are a separate category – dominated by American, Brazilian, Russian and Japanese nationals; For Student visas, China, India and Pakistan provide the largest numbers

Comparisons of trends in study migration
“Most recent data for the year ending June 2012 (213,836) show there has been a 30% decrease in the number of visas issued for study in comparison with the year ending June 2011”

Trends in student numbersMay 2012 total applicants by domicile (UK, other EU, non-EU)
By domicile 2011 2012 Diff (+/-) Diff (%)
UK 550,147 501,267 -48,880 -8.9%
Other EU 45,727 39,966 -5,761 -12.6%
Non EU 51,134 56,240 5,106 10.0%
Total 647,008 597,473 -49,535 -7.7%
UCAS undergraduate applications for this Autumn’s intake
UCAS statistics show non-EEA undergraduate applications to study continue to grow in 2012 – (applications from non-EU domiciled rose by 10% in 2012, whereas UK fell 9% and EU fell 13%)
Home Office visa statistics “Most recent data for the year ending June 2012 (213,836) show there has been a 30% decrease in the number of visas issued for study in comparison with the year ending June 2011 (304,507). Admissions of those for the purposes of study in 2011 (267,000) have also fallen by 10% compared to 2010 (296,000).”

Migration for work
One third of long-term inward migration is for work, but only true of one in six non-EU migrants now
Source: ONS

When the economy is growing, the net flow of work migrants is positive; when the economy slows down, the number of work migrants falls.
However, work-related migration is only one third of total LTIM inflow; and less than one sixth (16%) of the non-EU inflow.

Migration and the Census2011 Census contains new questions on country of birth, passport held, national identity, time in the country but data only available next year.
In the July 2012 “first release”• The population of England and Wales grew by 3.7 million to 56.1
million over10 years, an increase of 7.1 per cent. This was the largest percentage increase in any Census over the last 100 years.
• Births and deaths account for around 44% of the increase, with the remainder [56%] being due to migration.
• Local authorities with the largest growth were Tower Hamlets [26.4%] and Newham [23.5%]. Manchester was third largest growing [19.0%].
• There were also large increases in some less urban areas in the East Midlands and East of England, for example Peterborough16.6%, South Derbyshire 15.8%, Boston 15.8%, South Holland 15.1% and Uttlesford 15.1%.

The Census and the new migrants
• ONS found just under half a million extra persons in the England and Wales population than they had predicted from their recent estimates.
• ONS estimate that 45% of this differences was due to shortfalls in the 2001 Census, and 55% (267,000) due to underestimation of international migration.
• ONS conclude by saying that “the evidence does suggest that the IPS did not measure the full scale of EU10 immigration in the middle of the decade”.

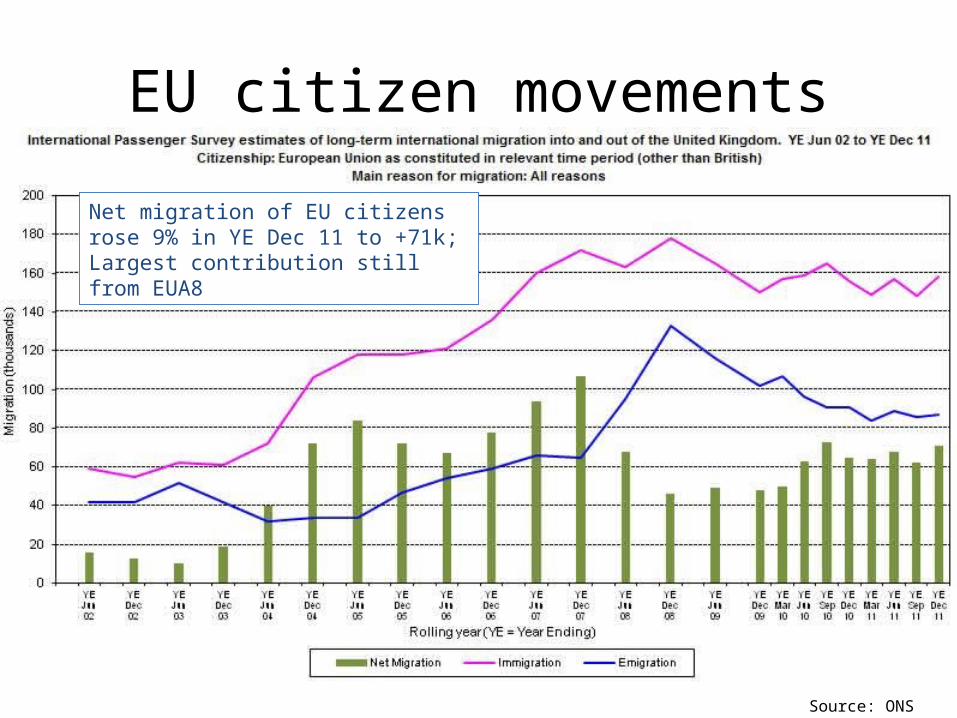
British Social Attitudes Survey
Source: British Social Attitudes Survey 29
British Social Attitudes Survey
Source: British Social Attitudes Survey 29

British Social Attitudes Survey
Source: British Social Attitudes Survey 29

Additional slides
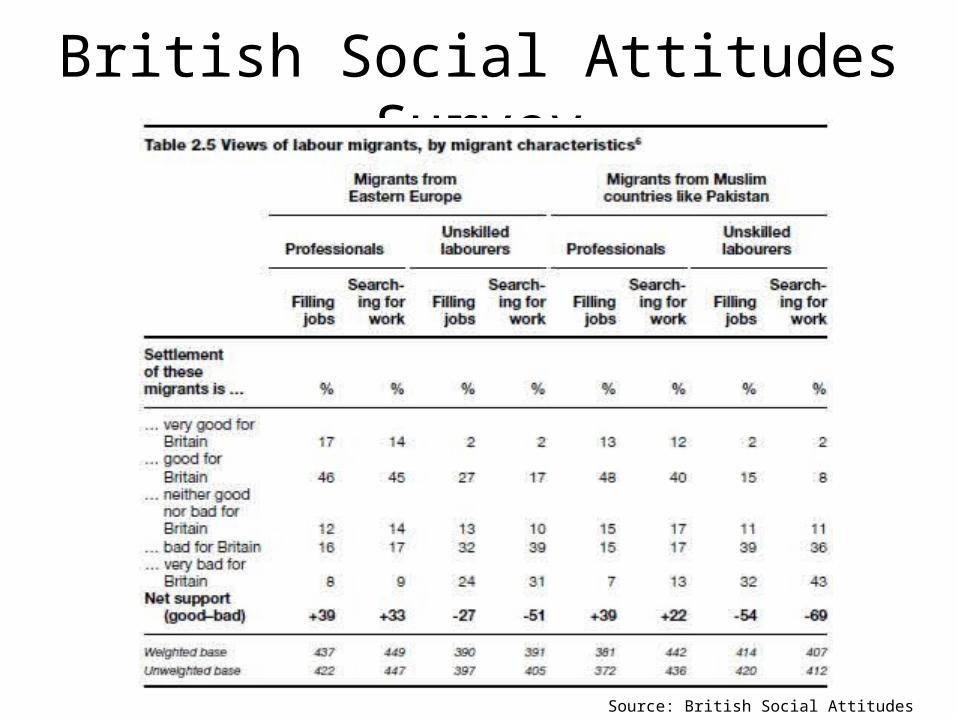
Asylum applications remain relatively lowLong term trends in asylum applications, 2001 -2011
In the year ending June 2012 there were 19,959 asylum applications in the UK, an increase of 6 per cent. Applications peaked in 2002 at over 84,000.
The proportion granted asylum or a form of temporary protection increased to 35% (from 28% the year before).

Removals and returnsLong-term trends in removals and voluntary departures by type, by quarter

Citizenship grants by previous country of nationality

Is there displacement from Student visas to student visitors?
Student Visitor numbers and Top 6 nationalities, 2011
Country of nationalityStudent visitors
Proportion of total
Cumulative total
*Total 262,000
United States 115,000 44% 44%
Brazil 19,300 7% 51%
Russia 17,200 7% 58%
Japan 15,800 6% 64%
China 11,500 4% 68%
Turkey 11,000 4% 72%
Students and dependants (excluding student visitors) and Top 6 nationalities, 2011
Country of nationality
Students and dependants
(excl student visitors)
Proportion of total
Cumulative total
*Total 267,000
China 49,000 18% 18%
India 34,200 13% 31%
Pakistan 34,000 13% 44%
United States 28,900 11% 55%
Nigeria 11,400 4% 59%
Saudi Arabia 9,000 3% 62%